
- Academic Editor
†These authors contributed equally.
Background: As a classical biomarker associated with
hypertension, the prognostic value of homocysteine (Hcy) in the intermediate-term
outcome of acute coronary syndrome (ACS) remains controversial. This study aimed
to investigate the role of homocysteine in ACS patients with different blood
pressure statuses. Methods: A total of 1288 ACS patients from 11 general
hospitals in Chengdu, China, from June 2015 to December 2019 were consecutively
included in this observational study. The primary endpoint was defined as
all-cause death. Secondary endpoints included cardiac death, nonfatal myocardial
infarction (MI), unplanned revascularization and nonfatal stroke. The patients in
the hypertension group (n = 788) were further stratified into
hyperhomocysteinemia (H-Hcy, n = 245) and normal homocysteinaemia subgroups
(N-Hcy, n = 543) around the cut-off value of 16.81 µmol/L.
Similarly, the nonhypertensive patients were stratified into H-Hcy (n = 200) and
N-Hcy subgroups (n = 300) around the optimal cut-off value of 14.00
µmol/L. The outcomes were compared between groups. Results:
The median follow-up duration was 18 months. During this period, 78 (6.05%)
deaths were recorded. Kaplan‒Meier curves illustrated that H-Hcy had a lower
survival probability than N-Hcy in both hypertension and nonhypertension
groups (p
Acute coronary syndrome (ACS) remains a serious type of coronary atherosclerotic disease (CAD) with high morbidity and mortality worldwide [1]. Despite receiving the optimum treatment recommended by modern guidelines, including early revascularization of lesions, dual antiplatelet treatment and intensive lipid-lowering therapy, some ACS patients are still at risk for recurrence of adverse cardiovascular events. Identifying high-risk ACS populations based on prognostic risk factors, including cardiometabolic factors, and providing them with optimal comprehensive treatment and nursing care is necessary to further improve their prognosis [2].
Homocysteine (Hcy), derived from methionine (Met) metabolism, along with uric acid, proinflammatory molecules (such as C-reactive protein), glucose metabolism, dyslipidemia, overweight or obesity and hypertension, has received attention as a newly emerging cardiometabolic risk factor for cardiovascular disease (CVD) [3] by promoting plaque formation and atherosclerosis, causing platelet aggregation and blood coagulation, altering lipid metabolism, and triggering inflammatory responses [4]. Previous studies have illustrated that elevated serum Hcy was associated with higher risks of cardiovascular events in ACS patients [5, 6, 7]. In contrast, a Mendelian randomization study indicated that there is no causal relationship between plasma Hcy and CVD or acute myocardial infarction (AMI) [8]. Thus, the conflicting findings from current studies render the relationship between Hcy and the outcome of ACS controversial.
In addition, an elevated Hcy level is strongly associated with the occurrence and progression of hypertension by inhibiting endogenous hydrogen sulfide generation and activating angiotensin-converting enzymes [9, 10]. Previous studies have reported that hypertension and hyperhomocysteinemia have a significant synergistic effect on the prognosis of CVD [11, 12]. Hcy could have a different influence on prognosis in ACS patients with or without hypertension. However, most studies currently adopt the definite Hcy classification criteria for all ACS patients to guide risk stratification, regardless of their blood pressure status, which might misestimate their actual risk. Therefore, our study intended to adopt different cut-off values determined by receiver operating characteristic (ROC) curve analysis in hypertensive and nonhypertensive patients with ACS to explore the prognostic significance of Hcy in the intermediate-term outcomes of patients with different blood pressure statuses.
A total of 1288 ACS patients from 11 general hospitals in Chengdu from June 2015
to December 2019 were consecutively included in this observational study. The
diagnosis of ACS, including ST-elevation myocardial infarction (STEMI),
non-ST-elevation myocardial infarction (NSTEMI), and unstable angina pectoris
(UA), was guided by the corresponding guidelines [13, 14]. The exclusion criteria
were as follows: (1) age younger than 18 years; (2) incomplete baseline data; (3)
loss to follow-up; (4) uncompensated chronic renal dysfunction with creatinine
clearance (CrCl)
The demographic, clinical, biochemical, and angiographic data and discharge
medications were gathered by trained professionals from the hospital medical
records system. Patients were classified into two groups based on their discharge
diagnosis: hypertension and nonhypertension. To further increase the prognostic
importance of the study, the optimum cut-off value for plasma Hcy concentration
to measure intermediate-term mortality was evaluated by ROC curve analysis. According to the optimum cut-off value of
each group, hypertensive patients were further subdivided into
hyperhomocysteinemia (H-Hcy) (n = 245) and normal homocysteinemia (N-Hcy)
groups (n = 543) (the area under the ROC curve (AUC) was 0.639, the sensitivity
was 58.8%, the specificity was 71.0%, and the optimal cut-off value was 16.81
µmol/L, p
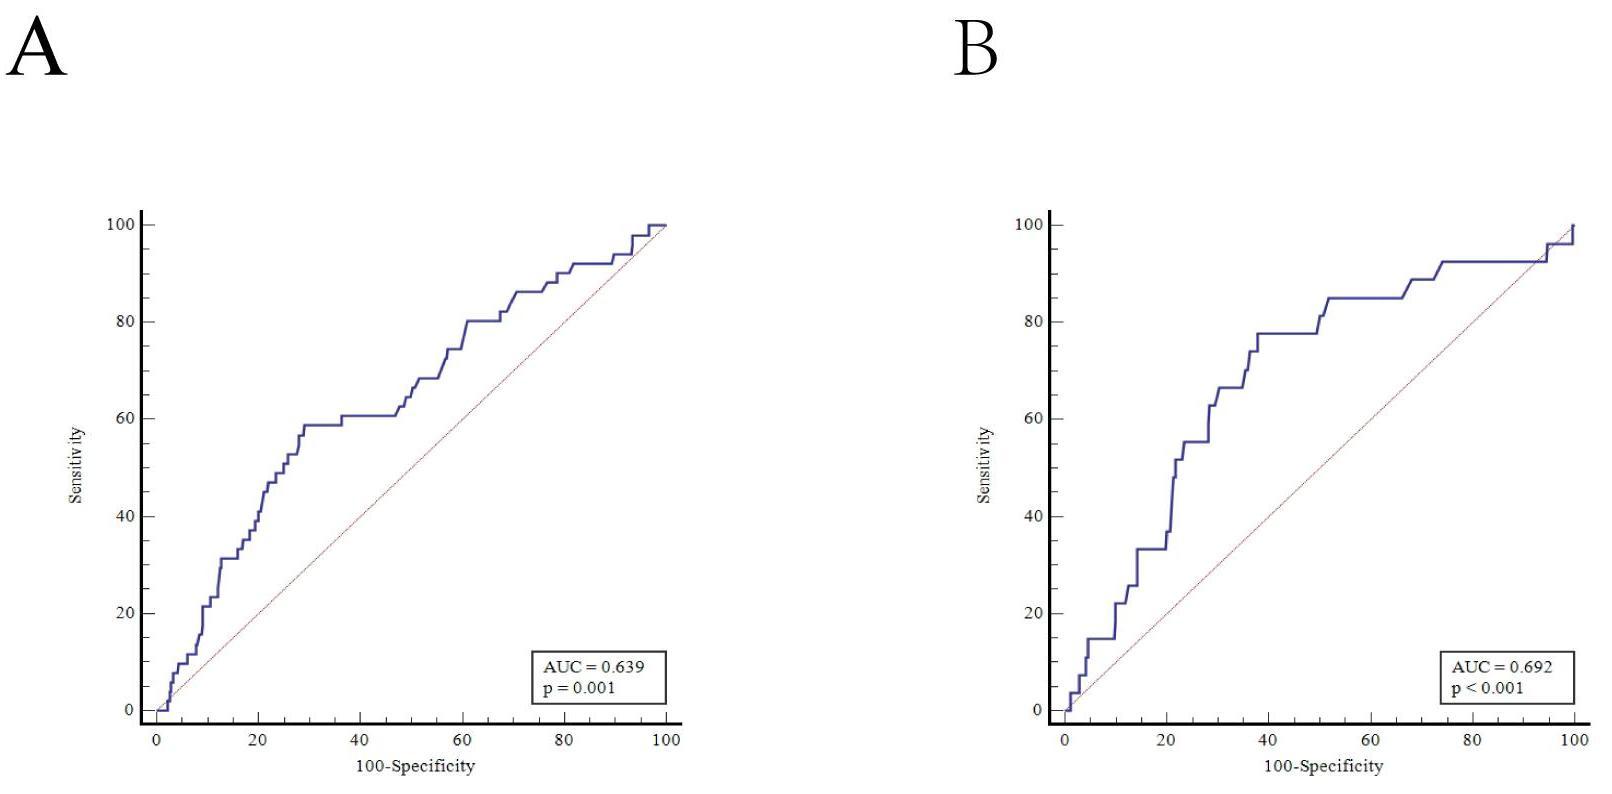 Fig. 1.
ROC curve analysis determined the optimum cut-off value of plasma homocysteine concentration to measure intermediate-term mortality. (A) ROC curve analysis in hypertension. (B) ROC curve analysis in nonhypertension. AUC, area under the ROC curve; ROC, receiver operating characteristic.
The study was registered in the Chinese Clinical Trials Registry in China (ChiCTR1900025138). We affirm that our protocol was conducted in compliance with the Declaration of Helsinki and approved by the local ethics committee. Due to its retrospective nature, the committee waived the requirement for formal informed consent.
After discharge, regular follow-up was performed by a professional cardiologist at 1, 3, 6, and 12 months and then annually thereafter. Prognostic information was obtained by consulting electronic medical records or telephone inquiries. We discontinued follow-up when death was recorded. The primary endpoint was defined as all-cause death. The secondary endpoints included cardiac death, nonfatal myocardial infarction (MI), unplanned revascularization, and nonfatal stroke.
Hypertension was defined as a systolic blood pressure (SBP)
Cardiac death meant death driven by MI, heart failure (HF) and/or arrhythmia and included sudden death without a definite cause [18]. Unplanned revascularization meant the recurrent revascularization of any lesion by percutaneous coronary intervention (PCI) or coronary artery bypass grafting (CABG) [19]. Stroke was defined as ischaemic or hemorrhagic stroke during the follow-up period as confirmed by imaging and diagnosed by professional neurologists.
Continuous data are expressed as the mean
This analysis included 1288 ACS patients (595 UA, 396 STEMI, and 297 NSTEMI),
including 788 hypertensive patients (61.2%) and 500 nonhypertensive patients
(38.8%), with an average age of 66.58
| Variable | Total population | Hypertension (n = 788) | Non-hypertension (n = 500) | p | |
| Age, years | 66.58 |
68.75 |
63.17 |
||
| Female, n (%) | 358 (27.8) | 267 (33.9) | 91 (19.2) | ||
| Smoking, n (%) | 492 (38.2) | 254 (32.2) | 238 (47.6) | ||
| Previous PCI, n (%) | 112 (8.7) | 71 (9.0) | 41 (8.2) | 0.615 | |
| Previous stroke, n (%) | 72 (5.6) | 59 (7.5) | 13 (2.6) | ||
| Diabetes mellitus, n (%) | 406 (31.5) | 290 (36.8) | 116 (23.2) | ||
| SBP, mmHg | 132.78 |
138.13 |
124.42 |
||
| HR, bpm | 77.72 |
76.92 |
78.97 |
0.024 | |
| cTnT, pg/mL | 24.65 (9.88, 434.33) | 22.17 (10.34, 289.00) | 33.96 (8.47, 1042.5) | 0.109 | |
| BNP, pg/mL | 135.80 (66.95, 429.18) | 131.75 (67.13, 429.18) | 139.35 (62.25, 429.18) | 0.857 | |
| Creatinin, µmol/L | 77.05 (65.03, 92.40) | 79.85 (65.80, 96.00) | 73.95 (64.50, 87.93) | ||
| Uric acid, µmol/L | 378.44 |
387.00 |
364.94 |
0.001 | |
| FBG, mmol/L | 7.31 |
7.42 |
7.15 |
0.202 | |
| Triglyceride, mmol/L | 1.40 (1.02, 2.13) | 1.44 (1.03, 2.18) | 1.37 (1.00, 1.98) | 0.132 | |
| Total cholesterol, mmol/L | 4.37 (3.62, 5.18) | 4.31 (3.58, 5.20) | 4.40 (3.43, 5.15) | 0.617 | |
| LDL-C, mmol/L | 2.64 (2.09, 3.28) | 2.59 (2.05, 3.28) | 2.71 (2.19, 3.28) | 0.064 | |
| HDL-C, mmol/L | 1.12 (0.95, 1.34) | 1.14 (0.96, 1.35) | 1.11 (0.94, 1.33) | 0.532 | |
| Lp (a), mg/L | 153.20 (66.23, 276.15) | 138.8 (65.7, 267.88) | 173.5 (69.63, 308.43) | 0.148 | |
| Hcy, µmol/L | 13.40 (10.70, 17.59) | 13.83 (11.04, 18.44) | 12.85 (10.40, 16.50) | 0.001 | |
| H-Hcy, n (%) | 445 (34.5) | 245 (31.1) | 200 (40.0) | 0.001 | |
| Multivessel disease, n (%) | 732 (56.8) | 469 (59.5) | 263 (52.6) | 0.015 | |
| Calcified lesions, n (%) | 138 (10.7) | 106 (13.5) | 32 (6.4) | ||
| Thrombosis, n (%) | 49 (3.8) | 22 (2.8) | 27 (5.4) | 0.017 | |
| LVEF | 55.18 |
55.25 |
55.05 |
0.715 | |
| LVEF |
95 (7.5) | 60 (7.6) | 36 (7.2) | 0.783 | |
| Premature ACS (%) | 291 (22.6) | 144 (18.3) | 147 (29.4) | ||
| AMI, n (%) | 693 (53.8) | 389 (49.4) | 304 (60.8) | ||
| Diagnosis, n (%) | |||||
| UA | 595 (46.2) | 399 (50.6) | 196 (39.2) | ||
| NSTEMI | 297 (23.1) | 185 (23.5) | 112 (22.4) | ||
| STEMI | 396 (30.7) | 204 (25.9) | 192 (38.4) | ||
| PCI, n (%) | 1102 (85.6) | 674 (85.5) | 428 (85.6) | 0.973 | |
| Discharge medications | |||||
| Aspirin, n (%) | 1224 (95.0) | 756 (95.9) | 468 (93.6) | 0.060 | |
| P2Y12 receptor inhibitor, n (%) | 1265 (98.2) | 778 (98.7) | 487 (97.4) | 0.079 | |
| Statins, n (%) | 1231 (95.6) | 750 (95.2) | 481 (96.2) | 0.385 | |
| 893 (69.3) | 547 (69.4) | 346 (69.2) | 0.935 | ||
| ACEI/ARB, n (%) | 584 (45.3) | 458 (58.1) | 126 (25.2) | ||
| Diuretics, n (%) | 225 (17.5) | 162 (20.6) | 63 (12.6) | ||
Note: 1 mmHg = 0.133 kPa.
Abbreviations: cTnT, troponin T; BNP, B-type natriuretic peptide; UA, unstable angina; LDL-C, low-density lipoprotein; HDL-C, high-density lipoprotein; FBG, fasting blood glucose; Hcy, homocysteine; H-Hcy, hyperhomocysteinemia; LVEF, left ventricular ejection fraction; ACEI/ARB, angiotensin-converting enzyme inhibitor/angiotensin receptor blocker; PCI, percutaneous coronary intervention; SBP, systolic blood pressure; AMI, acute myocardial infarction; NSTEMI, non-ST-elevation myocardial infarction; STEMI, ST-elevation myocardial infarction; HR, heart rate; Lp (a), lipoprotein (a).
Table 2 summarizes the baseline demographic, clinical, biochemical, and
angiographic data of hypertension and nonhypertension groups when stratified by
the cut-off value for plasma Hcy. H-Hcy subjects were older and had higher levels
of serum B-type natriuretic peptide (BNP), creatinine, and uric acid and lower left ventricular ejection fraction (LVEF) in both hypertension
and nonhypertension groups (p
| Variable | Hypertension (n = 788) | Non-hypertension (n = 500) | |||||
| H-Hcy (n = 245) | N-Hcy (n = 543) | p | H-Hcy (n = 200) | N-Hcy (n = 300) | p | ||
| Age, years | 70.82 |
67.82 |
65.52 |
61.6 |
|||
| Female, n (%) | 55 (22.4) | 212 (39.0) | 31 (15.5) | 60 (20.0) | 0.20 | ||
| Smoking, n (%) | 78 (31.8) | 176 (32.4) | 0.873 | 92 (46) | 146 (48.7) | 0.56 | |
| previous PCI, n (%) | 24 (9.8) | 47 (8.7) | 0.605 | 19 (9.5) | 22 (7.3) | 0.387 | |
| Previous stroke, n (%) | 29 (11.8) | 30 (5.5) | 10 (5) | 3 (1) | |||
| Diabetes mellitus, n (%) | 92 (37.6) | 198 (36.5) | 0.77 | 35 (17.5) | 81 (27) | 0.014 | |
| SBP, mmHg | 134.35 |
139.72 |
0.003 | 125.76 |
123.61 |
0.208 | |
| HR, bpm | 74.87 |
77.84 |
0.011 | 80.34 |
78.06 |
0.143 | |
| cTnT, pg/mL | 28.13 (13.62, 285.90) | 19.71 (8.77, 290.00) | 0.013 | 37.94 (8.43, 1231.00) | 33.96 (8.47, 730.70) | 0.876 | |
| BNP, pg/mL | 175.2 (78, 577.1) | 120.4 (59.2, 378.5) | 170.85 (68, 435.49) | 130.9 (59.25, 365.45) | 0.028 | ||
| Creatinin, µmol/L | 96 (80.15, 126.5) | 74.7 (62.9, 87.6) | 79.95 (68.27, 95.5) | 70.9 (62.37, 81.47) | |||
| Uric acid, µmol/L | 441.93 |
362.22 |
397.24 |
343.41 |
|||
| FBG, mmol/L | 7.21 |
7.36 |
0.602 | 7.34 |
7.31 |
0.919 | |
| Triglyceride, mmol/L | 1.41 (1.01, 2.13) | 1.45 (1.04, 2.2) | 0.358 | 1.33 (0.97, 1.99) | 1.38 (1, 1.97) | 0.873 | |
| Total cholesterol, mmol/L | 4.3 (3.51, 5.11) | 4.32 (3.6, 5.23) | 0.323 | 4.29 (3.51, 4.99) | 4.47 (3.84, 5.2) | 0.027 | |
| LDL-C, mmol/L | 2.44 (1.94, 3.08) | 2.63 (2.06, 3.34) | 0.014 | 2.65 (2.1, 3.25) | 2.76 (2.24, 3.34) | 0.14 | |
| HDL-C, mmol/L | 1.09 (0.9, 1.31) | 1.14 (0.97, 1.37) | 1.11 (0.94, 1.35) | 1.1 (0.94, 1.32) | 0.543 | ||
| Lp (a), mg/L | 133 (60.1, 265.52) | 144 (67.9, 273.3) | 0.405 | 189.6 (76.9, 266.55) | 163.35 (65.77, 327.75) | 0.644 | |
| Multivessel disease, n (%) | 150 (61.2) | 319 (58.7) | 0.512 | 110 (55) | 153 (51) | 0.38 | |
| Calcified lesions, n (%) | 36 (14.7) | 70 (12.9) | 0.492 | 19 (9.5) | 13 (4.3) | 0.021 | |
| Thrombosis, n (%) | 7 (2.9) | 15 (2.8) | 0.940 | 9 (4.5) | 18 (6.0) | 0.467 | |
| LVEF | 53.44 |
56.06 |
53.45 |
56.12 |
|||
| LVEF |
28 (11.4) | 32 (5.9) | 17 (8.5) | 19 (6.3) | 0.359 | ||
| Premature ACS (%) | 29 (11.8) | 115 (21.2) | 49 (24.5) | 98 (32.7) | 0.05 | ||
| AMI, n (%) | 133 (54.3) | 256 (47.1) | 0.064 | 125 (62.5) | 179 (59.7) | 0.525 | |
| PCI, n (%) | 205 (83.7) | 469 (86.4) | 0.319 | 166 (83.0) | 262 (87.3) | 0.176 | |
| Diagnosis, n (%) | 0.104 | 0.516 | |||||
| UA | 112 (45.7) | 287 (52.9) | 75 (37.5) | 121 (40.3) | |||
| NSTEMI | 68 (27.8) | 117 (21.5) | 50 (25.0) | 62 (20.7) | |||
| STEMI | 65 (26.5) | 139 (25.6) | 75 (37.5) | 117 (39) | |||
| Discharge medications | |||||||
| Aspirin, n (%) | 236 (96.3) | 520 (95.8) | 0.711 | 183 (91.5) | 285 (95.0) | 0.117 | |
| P |
242 (98.8) | 53.6 (98.7) | 0.940 | 193 (96.5) | 294 (98.0) | 0.302 | |
| Statins, n (%) | 237 (96.7) | 513 (94.5) | 0.171 | 191 (95.5) | 290 (96.7) | 0.504 | |
| 159 (64.9) | 388 (71.5) | 0.064 | 134 (67.0) | 212 (70.7) | 0.384 | ||
| ACEI/ARB, n (%) | 133 (54.3) | 325 (59.9) | 0.143 | 62 (31.0) | 64 (21.3) | 0.015 | |
| Diuretics, n (%) | 65 (26.5) | 97 (17.9) | 0.005 | 34 (17.0) | 29 (9.7) | 0.015 | |
Note: 1 mmHg = 0.133 kPa. Abbreviations: cTnT, troponin T; BNP, B-type natriuretic peptide; UA, unstable angina; HR, heart rate; LDL-C, low-density lipoprotein cholesterol; HDL-C, high-density lipoprotein cholesterol; N-Hcy, normal homocysteinemia; FBG, fasting blood glucose; Hcy, homocysteine; H-Hcy, hyperhomocysteinemia; LVEF, left ventricular ejection fraction; ACEI/ARB, angiotensin converting enzyme inhibitor/angiotensin II receptor blocker; SBP, systolic blood pressure; AMI, acute myocardial infarction; PCI, percutaneous coronary intervention; STEMI, ST-elevation myocardial infarction; NSTEMI, non-ST-elevation myocardial infarction; Lp (a), lipoprotein (a).
The median follow-up duration was 18 (range: 13.83–22.37) months, and 78
(6.05%), 59 (4.58%), 34 (2.64%), 104 (8.07%), and 10 (0.77%) cases of
all-cause death, cardiac death, nonfatal MI, revascularization, and nonfatal
stroke were recorded, respectively. The number of all-cause mortality and cardiac
death events was higher in the H-Hcy subgroup than in the N-Hcy subgroup of both
hypertensive and nonhypertensive patients (p
| Hypertension (n = 788) | Non-hypertension (n = 500) | |||||
| H-Hcy (n = 245) | N-Hcy (n = 543) | p | H-Hcy (n = 200) | N-Hcy (n = 300) | p | |
| All-cause death, n (%) | 30 (12.2) | 21 (3.9) | 21 (10.5) | 6 (2.0) | ||
| Cardiac death, n (%) | 23 (9.4) | 17 (3.1) | 16 (8.0) | 3 (1.0) | ||
| Non-fatal MI, n (%) | 8 (3.3) | 12 (2.2) | 0.383 | 7 (3.5) | 7 (2.3) | 0.439 |
| Unplanned revascularization, n (%) | 22 (9.0) | 43 (7.9) | 0.616 | 13 (6.5) | 26 (8.7) | 0.376 |
| Non-fatal stroke, n (%) | 3 (1.2) | 4 (0.7) | 0.791 | 1 (0.5) | 2 (0.7) | |
N-Hcy, normal homocysteinemia; H-Hcy, hyperhomocysteinemia; MI, myocardial infarction.
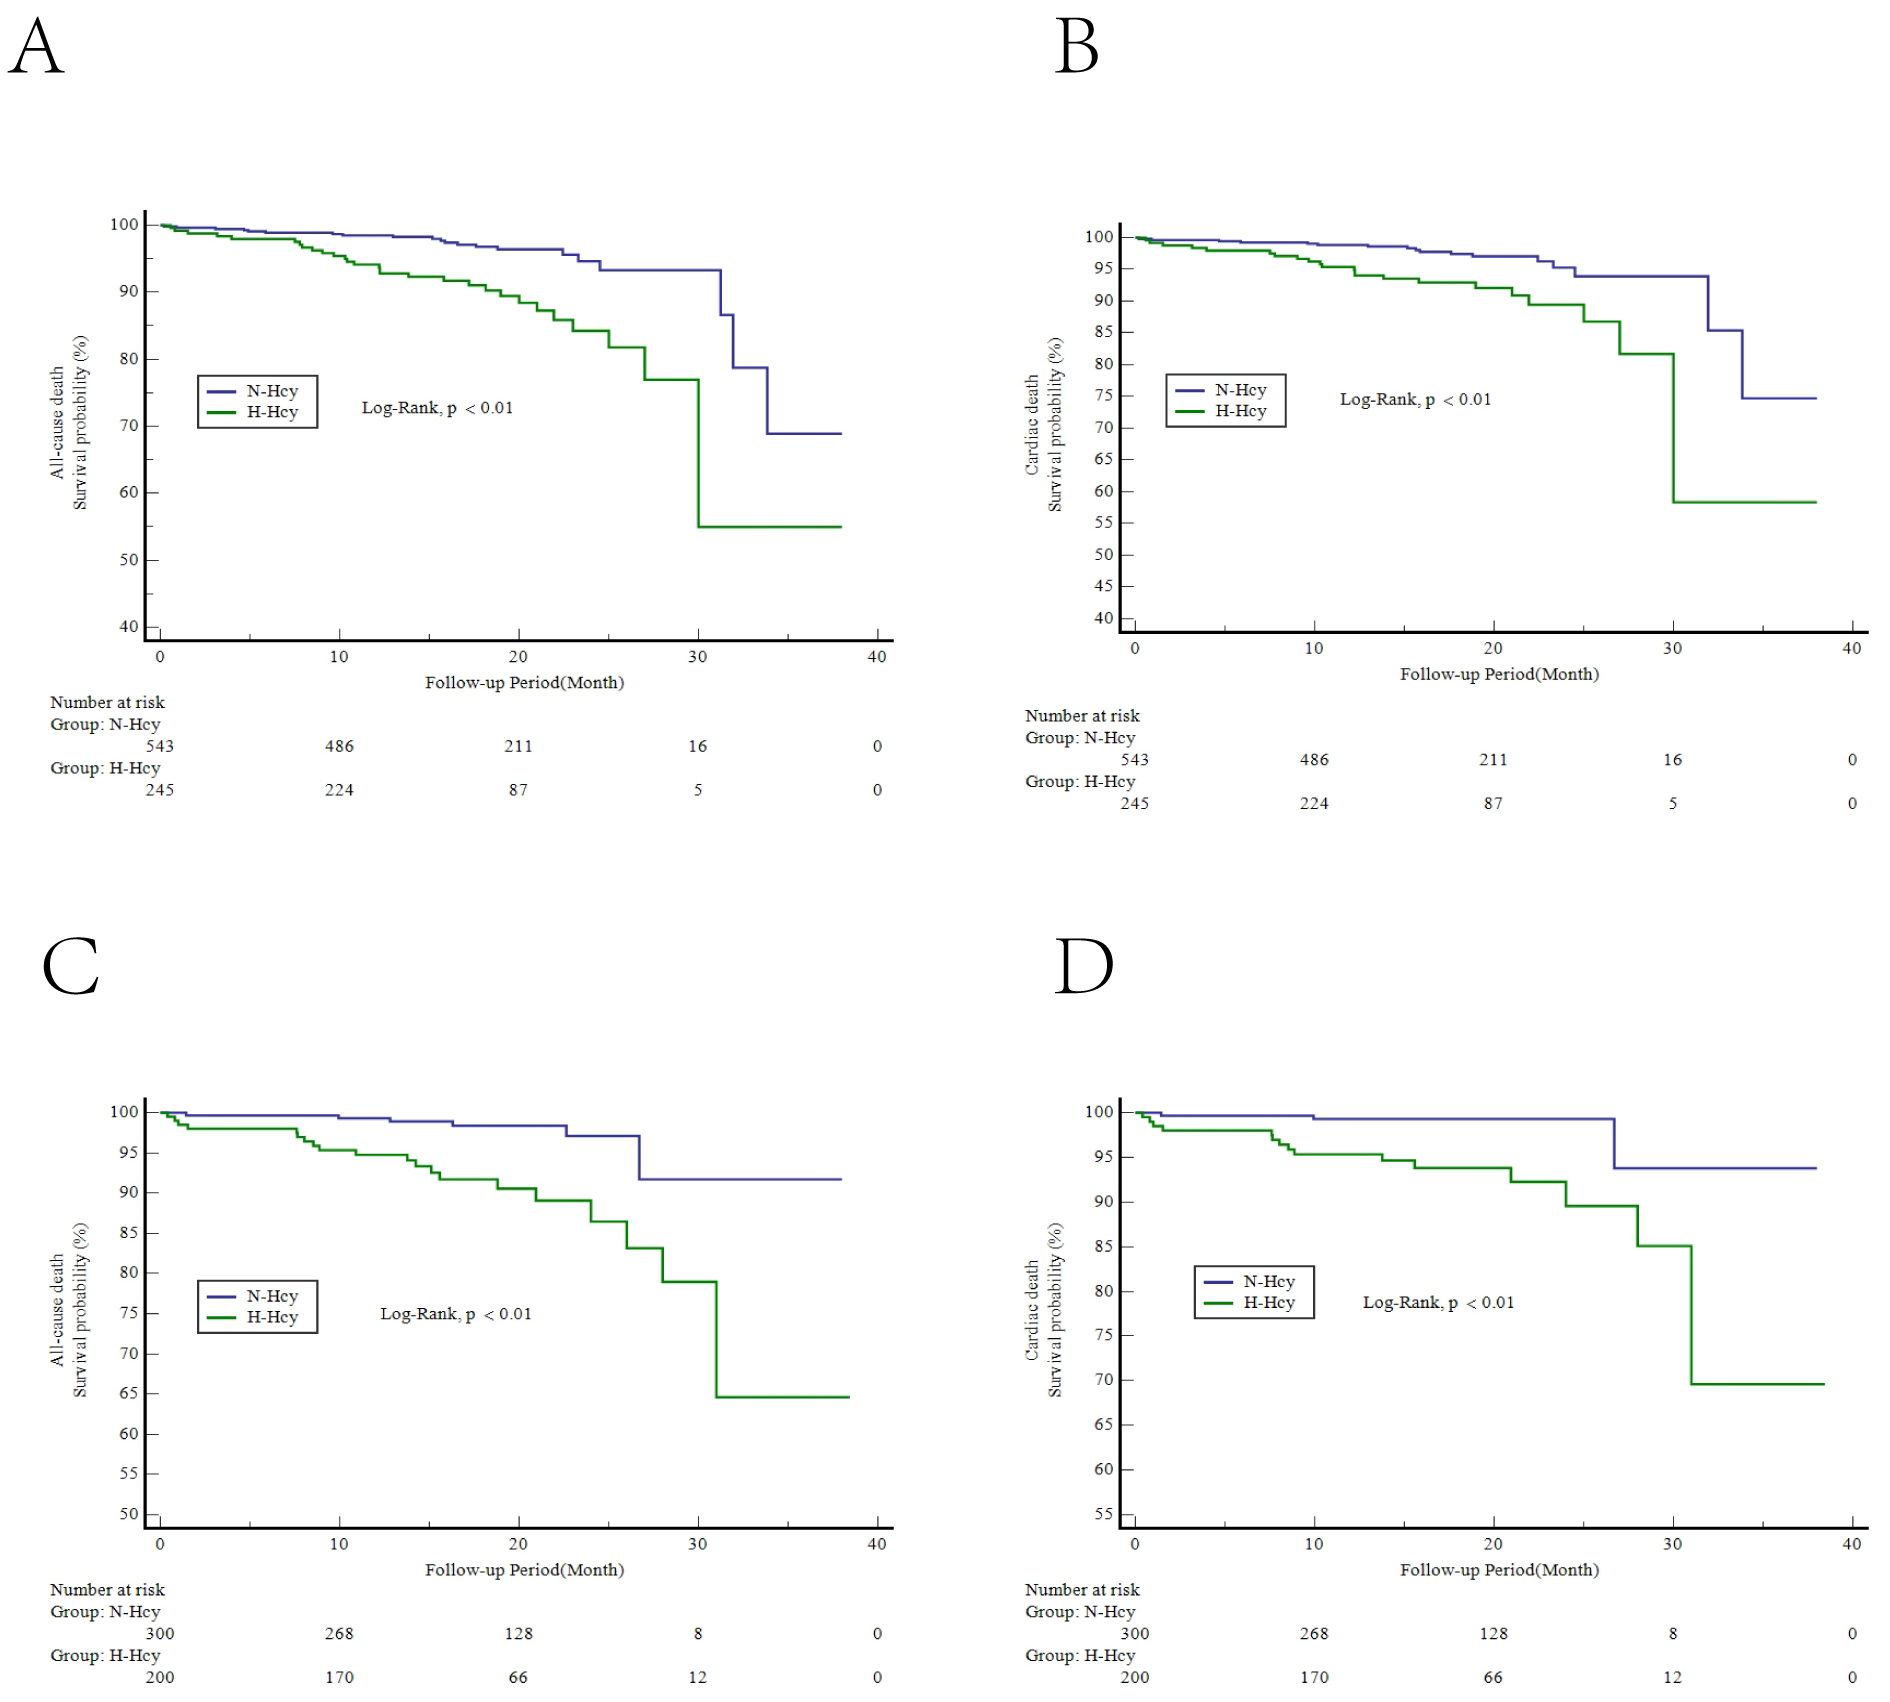 Fig. 2.
Kaplan-Meier curves of intermediate-term clinical outcomes. Kaplan-Meier curves for the survival probability of all-cause death (A) and cardiac death (B) in the hypertension group and all-cause death (C) and cardiac death (D) in the nonhypertension group. H-Hcy, hyperhomocysteinemia; N-Hcy, normal homocysteinemia.
The univariate analysis results are presented in Supplementary Table 1.
In the nonhypertension group, H-Hcy, age, creatinine, LVEF
 Fig. 3.
Forest plot of all-cause death in the nonhypertension group. CI, confidence interval; LVEF, left ventricular ejection fraction; PCI, percutaneous coronary intervention; H-Hcy, hyperhomocysteinemia; HR, hazard radio.
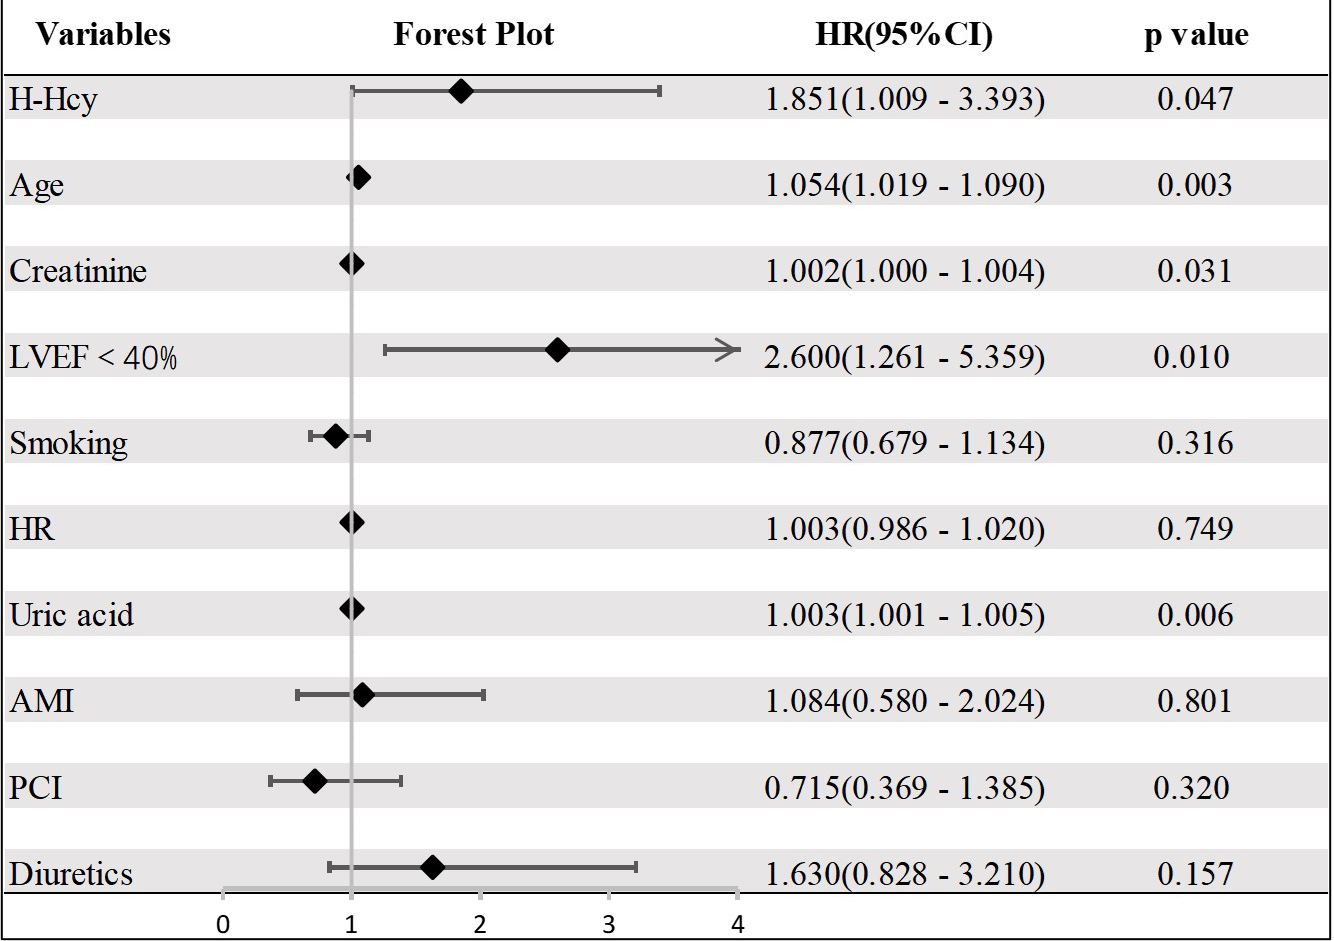 Fig. 4.
Forest plot of all-cause death in the hypertension group. CI, confidence interval; LVEF, left ventricular ejection fraction; PCI, percutaneous coronary intervention; H-Hcy, hyperhomocysteinemia; AMI, acute myocardial infarction; HR, heart rate.
The results of this study revealed that (1) H-Hcy patients had higher all-cause mortality and cardiac death events than those with normal Hcy in ACS, regardless of the status of blood pressure; (2) elevated serum Hcy concentration was an independent predictor of intermediate-term all-cause mortality in ACS patients with or without hypertension; and (3) ACS patients with or without hypertension could have different thresholds of serum Hcy for predicting intermediate-term mortality, which might be conducive to optimizing the risk stratification of ACS in clinical practice.
Serum Hcy, as a classic biomarker, has been reported to be an independent risk
factor for cardio-cerebrovascular diseases [3, 7, 20, 21] and is associated with
plaque formation and atherosclerosis progression [4, 22] by damaging vascular
endothelial cells, altering lipid metabolism, and triggering inflammatory
responses. In addition, it can participate in acute coronary events by disrupting
the balance between blood coagulation and fibrinolysis, leading to platelet
aggregation and blood coagulation [23]. Thus, Hcy has been regarded as a
prognostic factor for CAD. Li S et al. [24] found that H-Hcy (HR =
1.075, 95% CI: 1.032–1.120, p
Genetic background, eating habits, and living habits all affect the serum level of Hcy [25]. The mean Hcy levels vary between different regions or races. The threshold for H-Hcy has been inconsistent among various studies [24, 26]. Therefore, using definite cut-off values of Hcy concentrations defined by guidelines or previous classical studies to guide risk stratification might misestimate the actual risk in a given patient. In addition, because Hcy and hypertension have a synergistic effect on the prognosis of cardiovascular disease [11], Hcy could have different effects on the prognosis of ACS patients with different blood pressure statuses. Based on this fact, we divided ACS patients into hypertension and nonhypertension groups and used ROC curve analysis to determine the optimum critical value of Hcy for predicting intermediate-term mortality in ACS patients with hypertension and the critical value in those without hypertension. The two groups were then subdivided into two subgroups based on their respective optimum cut-off values: an H-Hcy subgroup and a normal Hcy subgroup. We think the research method we adopted in this study may be more reasonable than those used in other studies. The results ultimately showed that the cut-off value of Hcy for predicting intermediate-term mortality was 16.81 µmol/L in patients with hypertension and 14.0 µmol/L in patients without hypertension, which could be conducive to individualized risk stratification of ACS patients.
Kaplan‒Meier curves demonstrated that H-Hcy was associated with intermediate-term mortality, including all-cause mortality and cardiac death, during the 18-month median follow-up in the two groups, consistent with previous studies [5, 7]. After adjusting for other risk factors, multivariate Cox regression revealed that H-Hcy was strongly associated with intermediate-term mortality in both hypertensive and nonhypertensive patients. We speculate that this outcome could have the following explanations. The patients in the H-Hcy group were older and had higher levels of serum BNP, creatinine, and uric acid and a lower ejection fraction. Some of the above factors are part of the GRACE score, which is an established tool that well predicts the prognosis of ACS patients [27, 28]. Calim A et al. [6] recently reported a significant positive correlation between Hcy and GRACE risk score in ACS patients. Homocysteine, together with uric acid, proinflammatory molecules (represented by C-reactive protein), glucose metabolism, dyslipidemia, overweight or obesity and hypertension, are emerging cardiometabolic risk factors that could aggravate poor prognosis by resulting in systemic inflammation, oxidative stress, and ultimately the progression of atherosclerosis and CVDs [3, 29]. Although controversies exist [8], Hcy has received attention as an independent prognostic factor for CVDs.
Consistent with classical theory [30], we also found that the proportion of complicated strokes was higher in the H-Hcy group than in the N-Hcy group. A study conducted in six centers in China revealed that the risk of stroke in a high-Hcy population increased by 87% [31]. However, the study that we conducted failed to establish a link between Hcy and nonfatal stroke during the follow-up. This outcome could be due to the small sample size, short follow-up time, and few endpoints observed in this study. In addition, previous studies have shown that the use of folate can reduce the risk of stroke but not the risk of heart attack [32, 33, 34]. Patients with hyperhomocysteinemia can receive folic acid treatment early, so an increased risk of stroke in patients with hyperhomocysteinemia was not observed in this study.
Our investigation has several limitations. First, this study only explored the relationship between Hcy levels and the intermediate-term prognosis of ACS. Whether homocysteine-lowering therapy could improve the prognosis of ACS was not evaluated because critical data were not available in some centers. Second, there was inevitable bias due to the retrospective nature of this study with its relatively small sample size and relatively short follow-up duration. Third, there are differences in the ability of different hospitals to comprehensively manage and treat ACS patients, which might have influenced the observed results. Additionally, there could be discrepancies in the Hcy detection ability in different hospitals.
This paper suggests that elevated serum Hcy level is independently associated with all-cause mortality in ACS patients regardless of hypertension. For these patients, Hcy levels should be monitored during in-hospital stays and follow-up to help with risk stratification and management decisions, and positive and individualized interventions should be performed if necessary.
The datasets used or analyzed during the current study are available from the corresponding author on reasonable request.
QC, SX, and XD drafted the manuscript, and were major contributors in the collection, analysis and interpretation of data. XY, CC, HS, YLuo, YLong, and ZZ were major contributors in the acquisition and interpretation of data and contributed to revision of the manuscript. HL designed the study and provided constructive suggestions for revision of the manuscript. TX and LC designed the study, and finally approved the manuscript submitted. All authors read and approved the final manuscript. All authors have participated sufficiently in the work and agreed to be accountable for all aspects of the work.
The study was registered in the Chinese Clinical Trials Registry in China (ChiCTR1900025138). The study was approved by Ethics Committee of Chengdu Third People’s Hospital ([2019] S-67). Due to the study’s retrospective nature, the Committee waived the requirement for formal informed consent. We stated that our protocol was performed in accordance with the relevant guidelines and the Declaration of Helsinki.
We gratefully acknowledge the support of the Science and Technology Department of Sichuan, China.
This research was supported by the Science and Technology Department of Sichuan, China (grant number 2021YJ0215), the National Natural Science Foundation of China (31600942), and Chengdu High-level Key Clinical Specialty Construction Project.
The authors declare no conflict of interest.
Publisher’s Note: IMR Press stays neutral with regard to jurisdictional claims in published maps and institutional affiliations.