
- Academic Editor
†These authors contributed equally.
Background: The aim of this study was to evaluate the reservoir,
conduit, and contraction function of the left atrium and to evaluate the
predictive value of left atrial strain (LAS) on exercise tolerance in
hypertrophic cardiomyopathy (HCM) patients with an E/e’ between 8 and 14 by
two-dimensional speckle tracking using treadmill stress
echocardiography. Methods: This was a retrospective study in which we
analyzed a total of 70 patients with HCM between 2016 and 2017. According to the
resting state E/e’, patients were either assigned to an HCM-1 group (E/e’
Hypertrophic cardiomyopathy (HCM) is a hereditary form of cardiomyopathy.
Patients with HCM often have a range of clinical symptoms, including
palpitations, dyspnea, and reduced exercise tolerance. An abnormal left ventricular (LV) diastolic
function is an early pathophysiological change and an important cause of HCM
progression. At present, echocardiography is the preferred non-invasive imaging
method for the evaluation of LV diastolic function; the core indicator is E/e’.
The American Society of Echocardiography/European Society 2016 Guidelines for
Cardiovascular Imaging recommended an E/e’
This was a retrospective analysis of a total of 70 HCM patients who underwent
treadmill exercise stress ultrasound evaluation in Sichuan Provincial People’s
Hospital from 2016 to 2017 and included 45 males and 25 females, with a mean age
of 47
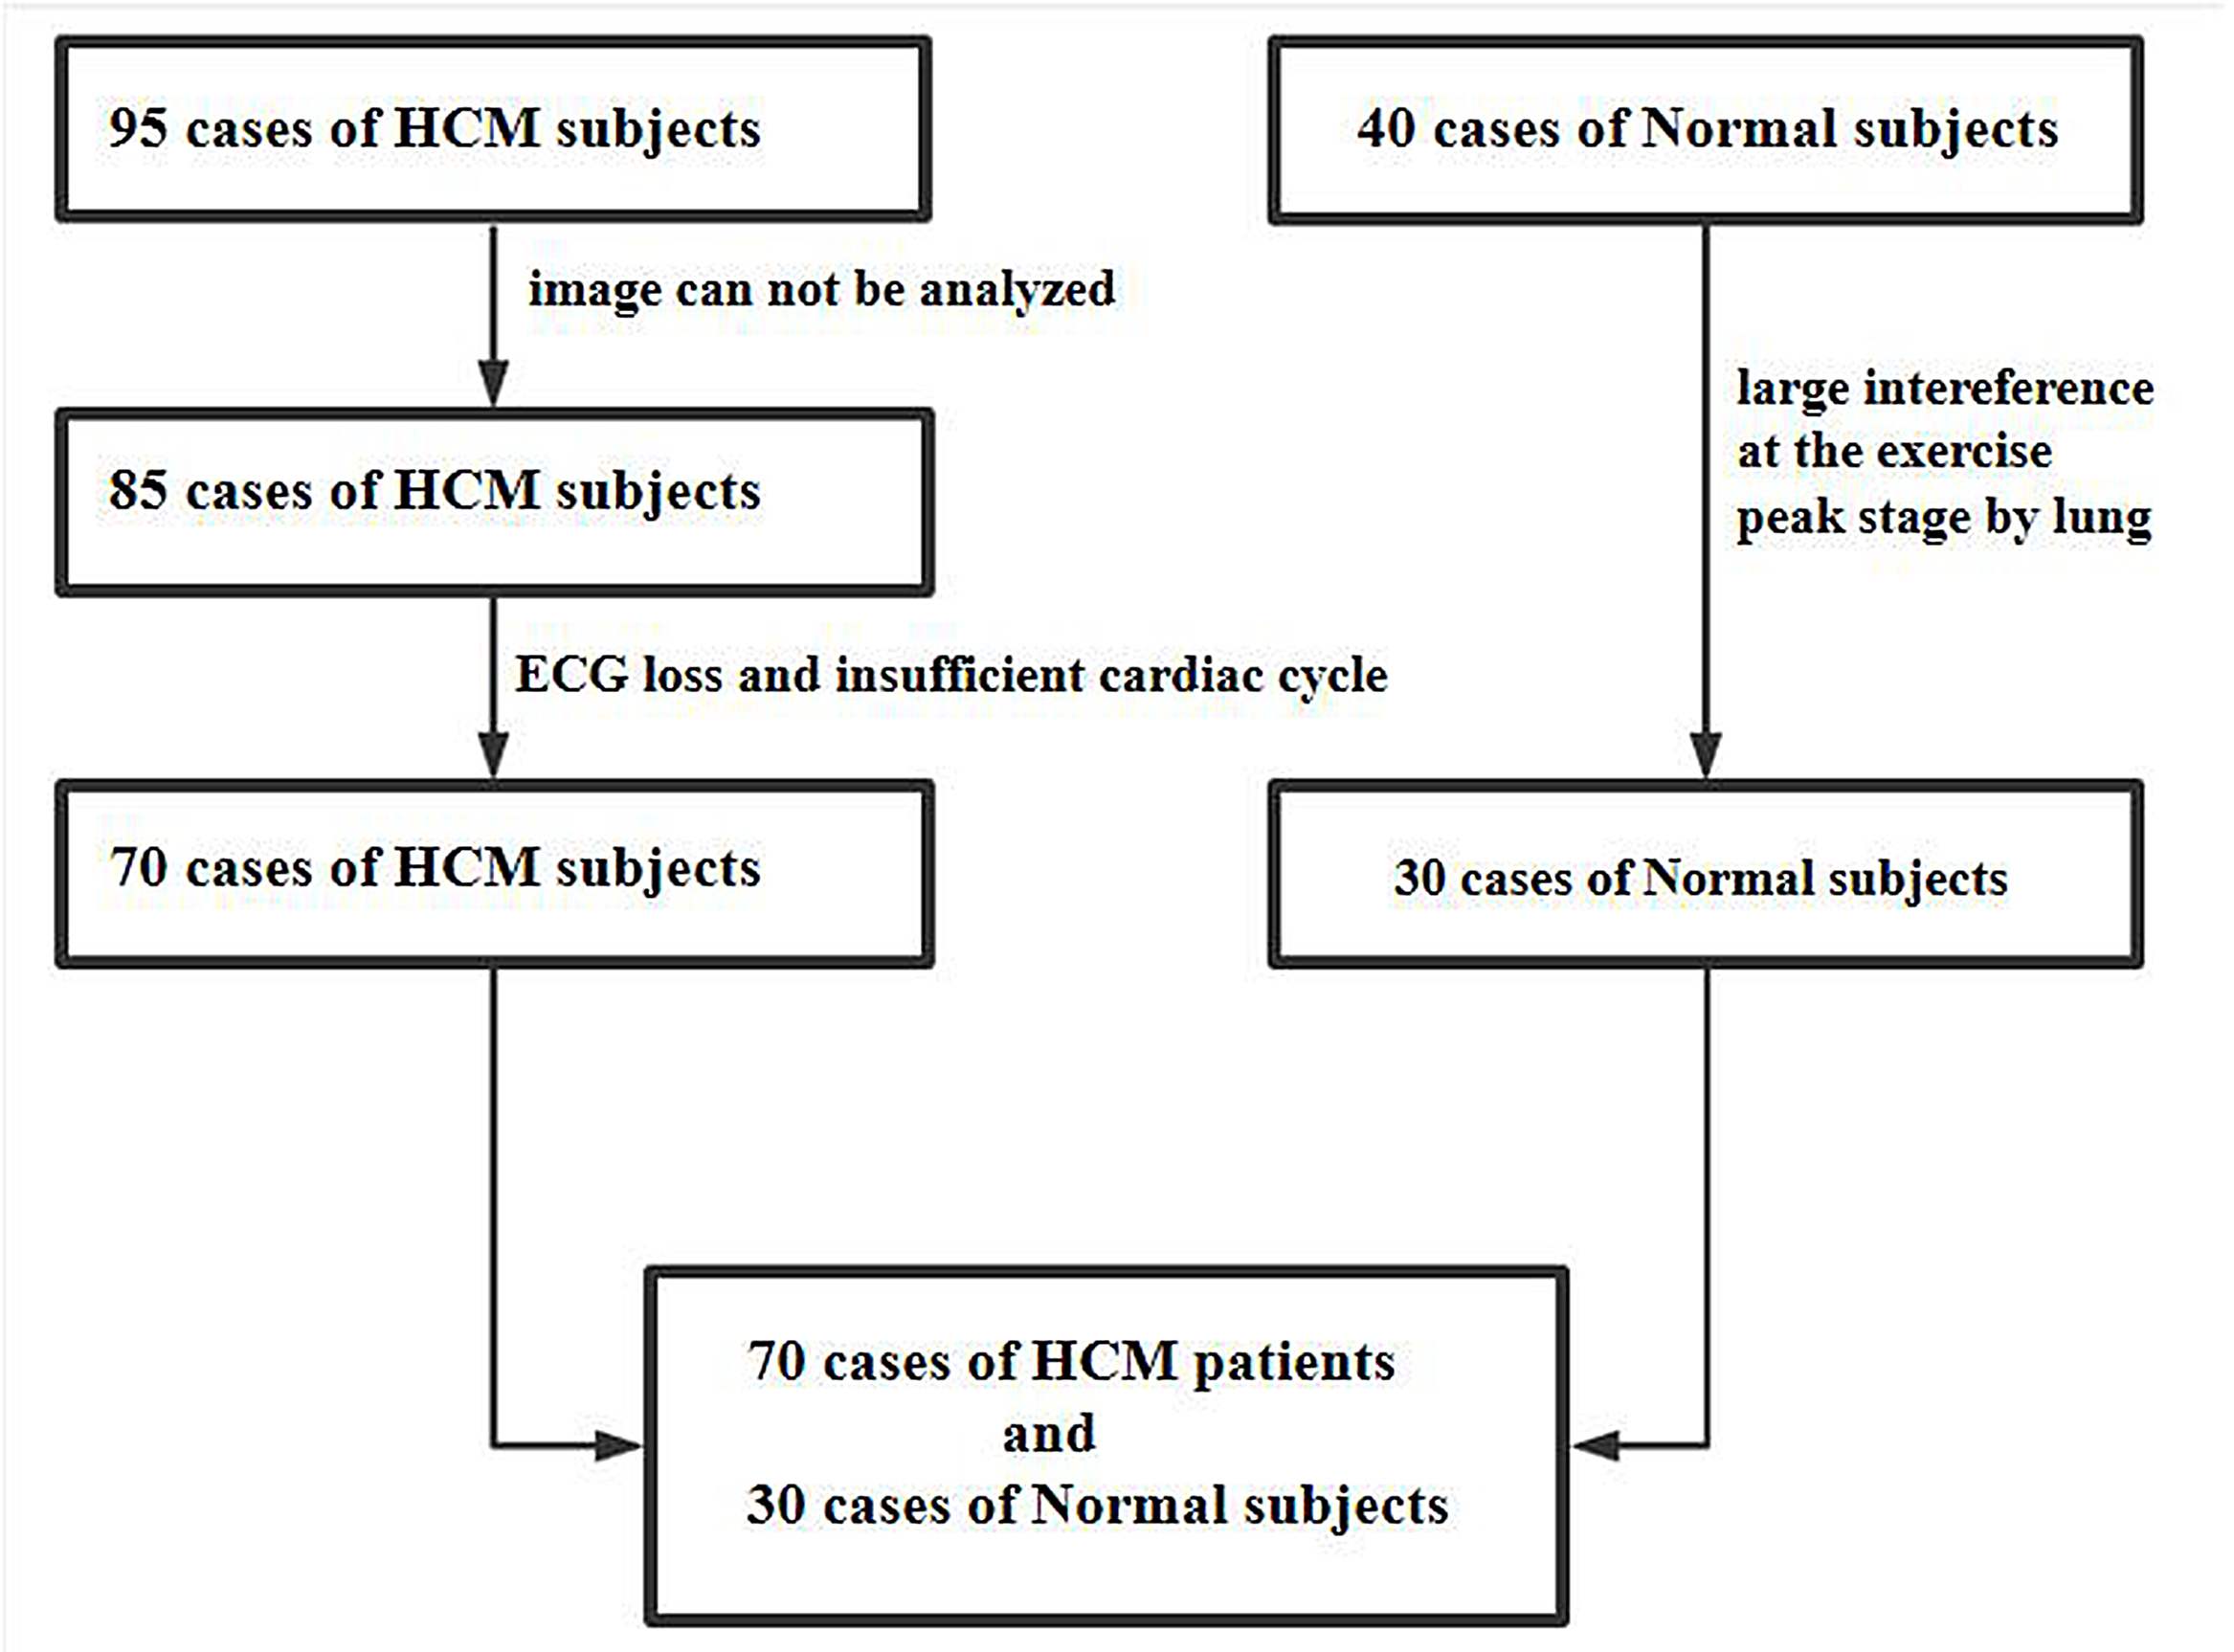 Fig. 1.
A flow chart showing patient recruitment. A total of 95 patients with HCM were initially included in the study, 10 patients were excluded because the peak image could not be analyzed, 15 patients were excluded because of insufficient cardiac cycle of image and ECG loss, finally, 70 patients with HCM were included in the study. In the normal group, 40 cases were initially included, 10 cases were excluded due to the large interference at the peak stage by the lung, finally, 30 cases were included with the image quality meeting the requirements. HCM, hypertrophic cardiomyopathy; ECG, electrocardiogram.
Symptom-restricted exercise tests were performed by SunTechTango synchronized
ambulatory hemometry (SunTech Medical Instruments, NC, USA) and a MortaraX-Scribe
treadmill exercise analysis system (Mortara Instrument, Milwaukee, WI, USA) using
the BRUCE protocol. Electrocardiograms (ECGs) and blood pressure were monitored
during exercise. All subjects were asked to stop
For exercise stress electrocardiography, we used a Philips EPIQ7C ultrasonic
diagnostic apparatus and X5-1 probe (1.0~5.0 MHz) full-function
pure wave single crystal matrix probe; apical four-chamber, three-chamber, and
two-chamber dynamic images from at least five cycles at rest and peak state were
collected. All parameters were measured and analyzed in accordance with American
Society of Echocardiography (ASE) guidelines [8, 9, 10]; body surface area (BSA), body mass index (BMI), left ventricular
end-diastolic volume (EDV), left ventricular end-systolic volume (ESV), left
ventricular ejection fraction (EF), ejection fraction reserve (
All statistical analyses were performed using SPSS 23.0 software (IBM SPSS
Statistics, version 23, Armonk, NY, USA) and R for WINDOWS 4.0.3 software (R
Development of Core Team, the terms of the Free Software Foundation’s GNU General
Public License). Continuous variables are expressed as mean
The mean age of the 70 HCM patients was 47.14
| HCM group (N = 70) | Normal group (N = 30) | p | |
|---|---|---|---|
| Age (year) | 47.14 |
46.60 |
0.850 |
| BSA | 1.67 |
1.68 |
0.920 |
| BMI | 23.56 |
21.96 |
0.330 |
| LA (mm) | 37.09 |
31.47 |
0.000* |
| LAVI (mm/m |
37.2 |
23.87 |
0.000* |
| LVPW (mm) | 12.83 |
8.17 |
0.000* |
| LV (mm) | 40.69 |
42.57 |
0.100* |
| IVS (mm) | 17.21 |
9 |
0.000* |
| E-rest (m/s) | 0.70 |
0.88 |
0.000* |
| A-rest (m/s) | 0.73 |
0.64 |
0.080 |
| E/A-rest (m/s) | 1.09 |
1.40 |
0.010* |
| e-rest (m/s) | 0.05 |
0.11 |
0.000* |
| EDV-rest (mL) | 91.76 |
77.37 |
0.010* |
| ESV-rest (mL) | 25.30 |
26.47 |
0.580 |
| EDV-peak (mL) | 88.43 |
67.30 |
0.000* |
| ESV-peak (mL) | 15.50 |
13.97 |
0.450 |
| EF-rest (%) | 0.72 |
0.66 |
0.000* |
| EF-peak (%) | 0.83 |
0.79 |
0.080 |
| ΔEF | 0.10 |
0.13 |
0.070 |
| ΔEF (%) | 0.14 |
0.20 |
0.020* |
| E/e’-rest | 14.36 |
6.04 |
0.000* |
| METS | 9.05 |
10.46 |
0.012* |
| HR-rest | 79.23 |
71.07 |
0.002* |
| Rest-SBP | 126.95 |
120.34 |
0.041* |
| Rest-DBP | 76.99 |
78.04 |
0.587 |
| Peak-SBP | 172.94 |
168.94 |
0.323 |
| Peak-DBP | 75.59 |
77.56 |
0.391 |
| Rest-HR | 79.23 |
71.07 |
0.002* |
| Peak-HR | 172.56 |
173.40 |
0.801 |
*p
EDV-rest, end-diastolic volume at rest stage; ESV-rest, end-systolic volume at rest stage; EDV-peak, end-diastolic volume at peak stage; ESV-peak, end-systolic volume at peak stage; Rest-SBP, systolic blood pressure at rest stage; Rest-DBP, diastolic blood pressure at rest stage; Peak-SBP, systolic blood pressure at peak stage; Peak-DBP, diastolic blood pressure at peak stage; LAVI, left atrial volume index; BSA, body surface area; BMI, body mass index; LA, left atrial diameter; LVPW, left ventricular posterior wall thickness; LV, left ventricular diameter; IVS, left ventricular interventricular septum thickness; E-rest, Early diastolic forward mitral flow velocity at rest stage; A-rest, Late diastolic mitral valve forward flow velocity at rest stage; e’-rest, early-diastolic mitral annular velocity (e’ was calculated as the mean of the septal e’wave and lateral e’wave by using pulsed wave-tissue Doppler imaging) at rest stage; EF, left ventricular ejection fraction; ∆EF = (EF_peak-EF_rest); ∆EF% = (EF_peak-EF_rest)/EF_rest); METS, estimated metabolic equivalent; Rest-HR, heart rate at rest stage; Peak-HR, heart rate at peak stage; HCM, hypertrophic cardiomyopathy.
| HCM-1 (N = 36) | HCM-2 (N = 34) | Normal (N = 30) | p (1-2) | p (1-N) | p (2-N) | |
|---|---|---|---|---|---|---|
| age (year) | 50.94 |
43.12 |
46.60 |
0.028* | 0.137 | 0.231 |
| BSA | 1.67 |
1.66 |
1.68 |
0.901 | 0.277 | 0.291 |
| BMI | 24.09 |
22.99 |
21.96 |
0.159 | 0.158 | 0.157 |
| LA (mm) | 39.56 |
34.47 |
31.47 |
0.000* | 0.000* | 0.004* |
| LAVI (mm/m |
39.78 |
34.47 |
23.87 |
0.000* | 0.000* | 0.000* |
| LVPW (mm) | 12.31 |
13.38 |
8.17 |
0.551 | 0.000* | 0.000* |
| LV (mm) | 40 |
41.44 |
42.57 |
0.441 | 0.082 | 0.460 |
| IVS (mm) | 18.19 |
16.06 |
9 |
0.187 | 0.000* | 0.000* |
| E-rest (m/s) | 0.72 |
0.67 |
0.88 |
0.295 | 0.001* | 0.000* |
| A-rest (m/s) | 0.82 |
0.64 |
0.64 |
0.008* | 0.006* | 0.997 |
| E/A-rest | 1.02 |
1.17 |
1.4 |
0.207 | 0.000* | 0.018* |
| E/e’-rest | 18.24 |
10.25 |
6.04 |
0.000* | 0.000* | 0.000* |
| E/e’-peak | 17.43 |
12.29 |
6.08 |
0.000* | 0.000* | 0.000* |
| EDV-rest (mL) | 93.06 |
90.52 |
77.36 |
0.689 | 0.006* | 0.033* |
| ESV-rest (mL) | 24.70 |
25.88 |
26.46 |
0.635 | 0.382 | 0.823 |
| EDV-peak (mL) | 90.42 |
86.44 |
67.30 |
0.508 | 0.000* | 0.001* |
| ESV-peak (mL) | 16.38 |
14.62 |
13.96 |
0.493 | 0.340 | 0.683 |
| METS | 7.91 |
10.25 |
10.46 |
0.000* | 0.000* | 0.690 |
| HR-rest (bpm) | 78.03 |
80.50 |
71.07 |
0.429 | 0.010* | 0.002* |
| HR-peak (bpm) | 169.06 |
176.88 |
173.40 |
0.028* | 0.115 | 0.213 |
*p
EDV-rest, end-diastolic volume at rest stage; ESV-rest, end-systolic volume at rest stage; EDV-peak, end-diastolic volume at peak stage; ESV-peak, end-systolic volume at peak stage; LAVI, left atrial volume index; BSA, body surface area; BMI, body mass index; LA, left atrial diameter; LVPW, left ventricular posterior wall thickness; LV, left ventricular diameter; IVS, left ventricular interventricular septum thickness; E-rest, Early diastolic forward mitral flow velocity at rest stage; A-rest, Late diastolic mitral valve forward flow velocity at rest stage; e’-rest, early-diastolic mitral annular velocity (e’ was calculated as the mean of the septal e’wave and lateral e’wave by using pulsed wave-tissue Doppler imaging) at rest stage; e’-peak, early-diastolic mitral annular velocity (e’ was calculated as the mean of the septal e’wave and lateral e’wave by using pulsed wave-tissue Doppler imaging) at peak stage; METS, estimated metabolic equivalent; HR-rest, heart rate at rest stage; HR-peak, heart rate at peak stage; HCM, hypertrophic cardiomyopathy.
As shown in Table 3: Rest-LASr, Rest-LAScd, Rest-LASct, Peak-LASr, Peak-LAScd,
Peak-LASct, GLS,
| HCM group (N = 70) | Normal group (N = 30) | p | |
|---|---|---|---|
| Rest-LASr | 21.8 |
44.39 |
0.000* |
| Rest-LAScd | –13.81 |
–27.97 |
0.000* |
| Rest-LASct | –7.71 |
–16.41 |
0.000* |
| Peak-LASr | 20.28 |
66.61 |
0.000* |
| Peak-LAScd | –12.77 |
–38.32 |
0.000* |
| Peak-LASct | –6.44 |
–28.28 |
0.000* |
| Rest-GLS | –20.07 |
–25.25 |
0.000* |
| Peak-GLS | –18.91 |
–35.67 |
0.000* |
| ΔGLS | –1.1 |
10.4 |
0.000* |
| ΔGLS% | –0.05 |
0.4 |
0.000* |
| ΔLaSr% | –0.05 |
0.51 |
0.000* |
| ΔLaScd% | 0.09 |
0.40 |
0.044* |
| ΔLaSct% | –0.12 |
0.74 |
0.000* |
| Rest-HR | 79.23 |
71.23 |
0.002* |
| Peak-HR | 172.56 |
173.40 |
0.801 |
*p
Rest-GLS, LV global longitudinal strain at rest stage; Peak-GLS, LV global longitudinal strain at peak stage; ∆GLS = Peak_GLS-Rest_GLS; ∆GLS% = (Peak_GLS-Rest_GLS)/Rest_GLS; Rest-LASr, LA reservoir strain at rest stage; Peak-LASr, LA reservoir strain at peak stage; Rest-LAScd, LA conduit strain at rest stage; Peak-LAScd, LA conduit strain at peak stage; Rest-LASct, LA contraction strain at rest stage; Peak-LASct, LA contraction strain at peak stage; ∆LASr% = (Peak_LASr-Rest_LASr)/Rest_LASr; ∆LAScd% = (Peak_LAScd-Rest_LAScd)/Rest_LAScd; ∆LASct% = (Peak_LASct-Rest_LASct)/Rest_LASct; Rest-HR, heart rate at rest stage; Peak-HR, heart rate at peak stage; HCM, hypertrophic cardiomyopathy.
In the HCM-1 and HCM-2 groups, there was no statistically significant difference
between the rest and peak. While, the LA and LV strain of the normal group was
significantly different between the rest and peak (p
| HCM-1 (N = 36) | HCM-2 (N = 34) | Normal (N = 30) | |||||||
|---|---|---|---|---|---|---|---|---|---|
| REST | PEAK | p (1) | REST | PEAK | p (2) | REST | PEAK | p (3) | |
| LASr | 18.73 |
17.59 |
0.285 | 25.05 |
23.13 |
0.033 | 44.39 |
66.61 |
0.000* |
| LAScd | –10.69 |
–10.12 |
0.735 | –17.11 |
–15.58 |
0.141 | –27.97 |
–38.32 |
0.000* |
| LASct | –6.72 |
–5.39 |
0.313 | –8.76 |
–7.54 |
0.174 | –16.41 |
–28.28 |
0.000* |
| GLS | –19.59 |
–17.16 |
0.050 | –20.58 |
–20.75 |
0.821 | –25.25 |
–35.67 |
0.000* |
| SBP | 124.0 |
163.44 |
0.000* | 124.94 |
175.18 |
0.000* | 121.87 |
167.47 |
0.000* |
| DBP | 73 |
74 |
0.669 | 76.44 |
73.65 |
0.434 | 76.83 |
77.10 |
0.000* |
*p
GLS, LV global longitudinal strain; LASr, LA reservoir strain; LAScd, LA conduit strain; LASct, LA contraction strain; SBP, systolic blood pressure; DBP, diastolic blood pressure; HCM, hypertrophic cardiomyopathy.
The comparison among the three groups found that: the Rest-LASr, Rest-LAScd,
Peak-LASr, Peak-LAScd, Peak-GLS,
| HCM-1 (N = 36) | HCM-2 (N = 34) | Normal (N = 30) | p (1-2) | p (1-N) | p (2-N) | |
|---|---|---|---|---|---|---|
| Rest-LASr | 18.73 |
25.05 |
44.4 |
0.000* | 0.000* | 0.000* |
| Rest-LAScd | –10.69 |
–17.11 |
–28 |
0.000* | 0.000* | 0.000* |
| Rest-LASct | –6.72 |
–8.76 |
–16.4 |
0.155 | 0.000* | 0.000* |
| Peak-LASr | 17.59 |
23.13 |
66.61 |
0.001* | 0.000* | 0.000* |
| Peak-LAScd | –10.12 |
–15.58 |
–38.3 |
0.008* | 0.000* | 0.000* |
| Peak-LASct | –5.39 |
–7.54 |
–28.3 |
0.097 | 0.000* | 0.000* |
| Rest-GLS | –19.59 |
–20.58 |
–25.3 |
0.163 | 0.000* | 0.000* |
| Peak-GLS | –17.16 |
–20.75 |
–35.7 |
0.013* | 0.000* | 0.000* |
| ΔLASr% | –0.03 |
–0.07 |
0.51 |
0.640 | 0.000* | 0.000* |
| ΔLAScd% | 0.22 |
–0.04 |
0.40 |
0.170 | 0.327 | 0.000* |
| ΔLASct% | –0.39 |
0.17 |
0.74 |
0.028* | 0.000* | 0.014* |
| ΔGLS% | –0.12 |
0.02 |
0.42 |
0.044* | 0.000* | 0.000* |
*p
Rest-GLS, LV global longitudinal strain at rest stage; Peak-GLS, LV global longitudinal strain at peak stage; ∆GLS = Peak_GLS-Rest_GLS; ∆GLS% = (Peak_GLS-Rest_GLS)/Rest_GLS; Rest-LASr, LA reservoir strain at rest stage; Peak-LASr, LA reservoir strain at peak stage; Rest-LAScd, LA conduit strain at rest stage; Peak-LAScd, LA conduit strain at peak stage; Rest-LASct, LA contraction strain at rest stage; Peak-LASct, LA contraction strain at peak stage; ∆LASr% = (Peak_LASr-Rest_LASr)/Rest_LASr; ∆LAScd% = (Peak_LAScd-Rest_LAScd)/Rest_LAScd; ∆LASct% = (Peak_LASct-Rest_LASct)/Rest_LASct; HCM, hypertrophic cardiomyopathy.
| Intraobserver variability | Interobserver variability | |||||
|---|---|---|---|---|---|---|
| ICC | 95% Lower | 95% Upper | ICC | 95% Lower | 95% Upper | |
| Rest-LASr | 0.982 | 0.973 | 0.988 | 0.975 | 0.963 | 0.983 |
| Rest-LAScd | 0.936 | 0.906 | 0.956 | 0.923 | 0.888 | 0.948 |
| Rest-LASct | 0.713 | 0.601 | 0.797 | 0.684 | 0.564 | 0.776 |
| Peak-LASr | 0.948 | 0.924 | 0.965 | 0.977 | 0.966 | 0.985 |
| Peak-LAScd | 0.974 | 0.962 | 0.983 | 0.809 | 0.729 | 0.867 |
| Peak-LASct | 0.840 | 0.772 | 0.89 | 0.723 | 0.614 | 0.805 |
| Rest-GLS | 0.857 | 0.795 | 0.901 | 0.826 | 0.752 | 0.879 |
| Peak-GLS | 0.925 | 0.891 | 0.949 | 0.933 | 0.902 | 0.954 |
Rest-GLS, LV global longitudinal strain at rest stage; Peak-GLS, LV global longitudinal strain at peak stage; Rest-LASr, LA reservoir strain at rest stage; Peak-LASr, LA reservoir strain at peak stage; Rest-LAScd, LA conduit strain at rest stage; Peak-LAScd, LA conduit strain at peak stage; Rest-LASct, LA contraction strain at rest stage; Peak-LASct, LA contraction strain at peak stage; ICC, intraclass correlation coefficient.
In this study, 9 patients (25%) in the HCM-1 group had a METS
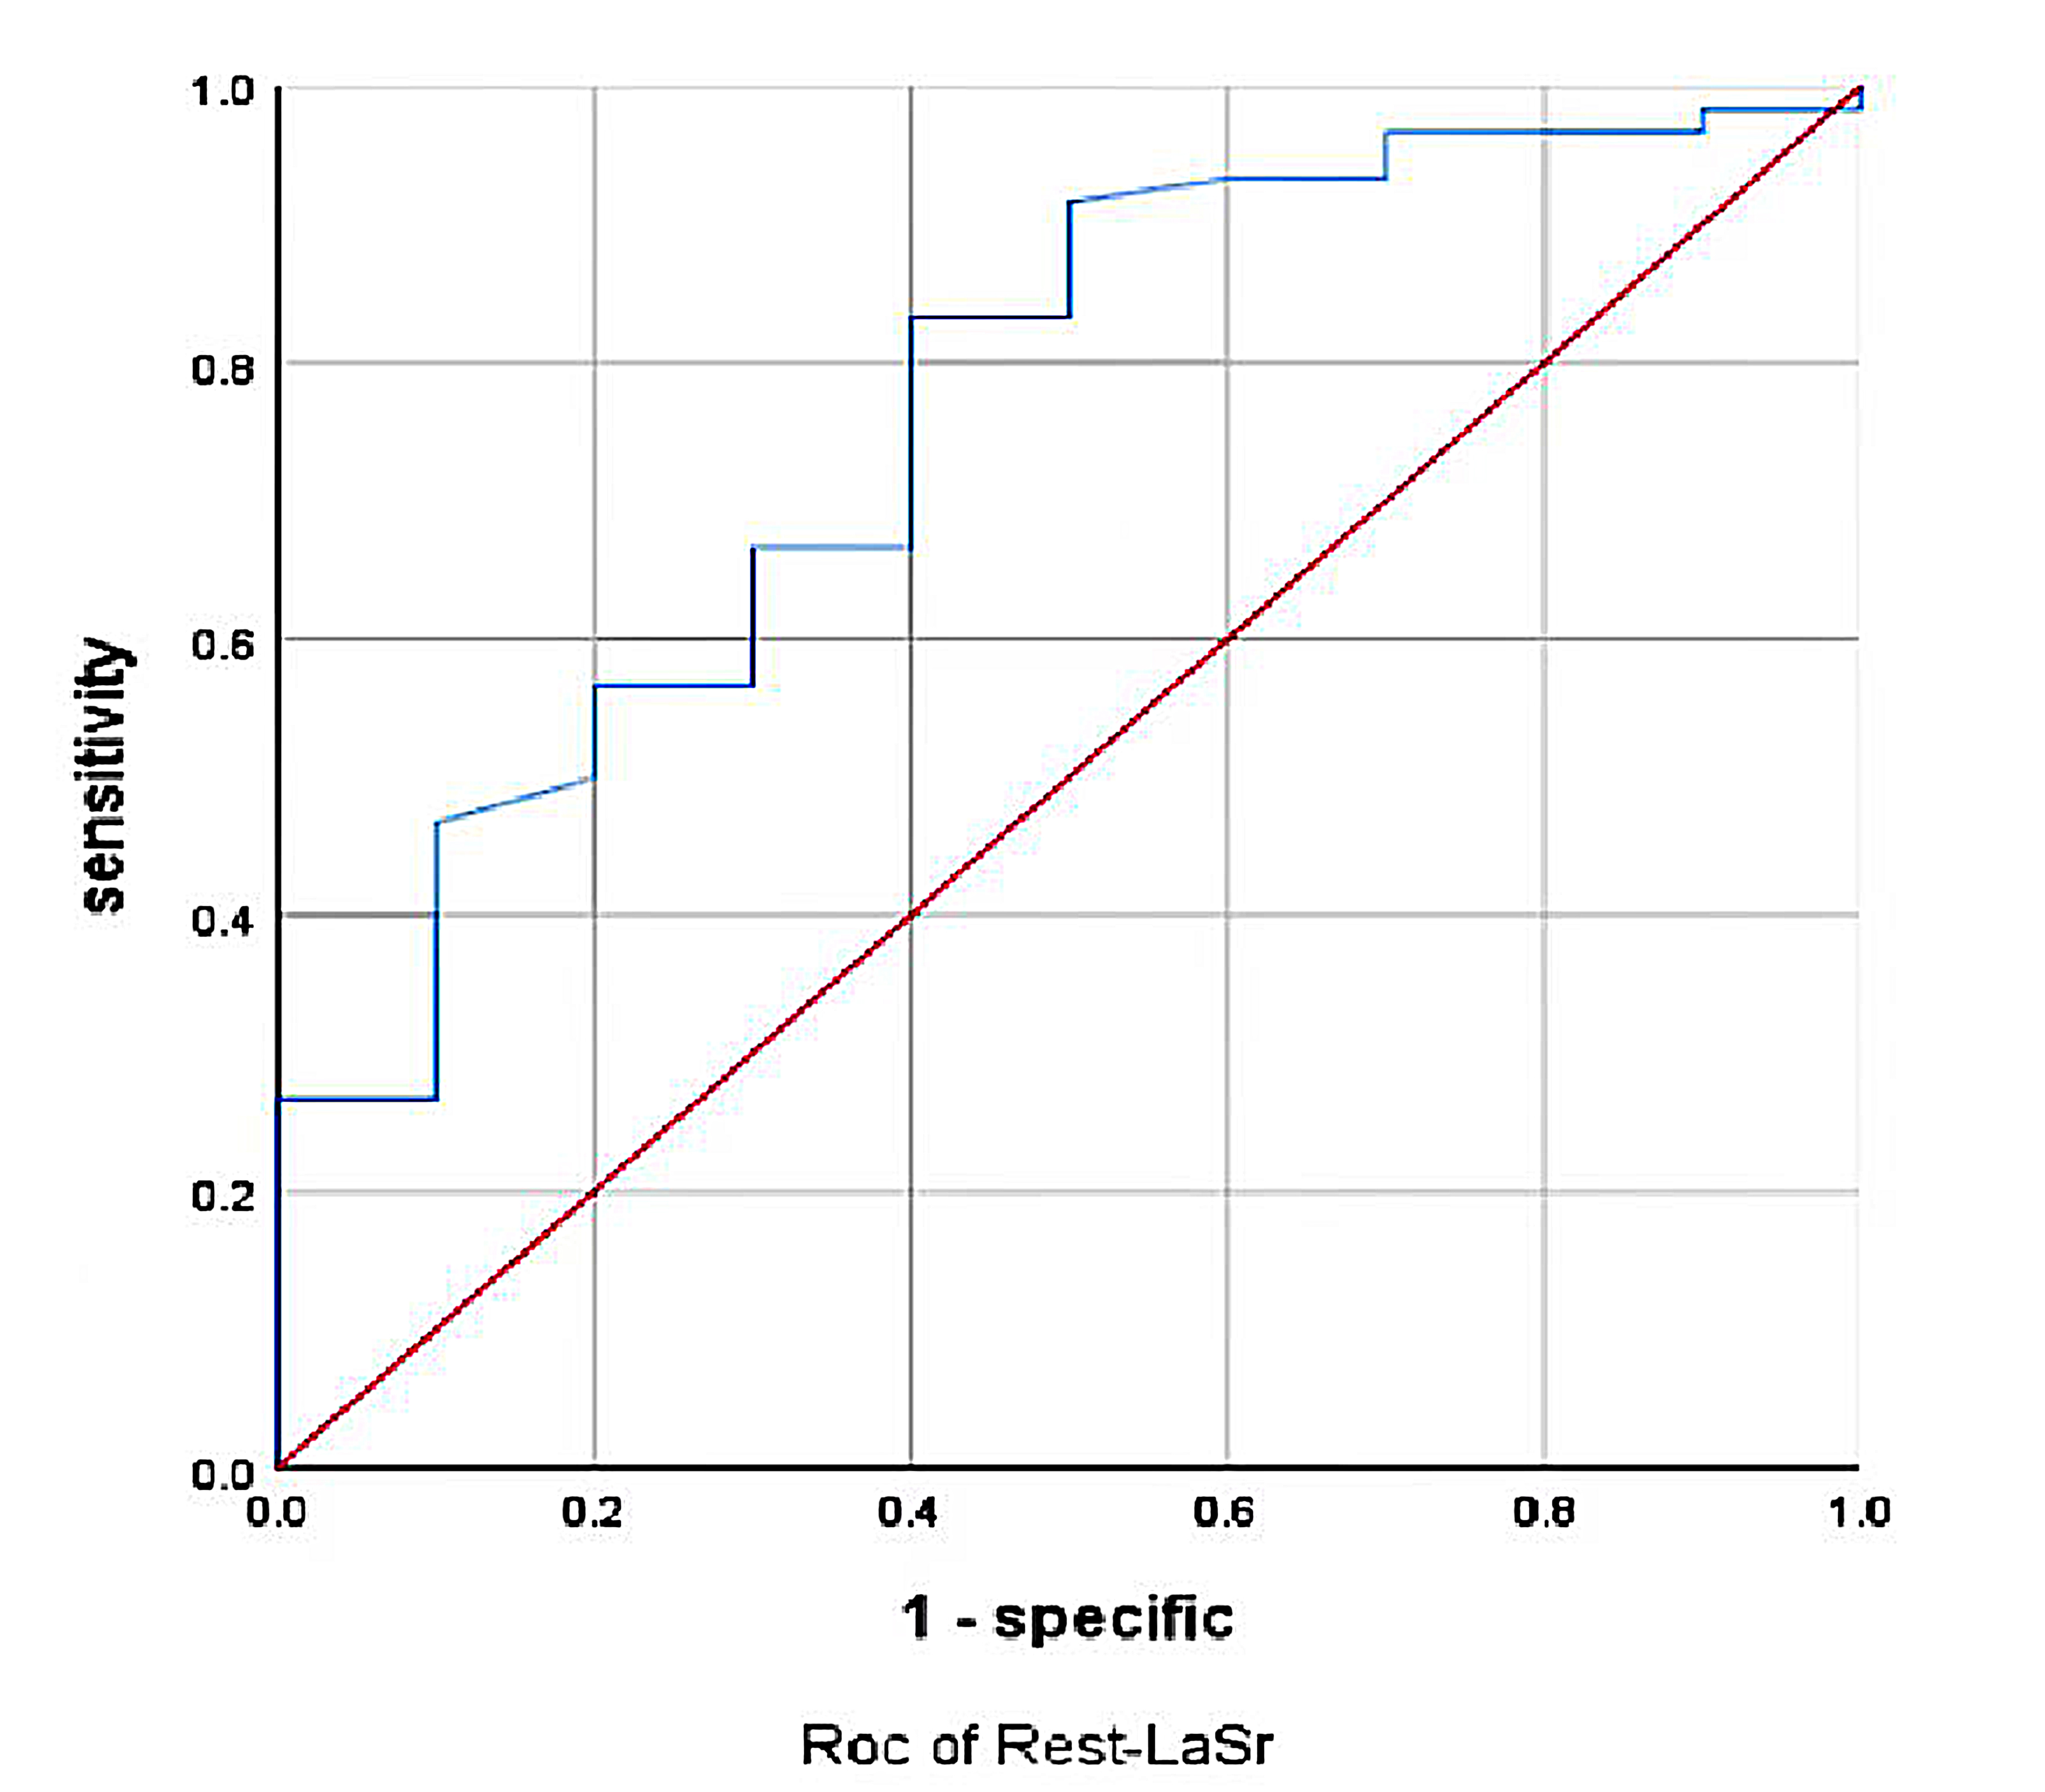 Fig. 2.
Rest-LASr predicted METS less than 6.0 ROC curve. LASr, LA reservoir strain; METS, metabolic equivalents.
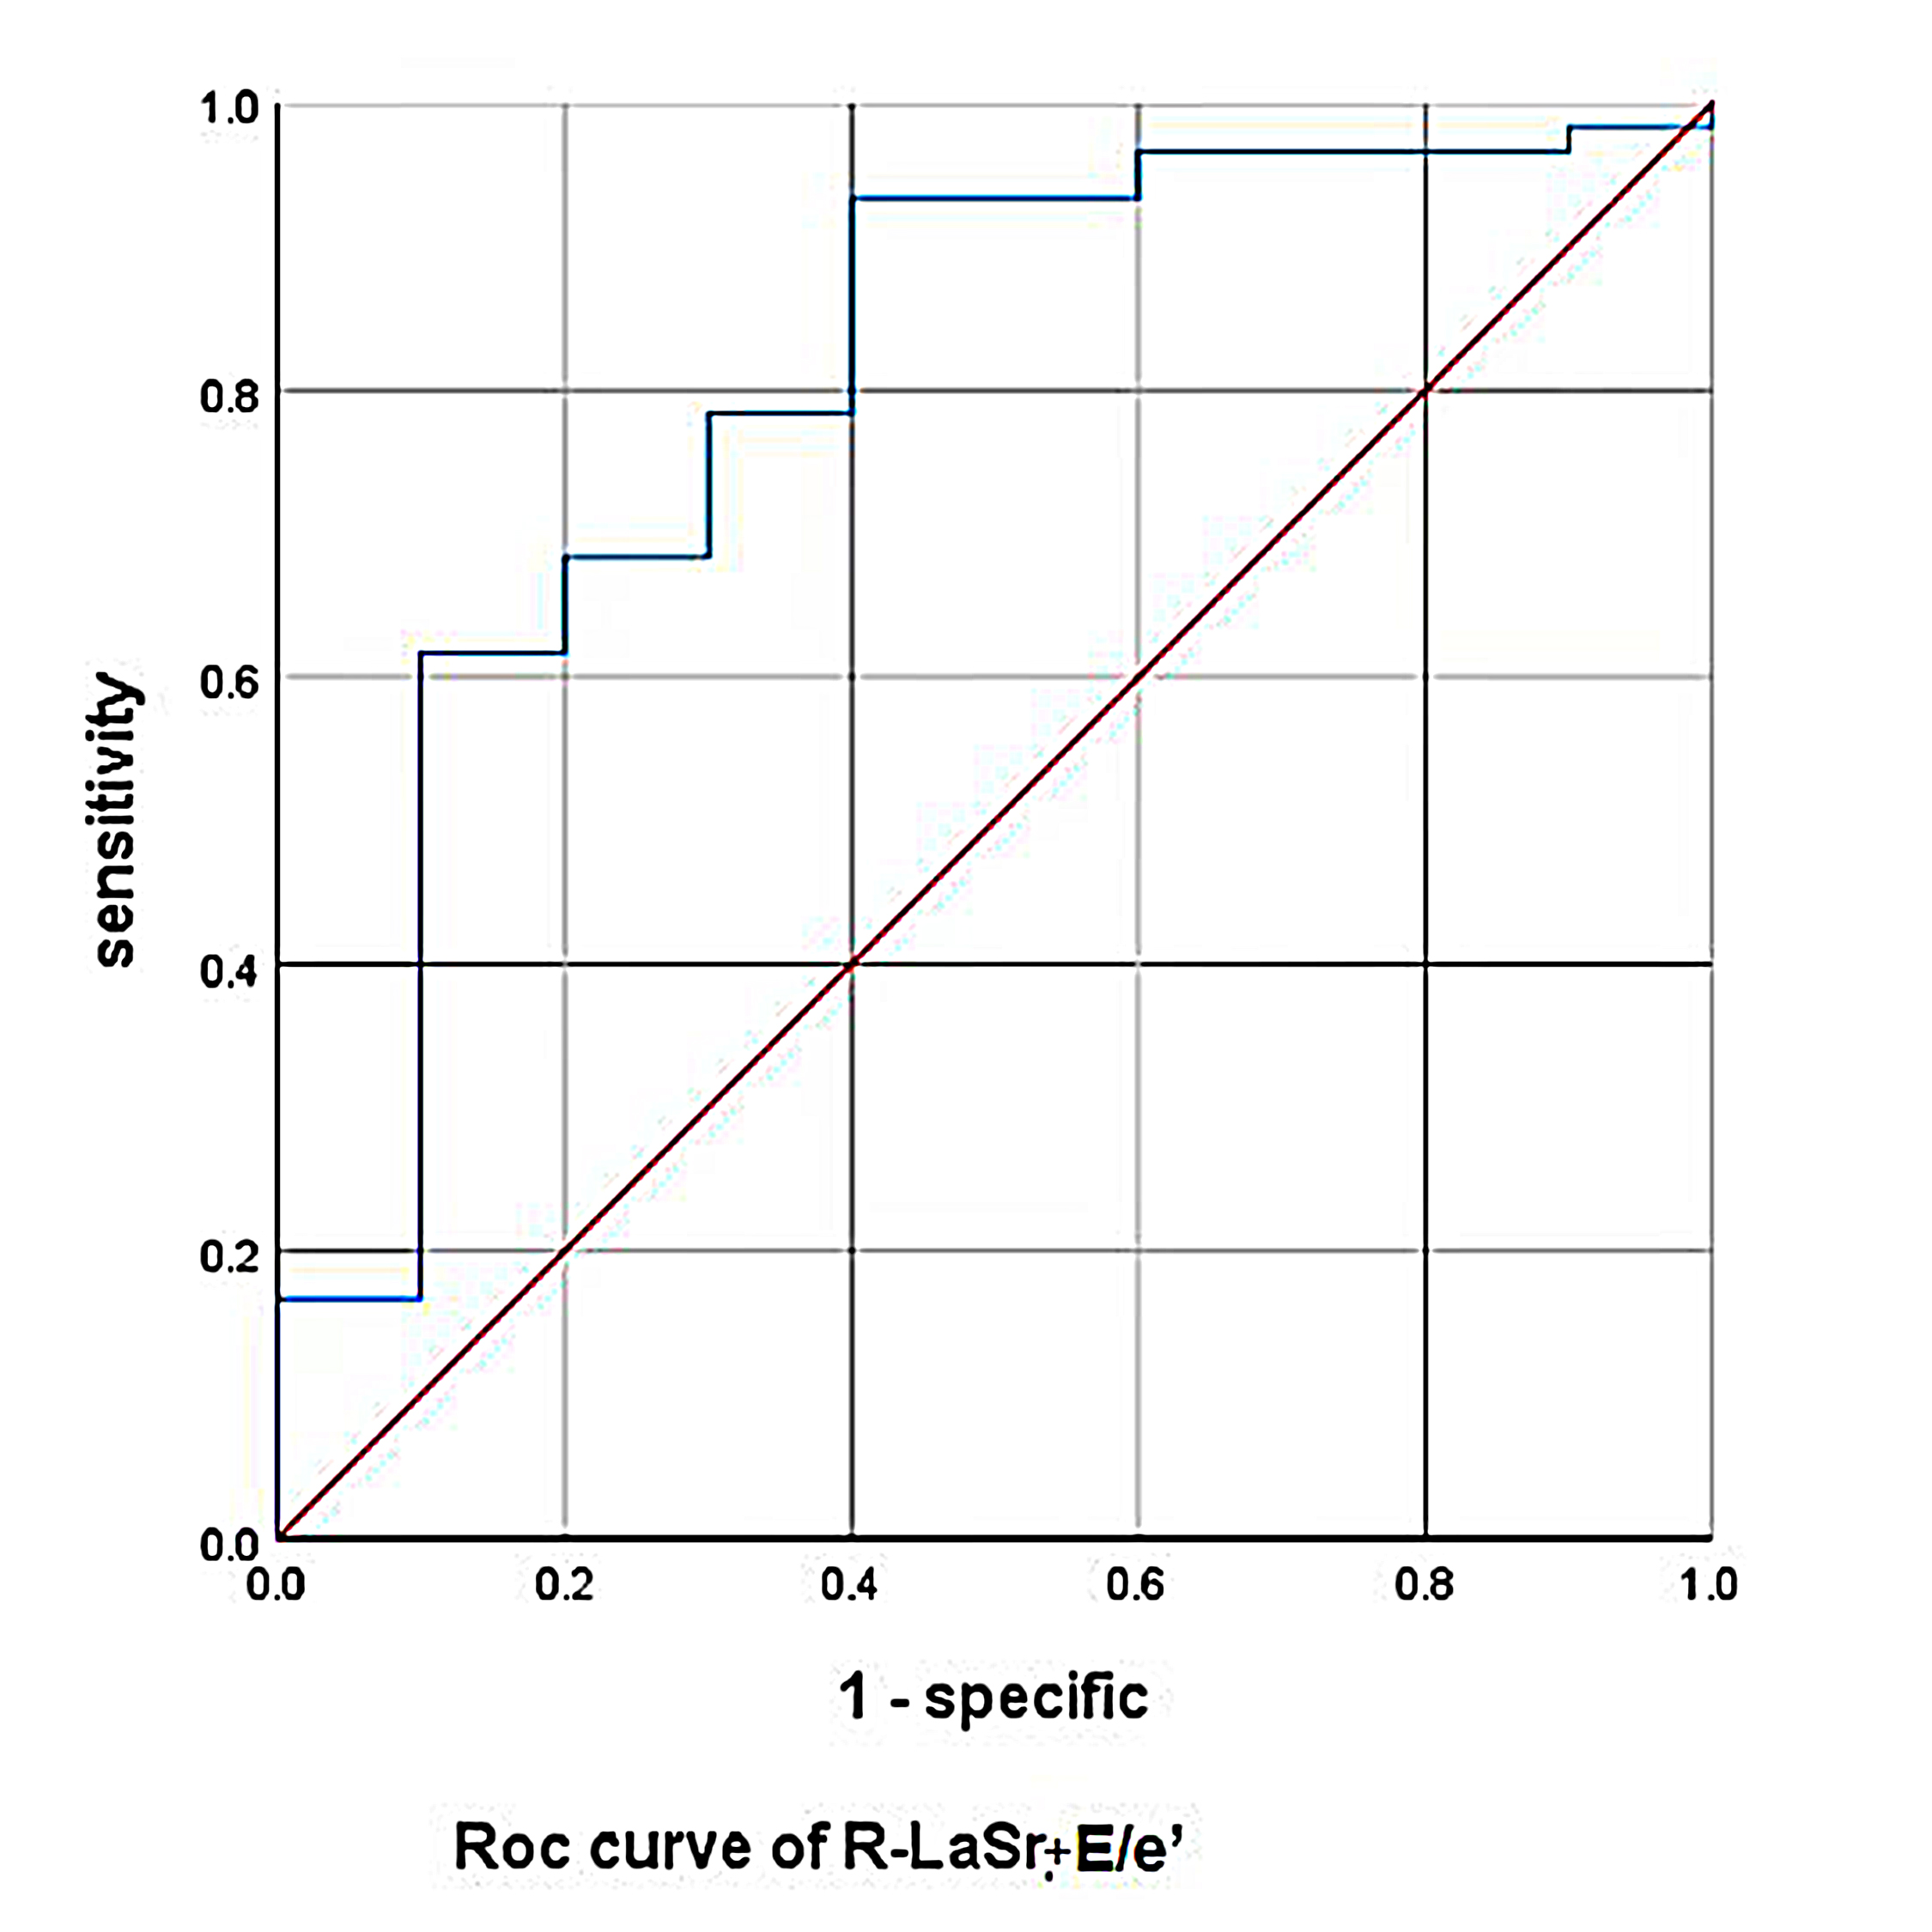 Fig. 3.
Rest-LASr+E/e’-rest predicted METS less than 6.0 ROC curve. LASr, LA reservoir strain; METS, metabolic equivalents.
| Sensitivity | Specificity | Cutoff | AUC | 95% Lower | 95% Upper | |
|---|---|---|---|---|---|---|
| Rest-LASr | 0.833 | 0.6 | 16.91 | 0.759 | 0.599 | 0.919 |
| E/e’-rest | 0.783 | 0.7 | 17.06 | 0.757 | 0.572 | 0.941 |
| Rest-LAScd | 0.567 | 0.7 | –12.89 | 0.648 | 0.46 | 0.836 |
| Rest-LASct | 0.417 | 0.9 | –10.24 | 0.593 | 0.418 | 0.767 |
| Rest-GLS | 0.517 | 0.8 | –20.41 | 0.671 | 0.501 | 0.841 |
Rest-GLS, LV global longitudinal strain at rest stage; Rest-LASr, LA reservoir strain at rest stage; Rest-LAScd, LA conduit strain at rest stage; Rest-LASct, LA contraction strain at rest stage; E-rest, Early diastolic forward mitral flow velocity at rest stage; e’-rest, early-diastolic mitral annular velocity (e’ was calculated as the mean of the septal e’wave and lateral e’ wave by using pulsed wave-tissue Doppler imaging) at rest stage.
| Sensitivity | Specificity | AUC | 95% Lower | 95% Upper | |
|---|---|---|---|---|---|
| Rest-LASr+Rest-LASct | 0.933 | 0.5 | 0.755 | 0.587 | 0.923 |
| Rest-LASr+Rest-LASct+Rest-LAScd | 0.933 | 0.5 | 0.753 | 0.585 | 0.922 |
| Rest-LASr+E/e’-rest | 0.933 | 0.6 | 0.8 | 0.638 | 0.962 |
| Rest-LASct+E/e’-rest | 0.833 | 0.8 | 0.795 | 0.612 | 0.978 |
| Rest-LASr+Rest-LASct+Rest-LAScd+E/e’-rest | 0.917 | 0.7 | 0.797 | 0.617 | 0.976 |
Rest-LASr, LA reservoir strain at rest stage; Rest-LAScd, LA conduit strain at rest stage; Rest-LASct, LA contraction strain at rest stage; E-rest, early diastolic forward mitral flow velocity at rest stage; e’-rest, early-diastolic mitral annular velocity (e’ was calculated as the mean of the septal e’wave and lateral e’ wave by using pulsed wave-tissue Doppler imaging) at rest stage.
METS was positively correlated with Rest-LASr (r = 0.448), Peak-LASr (r =
0.538),
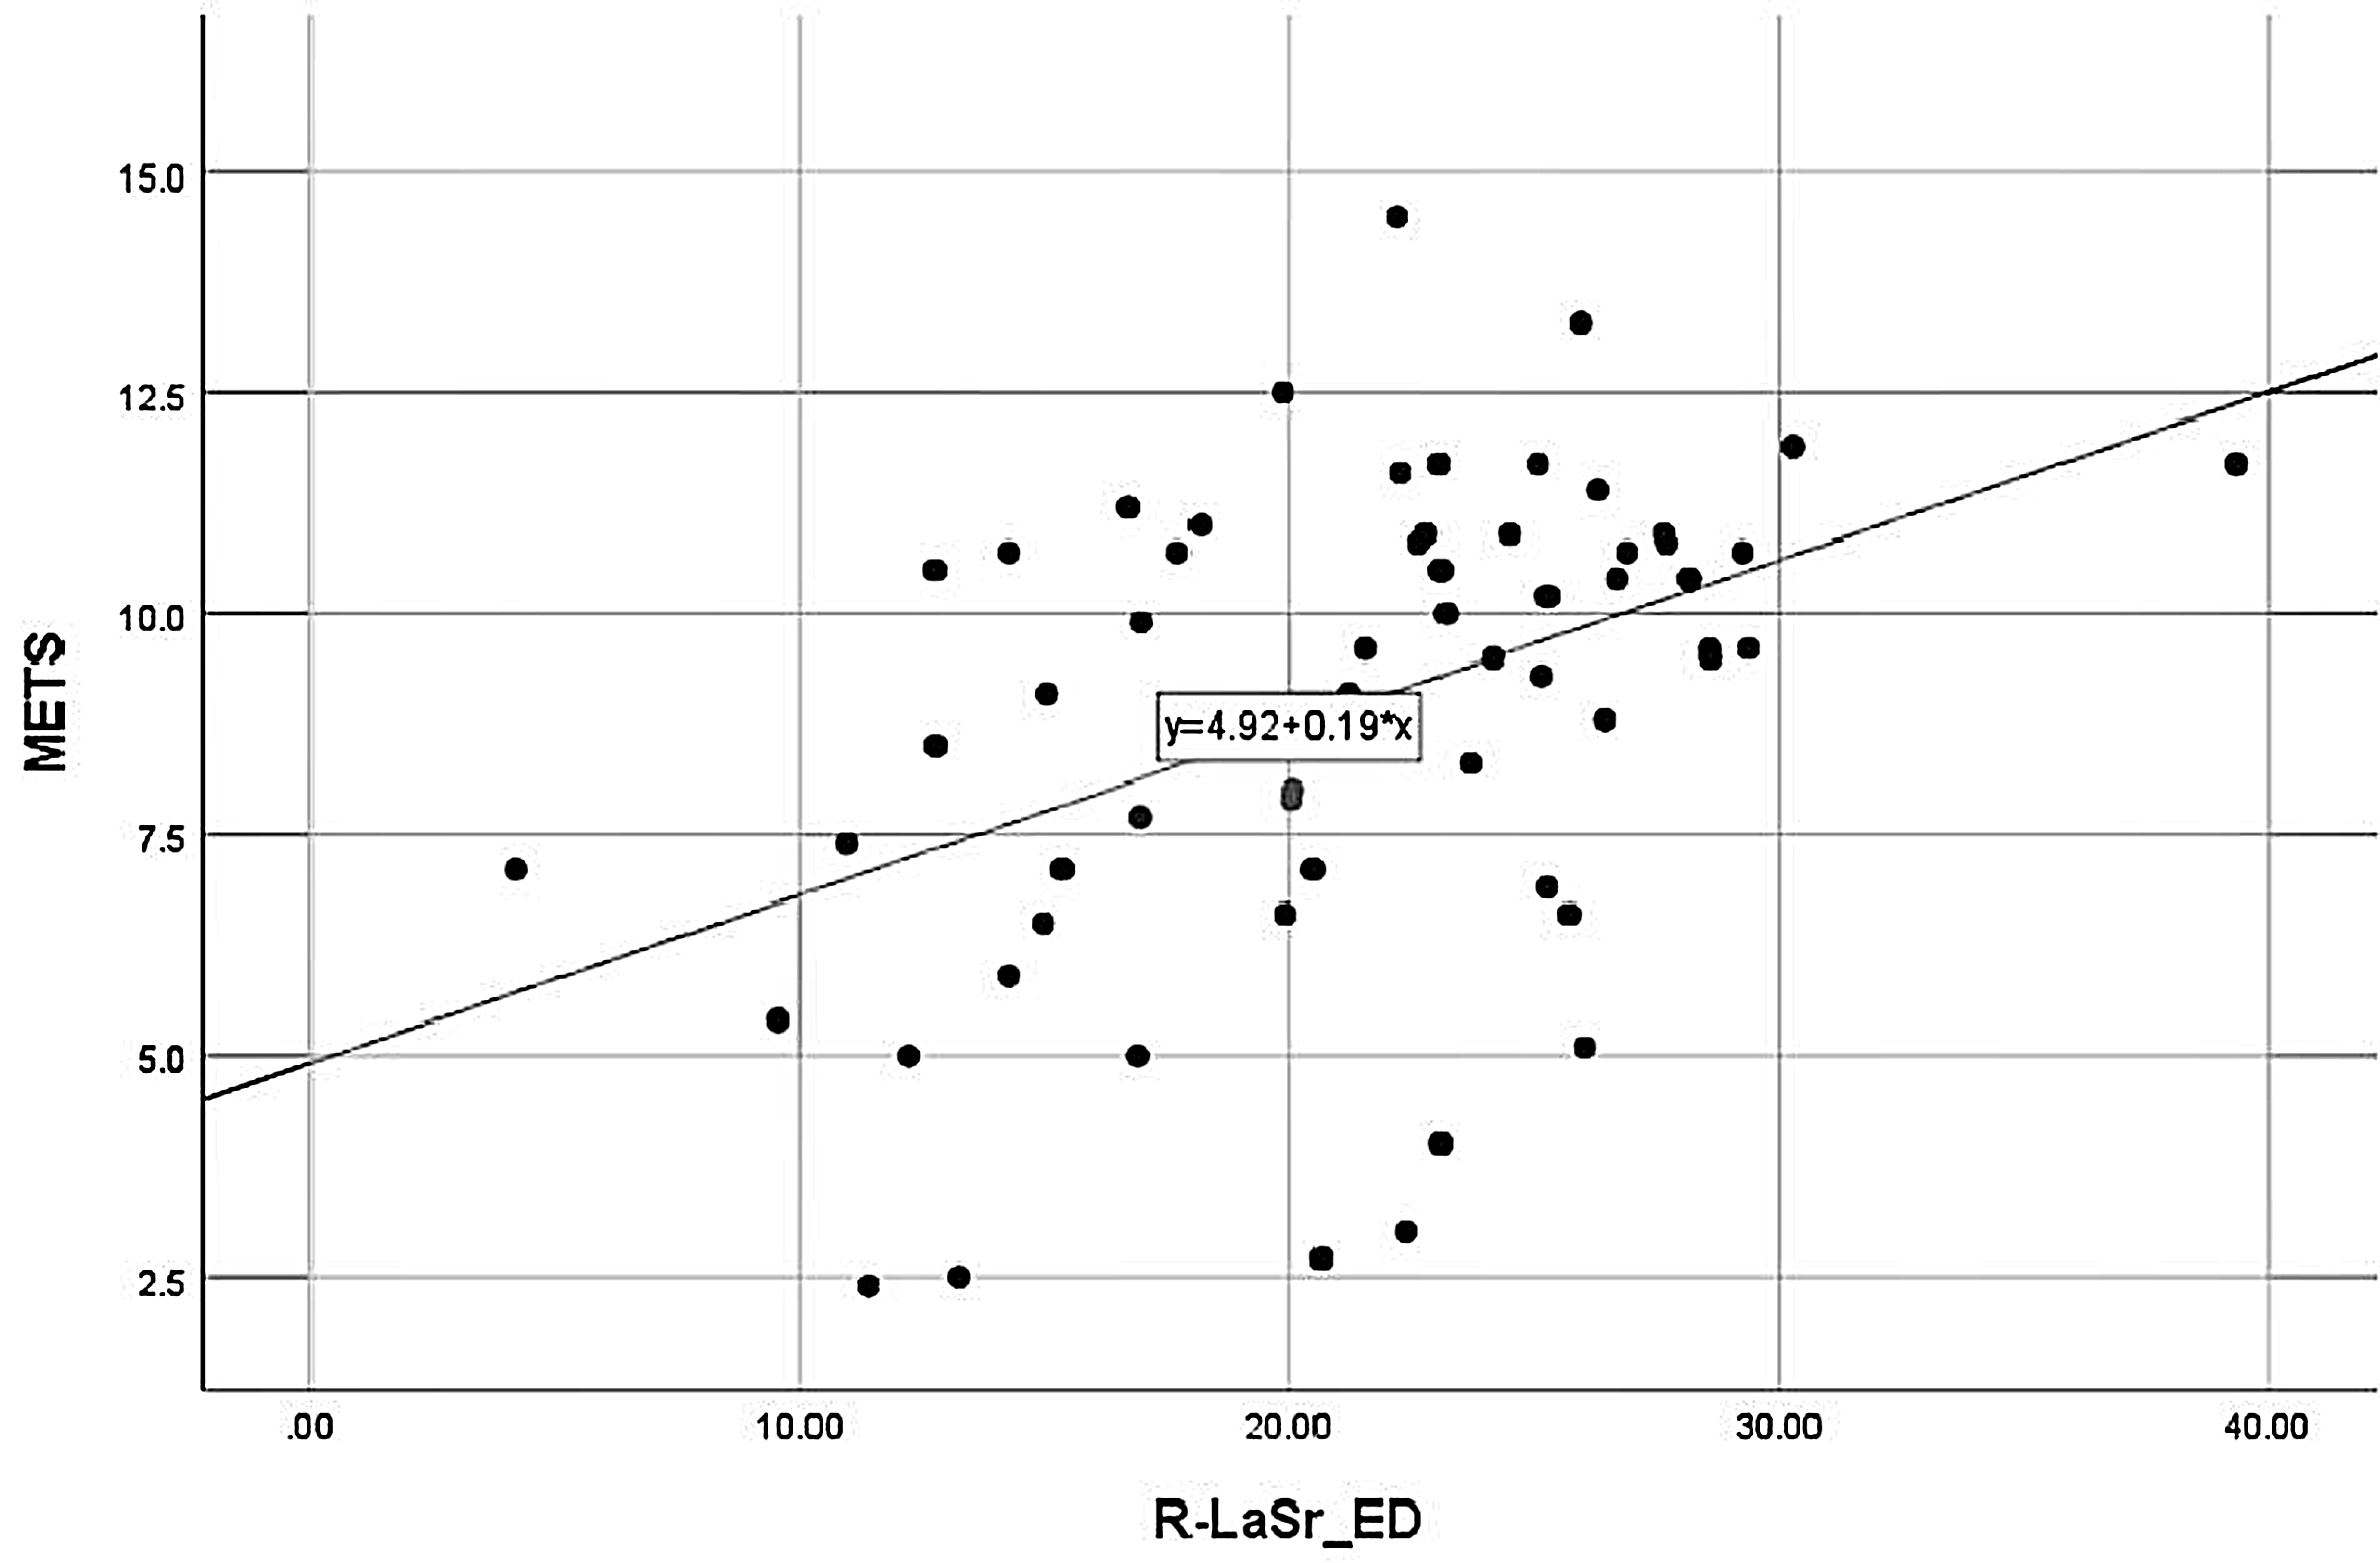 Fig. 4.
METS correlation with Rest-LASr. METS was positively correlated with Rest-LASr. LASr, LA reservoir strain; METS, metabolic equivalents.
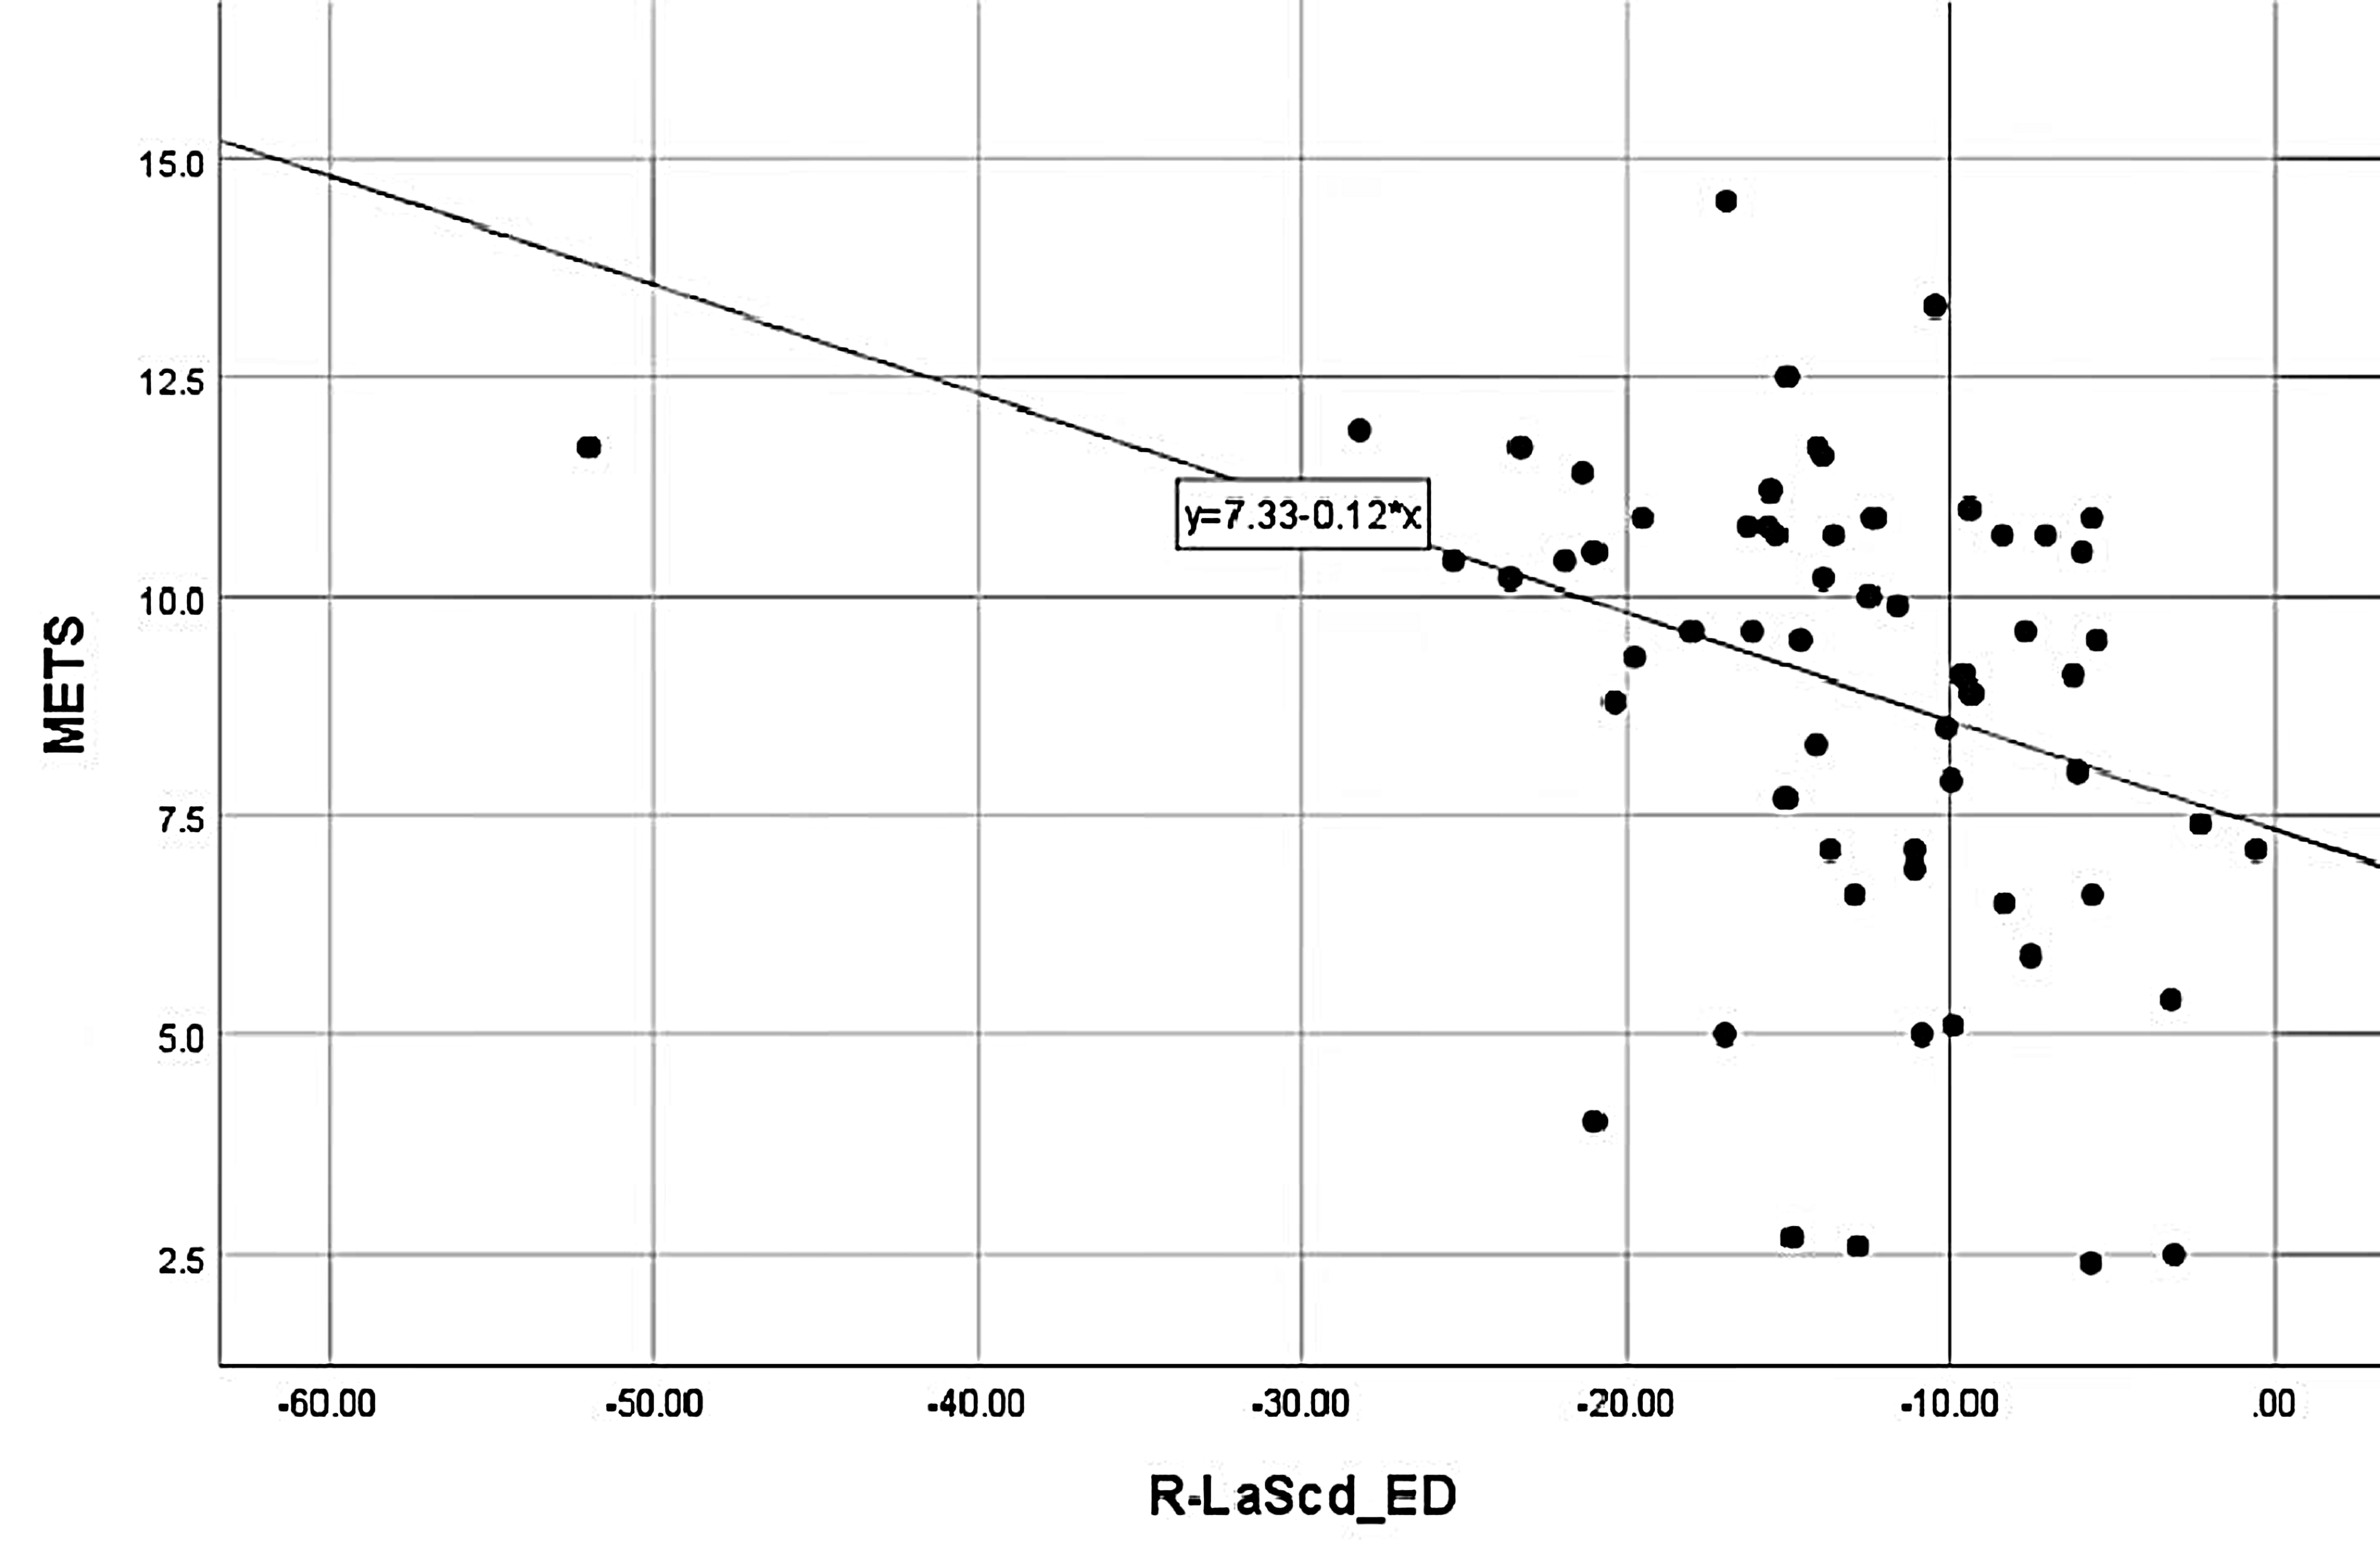 Fig. 5.
METS correlation with Rest-LAScd. METS was negatively correlated with Rest-LAScd. LASr, LA reservoir strain; METS, metabolic equivalents.
LV diastolic dysfunction includes insufficient or brady relaxation in the early stages of disease progression, and in advanced stages of disease, manifests mainly as reduced compliance and increased stiffness. These changes led to increased LV filling pressure and subsequently, may cause an increase in LA and pulmonary venous pressure. LA reservoir strain occurs during systole when the pulmonary veins fill the LA, thus causing the LA wall to stretch; this corresponds to LV isovolumic contraction and isovolumic relaxation. LA conduit strain occurs in the early diastolic period; when the mitral valve is opened, the LA blood content flows into the LV; this refers to the rapid filling period and the slow filling period which is regulated by LA compliance (LV relaxation and compliance). LA contraction strain is dependent on venous return and LV end-diastolic pressure [14, 15]. LAS alterations tend to progress between all stages of diastolic dysfunction. In particular, reservoir strain is significantly better than GLS and E/e’ and has been shown to predict cardiovascular events and represent a more accurate diagnostic tool to help classify diastolic dysfunction [16, 17, 18, 19, 20, 21, 22].
A previous systematic analysis and meta-evaluation of 2452 healthy subjects [23]
showed that the normal reference range for LA reservoir strain was 39% while
that of conduit strain was 23% and contraction strain was 17%. Our current
analysis yielded similar outcomes: the LA reservoir, conduit and contraction
strain were 44.39
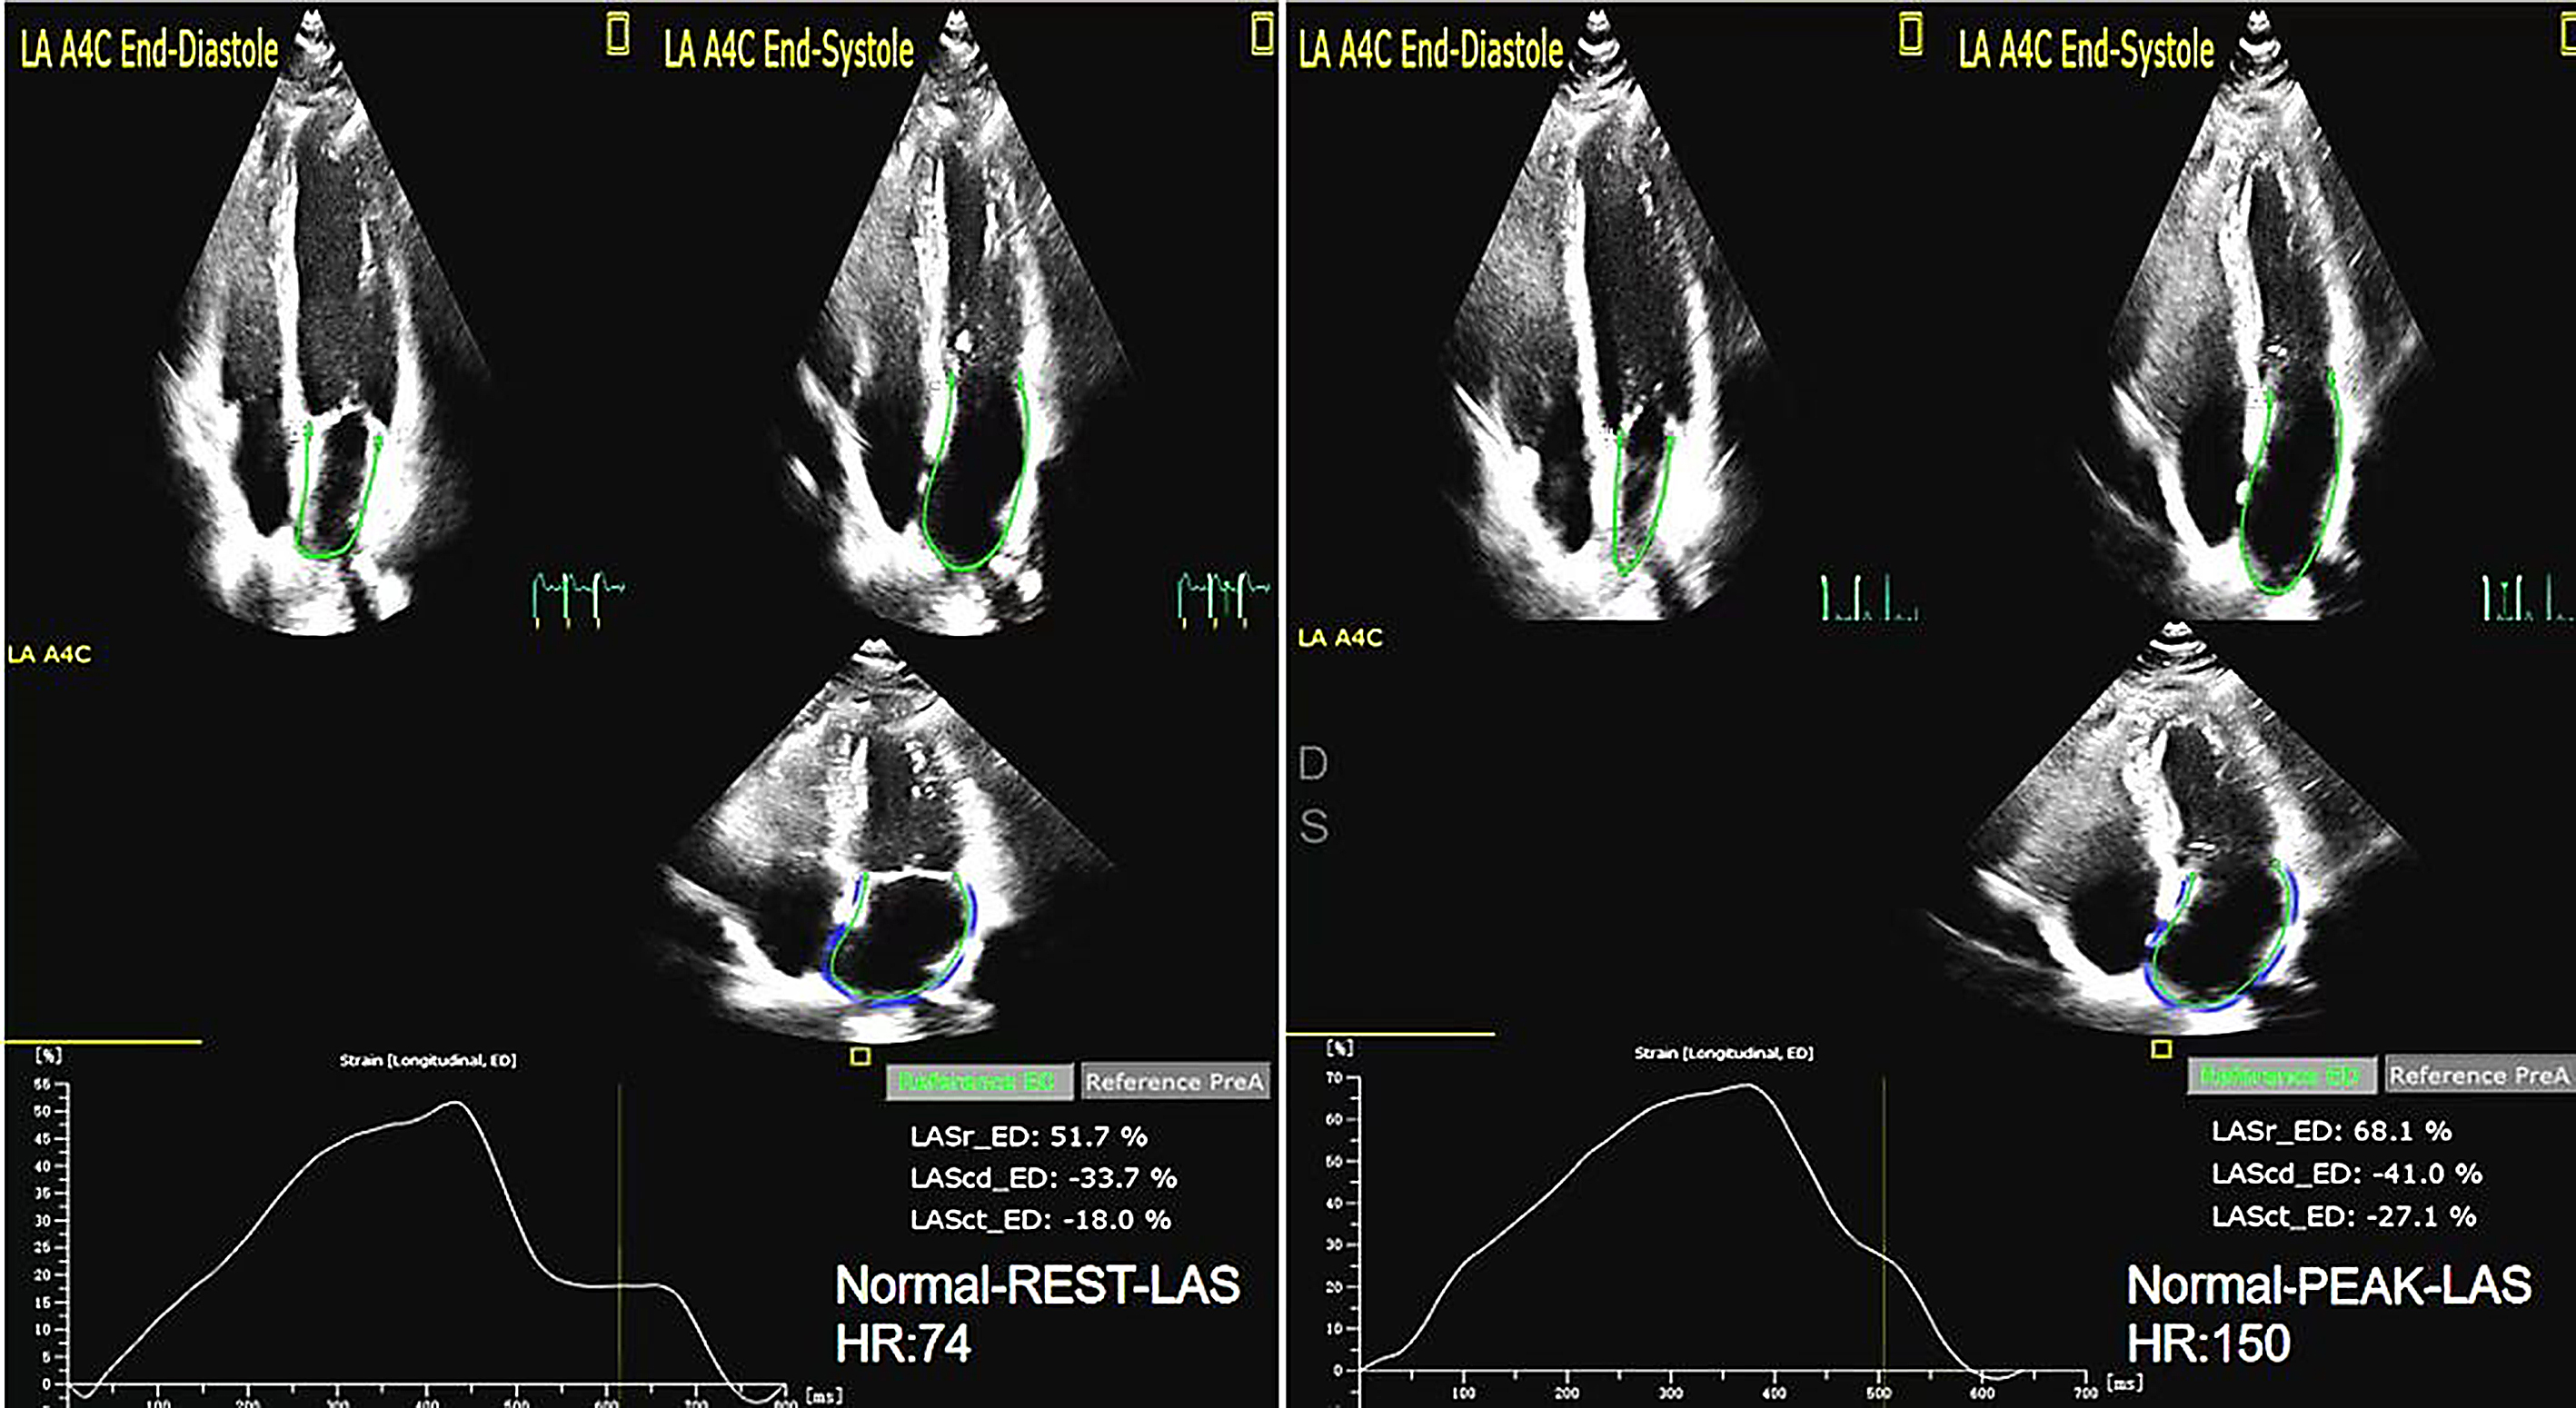 Fig. 6.
The LAS of rest and peak in Normal group. LAS, left atrial strain.
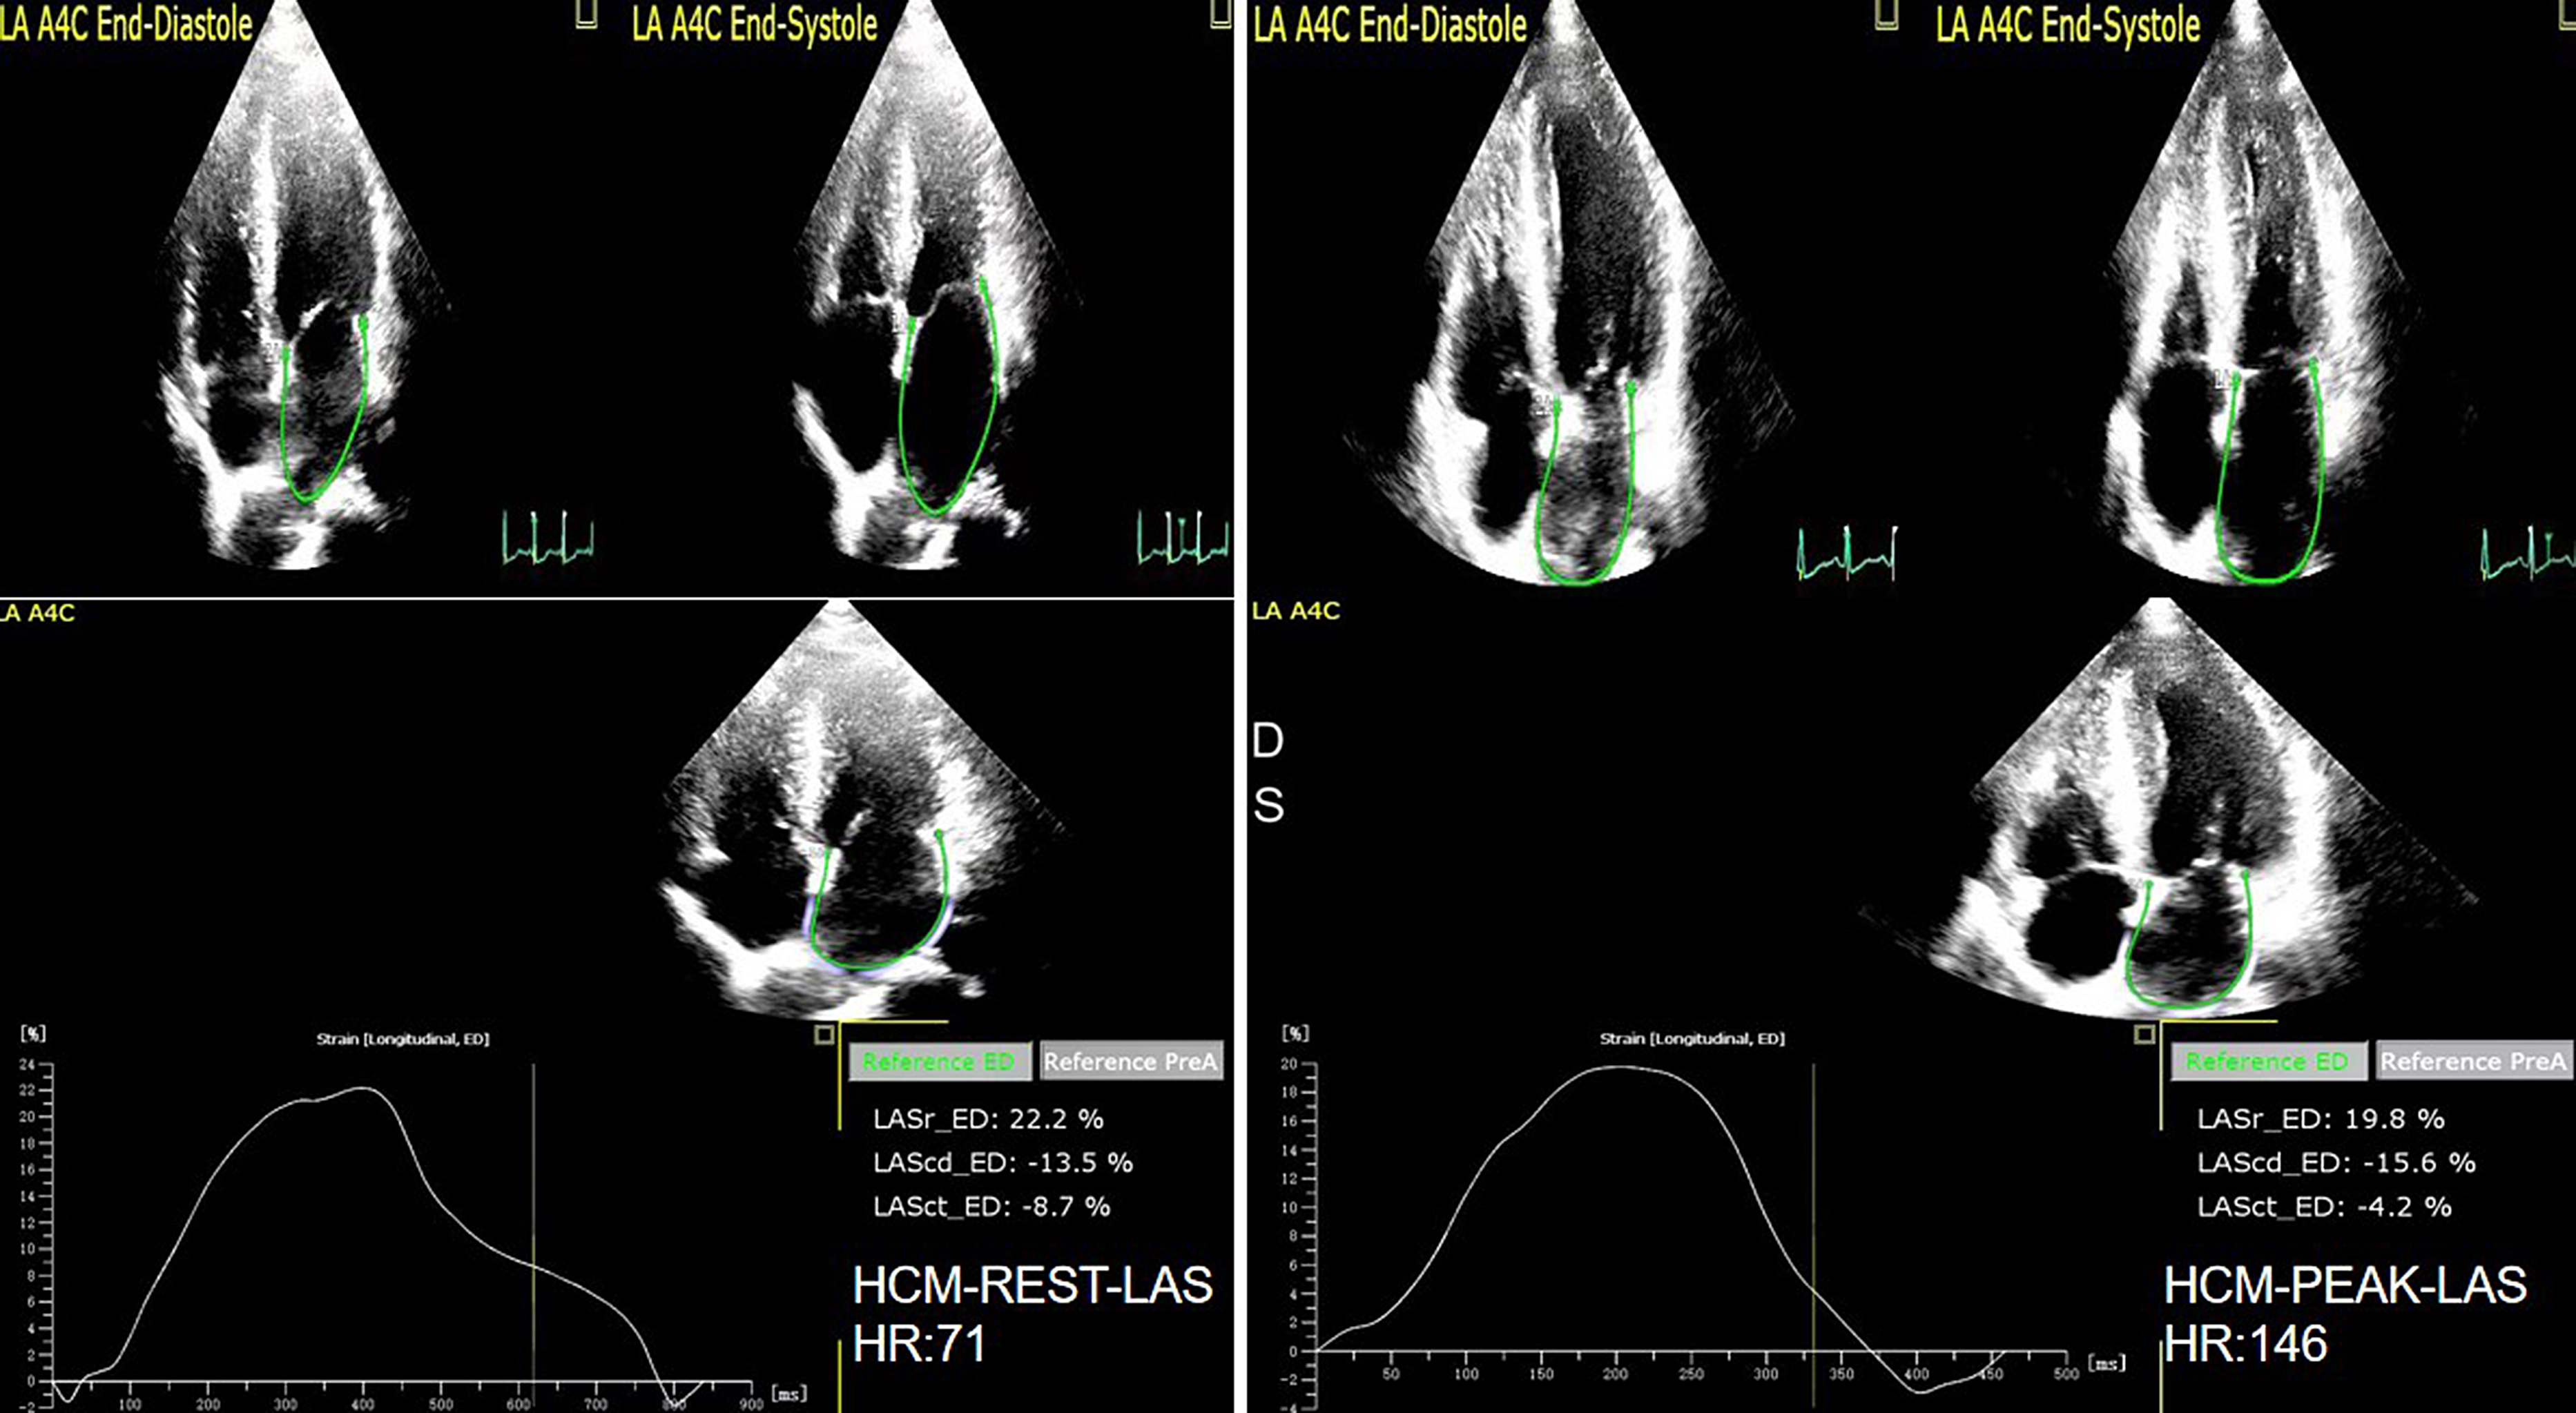 Fig. 7.
The LAS of rest and peak in HCM group. LAS, left atrial strain.
Patel et al. [27] showed that the lack of LA functional reserve and
reduced LV diastolic function were associated with reduced exercise capacity. In
the present study, we found that there was no statistical difference in the LA
reservoir strain, conduit strain, and GLS in the HCM-1 group when compared
between peak level and the rest stage. Moreover, there was no statistical
difference in LA reservoir strain or conduit strain in the HCM-2 group when
compared between peak level and the rest stage, thus indicating that the reserve
capacity of the LA reservoir, conduit, contraction strain and GLS were reduced in
both groups. It was also found that at rest and peak stages, the LA reservoir
strain and conduit strain in the HCM-2 group was higher than in the HCM-1 group.
In the HCM-2 and HCM-1 groups, the LA contraction strain reserve
(
In a previous study, Badran et al. [28] found that in a normal group,
the rest and peak HR were 82
We found that the EDV in the HCM group at rest and peak stages was higher than
in the normal group. Furthermore, the LV-GLS and LAS in the HCM group at the peak
stage were smaller than in the rest stage. Thus, from a mechanical point of view,
the peak myocardial contractility was reduced, therefore the EDV increased. In a
previous study, Wu et al. [29] study found that in a normal group, the
rest and peak LV-GLS were –20.8
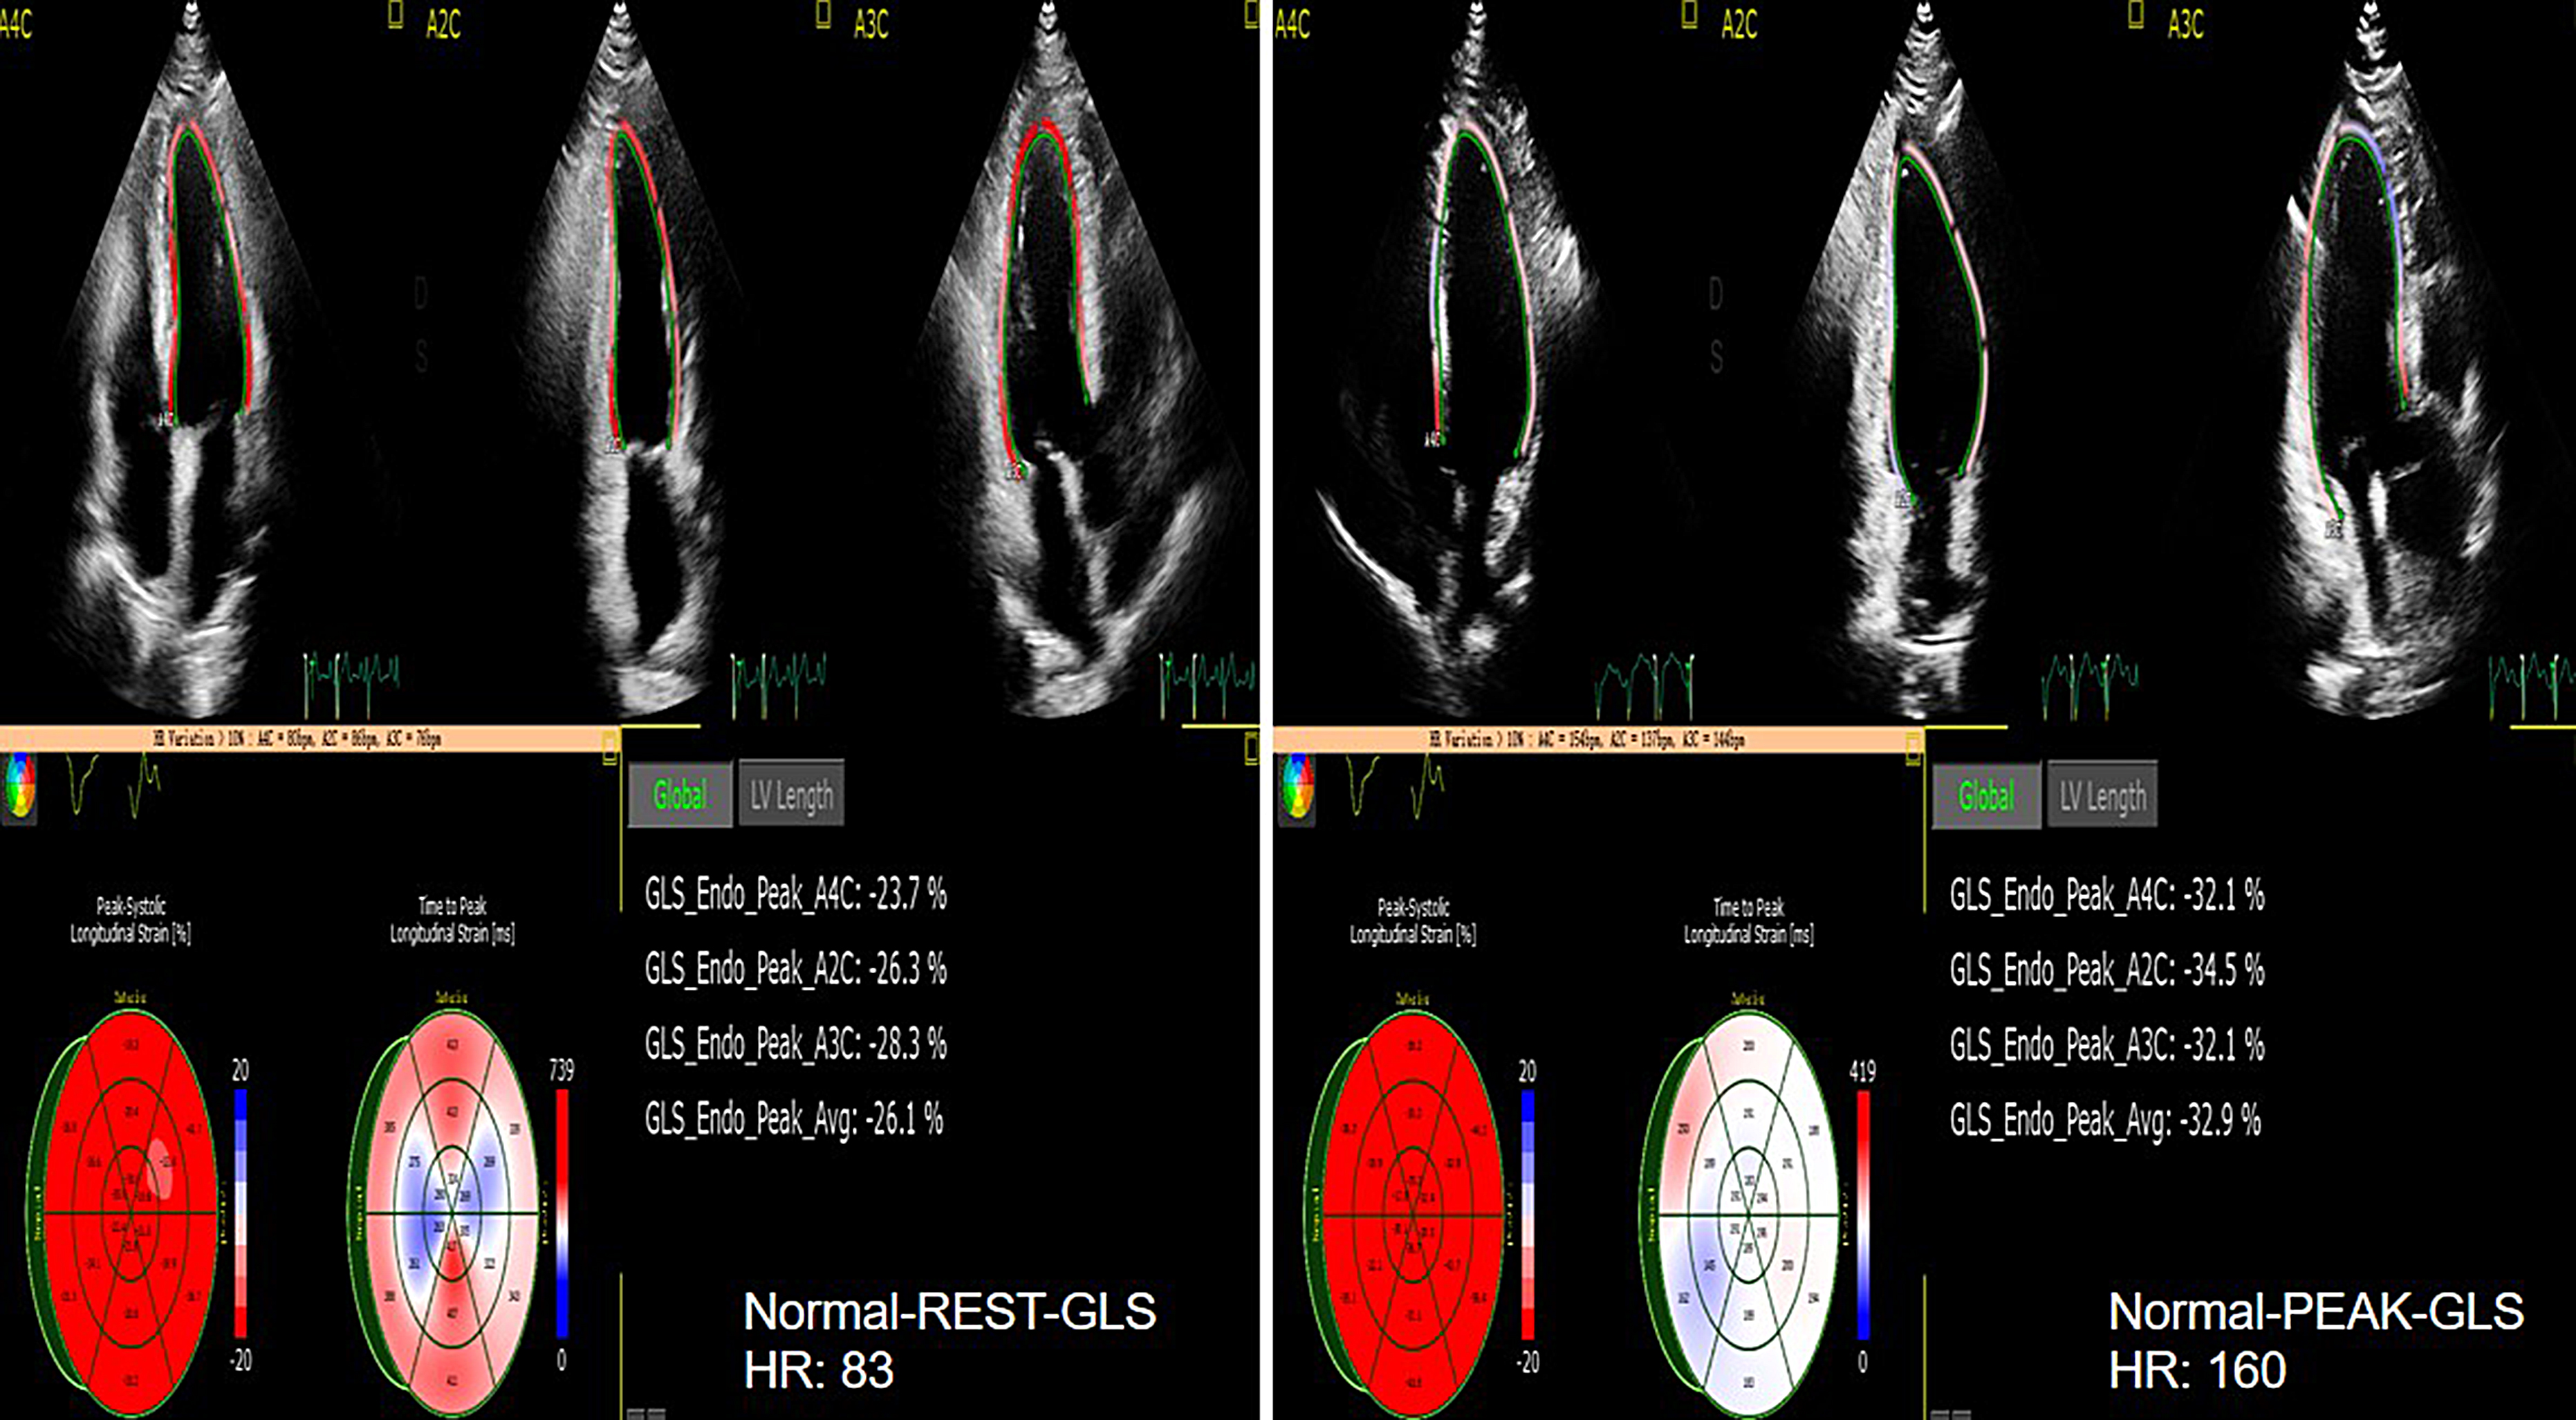 Fig. 8.
The GLS of rest and peak in normal group. GLS, LV global longitudinal strain.
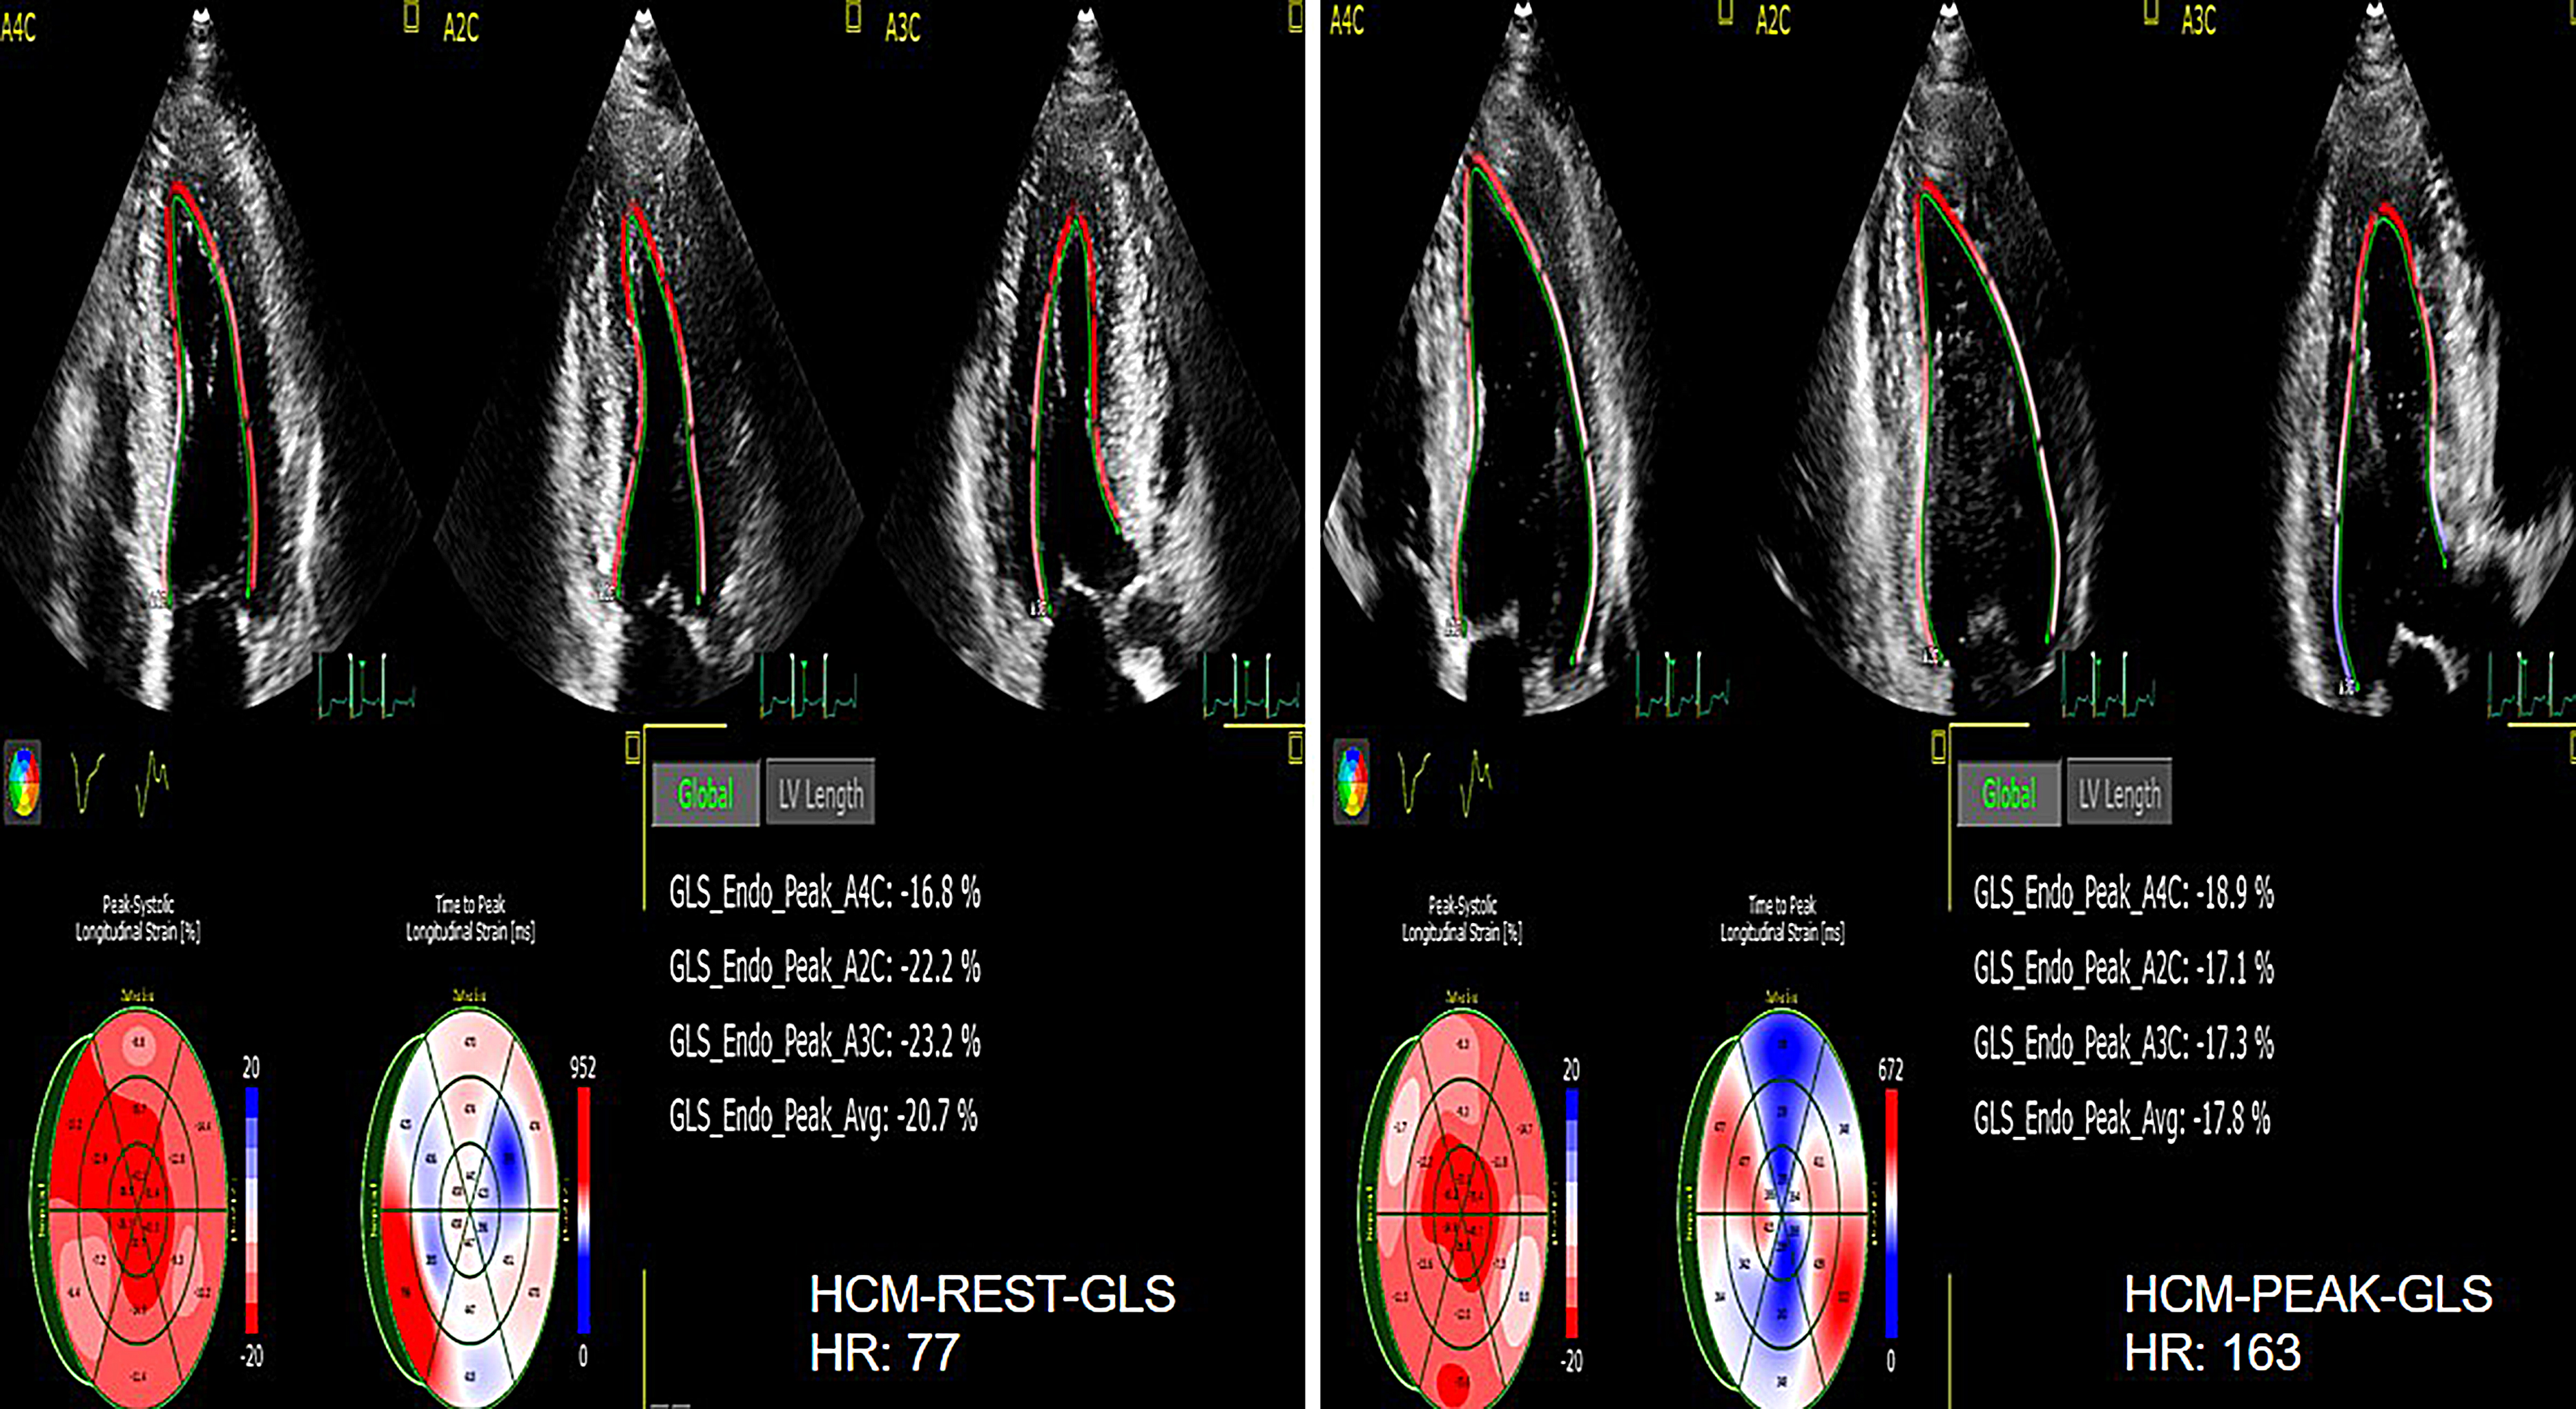 Fig. 9.
The GLS of rest and peak in HCM group. GLS, LV global longitudinal strain; HCM, hypertrophic cardiomyopathy.
As shown in Figs. 2,3 and Tables 6,7, the AUC for LaSr was 0.759 (sensitivity 0.833, specificity 0.6, cutoff value –16.91%) and had the greatest discriminatory value. However, the specificity of LaSr was low, although the sensitivity and AUC were high enough to reduce the chances of missed diagnosis. In this study, when the AUC of E/e’ was 0.757, the cutoff value was 17.06, at this time, the index E/e’ and the AUC cannot be used in patients with E/e’ between 8 and 14. Therefore, we need to add LASr into the model to assist clinical judgment. When Rest-LASr+E/e’-rest was used as the prediction model, the AUC was 0.800. Although E/e’ and LASr+E/e’ had similar AUC values (0.757 vs 0.800, p = 0.4386) (as shown in Fig. 10) , the technology and principle for obtaining E/e’ and LASr are different. E/e’ was obtained through pulsed wave-tissue Doppler imaging, this technique is angle dependent. In addition, E/e’ can be affected by valve and left ventricular outflow tract obstruction, and was limited in terms of clinical application [23]. LA strain is based on speckle tracking technology which can quantitatively evaluate mechanical function of the atrial myocardium by analyzing myocardial deformation and can analyze the working characteristics of the atrial myocardium in different cardiovascular diseases; furthermore, this parameter has been shown to have predictive value for the risk of adverse cardiovascular events. LASr can be accurately measured even in combination with valve disease, heart failure and arrhythmia; these conditions are more common in clinical diagnosis and treatment. Furthermore, speckle tracking echocardiography has become an increasingly standard imaging method in routine clinical practice [31]. Moreover, LASr is independent of LAV, LV-GLS, age, LVEF, and E/e’ [32]. Thus, when E/e’ lies between 8 and 14, the routine assessment of left atrial function can be an important strategy to supplement the current prediction models.
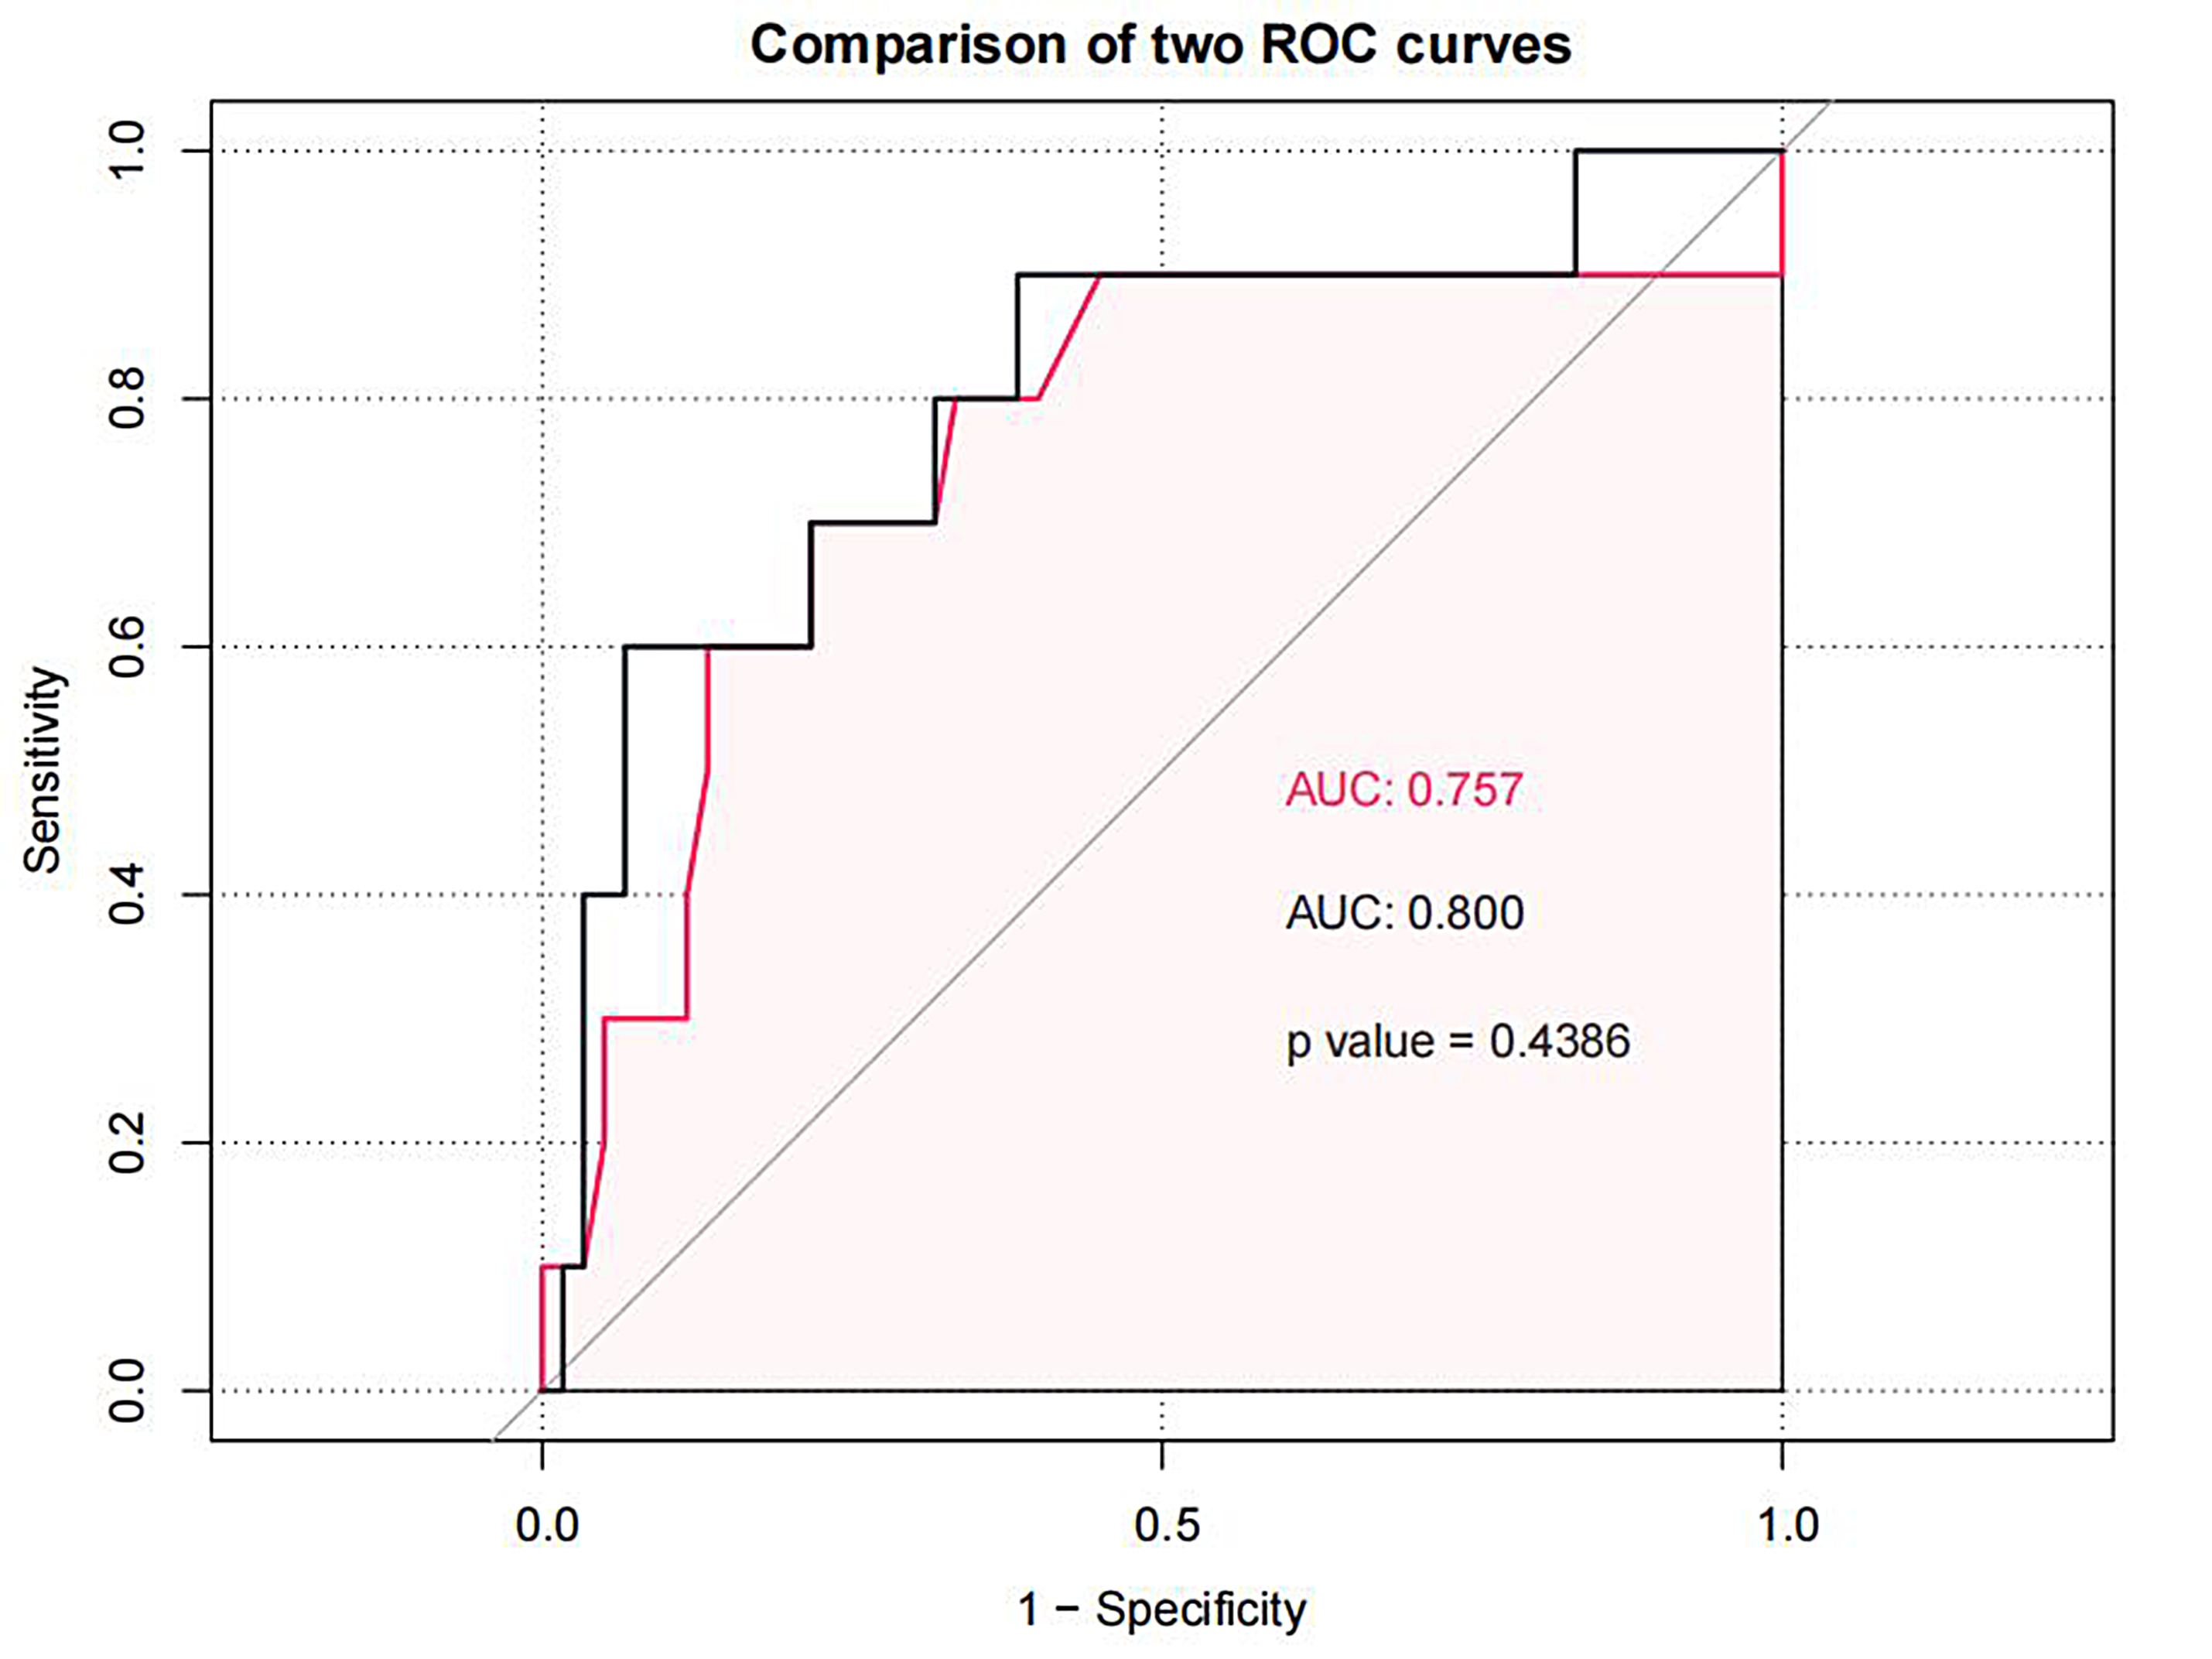 Fig. 10.
Comparison the AUC of E/e’ and LASr+E/e’. LASr, LA reservoir strain; E/e’, the ratio of early diastolic forward mitral flow velocity and early-diastolic mitral annular velocity.
In conclusion, analysis showed that when the E/e’ was between 8 and 14, the LAS and reserve capacity of HCM patients were significantly reduced. Our findings suggest that the routine assessment of LAS +E/e’ can be a strategy with which to supplement current predictive models and facilitate clinical management strategies.
This study was limited to a single center sample, and many simultaneous factors affected METS, such as systemic inflammation, endothelial dysfunction, changes in intracellular and extracellular structures of cardiomyocytes, skeletal muscle bioenergetics, pulmonary functional status, mitral and tricuspid regurgitation, left ventricular outflow tract obstruction,etc, the pathophysiological changes of HCM may result in the above problems, which we did not refine analysis. At the same time, due to the different algorithms of the analysis software of different ultrasonic diagnostic instruments, the measurement results of LAS will be affected. It may be necessary to further expand the sample size and expand the ultrasonic diagnostic instrument model and analysis software to analyze LAS and METS in HCM patients, and follow-up to observe the occurrence of cardiovascular events in HCM patients. Another factor to consider is that the assessment of exercise tolerance was only based on METS. Other indices, such as the maximal oxygen consumption and the minute ventilation/carbon dioxide production slope, were not used. The original purpose of this study was to focus on the “grey uncertain population” with an E/e of 8–14 in order to quickly and accurately assist in the judgement of cardiac diastolic function and to predict exercise tolerance; thus, we considered METS as the short-term result. In clinical work, if it is necessary to predict the exercise tolerance but the patient cannot perform exercise tests (due to disability or other reasons), we can also consider using the LASr+E/e’ model to estimate the exercise tolerance in an approximate manner and provide a basis for clinical treatment decisions. Of course, we are also continuing to follow-up these patients and continue to observe long-term cardiovascular events for further detailed research reports.
The data used to support the findings of this study are available from the author upon request.
Contributions: (I) Conception and design—YS, LY, CL; (II) Administrative support—LY, CL; (III) Provision of study materials or patients—YS; (IV) Collection and assembly of data—YS; (V) Data analysis and interpretation—YS; (VI) Manuscript writing—All authors; (VII) Final approval of manuscript—All authors.
The retrospective research was approved by the Medical Ethics Committee of Sichuan Academy of Medical Sciences and Sichuan Provincial People’s Hospital (approval No.185). All procedures performed in this study involving human participants were in accordance with the Declaration of Helsinki (as revised in 2013). All procedures strictly followed the protection of patient privacy and all data were anonymized in the study. All patients signed informed consent forms.
Not applicable.
This work was supported by the Fundamental Research Funds for the Central Universities [Grant Number: ZYGX2020ZB038].
The authors declare no conflict of interest.
Publisher’s Note: IMR Press stays neutral with regard to jurisdictional claims in published maps and institutional affiliations.