
- Academic Editor
†These authors contributed equally.
Background: The prognostic value of coronary artery calcium (CAC)
combined with risk factor burdens in middle-aged and elderly patients with
symptoms is unclear. Methods: A cohort study comprising 7432 middle-aged
and elderly symptomatic patients (aged above 55 years) was conducted between
December 2013 and September 2020. All patients had undergone coronary computed
tomography angiography, and the Agatston score were used to measure CAC scores.
The primary outcome was major adverse cardiac and cerebrovascular events (MACCE),
which was defined as a composite outcome of nonfatal myocardial infarction,
revascularization (percutaneous coronary intervention or coronary artery bypass
graft), stroke, and cardiovascular death. Congestive heart failure, cardiogenic
shock, malignant arrhythmia, and all-cause mortality were defined as the
secondary outcomes. Results: There are 970 (13%) patients with CAC
0–10, 2331 (31%) patients with CAC 11–100, and 4131 (56%) patients with CAC
Cardiovascular disease (CVD) is a major contributor to the worldwide disease burden with a high mortality and disability rate [1]. Cardiovascular diseases include coronary artery disease (CAD), stroke, and peripheral arterial disease [2], wherein CAD is the major contributor to CVD [3]. As the world population is rapidly aging, CVD is becoming more prominent. The 2021 Chinese population census revealed that 17.8% of the population was composed of middle-aged and elderly individuals. As CAD majorly affects the older generation, earlier detection of CAD in the middle-aged and elderly population is crucial [4]. Coronary artery disease is positively and independently linked with the various traditional risk factors, i.e., smoking, diabetes, and obesity [5, 6, 7]. At present, the Chinese population’s exposure to risk factors is universal. For example, the prevalence of hypertension, diabetes, and dyslipidemia was as high as 46.4% in 2018, 10.9% in 2013, and 40.4% in 2012 respectively, compared to 27.9% in 2015, 0.67% in the 1980s, and 18.6% in 2002 [8, 9]. In 2015, 52.1% of Chinese men and 2.7% of women smoked and the total number of smokers was 316 million [10]. It is unfortunate that the existing risk factors are inadequate to provide an accurate prognosis for CVD patients, necessitating further indicators [11].
Coronary computed tomography angiography (CTA) has become a popular imaging technique to diagnose CAD [12, 13]. Moreover, it serves as an important risk stratification tool, especially for symptomatic patients diagnosed with CAD. Coronary CTA can not only identify the coronary plaque features linked to Acute Coronary Syndromes (ACS), but it can also calculate the coronary plaque score. Coronary plaques with ACS had a higher fibro-fatty content and a larger necrotic core volume. Cardiovascular risk rises when fibro-fatty content and necrotic core volume rise [14]. Coronary plaque score included (1) segmental stenosis score; (2) segmental involvement score; (3) plaque score of 3 vessels [15]. Its various advantages include its ability to obtain high-precision results and non-invasive methodology. When performing coronary CTA, the coronary artery calcium (CAC) score, as well as the presence and absence of coronary stenosis, are commonly obtained. Several studies have suggested that CAC can be utilized to evaluate the risk and outcomes of CAD [16, 17, 18]. A high CAC score is linked to a higher risk of cardiovascular events, whereas a low CAC score indicates a lower risk of cardiovascular events. Therefore, coronary CTA has been utilized to determine and classify an individual’s probability of developing CAD. Noticeably, when CAC is united with hematological indices or radiographic indicators, such as high-sensitivity C-reactive protein, low density lipoprotein cholesterol (LDL-C), and pericardial adipose tissue could increase its capacity to predict cardiovascular events [19, 20, 21]. It has been reported that certain risk factors, including body mass index, LDL-C, and smoking, are associated with increased CAC levels [22] and subsequently, a higher occurrence of cardiovascular events [23]. Nevertheless, there have been only a handful of studies that have investigated the relevance of CAC in combination with risk factors. The results of the preceding investigation suggest that CAC combined with other risk factors could improve the assessment of CAD risk in young patients [24]. To our knowledge, there has been no previous studies have focused on utilizing CAC in combination with risk factors to predict prognosis of symptomatic middle-aged and elderly patients.
In this study, we investigated the association between CAC and CAD risk factors and explored the prognostic value of CAC combined with risk factors in symptomatic middle-aged and elderly patients.
Data were obtained from the First Affiliated Hospital of Xinjiang Medical University. Between December 27, 2013, and September 30, 2020, a total of 12,904 symptomatic patients showing signs of CAD were continuously enrolled. The main symptoms of CAD are typical angina or atypical symptoms such as exertional dyspnea or episodes of chest pain at rest, which patients with CAD often experienced. All patients had undergone CTA with symptoms of suspected CAD as a first-line diagnostic imaging and had not received percutaneous coronary intervention (PCI) or coronary artery bypass graft (CABG). Patients with a history of PCI, CABG surgery, tumor, skin disease, immune disease, stroke, pulmonary embolism, infection status, and incomplete outcome data were excluded. The study was approved by the First Affiliated Hospital of Xinjiang Medical University institutional review board (K202106-02), and written informed consent was obtained from all the enrolled patients.
Those CTA were uniformly acquired by using multi-detector row computed
tomography (CT) scanners consisting of 64-rows or greater (Somatom Definition or
Somatom Definition Flash, Siemens Healthcare, Forchheim, Germany). CAC scores was
calculated using Agatston’s scoring system. CAC scores were categorized into the
following groups: 0–10, 11–100, and
Prior to the vascular test, the patients had to stay in a reclined position for
at least five minutes to maintain stable heart rate values. During coronary CTA
acquisition, iodinated contrast (0.8 mL/kg) was delivered intravenously at a
steady rate of 4–8 mL/s, with an intravascular contrast agent residence period
of no less than 12 s followed by a 30–40 mL saline flush. Stenosis severity was
categorized using the quantitative stenosis grading recommended by the Society of
Cardiovascular Computed Tomography guidelines [28], it was classified as none
(0% luminal stenosis), non-obstructive (1–49% luminal stenosis), or
obstructive (
The degree of coronary stenosis was classified as normal (no coronary stenosis),
nonobstructive CAD (lesions
The following risk factors for coronary artery disease were considered: (1)
current smoking status; (2) lipid status, i.e., total cholesterol levels
Clinical data were obtained through telephonic follow-ups. A total of 803 patients were lost at follow-up, after reviewing the medical records, these patients had no record of re-visits in our hospital. Participants were followed up every 6–12 months for endpoint events. All patients were tracked till April 30, 2021. All occurrences were documented to determine the vessel-related clinical events. All adverse events were assessed by two experienced cardiologists, and if there was any discrepancies, a third physician was consulted to ensure the data was reliable. The primary outcome was major adverse cardiac and cerebrovascular events (MACCE), which was defined as a composite outcome of nonfatal myocardial infarction, revascularization (PCI and CABG), stroke, and cardiovascular death. The secondary outcomes were congestive heart failure, cardiogenic shock, malignant arrhythmia, and all-cause mortality. Unless an unmistakable non-cardiovascular cause was identified, all deaths were classified as cardiovascular deaths. Diagnosis of myocardial infarction was based on the fourth universal definition of myocardial infarction [29].
SPSS22 software (IBM Corp., Armonk, NY, USA), STATA version 16.0 software (Stata Corp, College Station, Texas, USA), and R programming language version 3.3.1 (R Foundation for Statistical Computing, Vienna, Austria) were used to perform statistical analysis. The baseline characteristics were outlined with median and interquartile ranges for continuous variables. and counts and percentages for categorical variables. Multivariable adjusted odds ratios (ORs) were used to assess the relationship between independent risk factors and CAC. The analyses were adjusted for age, sex, smoking, total cholesterol, triglyceride, LDL, HDL, systolic blood pressure, diastolic blood pressure, diabetes mellitus, and family history of CAD. In addition, we formed four groups based on the number of CAD risk factors (These risk factors have been enlisted and defined in the ‘CAD risk factors’ subsection). We analyzed the correlation between the number of risk factors and CAC utilizing unadjusted ORs and ORs that had been adjusted for age- and gender.
The log-rank test was used to evaluate the significance of the difference in survival for each age group and CAC group. We calculated the MACCE rate per 1000 person-years (with 95% CI) based on CAC groups with stratification by the number of risk factors and age groups. The MACCE rate per 1000 person-years (with 95% CI) based on stenosis with a luminal cross-sectional area was also assessed and was stratified by different age groups. The incidence rate ratio was calculated using the Poisson regression 1000 person-years approach to derive the relative risks. The nomogram was created using the RMS (Root Mean Square) package of R software, version 3.3.1 (R Foundation for Statistical Computing, Vienna, Austria). For MACCE prediction, ROC (Receiver Operating Characteristic) curve analysis was used to determine the optimal cutoff value of cardiovascular risk prediction model. Sensitivity, specificity, positive likelihood ratio (positive LR), negative likelihood ratio (negative LR), positive predictive value (PPV), negative predictive value (NPV), and diagnostic accuracy were determined from the optimal threshold by the Youden index.
The study flow chart is presented in Fig. 1. A total of 7432 symptomatic
patients were enrolled into the study. The baseline characteristics of those
patients are shown in Table 1. The median age was 67 years (interquartile range
[IQR]: 61–73 years). The number of patients with CAC 0–10 was 970 (13%, CAC
11–100 was 2331 (31%), and CAC
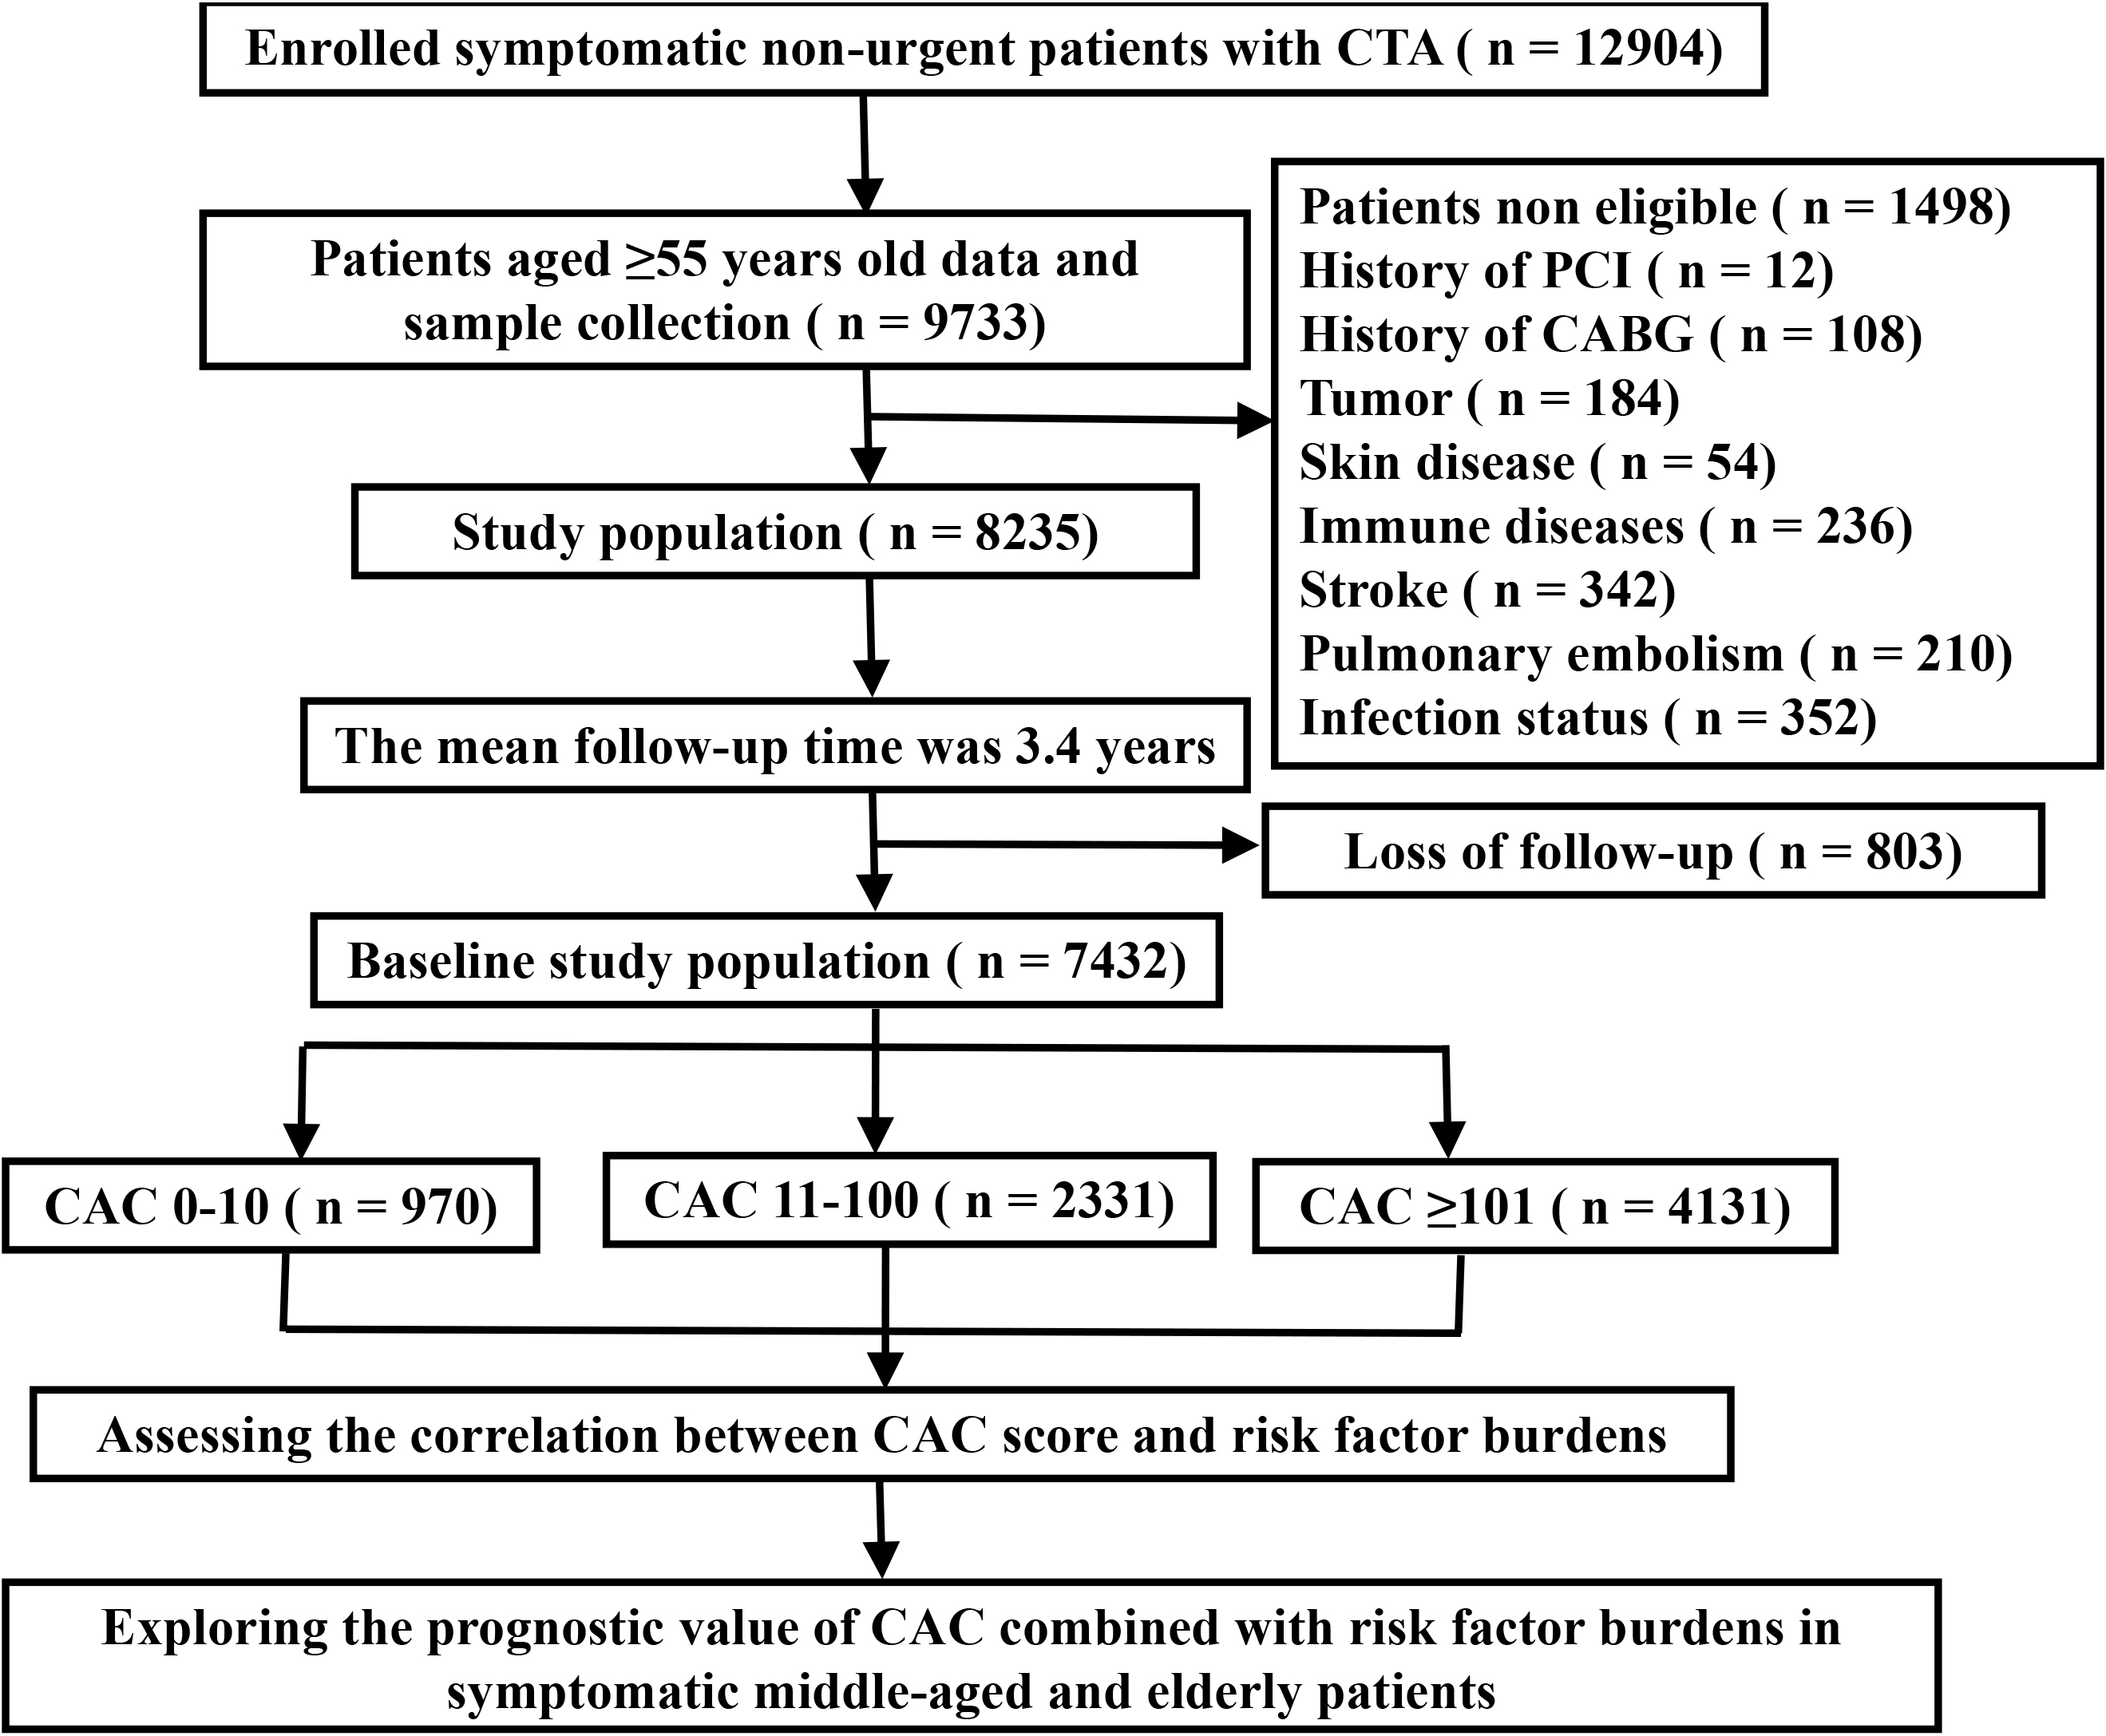 Fig. 1.
Flow chart of the study procedure. CTA, computed tomography angiography; PCI, percutaneous coronary intervention; CABG, coronary artery bypass graft; CAC, coronary artery calcium.
| All | CAC 0–10 | CAC 11–100 | CAC |
p value | ||
|---|---|---|---|---|---|---|
| Participants | 7432 (100) | 970 (13) | 2331 (31) | 4131 (56) | ||
| Female | 3773 (40) | 480 (49) | 974 (42) | 1501 (36) | ||
| Age, years | 67 (61–73) | 64 (59–70) | 65 (60–72) | 69 (62–75) | ||
| 65 years |
3028 (41) | 515 (53) | 1105 (47) | 1408 (34) | 0.049 | |
| 75 years |
2838 (38) | 330 (34) | 854 (37) | 1654 (40) | ||
| age |
1566 (21) | 125 (13) | 372 (16) | 1069 (26) | 0.004 | |
| Current smoking | 2122 (29) | 210 (22) | 630 (27) | 1282 (31) | ||
| Plasma parameters | ||||||
| TC | 4 (3.2–4.7) | 4.2 (3.4–4.9) | 4.1 (3.4–4.8) | 3.8 (3.1–4.6) | ||
| TG | 1.5 (1.1–2.2) | 1.5 (1.0–2.2) | 1.5 (1.1–2.3) | 1.5 (1.1–2.2) | 0.018 | |
| LDL–C | 2.6 (1.9–3.3) | 2.8 (2.0–3.3) | 2.7 (2.1–3.3) | 2.5 (1.9–3.2) | ||
| HDL–C | 1.1 (0.9–1.3) | 1.1 (1.0–1.4) | 1.1 (0.9–1.4) | 1.1 (0.9–1.3) | ||
| SBP, mmHg | 130 (120–140) | 126 (119–140) | 130 (120–140) | 130 (120–130) | 0.039 | |
| DBP, mmHg | 77 (70–81) | 77 (70–82) | 77 (70–83) | 76 (70–80) | ||
| BMI, kg/m |
25.7 (23.5–28.1) | 25.6 (23.4–28.5) | 25.6 (23.5–28.1) | 25.8 (23.5–28.1) | 0.851 | |
| Diabetes mellitus | 2446 (33) | 247 (25) | 682 (29) | 1517 (37) | ||
| Family history of CAD | 872 (12) | 116 (12) | 280 (12) | 476 (12) | 0.545 | |
| CAC | 134 (31.8–439.3) | 3 (1.2–6) | 42.4 (23–66.7) | 379.6 (197.4–827.1) | ||
| Medication history | ||||||
| Antiplatelet aggregation | 3044 (41) | 366 (38) | 887 (38) | 1791 (43) | 0.002 | |
| CRM | 3803 (51) | 494 (51) | 1149 (49) | 2160 (52) | 0.068 | |
| CCB | 1841 (25) | 228 (24) | 598 (26) | 1015 (25) | 0.387 | |
| ACEI/ARB | 1872 (25) | 227 (23) | 592 (25) | 1053 (25) | 0.388 | |
| Nitroglycerin | 484 (7) | 46 (5) | 136 (6) | 299 (17) | 0.008 | |
| Beta–blocker | 2244 (30) | 288 (30) | 674 (29) | 1282 (31) | 0.191 | |
Values are n (%), %, or median (interquartile range), TC, total cholesterol; TG, triglyceride; LDL–C, low-density lipoprotein cholesterol; HDL–C, high-density lipoprotein cholesterol; SBP, systolic blood pressure; DBP, diastolic blood pressure; BMI, body mass index; CAC, coronary artery calcium; CAD, coronary artery disease; ACEI, angiotensin converting enzyme inhibitors; ARB, angiotensin receptor blockers; CRM, cholesterol-reducing medication; CCB, calcium-channel blocker.
The percentage of CAC
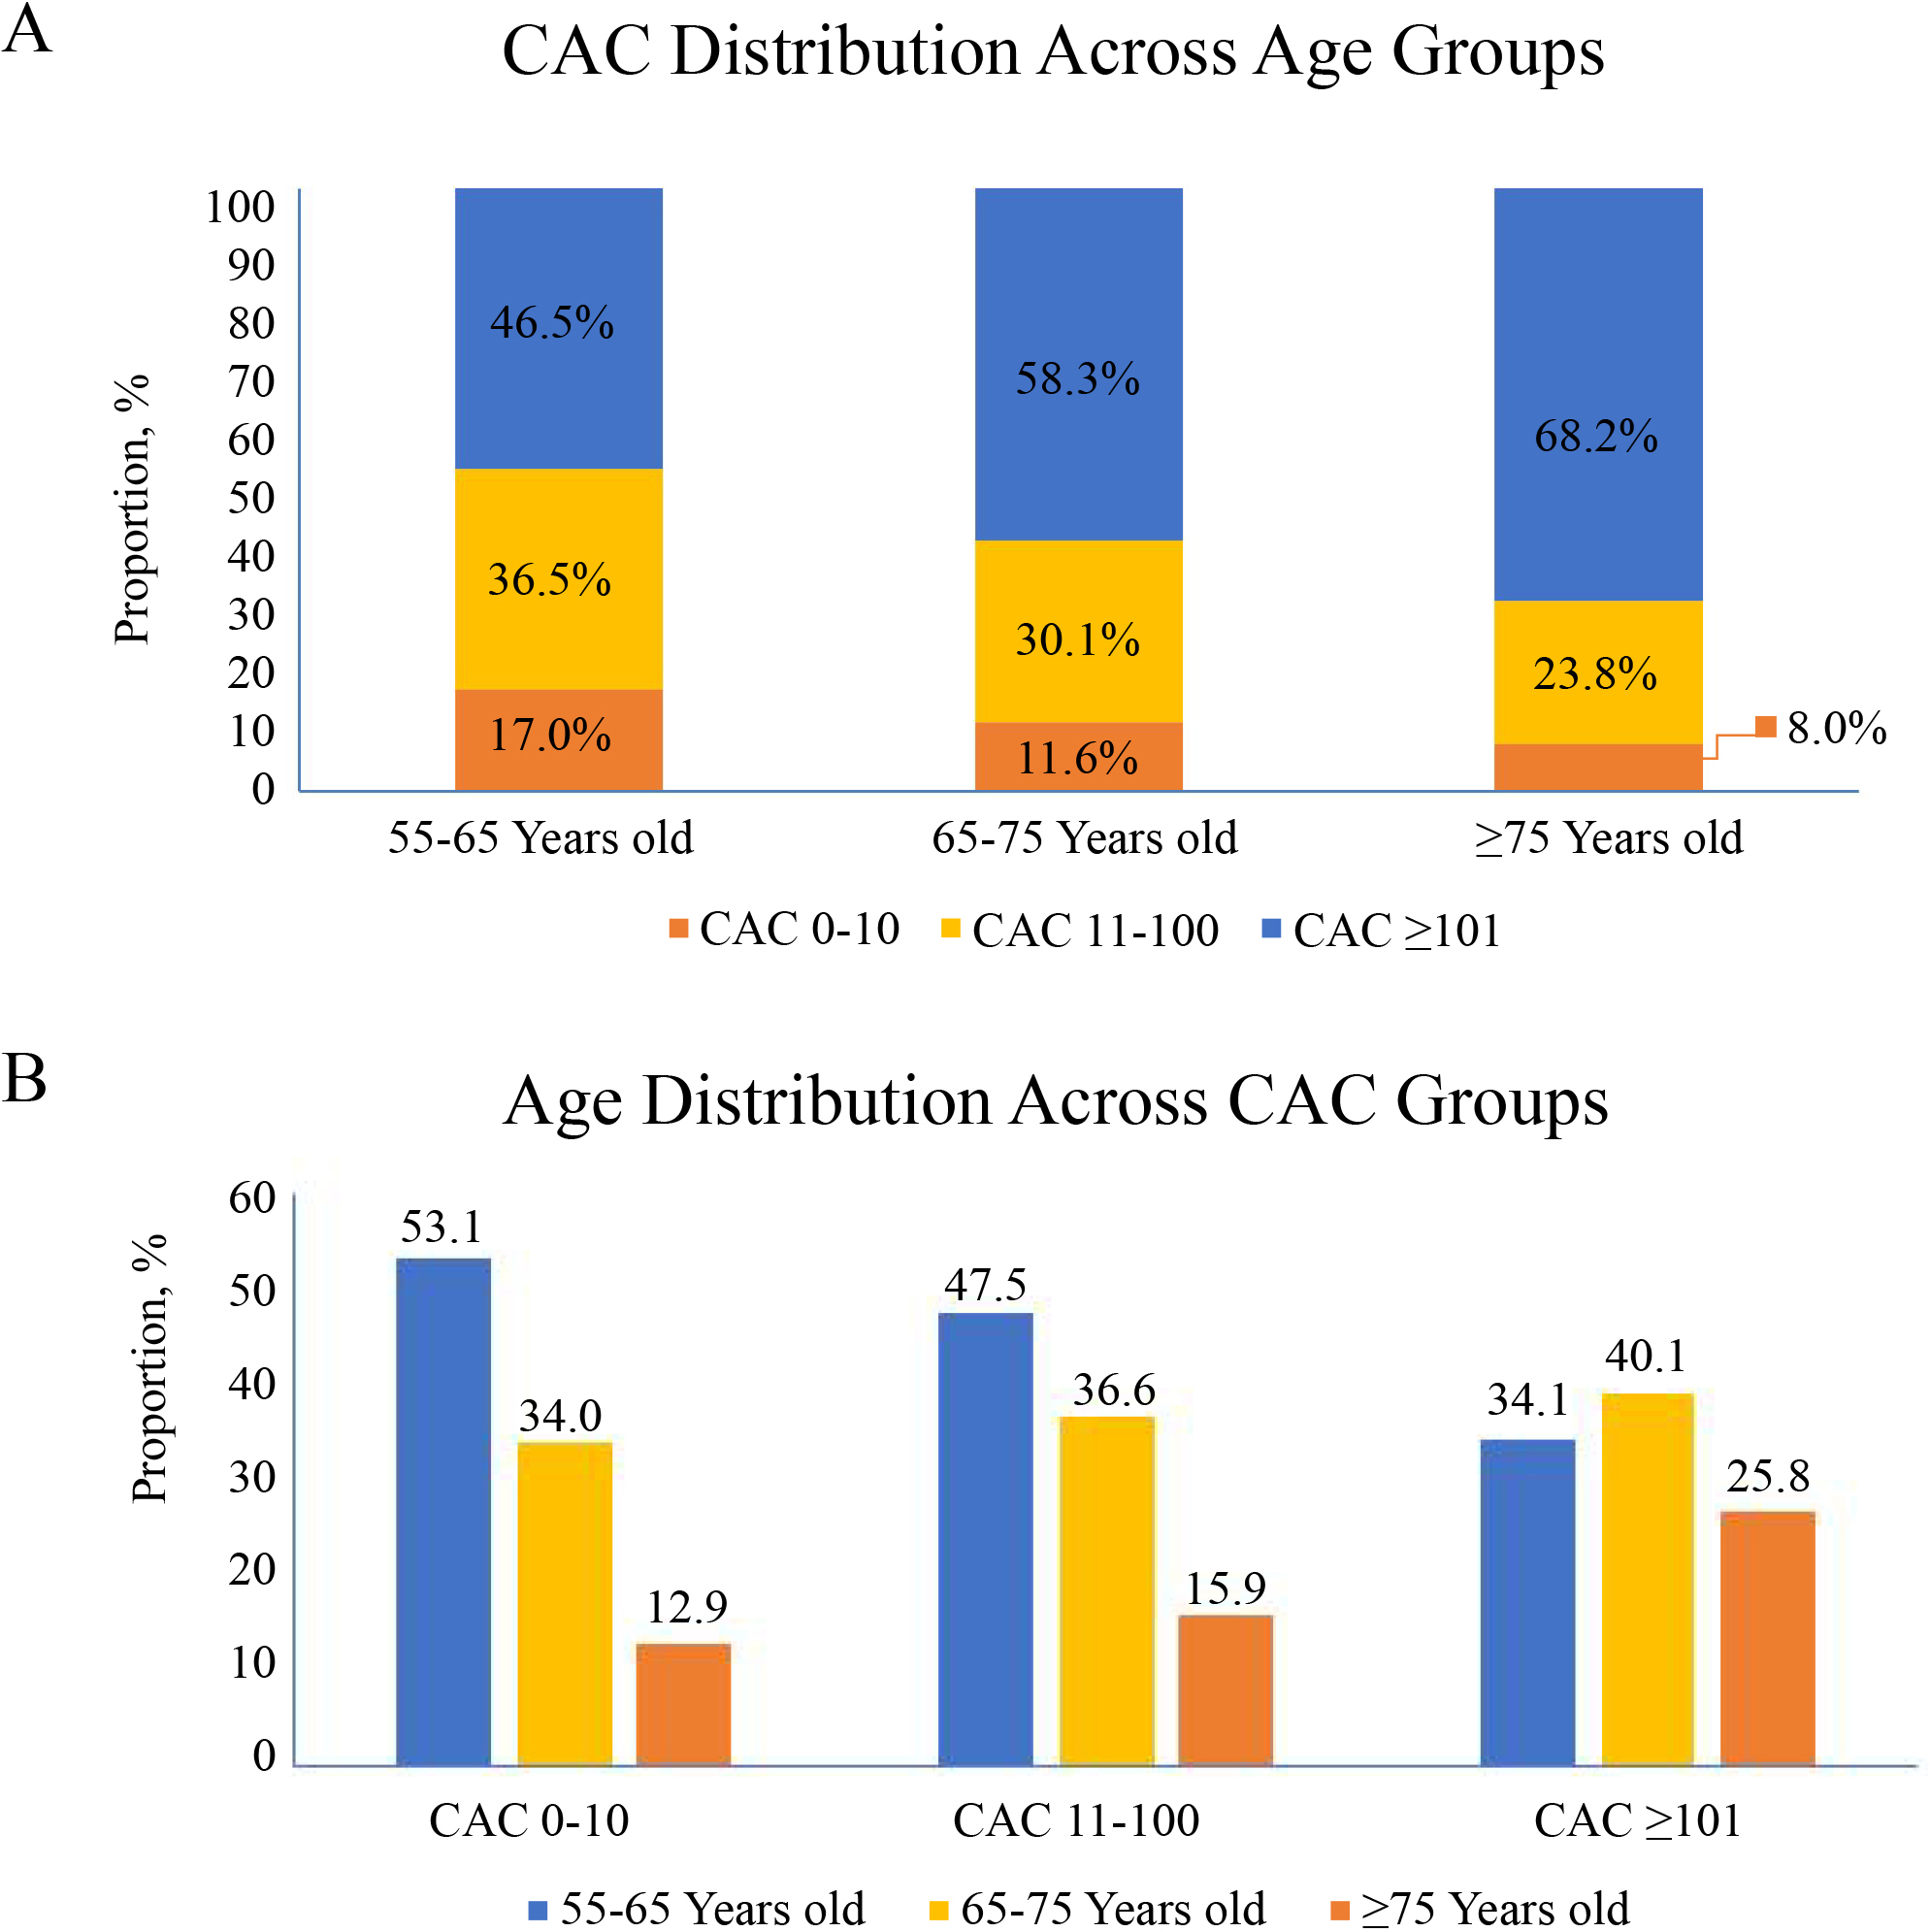 Fig. 2.
Different age proportions in different CAC score groups in
middle-aged and elderly patients (
Older age, LDL-C, and diabetes mellitus (DM) were the risk factors for the
higher CAC scores, in comparison to the lower CAC scores (all ORs
| CVD risk factors | CAC |
p value | CAC 0–10 versus CAC |
p value | CAC 11–100 versus CAC |
p value |
|---|---|---|---|---|---|---|
| Age | 2.291 (1.621–3.238) | 2.896 (2.032–4.127) | 1.944 (1.564–2416) | |||
| Female | 0.685 (0.521–0.899) | 0.006 | 0.607 (0.456–0.808) | 0.001 | 0.759 (0.621–0.929) | 0.008 |
| Smoking | 1.173 (0.876–1.570) | 0.285 | 1.202 (0.889–1.626) | 0.232 | 1.073 (0.877–1.313) | 0.492 |
| TC | 0.561 (0.374–0.842) | 0.005 | 0.408 (0.258–0.645) | 0.648 (0.463–0.907) | 0.011 | |
| TG | 1.004 (0.793–1.271) | 0.976 | 1.016 (0.791–1.303) | 0.903 | 0.969 (0.815–1.151) | 0.715 |
| LDL–C | 1.697 (1.051–2.739) | 0.031 | 2.299 (1.350–3.913) | 0.002 | 1.446 (1.003–2.086) | 0.048 |
| HDL–C | 0.807 (0.581–1.120) | 0.200 | 0.783 (0.551–1.112) | 0.172 | 0.893 (0.686–1.162) | 0.400 |
| SBP | 0.997 (0.990–1.004) | 0.403 | 0.996 (0.989–1.003) | 0.282 | 0.997 (0.992–1.002) | 0.198 |
| DBP | 1.075 (0.728–1.588) | 0.717 | 0.957 (0.635–1.442) | 0.833 | 0.721 (0.549–0.946) | 0.018 |
| BMI | 1.002 (0.973–1.033) | 0.879 | 1.000 (0.969–1.032) | 0.990 | 0.993 (0.971–1.015) | 0.517 |
| DM | 1.462 (1.143–1.870) | 0.003 | 1.723 (1.333–2.226) | 1.501 (1.262–1.786) | ||
| FH of CAD | 0.943 (0.697–1.277) | 0.705 | 0.868 (0.631–1.194) | 0.384 | 0.939 (0.748–1.179) | 0.586 |
DM, diabetes mellitus; FH, family history; other abbreviations as in Table 1.
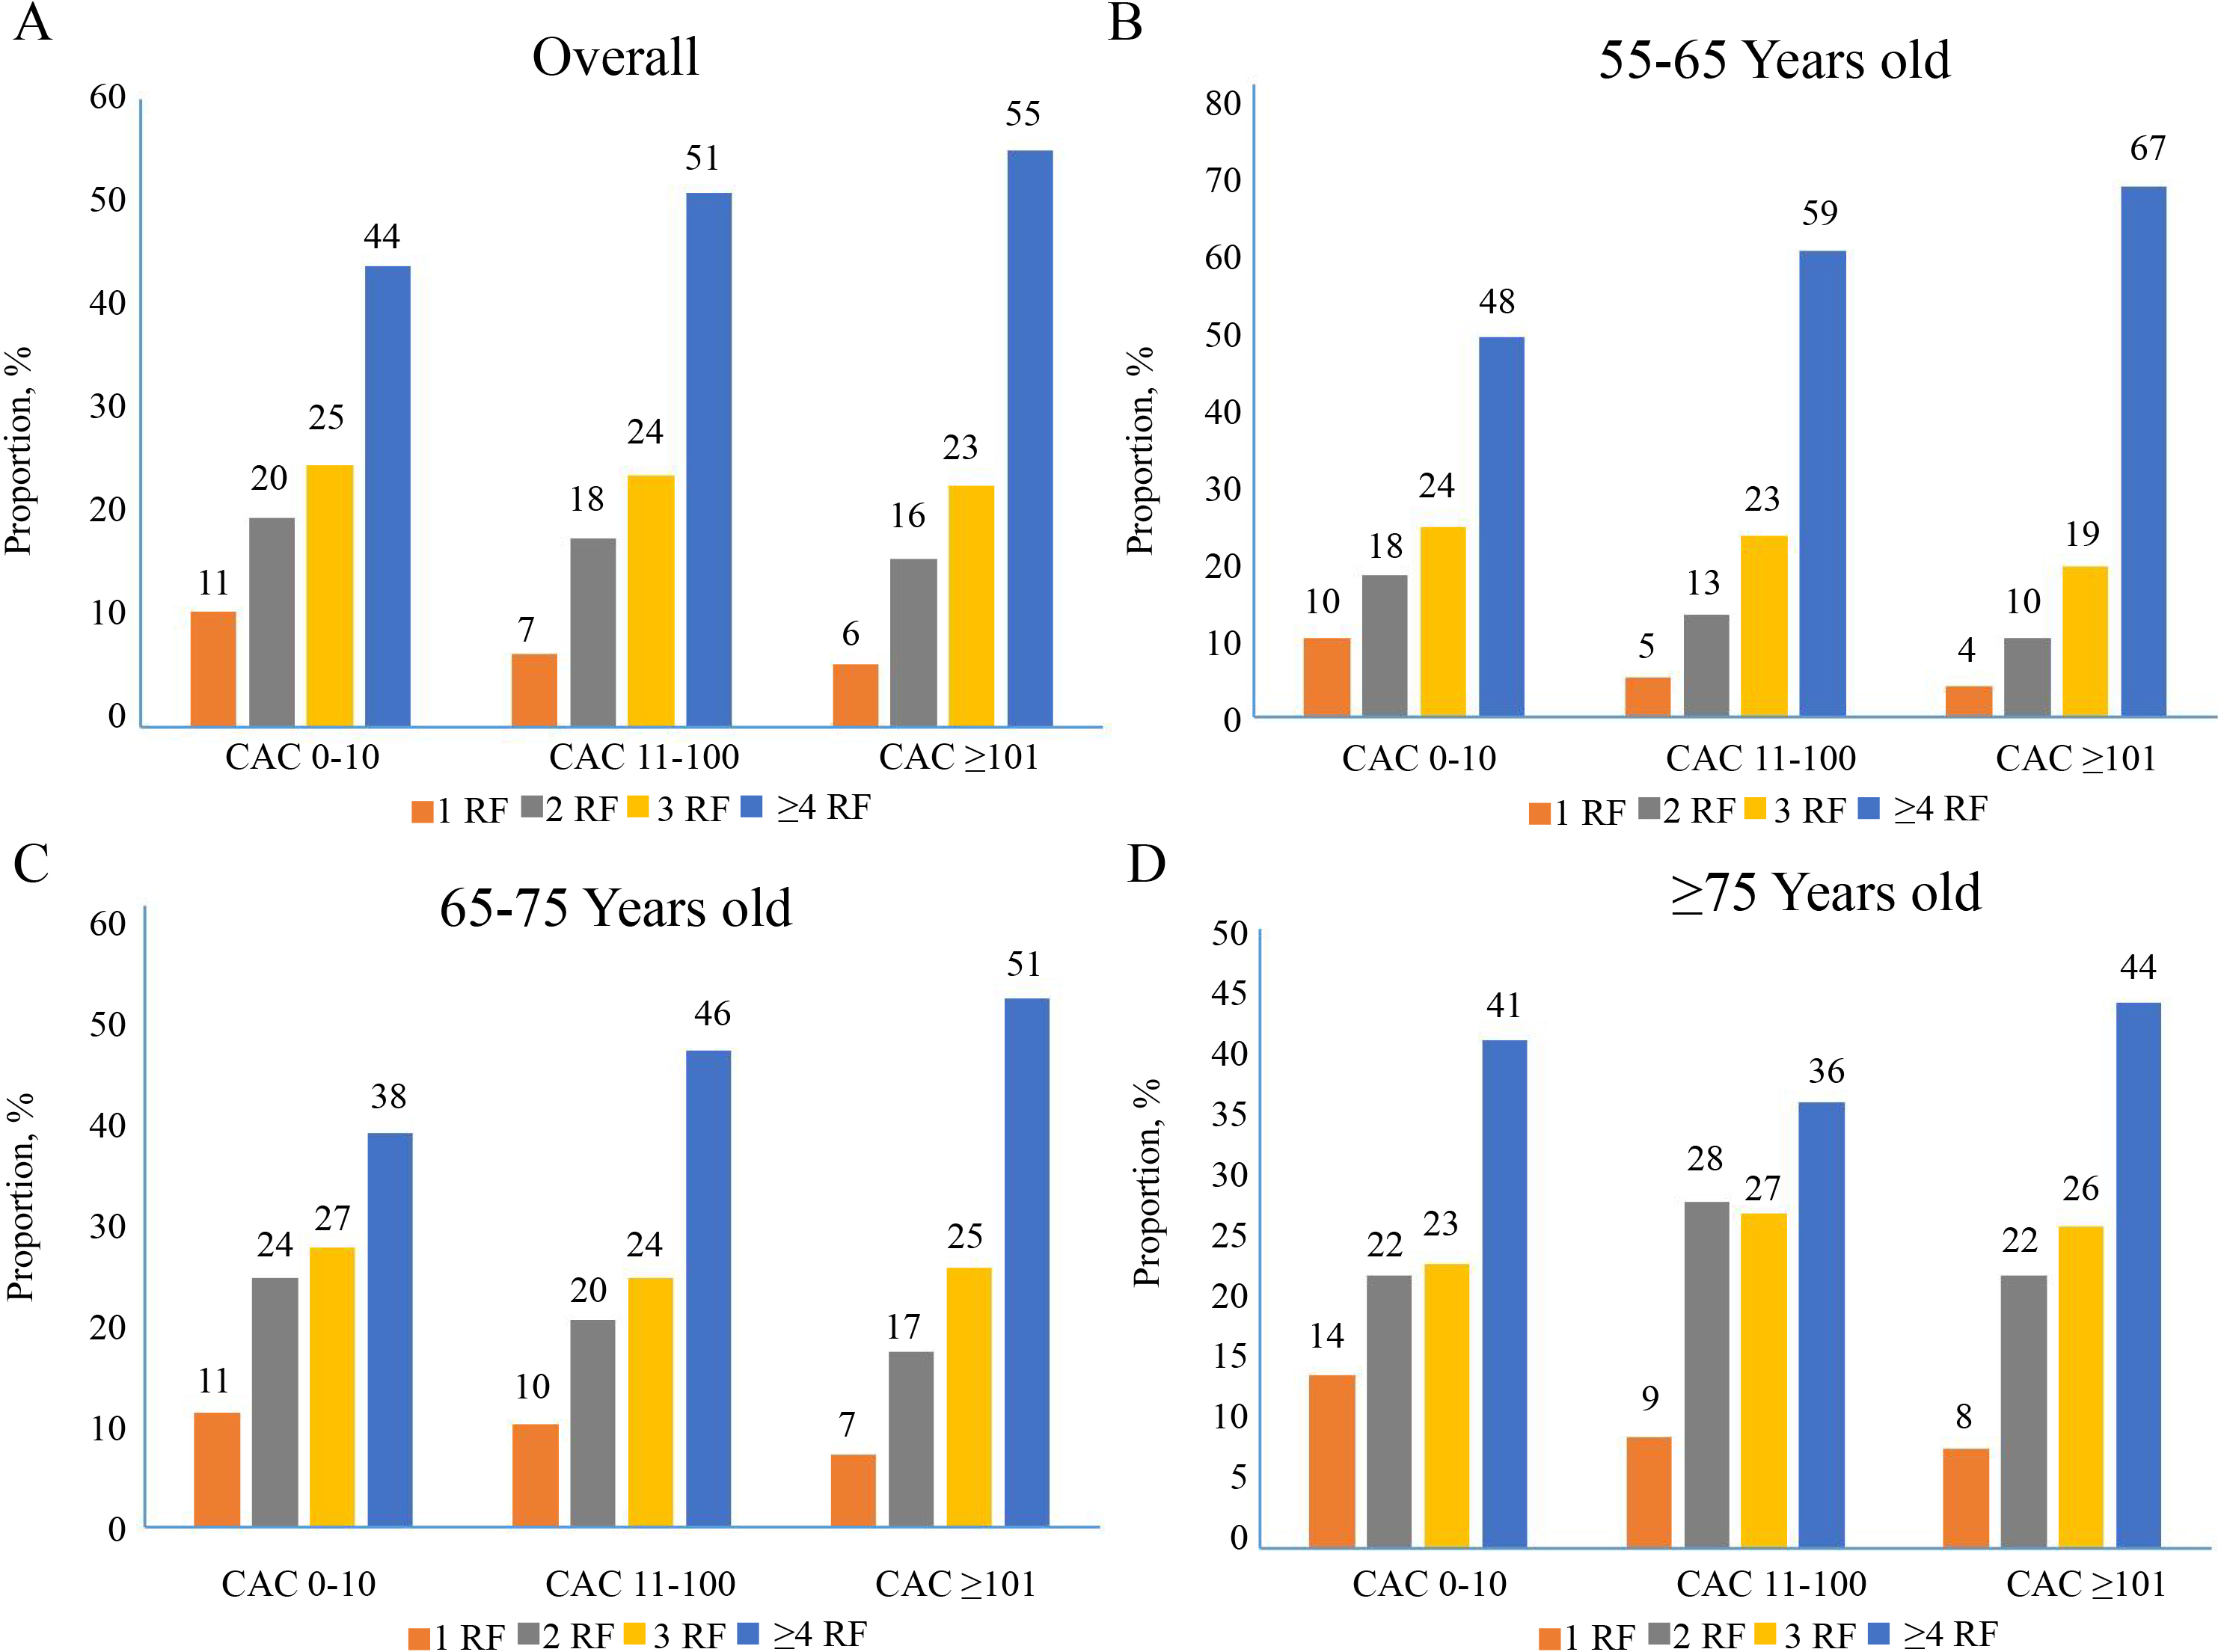 Fig. 3.
Interplay between age groups and increasing CAC score for the
presence of risk factor burden in middle-aged and elderly patients (
Plaque characteristics in relation to age appeared to vary considerably. For
example, middle-aged and elderly women had 1.816 times (95% CI: 1.150–2.867)
higher chances of having calcified plaques, while the inverse was true for
diabetes mellitus (Supplementary Table 2). Overall, Patients aged
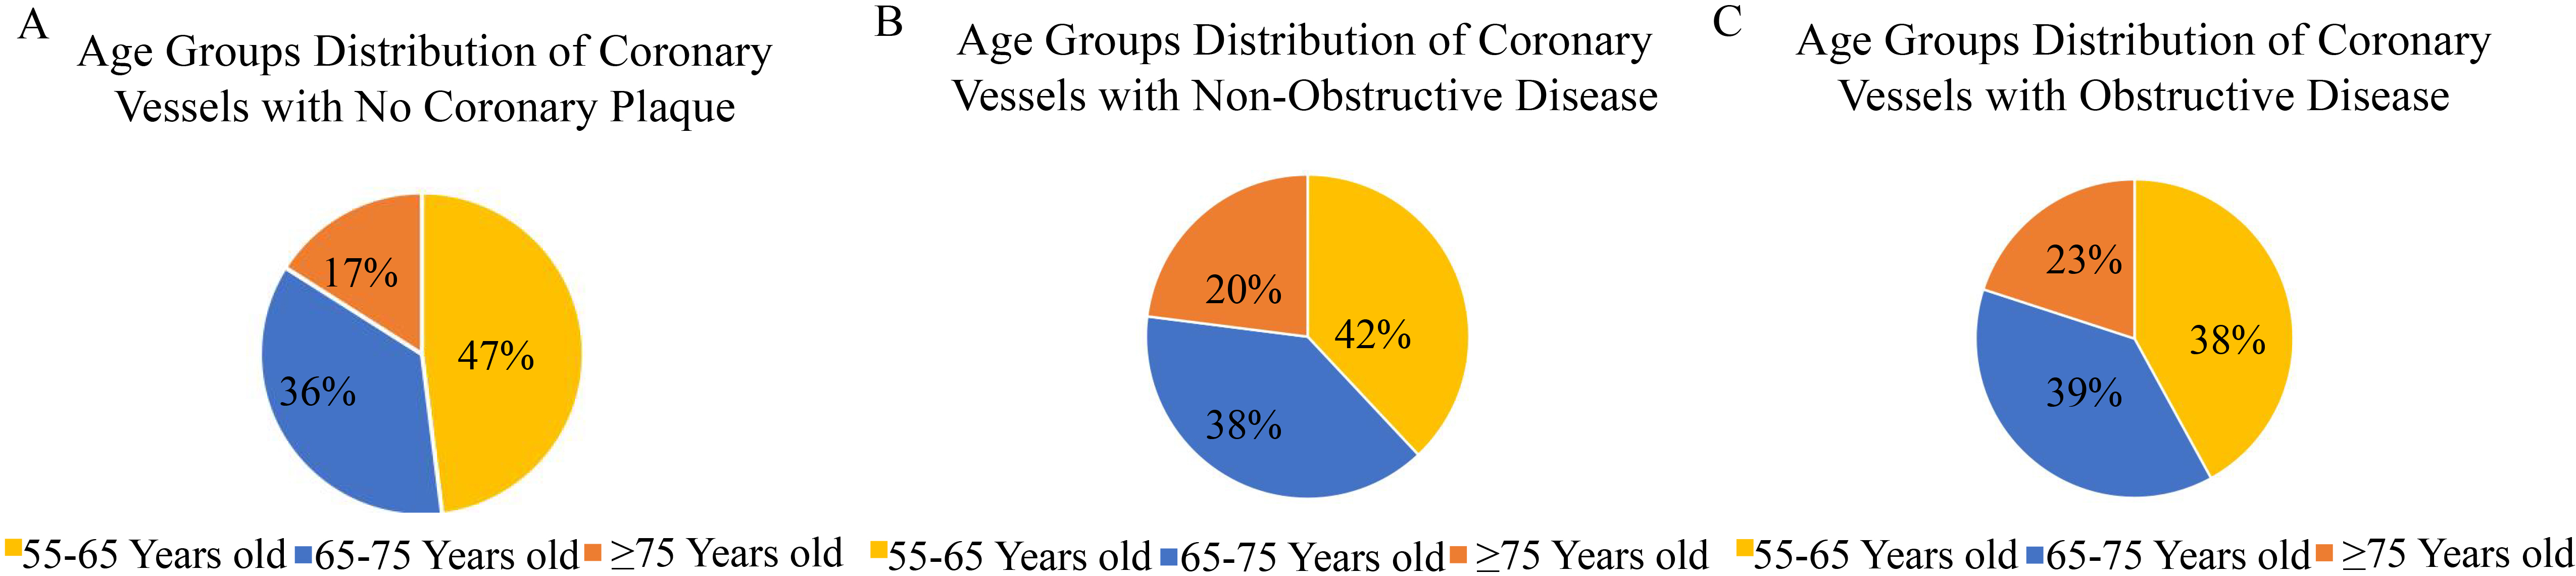 Fig. 4.
Age groups distribution across different type of coronary artery disease. (A) Age distribution of patients without coronary artery disease. (B) Age distribution of patients with non-obstructive coronary artery disease. (C) Age distribution of patients with obstructive coronary artery disease.
 Fig. 5.
Age distribution of coronary vessels with obstructive coronary artery disease.
The cumulative incidence of survival decreases with increasing age and CAC
scores (p
 Fig. 6.
Interplay of risk factors and CAC, age and CAC, age and
different types of coronary artery disease for risk of MACCE in middle-aged and
elderly patients (
 Fig. 7.
Interplay between age group and coronary artery calcium in middle-aged and elderly symptomatic patients. CAC, coronary artery calcium; RF, risk factors.
 Fig. 8.
The nomogram was used to calculate predicted MACCE risk
for symptomatic patients
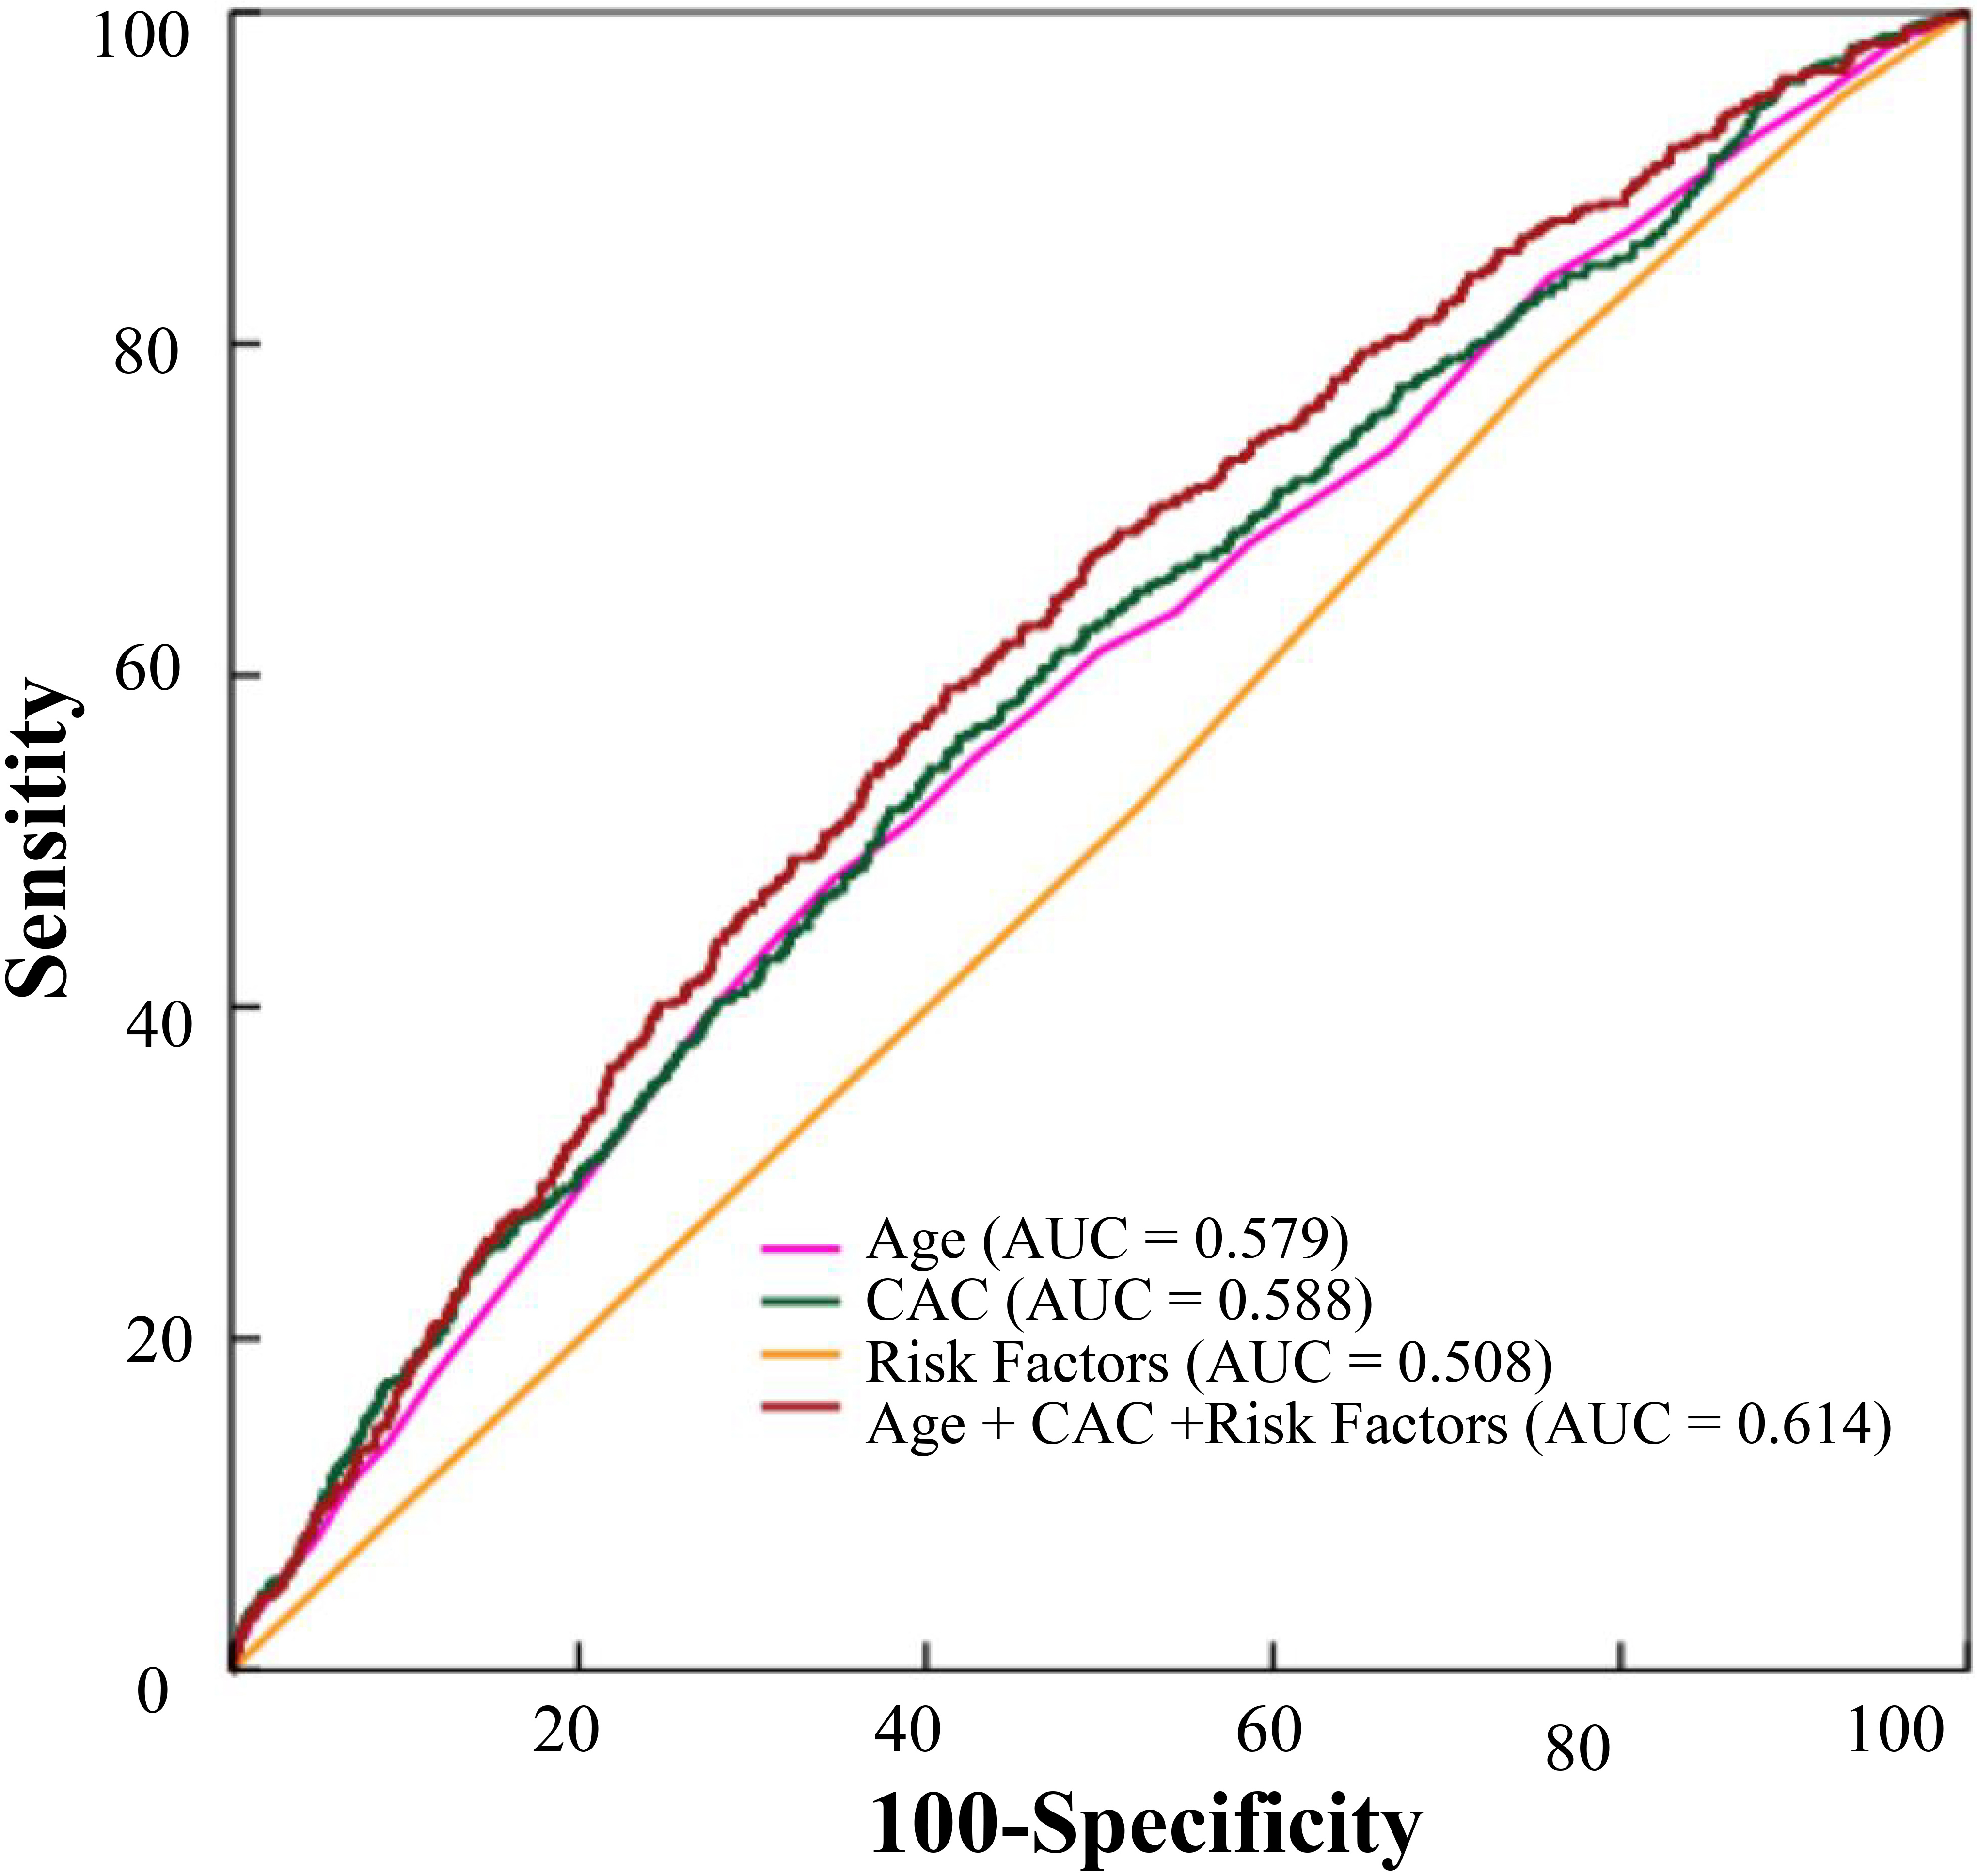 Fig. 9.
The predictive effects of age, CAC, risk factors, CAC combined with age and risk factors on MACCE were analyzed. CAC, coronary artery calcium; MACCE, major adverse cardiac and cerebrovascular events.
The present study evaluated the long-term clinical outcomes and predictors of
mortality among a large cohort of patients over 55 years of age who had a
possible diagnosis of CAD and underwent first-line CTA. We conducted a depth
analysis of the correlation cardiovascular risk factors, age, and CAC scores and
combined them for future prediction of MACCE. Four main conclusions were drawn
from this study. Firstly, the increase of risk factor burdens for middle-aged and
elderly individuals with CAC
Currently, the existing evidence on the relationship between risk factors and
CAC in middle-aged and elderly patients is limited. A prospective study on a
large multi-ethnic cohort of individuals aged 45–84 years who had no
pre-existing clinical cardiovascular disease revealed that those with CAC = 0 had
a low 10-year risk of event rate, but individuals with CAC
Stenosis of a vessel blocking the bloodstream leads to CAD, resulting in
underperfusion of the heart region due to blocked vessel. Distinct types of CAD
are caused by diverse degrees of coronary obstruction. However, obstructive CAD
is associated with higher myocardial infarction rates [34, 35, 36]. Our research
showed that when the number of CAD risk factors increased, the rate of
obstructive CAD also increased. Specifically, we found that the rate of
obstructive CAD was 5.7% among those with CAC 0–10 and 1 risk factor, while it
was 16.5% among those with CAC 0–10 and 4 or more risk factors. Clinicians
should alert those with a lower CAC score but higher risk factors to their
possible health hazards. The MESA study indicated that cardiovascular events
significantly increased with increasing CAC in middle-aged and elderly
individuals [16]. Our study showed that the incidence of MACCE was lower in the
group with CAC 0–10, but the incidence of MACCE was higher in the group with CAC
0–10 and
Although we adjusted for gender in our analyses, potential unadjusted residual confounding factors may still exist. All the patients in our study were symptomatic, which may reduce the generalizability of the results to asymptomatic patients. When assessing symptomatic patients with CTA, it cannot exclude a degree of bias, as those deemed to be high-risk (e.g., aged above 75 years) may be more likely to be referred for invasive angiography. Therefore, this may reduce the generalizability of the results to the elderly and higher-risk groups. Age, risk factors, and CAC score are closely related and may affect each other with an increased severity of coronary artery disease. However, our study was based on real world data which is a major strength of this study. In addition, we obtained information on the CAC score and CT angiography results.
The study revealed that for symptomatic patients aged
All the data were presented in the main paper. The data that support the findings of this study are available on request from the corresponding author. All authors take responsibility for the integrity of the data and the accuracy of the data analysis.
XML and YNY—funding and conception and design of the study. LZ and JYL—literature search, data collection, data analysis, and writing the manuscript. FL, ZRZ, YJQ, FL and XXT—literature search, data collection, and processing. All authors contributed to editorial changes in the manuscript. All authors read and approved the final manuscript.
The study was approved by the First Affiliated Hospital of Xinjiang Medical University institutional review board (K202106-02), and written informed consent was obtained from all the enrolled patients.
Not applicable.
This study was funded by National Natural Science Foundation of China (No. 82160054, No. 82070368), the Natural Science Foundation of Xinjiang Uygur Autonomous Region (No. 2020D01C259), the Key R&D Program of Xinjiang Uygur Autonomous Region (No. 2020B03002-1), and State Key Laboratory of Pathogenesis, Prevention and Treatment of High Incidence Diseases in Central Asia Fund (SKL-HIDCA-2021-XXG4).
The authors declare no conflict of interest.
Publisher’s Note: IMR Press stays neutral with regard to jurisdictional claims in published maps and institutional affiliations.