


 , Shu Zhang 1
1 State Key Laboratory of Cardiovascular Disease, Arrhythmia Center, Fuwai Hospital, National Center for Cardiovascular Diseases, Chinese Academy of Medical Sciences & Peking Union Medical College, 100037 Beijing, China
†These authors contributed equally.
Abstract
Background: Several previous studies have explored the potential
arterial blood pressure (BP) changes in patients undergoing right ventricular
pacing (RVP), however, the relationship between left bundle branch area pacing
(LBBAP) and BP variations remains unknown. This study aimed to examine the acute
BP variations following LBBAP and RVP implantation in patients with bradycardia.
Methods: We conducted a single-center retrospective study including all
patients who underwent de-novo dual-chamber pacemaker implantation between
January 2019 and June 2021. Patients were divided into two groups, LBBAP and RVP,
and propensity score-matching (PSM) was used to balance confounding factors.
Three time periods were defined according to the timing of the implant: baseline
(within 24 hours before implantation), hyper-acute period (0–24 hours
post-implantation), and acute period (24–48 hours post-implantation). BP was
measured at least three times per period using an arm pressure cuff and then
averaged for analysis, which allowed us to determine the acute impact of
pacemaker implantation on BP. Results: From a cohort of 898 patients,
193 LBBAP receivers were matched to 193 RVP receivers. A significant decrease in
systolic BP (SBP) after the implantation was observed in the study cohort, from
baseline 137.3
Keywords
- left bundle branch area pacing
- right ventricular pacing
- physiological pacing
- blood pressure control
- propensity score-matching
Cardiac pacing is the primary treatment for symptomatic bradycardia or
high-grade atrioventricular block [1]. In clinical practice, right ventricular
pacing (RVP) has been a well-established technique for decades. Accumulated
evidence indicates that chronic RVP can cause dyssynchronous left ventricular
electrical activation and consequently results in deleterious impacts on cardiac
function [2, 3, 4]. This is particularly true for patients with a high percentage of
ventricular pacing (VP%), typically defined as VP%
Blood pressure (BP) is a useful hemodynamic indicator that is dynamically modulated by both the autonomic nervous system (ANS, sympathetic and vagal reflex) and neurohumoral factors (circulating catecholamines, neuropeptides, rein-angiotensin-aldosterone-system). Several studies have reported that patients with chronic bradycardia may experience elevated systolic blood pressure (SBP) [11, 12, 13], which can be attributed to an increased myocardial contraction force (Frank-Starling mechanism) and excessive sympathetic activation secondary to bradycardia. Vice versa, elevated SBP can also lead to bradycardia via baroreflex. An unexpected phenomenon commonly observed is that RVP receivers can undergo BP variations after the implantation, which is termed ‘pacemaker syndrome’ [14, 15]. It refers to a complex of symptoms, consisting of fatigue, palpitations, and shortness of breath, which are related to the adverse hemodynamic and electrophysiological consequences of ventricular pacing. Several potential causes have been linked to the occurrence of pacemaker syndrome, which include retrograde atrial conduction, disruption of regular atrial synchrony at a normal atrioventricular (AV) interval, and insufficient cardiac rate response [14]. Previous studies proposed that pacing might participate in hemodynamic abnormalities by adversely impacting cardiac autonomic baroreflex function, particularly in non-physiological pacing [16, 17]. However, the exact hemodynamic effect of pacing has received little attention in the literature, and no studies have yet focused on the BP variations associated with novel physiological pacing.
We hypothesized that the magnitude of BP variations in ventricular-paced individuals might differ depending on the pacing modalities. Given that LBBAP produces physiological cardiac contractile outcomes of the left ventricle due to the native conduction system, it is likely to confer more favorable hemodynamic effects over less physiological RVP. To test this hypothesis, we examined the BP values pre- and post-implantation in patients who received either LBBAP or RVP.
This study was a single-center, retrospective, observational study. We
consecutively enrolled 1001 adult patients (
The LBBAP procedure involves capturing left bundle branch (LBB) via a transventricular-septal approach, as previously described in detail [18]. Briefly, a delivery C315HIS fixed curve sheath with a SelectSecure 3830 pacing lead (Medtronic Inc., Minneapolis, MN, USA) was first positioned in the His bundle region. Then we rotated the sheath to place the lead perpendicularly against the interventricular septum (IVS) and gently advanced the lead helix toward the left side of the septum. The lead was further advanced until LBBAP criteria were achieved. A successful LBBAP procedure was defined as [19]: (i) the paced QRS morphology showed a pattern of right bundle branch conduction delay (RBBD) in lead V1/2 on electrocardiogram (ECG); (ii) an LBB potential was recorded or a shortened peak left ventricular activation time (LVAT) in lead V5/6 was present. RVP was performed using an active fixation lead, which involved implanting the right ventricular lead at the right apex or ventricular septum. The atrial lead was inserted into the right atrial appendage.
As part of our routine practice, we performed device programming at implantation and within 48 hours after pacemaker implantation. An individualized AV delay was programmed according to the intrinsic AV conduction and bundle branch block. To prevent unnecessary ventricular pacing, the automatic AV search algorithm was routinely enabled in patients with intact AV conduction. Multiple parameters were assessed and recorded, including pacing electrical parameters (lead impedance, capture threshold, and R-wave amplitude), sensing amplitude, VP%, and percentage of atrial pacing (AP%).
The primary outcome of this study was the acute changes in SBP shortly after
pacemaker implantation. According to the diagnostic criteria for hypertension
established by the International Society of Hypertension (ISH) in 2020 [20],
hypertension would be diagnosed when a person’s SBP was
All data collection occurred while patients were admitted into the hospital for pacemaker implantation and before patients were discharged post-implantation. We collected various patient data including demographics, vital signs at each period, cardiovascular comorbidities, antihypertensive drugs (AHDs), ECG and Holter parameters, echocardiography parameters, and periprocedural information. All data were extracted from our hospital’s electronic medical record system. To ensure data accuracy, approximately 5% of medical records were randomly selected and reviewed during the preliminary extraction phase.
Continuous variables were expressed as the mean
To minimize confounding bias, we employed propensity score-matching (PSM) [21], which involved estimating the propensity score (PS) using a logistic regression model containing all covariates listed in Table 1. LBBAP and RVP groups were matched at a 1:1 ratio with a 4-digit nearest neighbor algorithm within a caliper of 0.2. In the PSM cohort, repeated measures analysis of variance (ANOVA) was applied to examine the overall SBP changes across all three time points, and Tukey’s method was used for multiple comparisons. An independent sample t-test was used to compare the LBBAP and RVP groups. We performed subgroup analyses within each group to explore potential factors that could influence variations in BP. Subgroup categories were specified by baseline SBP, hypertension status, and use of AHDs. A Pearson correlation analysis was conducted to explore the linear relationship between numerical variables.
| Entire cohort | Propensity-score matching cohort | ||||||
| LBBAP | RVP | p value | LBBAP | RVP | p value | ||
| (n = 209) | (n = 689) | (n = 193 ) | (n = 193) | ||||
| Age, yrs | 61.7 |
67.5 |
62.4 |
63.7 |
0.391 | ||
| Female, n (%) | 103 (49.3) | 381 (55.3) | 0.147 | 99 (51.3) | 91 (47.2) | 0.476 | |
| HR, bpm | 55.9 |
61.7 |
56.8 |
57.7 |
0.466 | ||
| 24 h mean HR |
55.3 |
58.8 |
55.5 |
56.3 |
0.450 | ||
| SBP, mmHg | 137.1 |
135.4 |
0.019 | 136.8 |
137.7 |
0.322 | |
| DBP, mmHg | 73.1 |
73.2 |
0.928 | 73.3 |
73.8 |
0.545 | |
| LVEF, % | 62.0 |
62.6 |
0.180 | 62.2 |
61.9 |
0.620 | |
| LVEDD, mm | 48.2 |
47.4 |
0.033 | 48.1 |
48.4 |
0.646 | |
| Pacemaker indication, n (%) | 0.918 | ||||||
| SND | 83 (39.7) | 548 (79.5) | 83 (43.0) | 81 (42.0) | |||
| AVB | 126 (60.3) | 141 (20.5) | 110 (57.0) | 112 (58.0) | |||
| Intrinsic rhythm |
0.830 | ||||||
| Sinus | 179 (85.6) | 608 (88.2) | 168 (87.0) | 173 (89.6) | |||
| AF | 3 (1.4) | 32 (4.6) | 3 (1.6) | 3 (1.6) | |||
| Escape | 23 (11.0) | 24 (3.5) | 18 (9.3) | 13 (6.7) | |||
| Temporary pacing | 4 (1.9) | 25 (3.6) | 4 (2.1) | 4 (2.1) | |||
| Comorbidities |
|||||||
| Hypertension, n (%) | 130 (62.2) | 423 (61.4) | 0.897 | 119 (61.7) | 115 (59.6) | 0.755 | |
| Dyslipidemia, n (%) | 96 (45.9) | 338 (49.1) | 0.476 | 88 (45.6) | 92 (47.7) | 0.760 | |
| Coronary artery disease, n (%) | 56 (26.8) | 206 (29.9) | 0.437 | 52 (26.9) | 56 (29.0) | 0.734 | |
| AF/AFL, n (%) | 31 (14.8) | 253 (36.7) | 31 (16.1) | 27 (14.0) | 0.669 | ||
| Antihypertensive drugs | |||||||
| Beta-Blocker, n (%) | 82 (39.2) | 271 (39.3) | 1.000 | 75 (38.9) | 75 (38.9) | 1.000 | |
| ACEi/ARB, n (%) | 89 (42.6) | 211 (30.6) | 0.002 | 78 (40.4) | 75 (38.9) | 0.835 | |
| CCB, n (%) | 77 (36.8) | 203 (29.5) | 0.053 | 72 (37.3) | 65 (33.7) | 0.523 | |
| Diuretic, n (%) | 42 (20.1) | 69 (10.0) | 34 (17.6) | 31 (16.1) | 0.786 | ||
Abbreviations: ACEi/ARB, angiotensin-converting enzyme inhibitor/angiotensin receptor blocker; AF/AFL, atrial fibrillation/atrial flutter; AVB, atrioventricular block; CCB, calcium channel blockers; DBP, diastolic blood pressure; HR, heart rate; LVEDD, left ventricular end-diastolic dimension; LVEF, left ventricular ejection fraction; SBP, systolic blood pressure; SND, sinus node dysfunction; LBBAP, left bundle branch area pacing; RVP, right ventricular pacing.
To maximize statistical power and minimize bias that might occur if small
proportions of missing data were excluded from analyses, we applied a multiple
imputation with chained equations to impute missing values [22]. All statistical
analyses were performed using R (version 4.1.2, 2021-11-01, Boston, MA, USA) and
a two-sided p
In the entire cohort, LBBAP was successfully achieved in 209 patients, whereas
689 patients received RVP, of which, 386 propensity-matched patients (193 LBBAP
receivers; 193 RVP receivers) were extracted to serve as the PSM cohort (Fig. 1).
Before PSM, the LBBAP group was significantly younger than in RVP (p
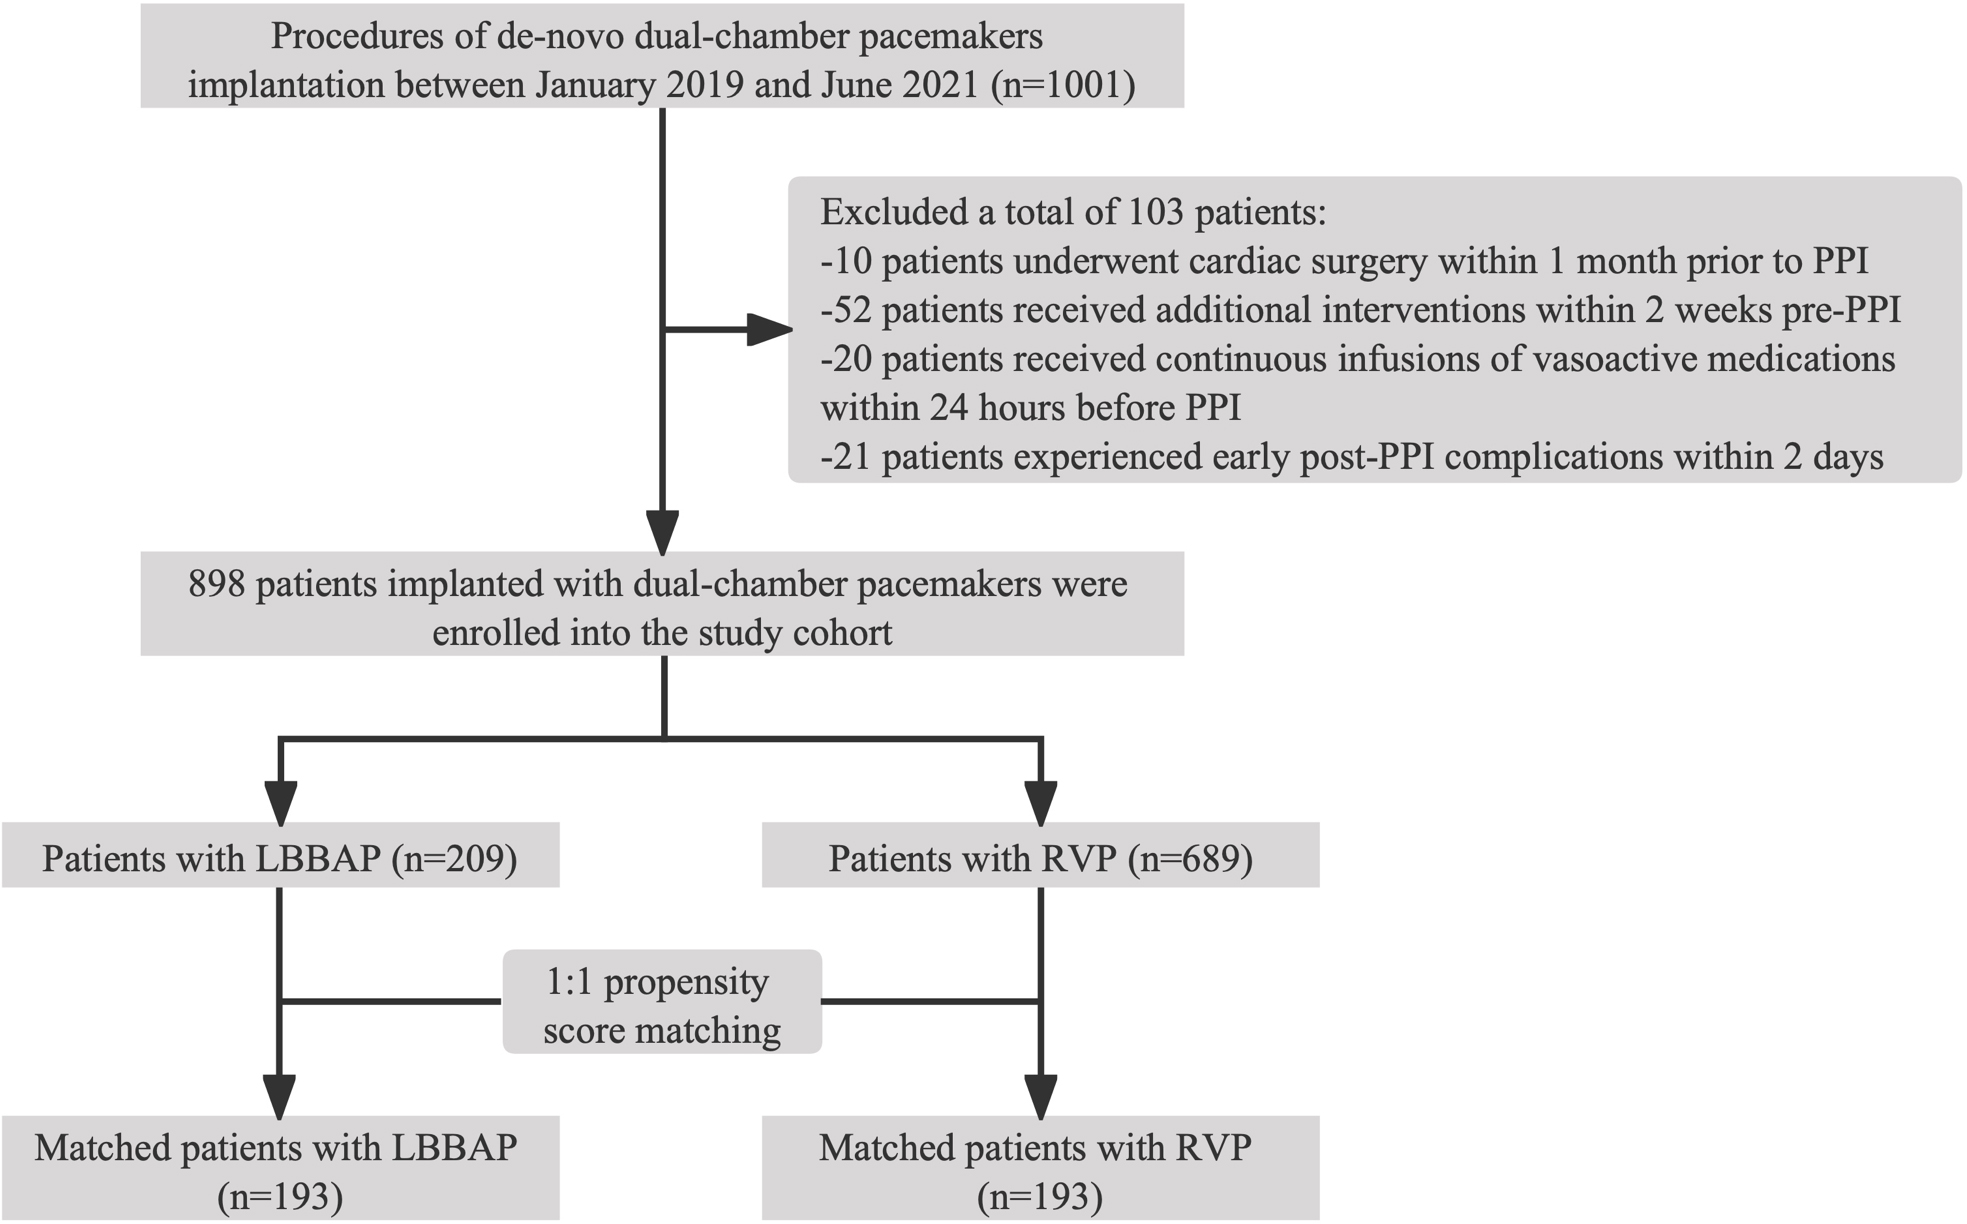 Fig. 1.
Flowchart of patients selection in the cohort. Abbreviations: LBBAP, left bundle branch area pacing; PPI, permanent pacemaker implantation; RVP, right ventricular pacing.
The baseline QRS duration (QRSd) and intrinsic QRS morphology were found to be
similar between the LBBAP and RVP groups (p = 0.937, p = 0.283,
respectively). However, LBBAP resulted in a relatively narrower paced QRS complex
compared to RVP (117.4
| LBBAP | RVP | p value | ||
| Baseline QRS duration, ms | 99.9 |
100.1 |
0.937 | |
| Pacing QRS duration, ms | 117.4 |
151.7 |
||
| Intrinsic QRS morphology | 0.283 | |||
| Normal | 161 | 157 | ||
| IVCD | 4 | 11 | ||
| LBBB | 7 | 8 | ||
| RBBB | 21 | 17 | ||
| Pacing threshold |
0.6 |
0.5 |
||
| Sensing amplitude, mV | 10.6 |
9.8 |
0.083 | |
| Impedance, ohms | 769.3 |
792.4 |
0.145 | |
| Lower rate | 60.0 |
59.9 |
0.739 | |
| AP% after implant |
10.4 (1.0, 65.9) | 20.0 (1.0, 71.6) | 0.650 | |
| VP% after implant | 29.0 (5.5, 99.7) | 22.0 (2.1, 98.0) | 0.117 | |
Abbreviations: IVCD, intraventricular conduction delay; LBBB, left bundle branch block; RBBB, right bundle branch block; AP%, percentage of atrial pacing; VP%, percentage of ventricular pacing; PSM, propensity score-matching; LBBAP, left bundle branch area pacing; RVP, right ventricular pacing; ECG, electrocardiogram.
A gradual day-over-day reduction in systolic BP after the implantation was
observed in the study cohort, from baseline 137.3
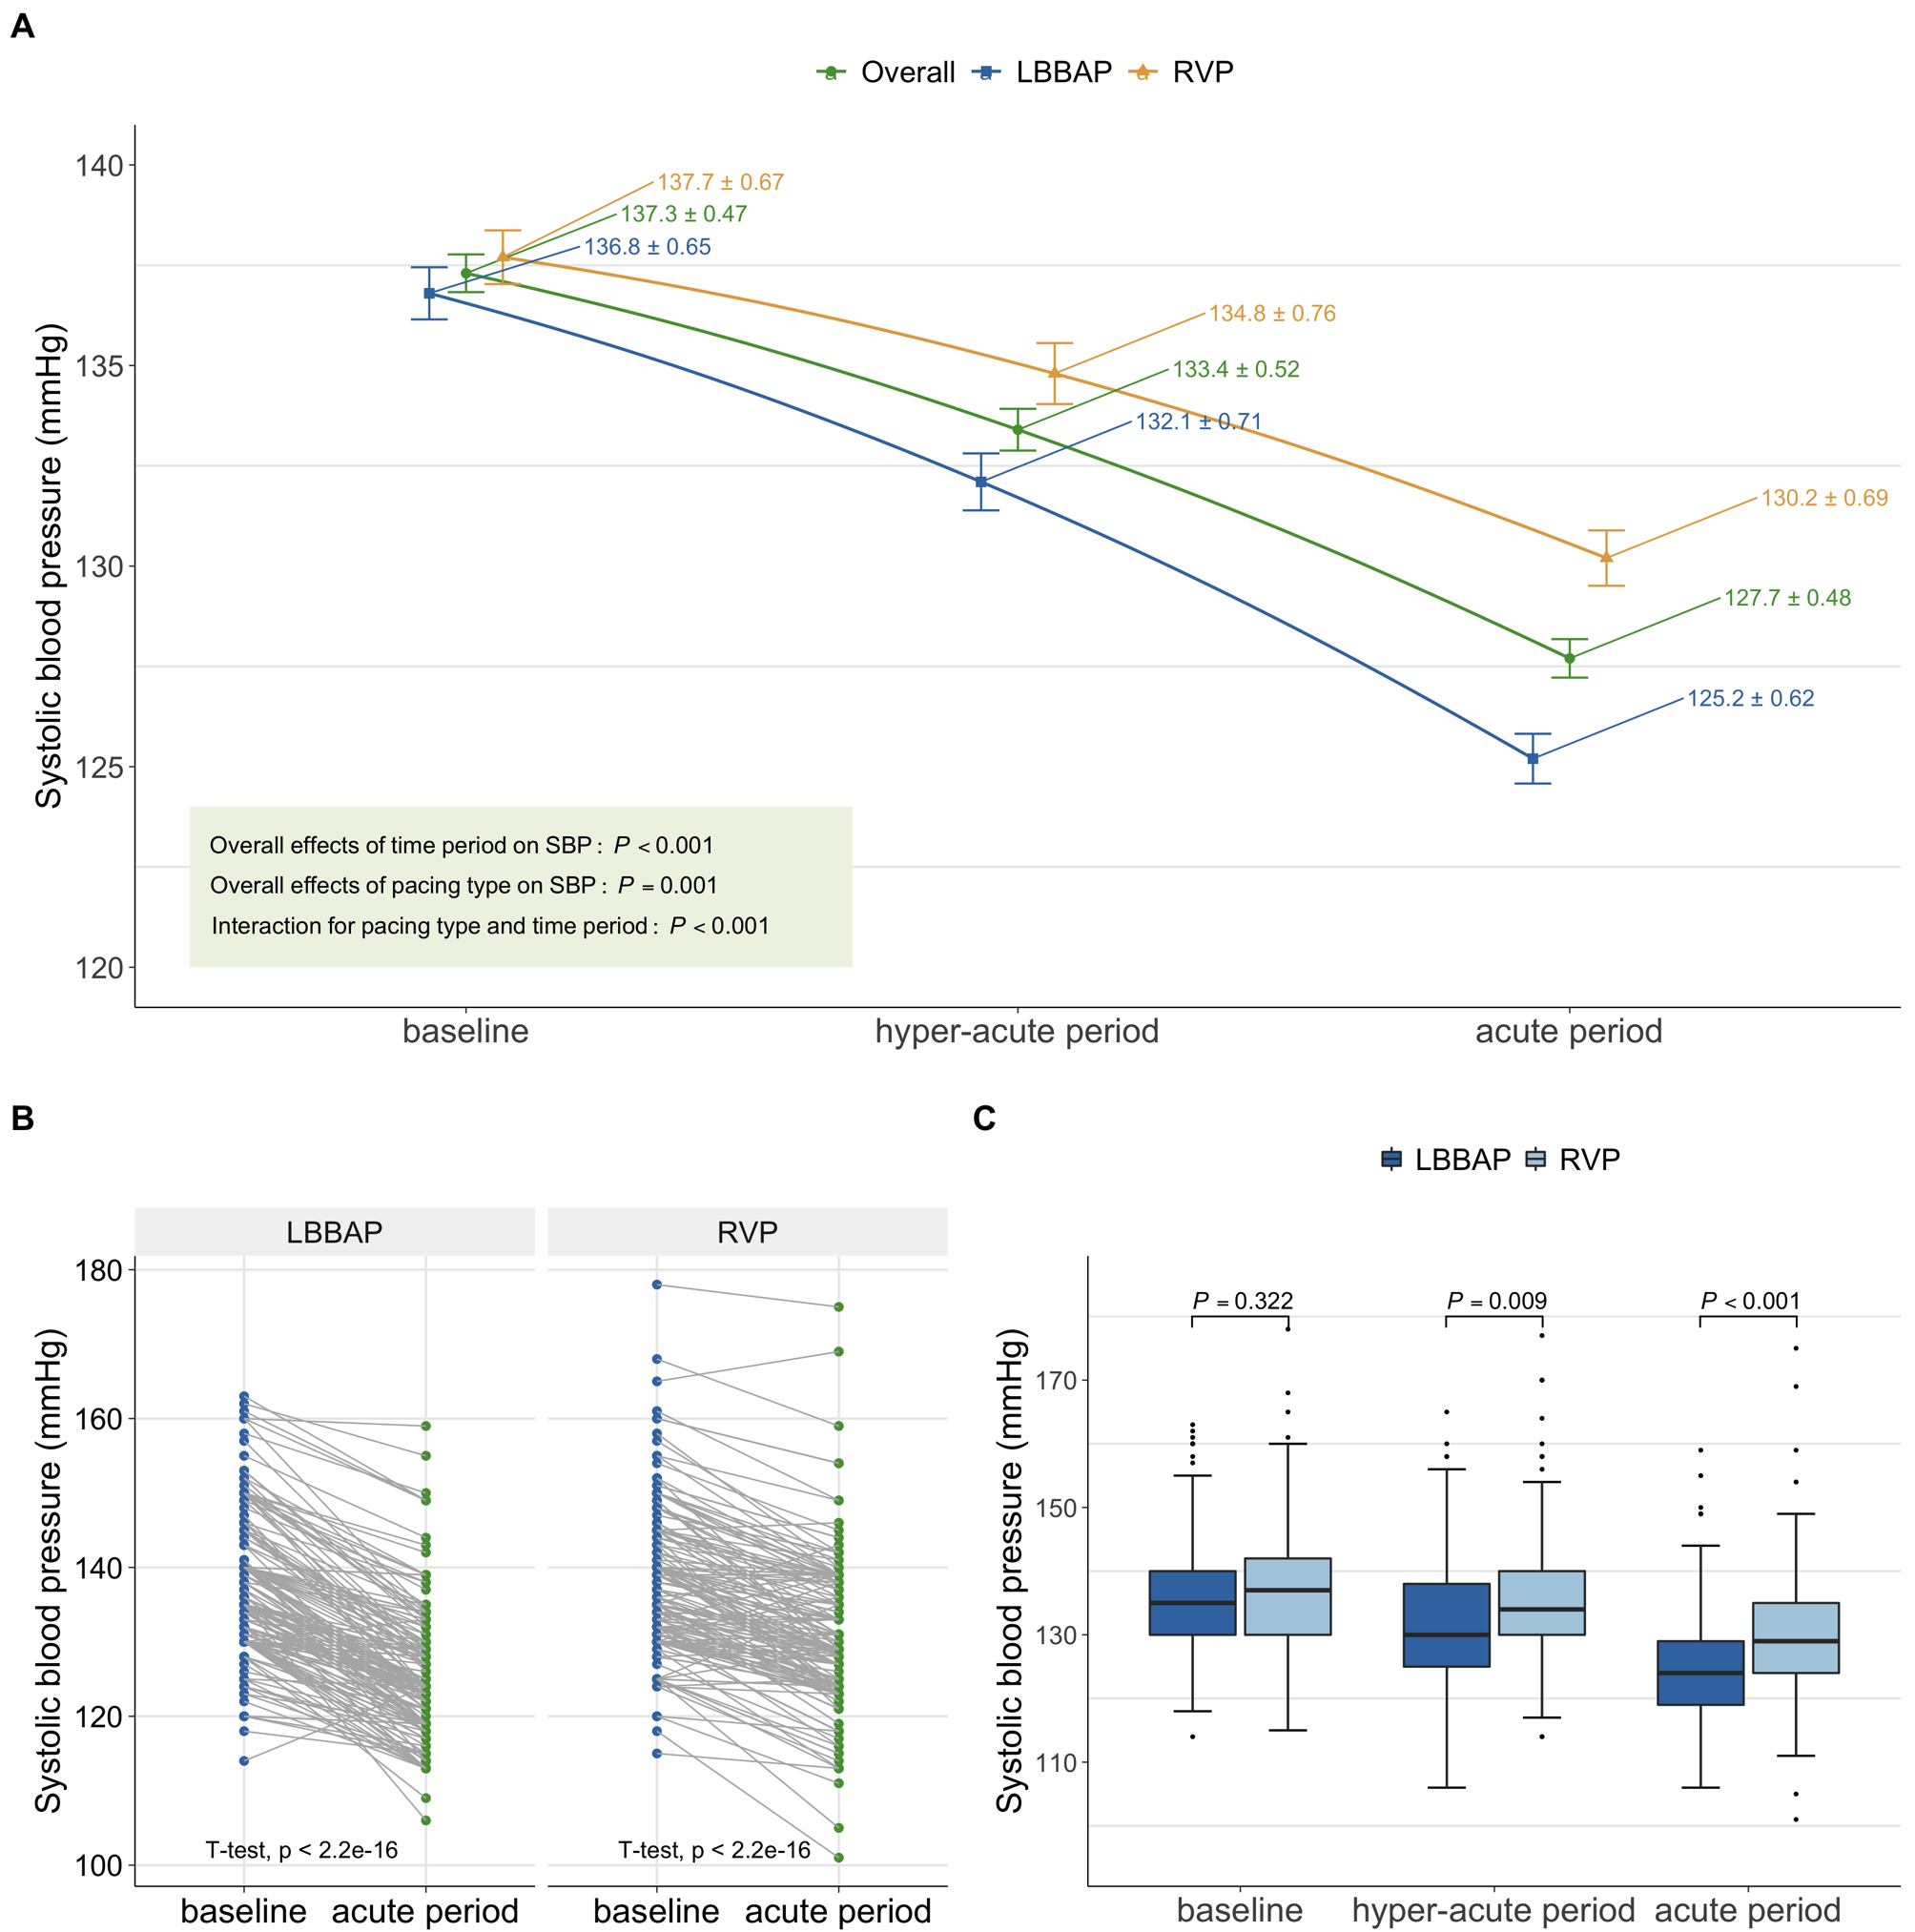 Fig. 2.
SBP changes over time periods in the PSM cohort. (A) SBP
changes of the overall population, the LBBAP group, and the RVP group (overall
effect was calculated using repetitive measure analysis of variance). The error
bar refers to the mean
| Before matching | After matching | |||||||
| LBBAP | RVP | Mean difference (95% CI) | p value | LBBAP | RVP | Mean difference (95% CI) | p value | |
| (n = 209) | (n = 689) | (n = 193) | (n = 193) | |||||
| Mean SBP in hyper-acute period, mmHg | 131.4 |
132.8 |
–1.4 (–3.0, 0.2) | 0.090 | 132.1 |
134.8 |
–2.7 (–4.8, –0.7) | 0.009 |
| Mean SBP in acute period, mmHg | 125.0 |
127.0 |
–2.0 (–3.4, –0.6) | 0.005 | 125.2 |
130.2 |
–5.0 (–6.8, –3.2) | |
| SBP variation from baseline, mmHg | 12.1 |
8.4 |
3.7 (2.7, 4.6) | 11.6 |
7.6 |
4.0 (2.9, 5.2) | ||
Abbreviations: LBBAP, left bundle branch pacing; RVP, right ventricular pacing; SBP, systolic blood pressure.
Compared to baseline, both the LBBAP and RVP groups showed a reduction in SBP
within 24 to 48 hours post-procedure, with the LBBAP group experiencing a
significantly greater decrease of 11.6
To investigate how pacing affects SBP, we stratified all patients enrolled in
the PSM cohort into four groups by VP%: VP%
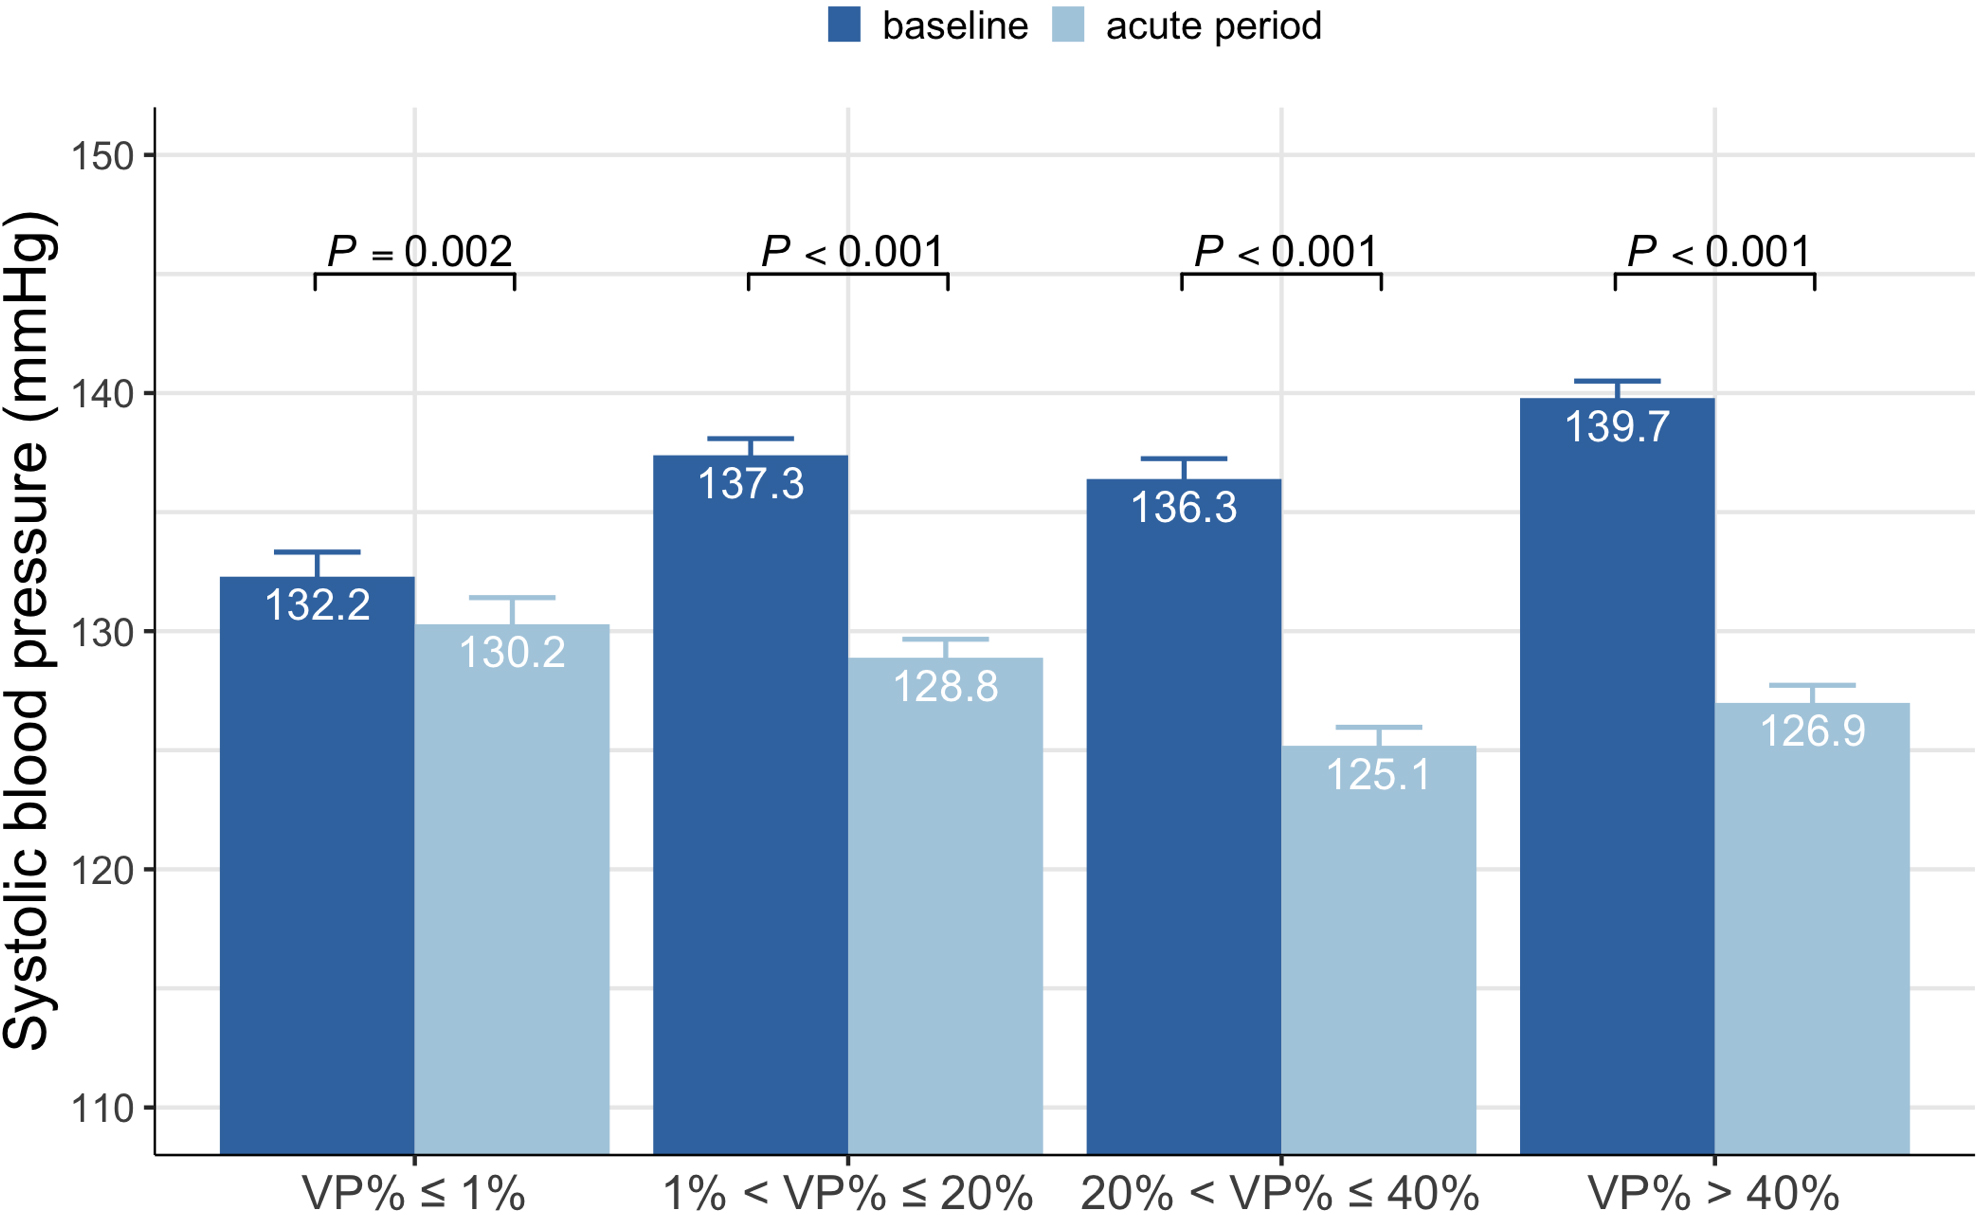 Fig. 3.
SBP at baseline and the acute period in different VP% group. SBP, systolic blood pressure; VP%, percentage of ventricular pacing.
Subgroup analyses were conducted in both LBBAP and RVP groups. When assessed by
baseline SBP, patients were divided into two groups based on the baseline SBP
using the median as a cutoff. Patients with higher baseline SBP had a more
pronounced decrease in SBP compared to those with a lower baseline SBP in both
the LBBAP and RVP groups (all p
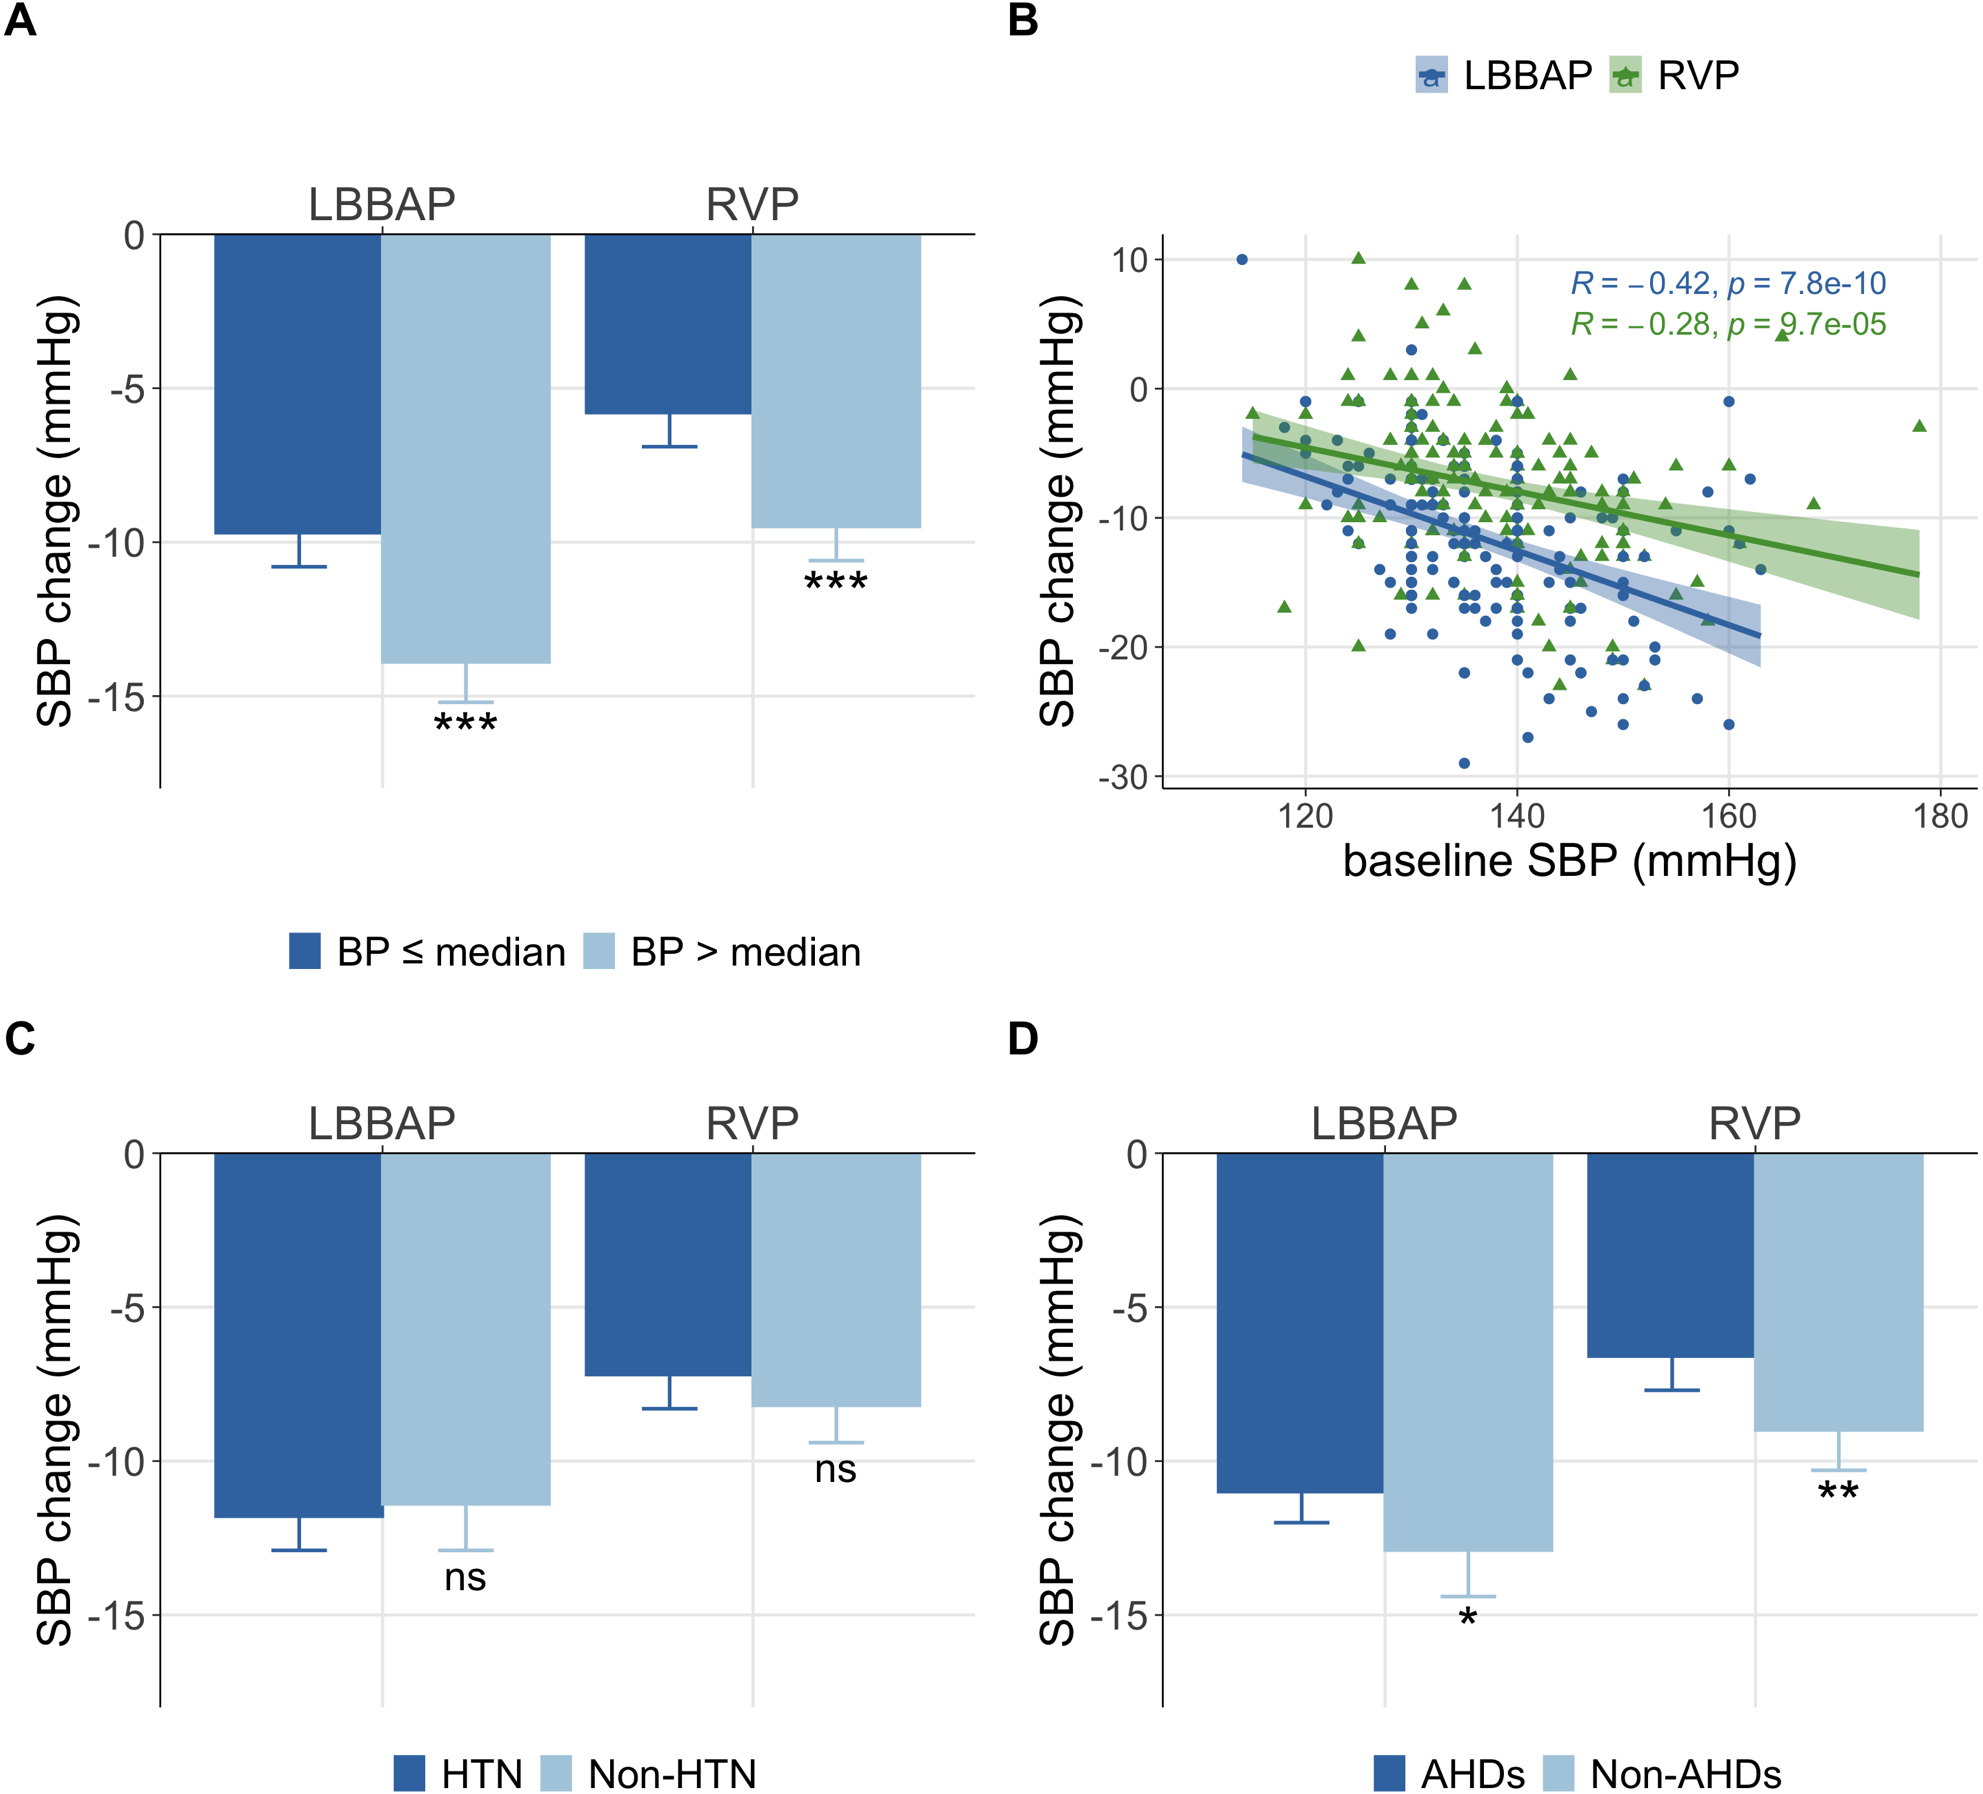 Fig. 4.
Association of basic characteristics with SBP change. (A) SBP
change compared between different baseline BP. (B) The correlation between
baseline BP and SBP change (R refers to the Pearson correlation coefficient). (C)
SBP change compared between patients with or without HTN. (D) SBP change compared
between patients with or without AHDs. The error bar referred to the mean
| Subgroup | No. of patients | HR, bpm | SBP, mmHg | SBP change, mmHg | p value | |||
| Baseline | Acute period | Baseline | Acute period | Mean difference (95% CI) | ||||
| LBBAP | 193 | |||||||
| Baseline SBP | ||||||||
| BP |
105 | 56.0 |
64.0 |
130.2 |
120.6 |
–9.7 (–10.8, –8.6) | ||
| BP |
88 | 57.7 |
66.2 |
144.7 |
130.7 |
–13.9 (–15.2, –12.7) | ||
| Comorbidity | 0.637 | |||||||
| HTN | 119 | 55.3 |
65.0 |
138.6 |
126.9 |
–11.8 (–12.9, –10.7) | ||
| Non-HTN | 74 | 59.1 |
64.9 |
133.9 |
122.5 |
–11.4 (–12.9, –9.8) | ||
| Drugs | 0.045 | |||||||
| AHDs | 127 | 55.3 |
65.0 |
137.5 |
126.5 |
–11.0 (–12.0, –9.9) | ||
| Non-AHDs | 66 | 59.6 |
65.0 |
135.5 |
122.6 |
–12.9 (–14.4, –11.3) | ||
| RVP | 193 | |||||||
| Baseline SBP | ||||||||
| BP |
100 | 56.4 |
66.3 |
130.7 |
125.0 |
–5.8 (–6.9, –4.7) | ||
| BP |
93 | 59.1 |
65.1 |
145.2 |
135.8 |
–9.5 (–10.6, –8.3) | ||
| Comorbidity | 0.232 | |||||||
| HTN | 115 | 54.9 |
65.2 |
139.8 |
132.6 |
–7.2 (–8.3, –6.1) | ||
| Non-HTN | 78 | 61.9 |
66.5 |
134.7 |
126.5 |
–8.2 (–9.4, –6.9) | ||
| Drugs | 0.005 | |||||||
| AHDs | 117 | 55.0 |
64.9 |
139.3 |
132.6 |
–6.6 (–7.7, –5.6) | ||
| Non-AHDs | 76 | 61.9 |
66.9 |
135.3 |
126.3 |
–9.0 (–10.3, –7.7) | ||
Abbreviations: AHDs, antihypertensive drugs; BP, blood pressure; HR, heart rate; HTN, hypertension; LBBAP, left bundle branch area pacing; RVP, right ventricular pacing; SBP, systolic blood pressure.
In this retrospective cohort study with a large sample size, we provided further insight into acute blood pressure changes post-implantation of LBBAP and RVP. Our PS-matched comparison between the LBBAP and RVP group yielded several significant and clinically meaningful findings: (1) the implantation of permanent pacemakers for patients with conduction system disease could contribute to a significant decrease in systolic blood pressure shortly after the implantation; (2) this immediate effect was more pronounced in LBBAP receivers than in RVP receivers, suggesting that LBBAP might have stronger physiological hemodynamic effects; and (3) baseline SBP and the use of anti-hypertensive drugs were potentially associated with the magnitude of arterial BP reduction post pacemaker implantation.
An earlier study noted a potential correlation between the maximal arterial BP differences observed during ventricular pacing, especially comparing AV synchrony with maximal AV asynchrony, and the subsequent improvement in cardiac index [23]. That study suggested that BP variability could be a more valuable indicator of the hemodynamic impact in ventricular-paced individuals. Channon et al. [17] reported that paced individuals exhibit a reduction in BP, and the beat-to-beat BP variability was greatly increased when changed from DDD to VVI pacing. A cohort of 24 dual-pacemaker patients focused on the effects of pacing sites on blood pressure, showed that right ventricle (RV) septal pacing was associated with less BP variation compared with RV apical pacing in the VVI mode [15]. Our results with a large study cohort demonstrated an immediate and substantial systolic BP reduction after pacemaker implantation.
Several possible pathophysiological mechanisms may have been responsible for the acute hemodynamic changes in response to pacing. First, almost all patients receiving permanent pacemaker implantation suffer from bradycardias. Compensatory elevation of SBP may occur due to an increased contraction force following increased ventricular filling during bradycardia (the Frank-Starling mechanism), leading to a greater stroke volume (SV) and hence the increased systolic BP [24]. Furthermore, increased left ventricle (LV) filling may stimulate the sympathetic afferent fibers distributed in the heart through cardiac wall distension. Pacing corrects the bradycardia and thus prevents overcompensation of BP. A recent case report [13] suggested that pacemaker implantation resulted in increased cardiac output and a marked reduction in peripheral resistance, which might be due to other less well-understood mechanisms contributing to the decrease in BP.
A similar trend of SBP reduction was observed in both LBBAP and RVP receivers in the present study, however, the magnitude of BP reduction was more profound in the LBBAP group. LBBAP involves placing the ventricular electrode in the left bundle branch region, and our results were consistent with previous studies [25, 26, 27] showing that it produced a narrower paced QRS complex and a relatively lower pacing threshold, leading to improved LV synchrony. In general, improved LV synchrony may increase the stroke volume and cardiac output (CO), which could lead to decreased BP variation. An unexpected trend was observed in the present study. Since the ANS plays an important role in modulating cardiovascular functions and maintaining blood pressure homeostasis [28], we speculated that the ANS might participate in this hemodynamic regulation, since improved cardiac work during LBBAP may cause a decrease in elevated sympathetic activation. RVP is essentially a non-physiological modality that mimics left bundle branch block (LBBB), which may disrupt normal electrical activity and activate the sympathetic nerve system. Therefore, increased sympathetic activity may compensate for the magnitude of BP reduction by pacing. Further research that includes a more comprehensive assessment of ANS and more hemodynamic parameters may prove helpful to evaluate this hypothesis.
Patients with AVB tend to have a higher VP% than those with SND. Our study
found that BP variations appeared to be more pronounced in the high-VP% group,
which could be attributed to loss of AV synchrony and atrial contraction in
patients with a high VP%. However, this does not necessarily imply a direct
linear correlation between VP% and BP variations. To date, there is no evidence
suggesting a dose-dependent correlation between BP reduction and pacing burden.
In patients with a low VP% (e.g., VP%
The regulation of blood pressure in humans is a highly intricate process. In the present study, we tried to identify which subgroup would experience more pronounced BP variations. A significant difference in SBP change was found between patients grouped by their baseline SBP and those grouped by the use of AHDs, while changes were not comparable between patients grouped by their combined history of hypertension. Multiple studies have clearly illustrated that abnormal sympathetic activity may be responsible for the appearance and maintenance of high blood pressure [29, 30, 31]. In our study, the mean baseline SBP was around 145 mmHg in the group with a higher baseline SBP, meeting the diagnostic criteria for hypertension [20]. Instantaneous sympathetic tone may be higher in these patients. In contrast, certain anti-hypertensive medications may reduce sympathetic activity and improve vagal cardiac control [32, 33], potentially resulting in a relatively lower basal sympathetic tone in patients treated with these drugs compared to those without AHDs. Conversely, patients with a history of hypertension, who have undergone long-term anti-hypertensive treatments, may no longer differ from those without a HTN history in baseline BP and sympathetic tone. This could explain why higher baseline BP was potentially linked to high BP variation while the use of AHDs produced an opposite trend. Based on these findings, we assumed that higher baseline sympathetic activity may contribute to a greater magnitude of SBP reduction after the initiation of pacing therapy that alleviates sympathetic activity. No relevant studies are currently available, and future experimental and clinical investigations are necessary to validate our assumption.
As a new emerging pacing strategy, LBBAP delivers a huge breakthrough in conduction system pacing, and it is meaningful to illustrate its hemodynamic outcomes. This study produced a preliminary insight into the acute variations in blood pressure during pacemaker implantation and the initiation of pacing therapy by comparing LBBAP with RVP using propensity score matching. Our findings will help clinicians gain a comprehensive understanding of the LBBAP technique and promote its further adoption. It is worth noting that the acute hemodynamic responses may differ between de-novo pacemaker recipients and chronically paced patients, highlighting the requirement for further research on its long-term hemodynamic impact. Moreover, it is necessary for future prospective studies to comprehensively measure and record more hemodynamic parameters such as cardiac output, total peripheral resistance, and respiratory rate, and characterize the timeline of hemodynamic changes during pacing therapy. Since LBBAP produces a more synchronized ventricular motion, future studies could also incorporate echocardiographic assessment to evaluate the relationship between hemodynamic changes and improved cardiac function.
The present study has several limitations. First, it was a single-center retrospective analysis, and the potential bias inherent in a non-randomized design cannot be avoided. Although we performed PSM to minimize the confounding factors between LBBAP and RVP patients, heterogeneity among patients still remained. Second, blood pressure is a dynamic parameter that can be influenced by various factors. Specifically, some of the enrolled patients receiving pacemaker implantation were critically ill. During critical illness, the body undergoes significant stress and physiological changes that can affect blood pressure. Inpatient hospital stays can cause BP fluctuations for other hospitalized patients, stemming from factors such as stress, medications, fluid imbalances, and illness progression. In contrast to home/ambulatory blood pressure, measuring blood pressure during inpatient stays may offer a less comprehensive assessment. This limitation can interfere with our ability to accurately reflect the true BP changes. Third, the use of an arm pressure cuff for BP measurement could have introduced some measurement errors. As this study was conducted retrospectively, it was not feasible to utilize invasive blood pressure transducers to confirm the accuracy of external arm cuff-based pressure readings for each participant. Additionally, the majority of enrolled patients had no indications for invasive blood pressure monitoring. In the future, we can consider applying invasive blood pressure monitoring techniques to observe the effects of pacing on blood pressure in appropriate patients. Fourth, the present study did not investigate the physiological mechanisms underlying the acute BP reduction caused by pacing. We speculate that pacing may have corrected the bradycardia and thereby eliminated the associated compensatory BP elevation. We considered this phenomenon as a physiological response, returning the blood pressure to the patient’s normal level. However, it is essential to note that significant periprocedural BP fluctuations could increase the risk of adverse events. Therefore, close monitoring of blood pressure should be implemented during the periprocedural period of pacing. Future well-designed clinical or mechanical studies could simultaneously measure other hemodynamic parameters to gain deeper insights into the mechanisms underlying this phenomenon.
Permanent pacemaker implantation may contribute to a decrease in systolic blood pressure shortly after implantation, which is more prominent in LBBAP receivers. Baseline SBP and the use of anti-hypertensive drugs are potentially associated with the magnitude of BP variation. Further large-scale prospective studies are needed to confirm the exact relationship between cardiac pacing and blood pressure variation, as well as the long-term hemodynamic effects of LBBAP versus RVP.
ACEi/ARB, angiotensin-converting enzyme inhibitor /angiotensin receptor blocker; AF/AFL, atrial fibrillation/atrial flutter; AHDs, antihypertensive drugs; ANS, autonomic nervous system; AVB, atrioventricular block; BP, blood pressure; CCB, calcium channel blockers; CO, cardiac output; DBP, diastolic blood pressure; ECG, electrocardiogram; HR, heart rate; HTN, hypertension; IVS, interventricular septum; LBBAP, left bundle branch area pacing; LVAT, left ventricular activation time; LVEDD, left ventricular end-diastolic dimension; LVEF, left ventricular ejection fraction; PSM, propensity score-matching; RBBD, right bundle branch conduction delay; RVP, right ventricular pacing; SBP, systolic blood pressure; SD, standard deviation; SND, sinus node dysfunction.
The original data presented in the study are included in the article, further inquiries can be directed to the corresponding authors.
SW, WL, YD, and KC designed of the study. ZC, QH, YL, YG and WW were involved in data collection. SW, YW, RC and SZ were involved in the interpretation of data. SW and WL drafted the first version of the manuscript, and YD, KC, and SZ revised the manuscript for critically intellectual content. All authors read, critically revised and approved the manuscript. All authors agree to be accountable for all aspects of the work in ensuring that questions related to the accuracy or integrity of the study are appropriately investigated and resolved.
This study conformed with the Declaration of Helsinki and was approved by the Ethics Committee of Fuwai hospital (No.2019-1149). All participants provided written informed consent for pacemaker implantation and use of data for clinical investigation.
The authors thank Dr. Xiaohong Zhou (Medtronic, Inc.) for his diligent review of our manuscript.
This study was funded by the National Natural Science Foundation (NSFC) of China (Grant Number: 81870260) and National High Level Hospital Clinical Research Funding (Grant Number: 2022-GSP-GG-31).
The authors declare no conflict of interest.
References
Publisher’s Note: IMR Press stays neutral with regard to jurisdictional claims in published maps and institutional affiliations.