
- Academic Editors
Background: Acute kidney injury (AKI) is a common complication after pediatric cardiac surgery. And autologous blood transfusion (ABT) is an important predictor of postoperative AKI. Unlike previous studies, which mainly focused on the correlation between ABT and AKI, the current study focuses heavily on the causal relationship between them, thus providing guidance for the treatment of patients during hospitalization to reduce the occurrence of AKI. Methods: A retrospective cohort of 3386 patients extracted from the Pediatric Intensive Care database was used for statistical analysis, multifactorial analysis, and causal inference. Characteristics that were correlated with ABT and AKI were categorized as confounders, instrumental variables, and effect modifiers, and were entered into the DoWhy causal inference model to determine causality. The calculated average treatment effect (ATE) was compared with the results of the multifactorial analysis. Results: The adjusted odds ratio (OR) for ABT volume was obtained by multifactorial analysis as 0.964. The DoWhy model refute test was able to indicate a causal relationship between ABT and AKI. Any ABT reduces AKI about 15.3%–18.8% by different estimation methods. The ATE regarding the amount of ABT was –0.0088, suggesting that every 1 mL/kg of ABT reduced the risk of AKI by 0.88%. Conclusions: Intraoperative transfusion of autologous blood can have a protective effect against postoperative AKI.
Acute kidney injury (AKI) after pediatric cardiac surgery is very common, and the incidence is approximately 52% in infants [1], and 9.6–42% in children [2, 3]. AKI after surgery increases the length of hospital stay as well as the cost of treatment, and increases mortality [4, 5, 6, 7]. Even when patients survive AKI, they have an increased likelihood of developing long-term adverse outcomes such as chronic kidney disease and end-stage renal disease [8].
The pathophysiology of cardiac surgery-associated AKI is very complex and probably includes renal ischemia-reperfusion injury, inflammation, oxidative stress, hemolysis, and nephrotoxins [9]. A number of preoperative variables have been identified as risk factors of AKI in adult patients [10], and some sensitive biomarkers were also identified in pediatric patients [11], but there are few of these factors that can be changed to reduce the occurrence of AKI. Therefore, some changeable procedural variables, such as duration of cardiopulmonary bypass (CPB), hemodilution, low oxygen delivery, perioperative anemia, and blood transfusion, have been studied for their impact on AKI prevention [12, 13, 14, 15]. Numerous observational studies have shown that perioperative allogeneic blood transfusion and AKI after cardiac surgery are independently associated with each other [15, 16]. Cardiac surgery with CPB causes some degree of ischemia-reperfusion-related kidney injury thereby increasing the risk of AKI, whereas anemia and transfusion further aggravate kidney injury. Intraoperative allogeneic blood transfusion, therefore, should be minimized.
One option to reduce allogeneic blood delivery is intraoperative autologous blood transfusion (ABT), the retrograde autologous priming of the CPB circuit that is one of the ABT has been recommended by guidelines [17, 18]. In one of our previous studies we developed a real-time predictive model for the occurrence of AKI in children within 7 days after cardiac surgery [19]. We found that the more autologous blood delivery lowers the risk of AKI in almost all models that predict AKI at different time points and time windows, as shown in Supplementary Figs. 1,2,3. However, the prediction model only shows a correlation between ABT and AKI and does not indicate that the transfusion of autologous blood is the cause of reduced AKI. Previously, few studies have investigated the causal relationship between ABT and AKI, focusing instead only on their correlation. In the present study, we aimed to quantitatively evaluate the causal relationship between ABT and AKI quantitatively by using causal inference, and to provide evidence that can effectively support decisions during treatment to reduce the risk of postoperative AKI.
The study was a retrospective cohort design that included pediatric patients
(
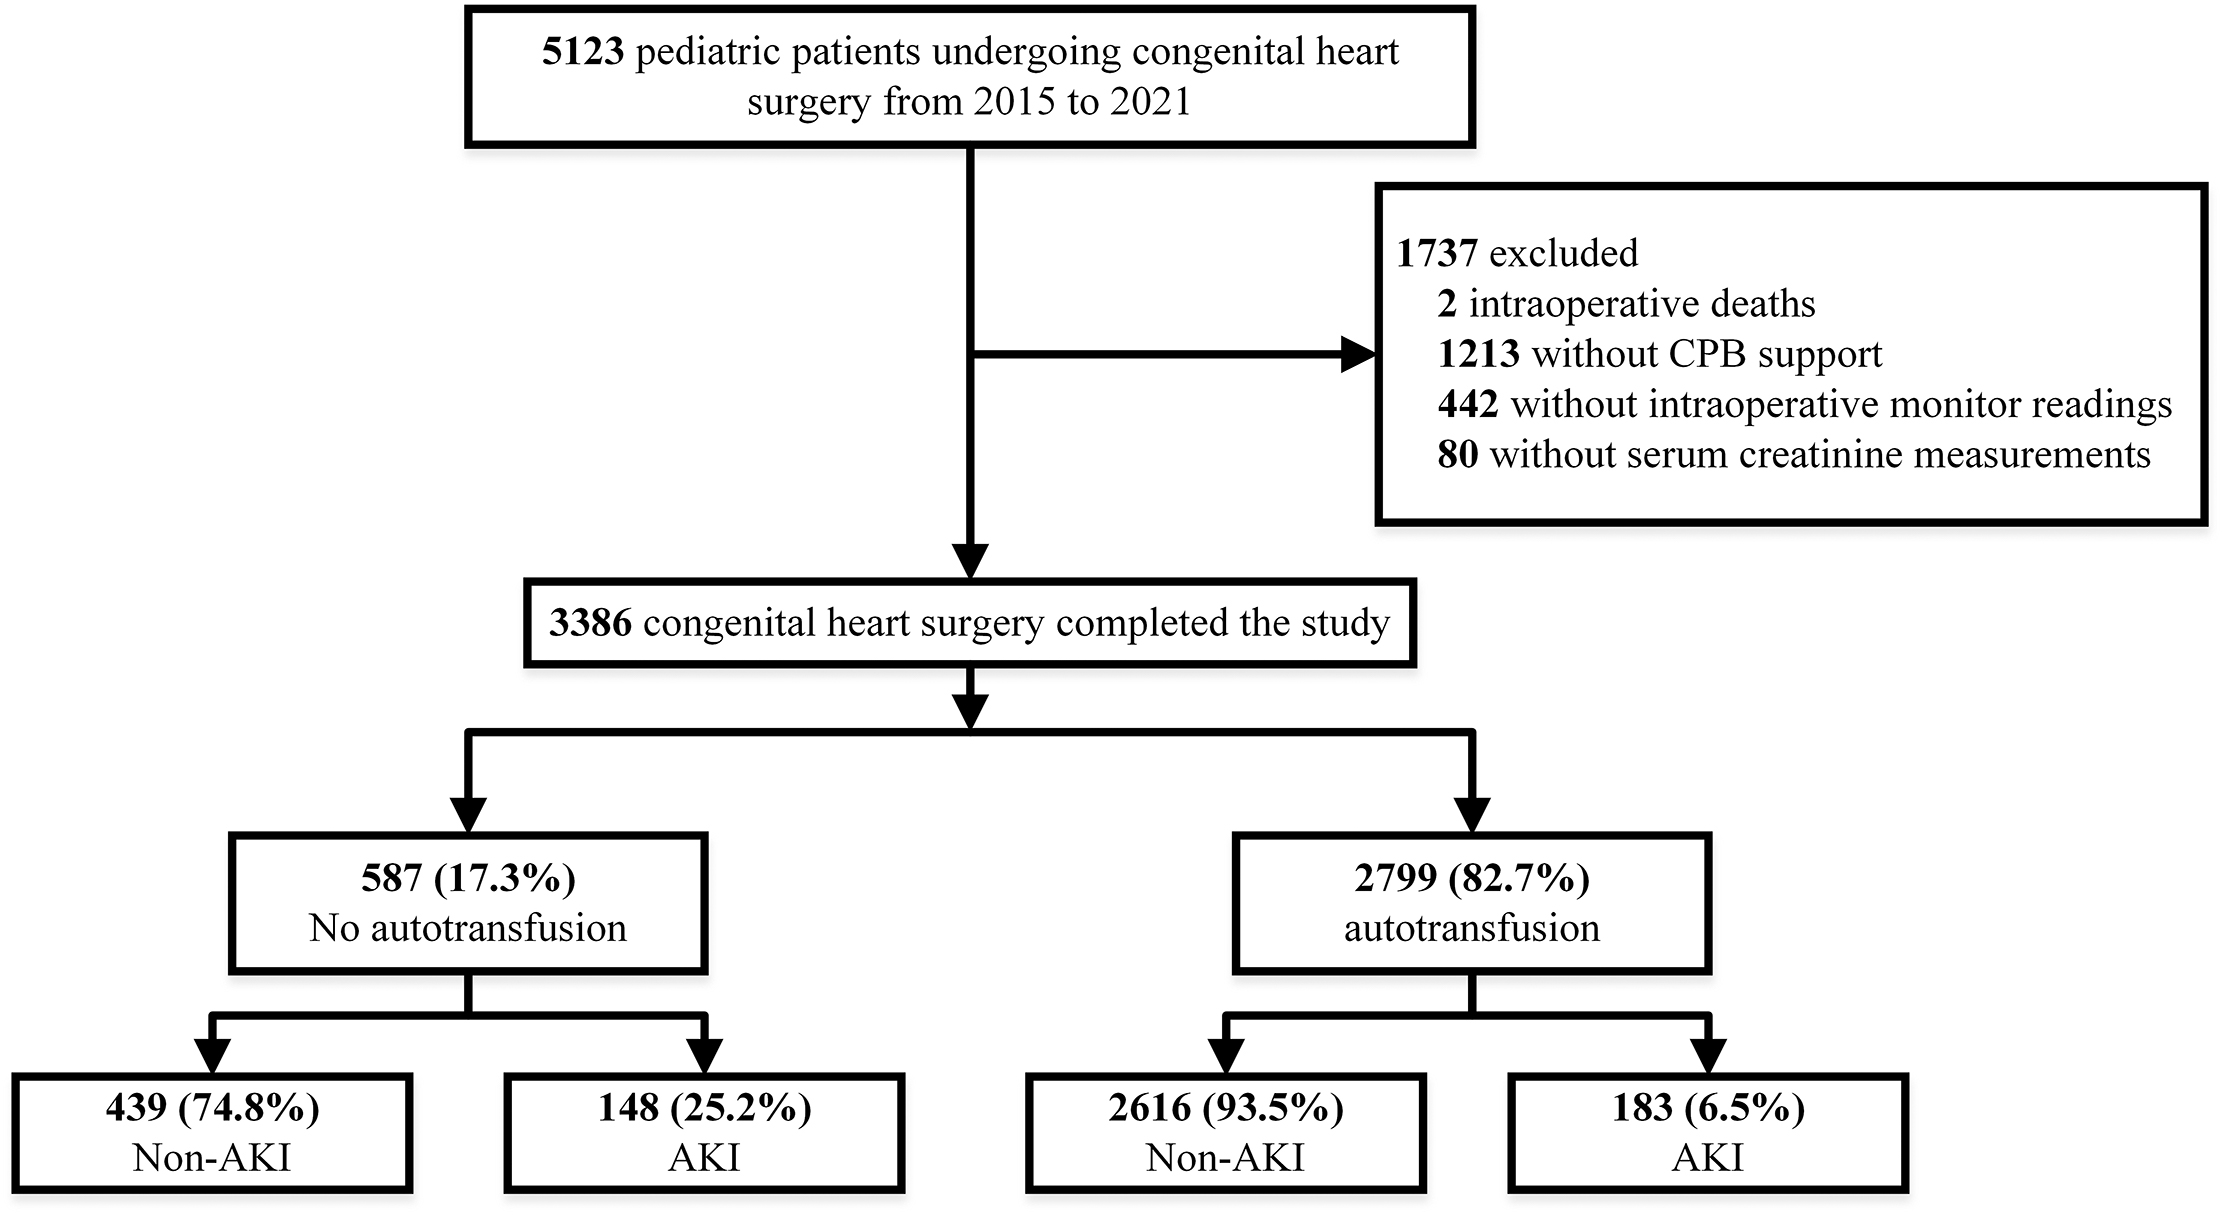 Fig. 1.
Flowchart depicting the selection of patients. After applying inclusion and exclusion criteria, we identified 2799 (82.7%) cases with autoblood transfusion and 587 (17.3%) cases without autoblood transfusion. The rate of postoperative AKI in the auto-blood group was 6.5%, while the rate of postoperative AKI in the non-auto-blood group was 25.2%. CPB, cardiopulmonary bypass; AKI, acute kidney injury.
Institutional Review Board approval from the Children’s Hospital, Zhejiang University School of Medicine (2018-IRB-078) was obtained prior to the commencement of this study, and informed consent was waived because the research involved no more than minimal risk to patients. The waiver does not adversely affect the rights and welfare of the participants.
During CPB supported pediatric heart surgery, the goal of transfusion is to
maintain the hematocrit over 25%. In practice, for patients less than 10 kg, 1
unit of red blood cells is used in the priming fluid of CPB. For patients greater
than 10 kg usually have a bloodless prime so long as the hematocrit
Demographic characteristics, intraoperative vital signs, and laboratory tests were collected from the electronic medical record system during the patient’s hospitalization. An overview of all 94 characteristics considered is prsented in Supplementary Table 1. They can be divided into static features (e.g., patient and procedure features) and time-series features (e.g., intraoperative vital signs, laboratory values, and blood gas analysis values). As the model we used in the causal analysis does not yet support dynamic data entry, we averaged the time-series values such as intraoperative variables and laboratory test variables. For categorical features such as type of surgery and surgical diagnosis, we used one-hot encoding to convert them to a binary representation. Also, because the patient cohort consisted of children, we changed the units of fresh frozen plasma (FFP) and ABT to mL/kg.
In order to make preliminary relationship assumptions for the causal analysis
that follows, statistical analyses of the variables in this study were done for
the ABT and non-ABT groups and for the AKI and non-AKI groups. All normally
distributed continuous variables are expressed as mean and standard deviation
(SD) and compared using a two sample t-test. Skewed continuous data are
expressed as median and interquartile range (IQR), and compared using the
Kruskal-Wallis test. Categorical variables are expressed as count and percentage,
and compared with Pearson’s Chi-squared test. Features between patients with and
without AKI, and with and without ABT were all compared. Binary logistic
regression analysis was used to calculate odds-ratios (OR) for the features that
associated with the ABT. Unadjusted and adjusted multivariate logistic
regressions were performed to evaluate the impact of volume of autologous blood
on the AKI. The analyses were performed using Python package of Tableone and
Statsmodels. All statistical tests were two-tailed, and p
The fact that there is a link between ABT and AKI does not mean that there is also a causal relationship between them. The estimation of causal effects involves key assumptions about the data generation process, such as the directionality of the effect, the presence of instrumental variables or mediators, and whether all relevant confounding factors are observed [21]. Violation of any of these assumptions would lead to significant bias in the estimation of effects. However, unlike cross-validation of prediction models, there is no global validation method for causal estimation. Therefore, deriving different causal hypotheses and testing them as much as possible becomes the key to any analysis. In this study, we chose DoWhy [22], a Python library released by Microsoft for end-to-end causal inference, to study the causal relationship between intraoperative ABT and AKI after pediatric cardiac surgery. It allows for the explicit declaration of hypotheses through cause-and-effect diagrams and provides multiple validation tests to examine subsets of these hypotheses.
The entire causal inference process of DoWhy can be divided into four major steps (Fig. 2).
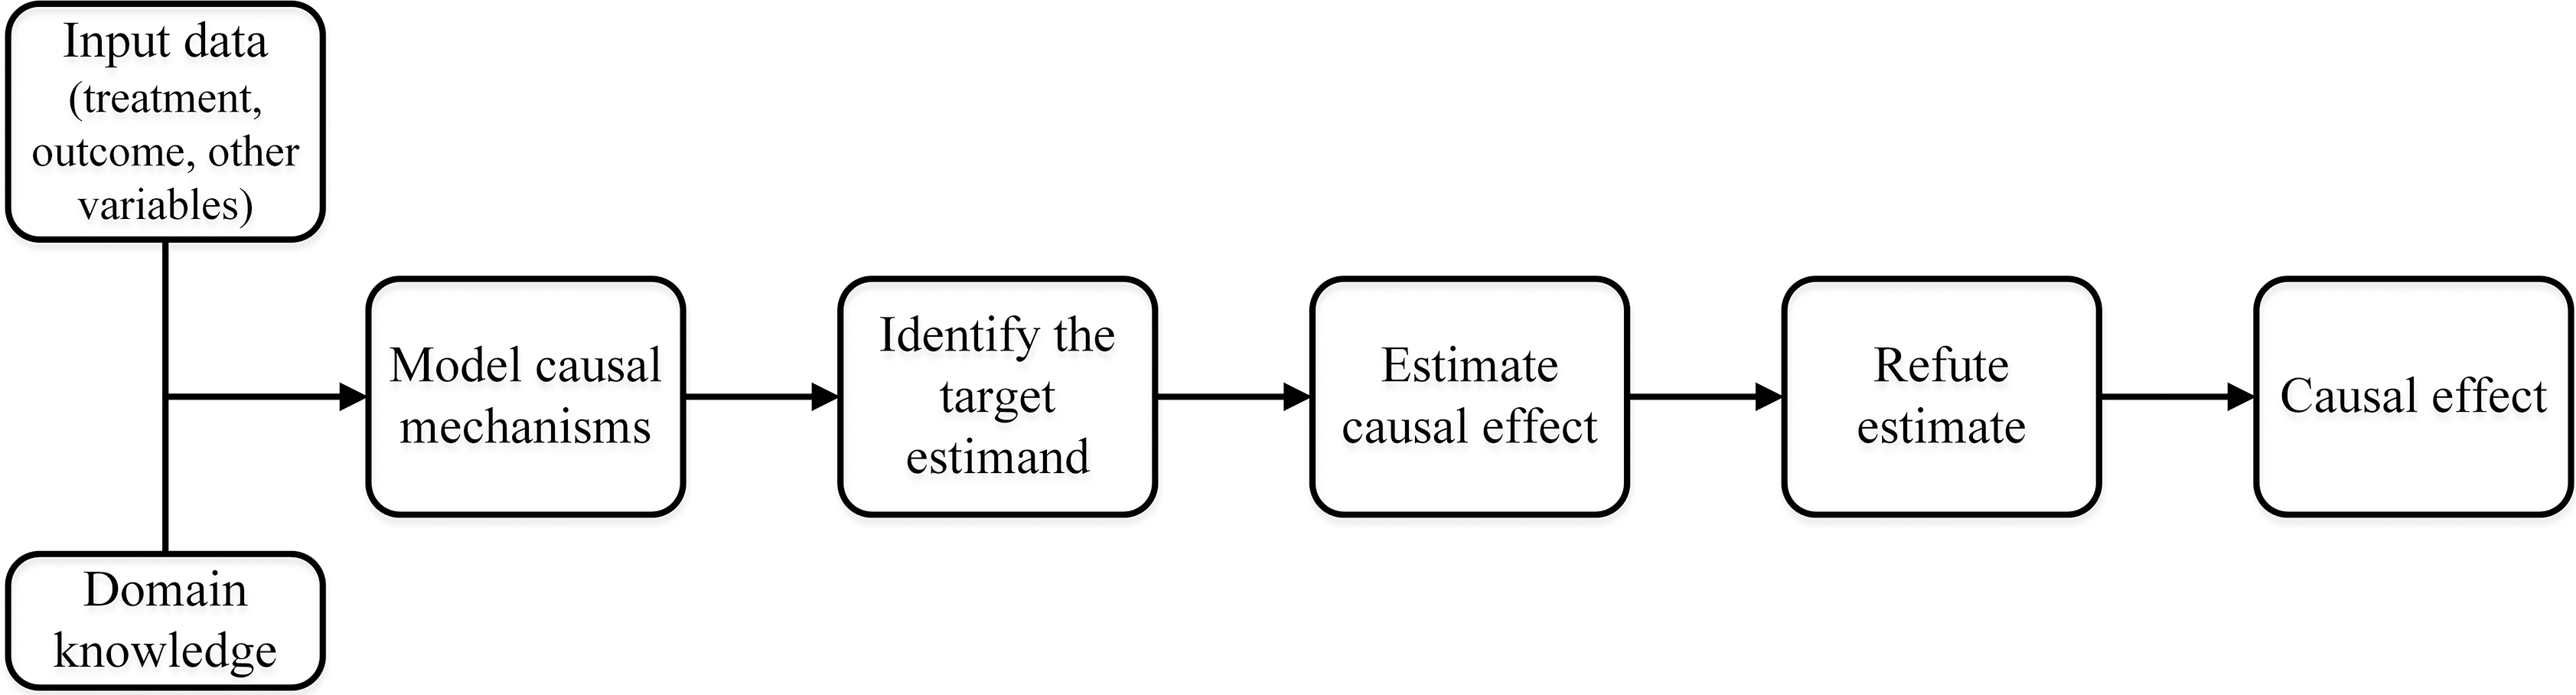 Fig. 2.
The causal inference flowchart in DoWhy. The four main steps of DoWhy causal inference: (1) Model: Construct a causal graph based on domain knowledge. (2) Identify: Formulate correct estimand based on the causal model. (3) Estimate: Use a suitable method to estimate effect. (4) Refute: Check robustness of estimate to assumption violations.
Firstly, ABT was defined as treatment and AKI was defined as outcome. Based on the above statistical analyses for patients in the ABT and non-ABT groups and in the AKI and non-AKI groups, characteristics significantly associated with autologous transfusion only were defined as instrumental variables (indirectly affecting the outcome by influencing the intervention), characteristics significantly associated with AKI only were defined as effect modifiers (directly affecting the outcome but not the intervention), and characteristics significantly associated with both were defined as confounders (affecting the intervention and outcome factors). The hypothetical model diagram was then generated based on three categories of these variables as shown in Fig. 3. The resulting hypothesized relationship diagrams do not need to be complete; DoWhy supports the automatic inclusion of the remaining variables as potential confounders. Then, DoWhy finds the expression that can identify the causal effect based on the constructed causal diagram and do-integral, and then use statistical methods to estimate the expression to calculate average treatment effect (ATE). After that, the following robustness checks were used to verify the correctness of the estimates:
Refute 1: Add a random confounder. Estimate whether the causal effect changes after adding a random variable as a confounder (expected result: No).
Refute 2: Placebo intervention. Estimate whether the causal effect changes when the real intervention variable is replaced by an independent random variable (expected result: the new causal effect goes to zero).
Refute 3: Data Subset Validation. Estimate whether the causal effect changes after replacing a given data set with a random subset (expected result: No).
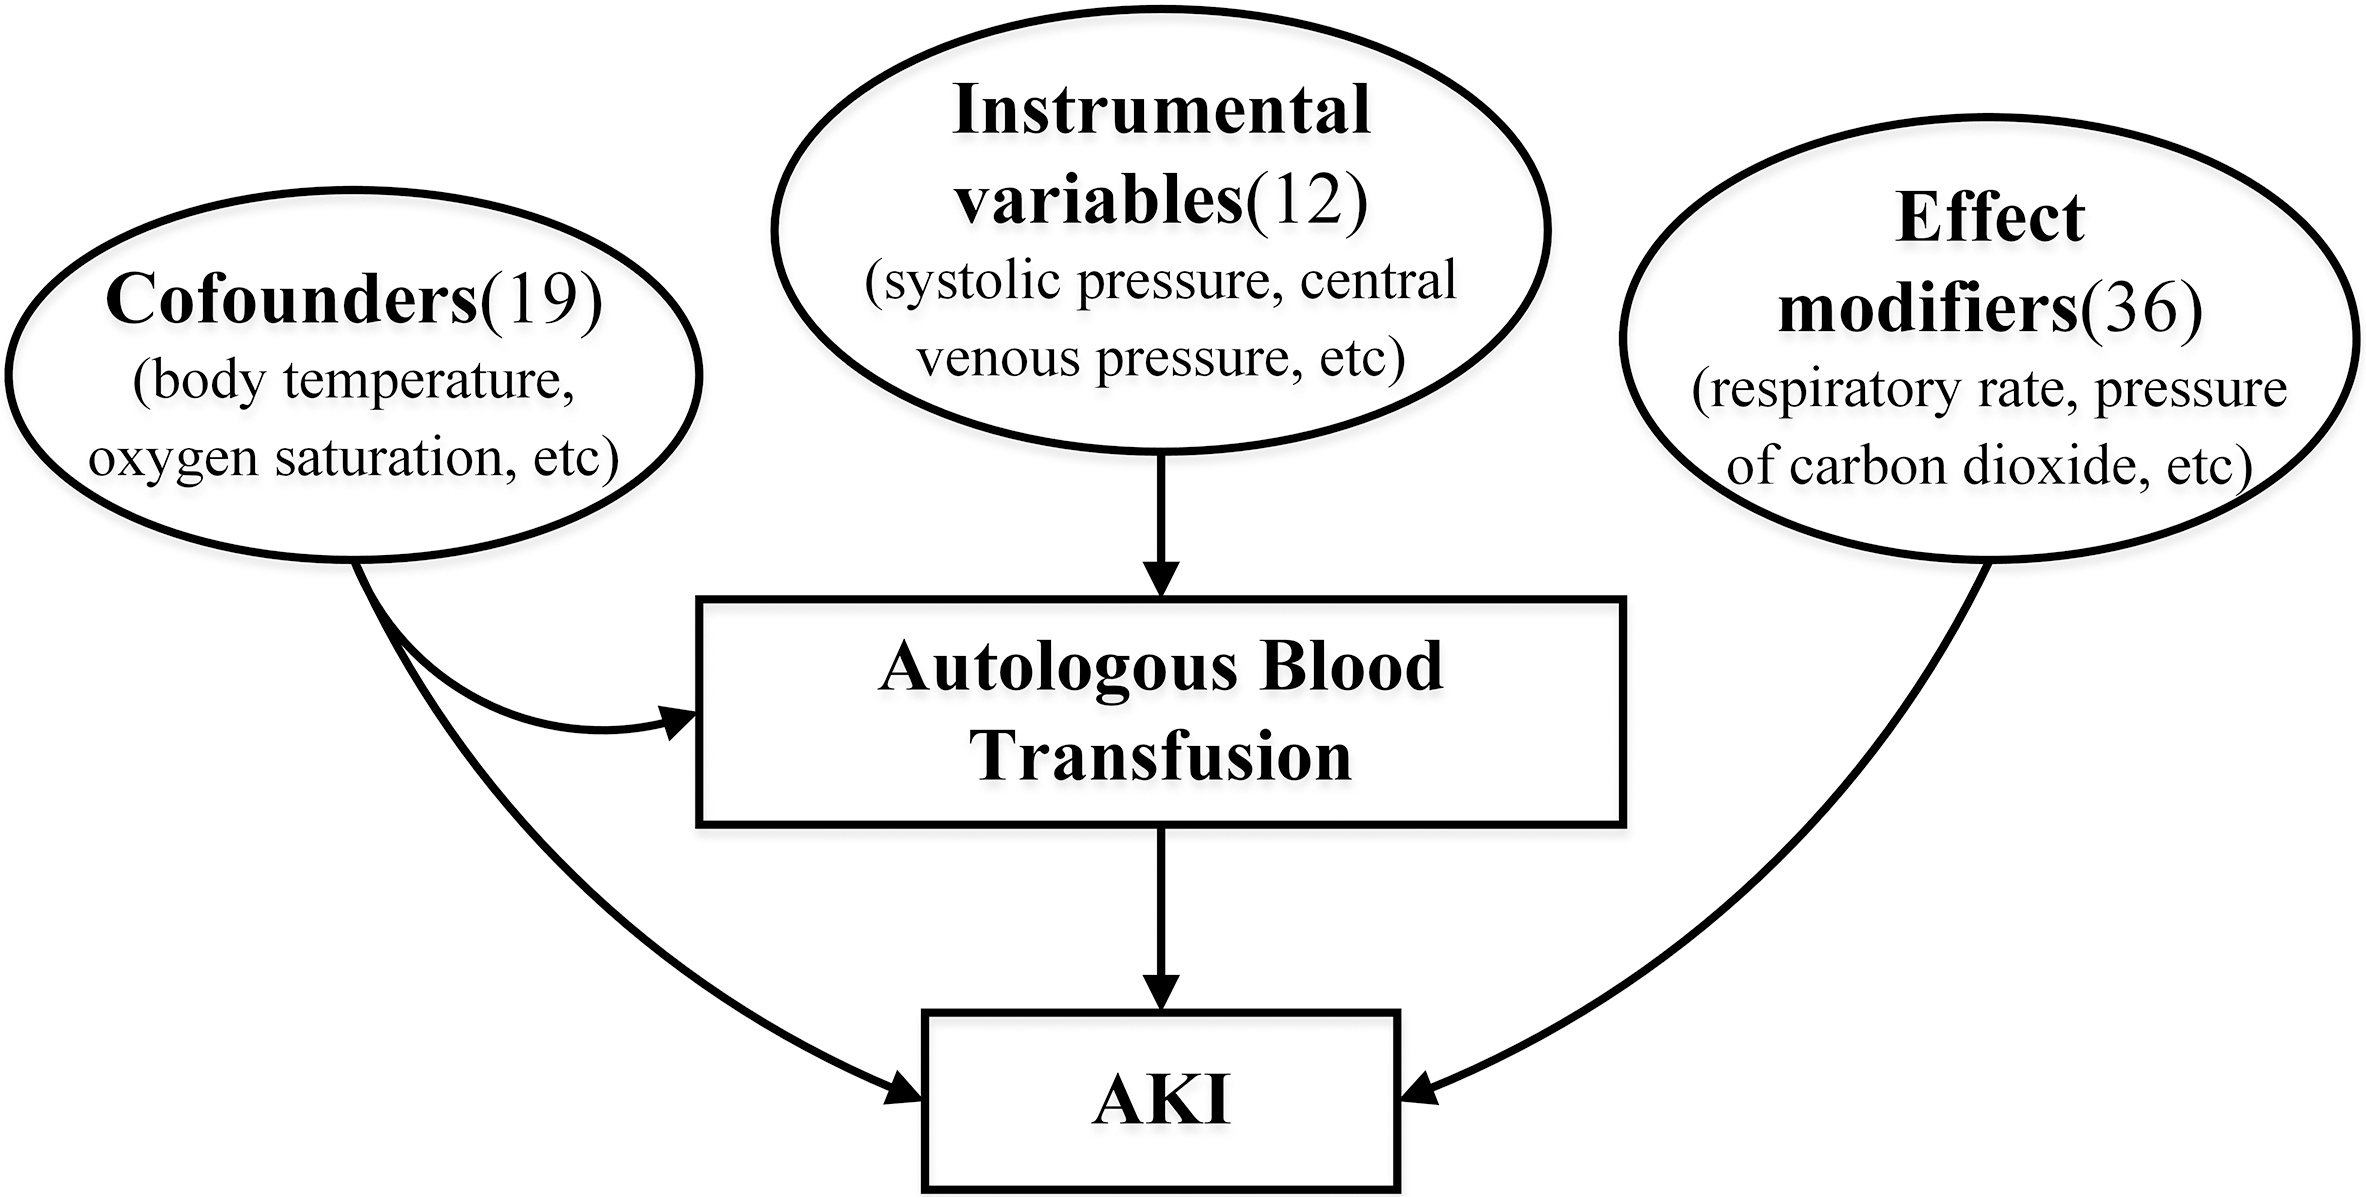 Fig. 3.
The hypothetical causal model diagram. According to statistical analysis, the characteristics can be divided into three categories: confounders, instrumental variables, effect modifiers. Confounders contain 19 features, including body temperature, oxygen saturation, etc. Instrumental variables contain 12 features, including systolic pressure, central venous pressure, etc. Effect modifiers contain 36 features, including respiratory rate, pressure of carbon dioxide, etc. AKI, acute kidney injury.
According to the inclusion and exclusion criteria, a total of 3386 patients were
finally included in this study. The flow chart is shown in Fig. 1.
Supplementary Table 2 presents the statistical analysis of all
characteristics of patients as to whether or not autologous blood was transfused.
The statistically significant features in this analysis are presented in Table 1.
Of the total sample, 2799 patients (82.7%) underwent intraoperative
autotransfusion with a median and interquartile of 14.5 (10.2, 21.6) mL/kg for
autotransfusion, whereas 587 patients were in the non-autotransfusion group.
Significant differences (p
| Features | Non-ABT | ABT | p-value | |
| n = 587 | n = 2799 | |||
| Intraoperative vital signs | ||||
| systolic pressure (mmHg) | 81.5 [76.0, 90.3] | 77.7 [76.0, 88.2] | 0.022 | |
| central venous pressure (cmH2O) | 9.6 (6.2) | 9.0 (5.0) | 0.047 | |
| body temperature (°C) | 35.4 [34.8, 35.7] | 35.4 [35.2, 35.7] | 0.002 | |
| heart rate (bpm) | 135.6 [125.0, 147.4] | 130.1 [125.0, 145.1] | ||
| pulse (bpm) | 140.1 [127.0, 153.3] | 133.9 [127.0, 150.5] | ||
| oxygen saturation (%) | 98.7 [96.4, 99.2] | 99.0 [97.6, 99.1] | 0.004 | |
| Arterial blood gas values | ||||
| methemoglobin (%) | 1.0 [0.8, 1.2] | 1.1 [0.9, 1.3] | ||
| Preoperative Laboratory results | ||||
| hematocrit (%) | 36.2 [34.1, 38.9] | 35.8 [33.5, 38.3] | 0.003 | |
| red blood cell count (10 |
4.4 [4.1, 4.7] | 4.4 [4.0, 4.7] | 0.018 | |
| hemoglobin (g/L) | 120.2 [111.5, 128.4] | 118.2 [109.2, 126.6] | 0.002 | |
| neutrophil (10 |
34.9 [26.8, 46.2] | 33.1 [25.6, 44.1] | 0.017 | |
| monocyte (10 |
6.2 [4.9, 7.6] | 6.3 [5.1, 7.9] | 0.040 | |
| basophilic granulocyte (10 |
0.5 [0.3, 0.7] | 0.4 [0.3, 0.6] | ||
| platelet distribution width (%) | 13.0 [10.4, 15.7] | 11.3 [9.6, 15.4] | ||
| mean platelet volume (fL) | 9.5 (1.1) | 9.6 (1.1) | 0.011 | |
| absolute basophil count (10 |
0.0 [0.0, 0.1] | 0.0 [0.0, 0.1] | ||
| high-sensitivity C-reactive protein (mg/L) | 2.4 [1.0, 4.9] | 1.9 [1.0, 3.8] | ||
| Intraoperative variables | ||||
| Mechanical ventilation time (hours) | 17.0 [4.0, 25.0] | 7.0 [4.0, 22.0] | ||
| pRBC transfusion during surgery (units) | 1.0 [1.0, 2.0] | 1.0 [1.0, 2.0] | 0.010 | |
| FFP transfusion during surgery (mL/kg) | 21.4 [13.8, 43.1] | 17.1 [12.2, 28.3] | ||
| ABT during surgery (mL/kg) | 0.0 [0.0, 0.0] | 14.5 [10.2, 21.6] | ||
| PreSpO2 of right upper limb (%) | 98.0 [96.0, 99.0] | 98.0 [96.0, 99.0] | 0.006 | |
| Other preoperative risk factors | 76 (12.9) | 493 (17.6) | 0.007 | |
| Aristotle basic complexity score | 6.0 [6.0, 6.8] | 6.0 [5.0, 6.0] | 0.003 | |
| STS mortality score | 0.3 [0.2, 0.4] | 0.2 [0.2, 0.4] | 0.022 | |
| STS morbidity score | 0.7 [0.5, 1.1] | 0.7 [0.5, 1.1] | 0.005 | |
| Number of major operations | 0.037 | |||
| 1 | 193 (32.9%) | 1035 (37.0%) | ||
| 394 (67.1%) | 1764 (63.0%) | |||
| Number of defects | 0.018 | |||
| 1 | 181 (30.8%) | 1008 (36.0%) | ||
| 406 (69.2%) | 1791 (64.0%) | |||
| Preoperative length of stay (days) | 5.0 [3.0, 8.0] | 4.0 [2.0, 7.0] | ||
| Surgery procedure | ||||
| Tricuspid valve plasty | 34 (5.8%) | 109 (3.9%) | 0.049 | |
| Mitral valve plasty | 33 (5.6%) | 104 (3.7%) | 0.044 | |
| PFO, primary closure | 164 (27.9%) | 635 (22.7%) | 0.008 | |
| ASD repair, patch | 125 (21.3%) | 810 (28.9%) | ||
| Surgery diagnosis | ||||
| PFO | 168 (28.6%) | 641 (22.9%) | 0.004 | |
| ASD, secundum | 264 (45.0%) | 1411 (50.4%) | 0.019 | |
| AKI | 148 (25.2%) | 183 (6.5%) | ||
Data are presented as median (interquartile range) or mean (standard deviation) or number (%). pRBC, packed red blood cell; FFP, fresh frozen plasma; ABT, autologous blood transfusion; PreSpO2, preoperative oxygen saturation; STS, Society of Thoracic Surgeons; PFO, patent foramen ovale; ASD, atrial septal defect; AKI, acute kidney injury.
| Features | Non-AKI | AKI | p-value | |
| n = 3055 | n = 331 | |||
| Intraoperative vital signs | ||||
| body temperature (°C) | 35.4 [35.1, 35.7] | 35.3 [34.8, 35.6] | ||
| respiratory rate (bpm) | 24.0 [23.6, 26.2] | 24.8 [23.1, 27.8] | 0.008 | |
| oxygen saturation (%) | 99.0 [97.6, 99.2] | 98.3 [95.6, 99.1] | ||
| Arterial blood gas values | ||||
| bicarbonate (mM) | 22.5 (2.6) | 22.9 (2.8) | 0.048 | |
| hemoglobin (g/L) | 112.7 (18.6) | 116.7 (24.1) | 0.004 | |
| pressure of oxygen (mmHg) | 178.1 [137.8, 202.9] | 166.8 [94.0, 200.6] | 0.001 | |
| hematocrit (%) | 34.8 (5.6) | 36.0 (7.3) | 0.004 | |
| oxygen saturation (%) | 99.1 [98.3, 99.5] | 98.9 [94.8, 99.5] | 0.002 | |
| methemoglobin (%) | 1.1 [0.9, 1.3] | 1.0 [0.8, 1.2] | ||
| calcium Ca |
1.2 (0.1) | 1.2 (0.1) | 0.002 | |
| lactate | 1.3 [0.9, 1.8] | 1.4 [1.0, 2.2] | ||
| Preoperative Laboratory results | ||||
| hematocrit (%) | 35.9 [33.6, 38.3] | 36.2 [34.1, 39.4] | 0.018 | |
| platelet count (10 |
322.2 (97.4) | 306.5 (96.5) | 0.005 | |
| hemoglobin (g/L) | 118.3 [109.5, 126.7] | 120.0 [110.7, 129.6] | 0.014 | |
| mean corpuscular volume (fL) | 83.3 (7.9) | 85.4 (9.8) | ||
| mean corpuscular hemoglobin (pg) | 27.4 (3.0) | 28.1 (3.7) | 0.001 | |
| red blood cell distribution width (%) | 13.4 [12.7, 14.5] | 13.7 [12.7, 15.2] | 0.004 | |
| eosinophil (10 |
2.2 [1.3, 3.5] | 1.9 [1.1, 3.2] | 0.008 | |
| neutrophil (10 |
33.2 [25.7, 43.7] | 37.2 [27.4, 51.2] | ||
| lymphocyte (10 |
56.4 [45.9, 64.4] | 52.0 [39.2, 62.4] | ||
| basophilic granulocyte (10 |
0.4 [0.3, 0.6] | 0.4 [0.3, 0.7] | 0.034 | |
| platelet distribution width (%) | 11.4 [9.7, 15.4] | 13.5 [10.4, 15.7] | ||
| thrombocytocrit (%) | 0.3 (0.1) | 0.3 (0.1) | 0.006 | |
| absolute value of basophils (10 |
0.0 [0.0, 0.1] | 0.0 [0.0, 0.1] | 0.022 | |
| absolute lymphocyte count (10 |
4.8 [3.6, 6.3] | 4.6 [3.3, 5.9] | 0.005 | |
| absolute neutrophil count (10 |
3.1 [2.3, 4.2] | 3.4 [2.5, 5.0] | ||
| high-sensitivity C-reactive protein (mg/L) | 1.9 [1.0, 3.9] | 2.7 [1.3, 5.4] | ||
| Demographics | ||||
| Age (months) | 12.6 [5.1, 30.6] | 5.6 [1.9, 15.3] | ||
| Height (cm) | 74.0 [63.0, 92.0] | 64.0 [55.0, 78.0] | ||
| Weight (kg) | 9.0 [6.0, 12.9] | 6.3 [4.3, 9.6] | ||
| Intraoperative/postoperatrive variables | ||||
| Operation time (mins) | 123.0 [107.0, 150.5] | 148.0 [119.0, 207.0] | ||
| Emergency Operation | 28 (0.9%) | 17 (5.1%) | ||
| Cardiopulmonary bypass time (mins) | 59.0 [47.0, 78.0] | 85.0 [59.0, 133.5] | ||
| Cross clamp time (mins) | 39.0 [28.0, 53.0] | 53.0 [38.5, 91.0] | ||
| Mechanical ventilation time (hours) | 6.0 [4.0, 21.0] | 24.0 [16.0, 90.0] | ||
| pRBC transfusion during surgery (units) | 1.0 [1.0, 1.5] | 2.0 [1.0, 3.0] | ||
| FFP transfusion during surgery (mL/kg) | 16.9 [12.2, 27.3] | 39.7 [17.6, 81.1] | ||
| ABT during surgery (mL/kg) | 12.6 [8.0, 19.3] | 10.0 [0.0, 24.0] | 0.001 | |
| PreSpO2 of right upper limb (%) | 98.0 [97.0, 99.0] | 97.0 [91.5, 98.0] | ||
| PostSpO2 of right upper limb (%) | 98.0 [97.0, 99.0] | 98.0 [97.0, 99.0] | 0.048 | |
| Previous congenital heart surgery | 42 (1.4%) | 12(3.6%) | 0.003 | |
| Other preoperative risk factors | 483 (15.8%) | 86 (26.0%) | ||
| Other malformation | 176 (5.8%) | 31 (9.4%) | 0.013 | |
| RACHS-1 category | ||||
| 1 | 808 (26.4%) | 42 (12.7%) | ||
| 2 | 1843 (60.3%) | 195 (58.9%) | ||
| 3 | 353 (11.6%) | 70 (21.1%) | ||
| 4 | 51 (1.7%) | 24 (7.3%) | ||
| Aristotle basic complexity score | 6.0 [4.0, 6.0] | 6.0 [6.0, 8.7] | ||
| STS mortality score | 0.2 [0.2, 0.4] | 0.4 [0.2, 0.7] | ||
| STS morbidity score | 0.7 [0.5, 1.1] | 1.1 [0.6, 1.3] | ||
| Number of major operations | ||||
| 1 | 1162 (38.0%) | 66 (19.9%) | ||
| 1893 (62.0%) | 265 (80.1%) | |||
| Number of defects | ||||
| 1 | 1130 (37.0%) | 59 (17.8%) | ||
| 1925 (63.0%) | 272 (82.2%) | |||
| Preoperative length of stay (days) | 4.0 [2.0, 7.0] | 7.0 [4.0, 11.0] | ||
| Surgery procedure | ||||
| TOF repair, ventriculotomy, transannular patch | 87 (2.8%) | 23 (6.9%) | ||
| Arterial switch operation | 32 (1.0%) | 18 (5.4%) | ||
| TAPVC repair | 70 (2.3%) | 19 (5.7%) | ||
| PDA closure | 713 (23.3%) | 140 (42.3%) | ||
| ASD repair, patch | 867 (28.4%) | 68 (20.5%) | 0.003 | |
| ASD repair, primary closure | 645 (21.1%) | 91 (27.5%) | 0.009 | |
| Surgery diagnosis | ||||
| TOF | 127 (4.2%) | 25 (7.6%) | 0.007 | |
| CoA | 64 (2.1%) | 28 (8.5%) | ||
| PDA | 716 (23.4%) | 140 (42.3%) | ||
Data are presented as median (interquartile range) or mean (standard deviation) or number (%). AKI, acute kidney injury; pRBC, packed red blood cell; FFP, fresh frozen plasma; ABT, autologous blood transfusion; PreSpO2, preoperative oxygen saturation; PostSpO2, postoperative oxygen saturation; RACHS-1, risk adjustment for congenital heart surgery; STS, society of thoracic surgeons; TOF, tetralogy of fallot; TAPVC, total anomalous pulmonary venous connection; PDA, patent ductus arteriosus; ASD, atrial septal defect; CoA, coarctation of the aorta.
The result of multiple logistic regression for ABT and confounders is presented
in Supplementary Table 5 and the significant associated features based
on multifactorial logistic regression analysis are presented in Table 3. Only 7
features were significantly associated with AKI after adjustment by other
factors. Multiple regression analyses of these variables showed that ABT during
surgery (adjusted OR: 0.964, 95% confidence interval [CI]: 0.954–0.975;
p
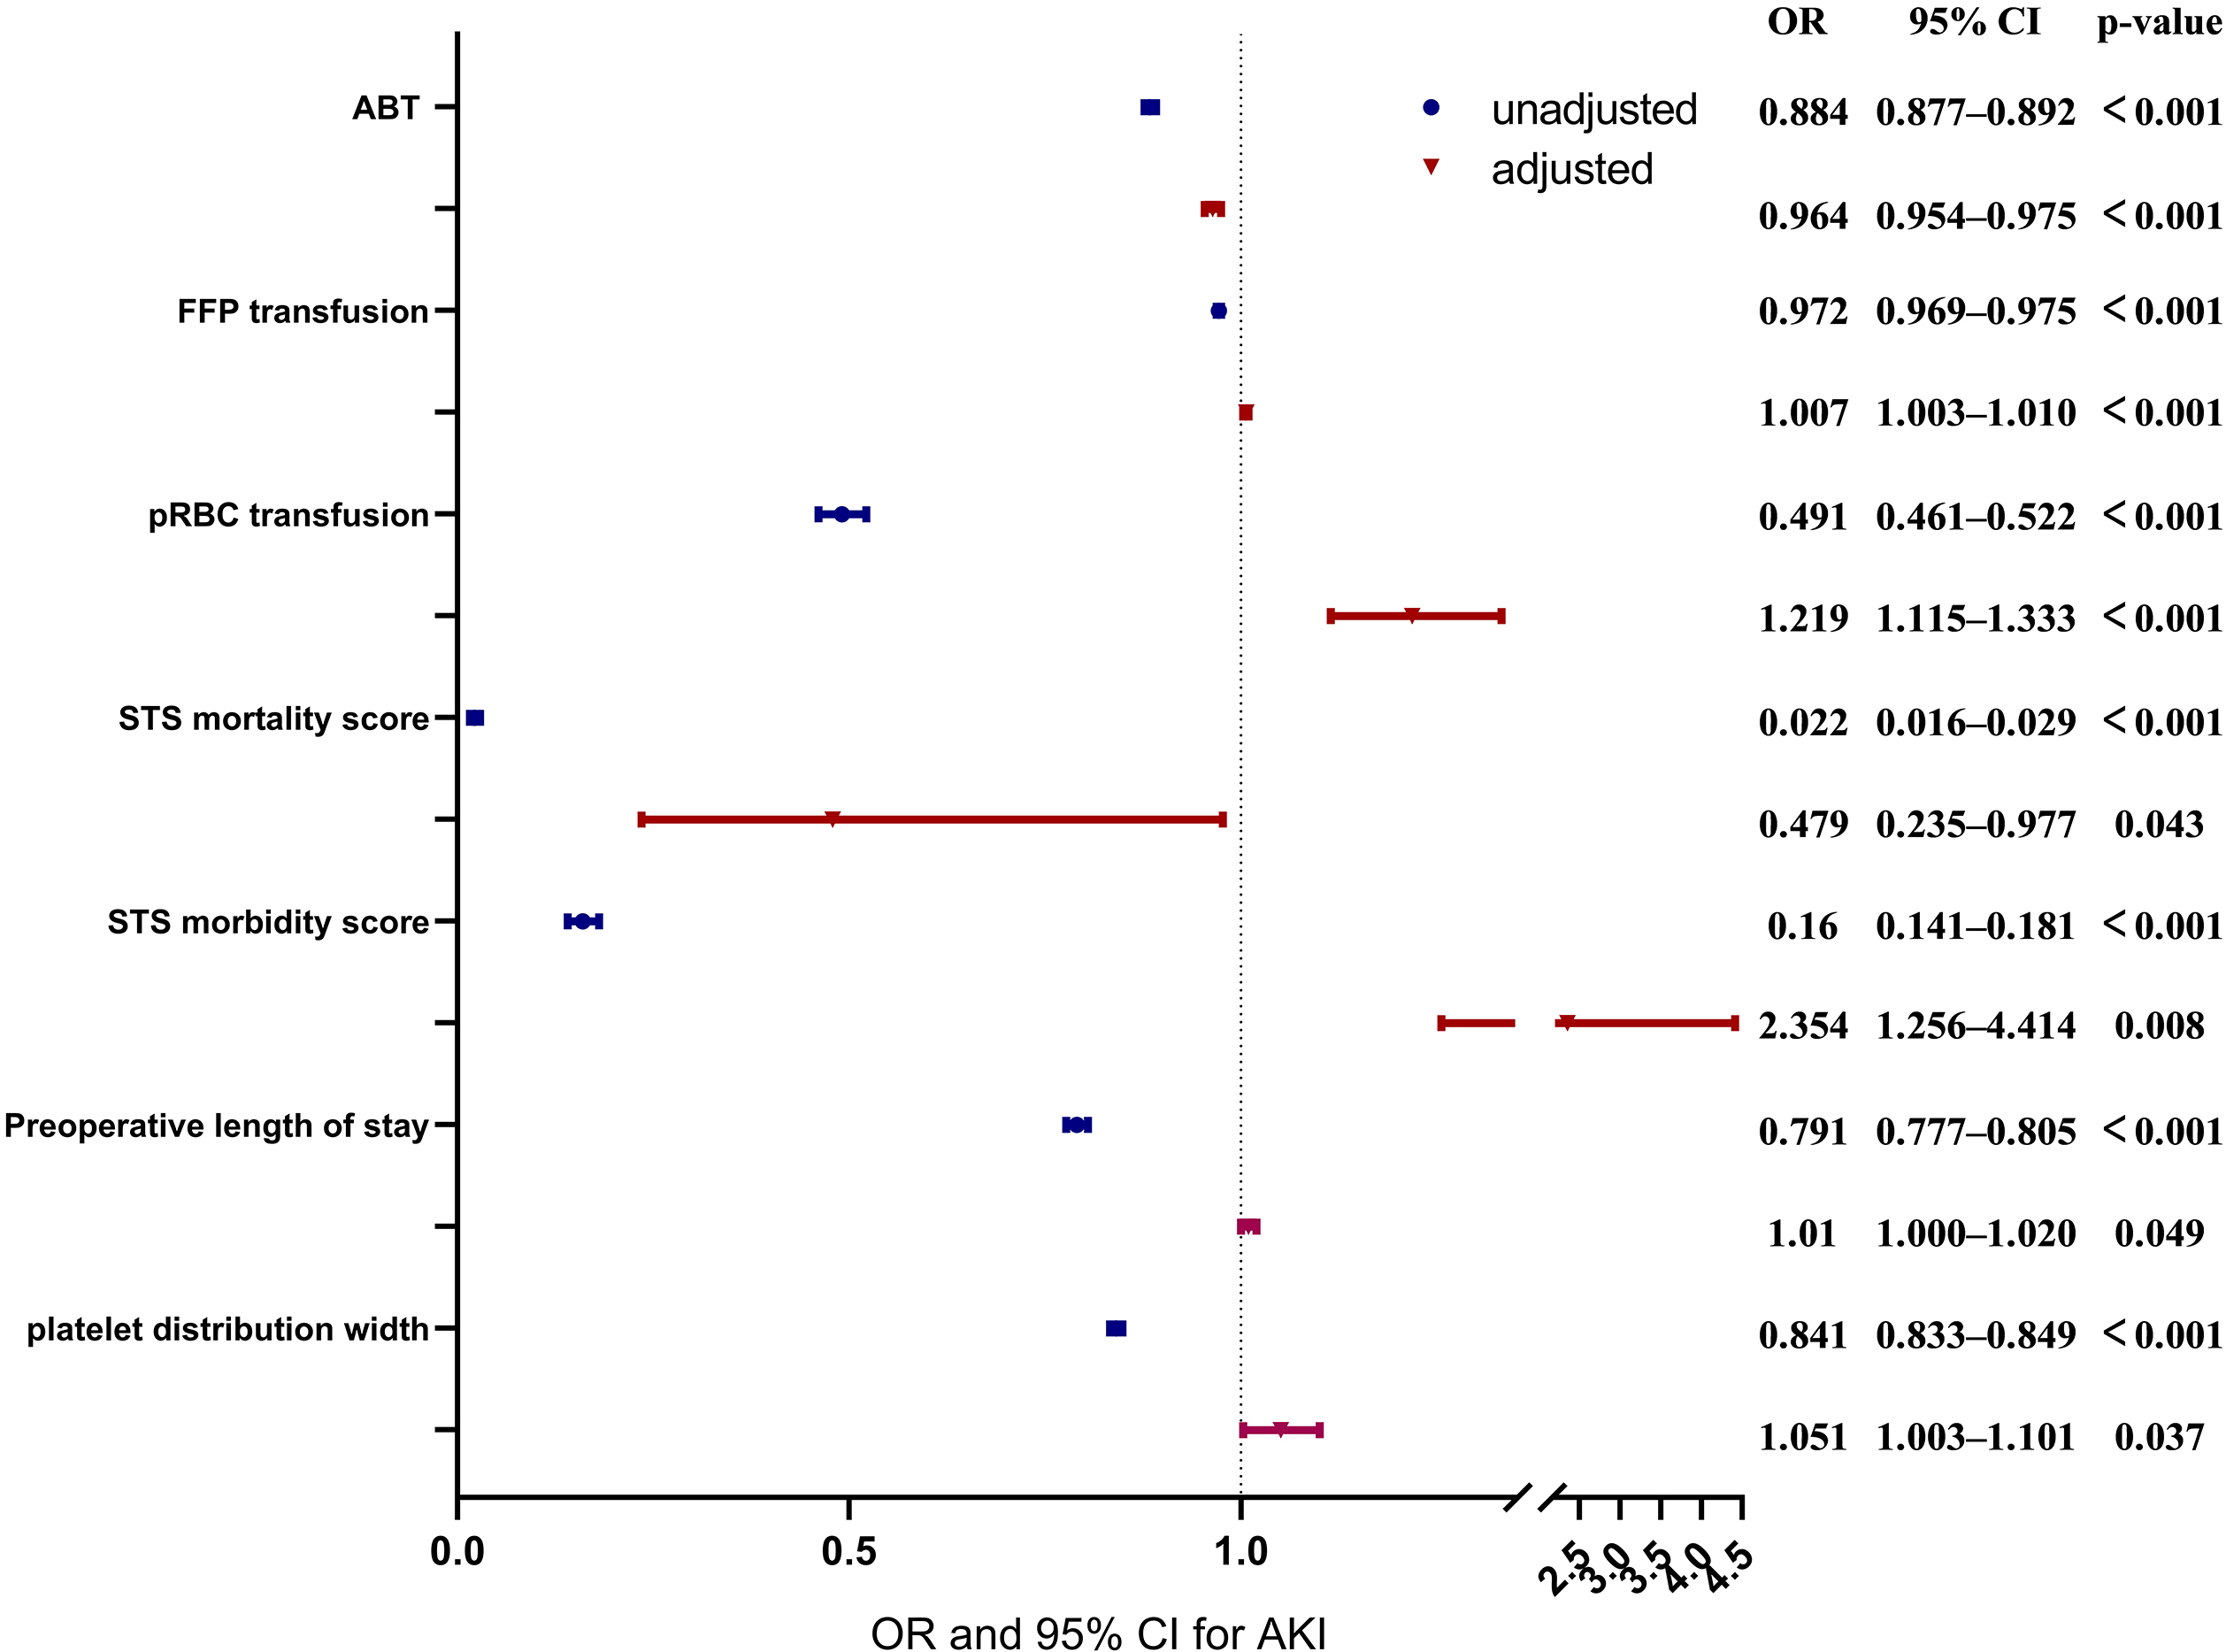 Fig. 4.
Forest plots for the association between confounders and autologous blood transfusion (ABT), and aute kidney injury (AKI). This chart includes unadjusted and adjusted odds ratio (OR), 95% confidence intervals (CI) and p values of ABT, fresh frozen plasma (FFP) transfusion, packed red blood cell (pRBC) transfusion, Society of Thoracic Surgeons (STS) mortality score, STS morbidity score, preoperative length of stay and platelet distribution width.
| Features | OR | 95% CI | p-value | Adjusted OR | 95% CI | p-value | |
| Laboratory results | |||||||
| platelet distribution width (%) | 0.841 | [0.833, 0.849] | 1.051 | [1.003, 1.101] | 0.037 | ||
| Intraop/postop variables | |||||||
| pRBC transfusion during surgery (unit) | 0.491 | [0.461, 0.522] | 1.219 | [1.115, 1.333] | |||
| FFP transfusion during surgery (mL/kg) | 0.972 | [0.969, 0.975] | 1.007 | [1.003, 1.010] | |||
| ABT during surgery (mL/kg) | 0.884 | [0.877, 0.892] | 0.964 | [0.954, 0.975] | |||
| STS mortality score | 0.022 | [0.016, 0.029] | 0.479 | [0.235, 0.977] | 0.043 | ||
| STS morbidity score | 0.160 | [0.141, 0.181] | 2.354 | [1.256, 4.414] | 0.008 | ||
| Preoperative length of stay (days) | 0.791 | [0.777, 0.805] | 1.010 | [1.000, 1.020] | 0.049 | ||
AKI, acute kidney injury; OR, odds ratio; pRBC, packed red blood cell; FFP, fresh frozen plasma; ABT, autologous blood transfusion; STS, Society of Thoracic Surgeons.
Table 4 shows the ATE estimated by the assumptions causal graph model in DoWhy. Since the data type of ABT volume was not applicable to the three estimation methods of propensity-based stratification, propensity scoring matching and inverse propensity weighting, only the linear regression method was used to evaluate the effect of intervention. In addition, due to the low proportion of patients with postoperative AKI in our data (9.8%), which did not qualify for the refutation method using placebo intervention, there were only two refutation results in the evaluation of whether autologous blood was transfused. In summary, the ATE was stable and passed different refutational scenarios. The ATE regarding the amount of autologous blood transfused was –0.0088, suggesting that every 1 mL/kg of ABT reduced the risk of AKI by 0.88%. Any ABT will reduce AKI by about 15.8%–18.8% by different estimation methods.
| Estimation methods and refute method | ABT volume (mL/kg) | Any ABT (true/false) | |
| Propensity-based stratification | ATE | / | –0.188 |
| Refute1 (p-value) | / | –0.180 (0.20) | |
| Refute2 (p-value) | / | / | |
| Refute3 (p-value) | / | –0.177 (0.21) | |
| Propensity score matching | ATE | / | –0.160 |
| Refute1 (p-value) | / | –0.151 (0.28) | |
| Refute2 (p-value) | / | / | |
| Refute3 (p-value) | / | –0.153 (0.33) | |
| Inverse propensity weighting | ATE | / | –0.153 |
| Refute1 (p-value) | / | –0.152 (0.29) | |
| Refute2 (p-value) | / | / | |
| Refute3 (p-value) | / | –0.152 (0.49) | |
| Linear regression | ATE | –0.0088 | –0.158 |
| Refute1 (p-value) | –0.0088 (0.49) | –0.158 (0.39) | |
| Refute2 (p-value) | 0.000 (0.00) | 0.000 (0.00) | |
| Refute3 (p-value) | –0.0087 (0.45) | –0.156 (0.47) | |
ABT, autologous blood transfusion.
In the past, most research has been conducted using randomized controlled trial (RCT) experiments to compare differences between experimental and control groups to make causal inferences [23, 24]. Although there is less bias in the data and more control over data selection in RCT experiments than in retrospective studies, RCT experiments are usually expensive, time-consuming, and in many cases infeasible. Based on the relevance of the present study to the content of previous studies, we chose to conduct the experiment directly using existing retrospective data, taking into account the time period, expenditure costs and sample size of the data. For the present study, we used the results of DoWhy (https://github.com/py-why/dowhy) [22], a relatively new causal analysis framework in the field. This causal analysis framework can be used not only to assess possible causal effects, but also to provide a variety of refutation tools to verify the reliability of such causal effects. If it happens that the causal effect one is assessing is a confounding association, rather than a causal relationship due to a very large number of factors, problems can usually be identified through this refutation process. In the present study, we used three different refutation methods to verify the reliability of the results.
Similar to previous reports [25], our investigation demonstrated that ABT was associated with a reduction in intraoperative allogeneic blood transfusion. In practice, we have a policy that the hematocrit be kept above 25% through different transfusion and ABT will reduce the need for other blood transfusions. The ABT group had a longer operative time, shorter mechanical ventilation time, and lower amount of FFP transfused than did the non-ABT group. However, unlike in other studies, the difference in the amount of intraoperative pRBC transfusion between the ABT group and the non-ABT group was not observed in our results. When single-factor analysis was performed, the amount of ABT, pRBC transfusion, and FFP transfusion during surgery were all associated with the reduction of AKI, but when multifactor analysis with other confounder characteristics was added, only the amount of ABT was associated with the reduction of AKI. Theoretically, ABT reduces the exposure of clotting factors and platelets outside the circulatory system to the harmful effects of CPB. Platelet count and function are preserved regardless of the method of collection or the length of storage [26]. Centrifugation equipment and autologous transfusion systems are available to collect whole blood and separate it into red blood cell concentrates and autologous platelet-rich plasmapheresis (aPRP) fractions [27]. The collected erythrocytes are reperfused according to the hemoglobin concentration, whereas the aPRP fraction is reperfused after detachment from CPB and reversal of anticoagulation. In a previous study, Zhou et al. [28] hypothesized that the use of autologous blood could reduce postoperative lung injury and shorten the duration of mechanical ventilation, which is possibly related to the reduction of allogeneic blood transfusion.
In making causal inferences with the help of DoWhy, we used different evaluators in the ATE assessment phase and performed rebuttal tests for this. Refute 1 and 3 yielded new ATEs very close to the original values and Refute 2 yielded new ATEs close to 0. All the refutation results verified that our hypothesis, that ABT was one of the causes that reduce AKI, was correct. This has significant implications for reducing the occurrence of AKI by intervening in the amount of intraoperative ABT. In the multifactorial analysis we found an OR of 0.964 after correction of ABT, meaning that every 1 mL/kg of ABT reduced the risk of AKI by 3.6%. After causal extrapolation, the ATE suggested that every 1 mL/kg of ABT reduced the risk of AKI by 0.88%. This difference between the two also reinforces the difference between correlation and causation; correlation alone does not determine clinical decision making but requires further determination of causality between the two.
The present study provides solid evidence to encourage use of ABT during pediatric cardiac surgery. In addition, the shortage of blood supply is becoming a major issue worldwide due to the 2019 coronavirus disease (COVID-19) pandemic. The World Health Organization has also announced guidelines for protecting the blood supply during a COVID-19 pandemic. A large amount of donor blood is consumed during cardiac surgery; ABT not only significantly reduces allogeneic blood requirement in cardiac surgery, but also reduces the risk of AKI after surgery. However, since this study only used data from a single center, the validity of this conclusion in other centers still needs to be verified subsequently.
There are several limitations to our study. First, due to the database, the components of blood transfusion were not categorized, such as dividing the input autologous blood into hemoglobin and platelets, so the mechanism of the effect of intraoperative ABT on AKI could not be elucidated in detail. Second, due to the limitations of the model input, averaging was performed for time-series data and did not make good use of dynamic data. Third, there was about a 10:1 distribution of non-AKI to AKI cases in our data sample, so we were unable to obtain all the results of the refutation method when using the DoWhy model for causal inference. Last, the failure to describe the relationships between other characteristics when formulating model hypotheses could have had some impact on the final results.
The present study demonstrated that ABT is causally related to the occurrence of AKI and that every 1 mL/kg of ABT reduced the risk of AKI by 0.88%. Despite the limitations, the results of this study suggest that ABT is an effective transfusion strategy, especially during blood shortages due to COVID-19.
ABT, autologous blood transfusion; AKI, aute kidney injury; ASD, atrial septal defect; ATE, average treatment effect; CoA, coarctation of the aorta; CPB, cardiopulmonary bypass; FFP, fresh frozen plasma; IQR, interquartile range; OR, odds ratio; PDA, patent ductus arteriosus; PFO, patent foramen ovale; pRBC, packed red blood cells; RACHS-1, risk adjustment for congenital heart surgery; SD, standard deviation; STS, society of thoracic surgeons; TAPVC, total anomalous pulmonary venous connection; TOF, tetralogy of fallot; VSD, ventricular septal defect.
Data can be obtained from the corresponding author on reasonable request.
YS and HL designed the research study. YS, XZ, YFe,YFa, XL, and HD performed the research.YS, SS, ZS, TH, YFa, XF, QS and HL analyzed the data. YS and HL wrote the manuscript. All authors contributed to editorial changes in the manuscript. All authors read and approved the final manuscript. All authors have participated sufficiently in the work and agreed to be accountable for all aspects of the work.
This study was approved by the Institutional Review Board of the Children’s Hospital of Zhejiang University School of Medicine (2018-IRB-078), and the requirement for informed consent was waived.
Not applicable.
This research was funded by National Natural Science Foundation of China, grant number 81871456.
The authors declare no conflict of interest.
Publisher’s Note: IMR Press stays neutral with regard to jurisdictional claims in published maps and institutional affiliations.