


 , Carina Uehre 1, Baravan Al-Kassou 1, Marcel Weber 1, Atsushi Sugiura 1, Nihal Wilde 1, Victor Mauri 2, Verena Veulemans 3, Malte Kelm 3, Stephan Baldus 2, Georg Nickenig 1, Sebastian Zimmer 1
1 Heart Center, Department of Medicine II, University Hospital Bonn, 53127 Bonn, Germany
2 Heart Center, Department of Cardiology, University Hospital Cologne, 50937 Cologne, Germany
3 Heart Center, Department of Cardiology, University Hospital Düsseldorf, 40225 Düsseldorf, Germany
Abstract
Background: We aimed to evaluate echocardiographic parameters to
predict calcific aortic valve disease (CAVD) progression. CAVD ranges
from aortic valve sclerosis (ASc) with no functional impairment of the aortic
valve to severe aortic stenosis (AS). It remains uncertain, which patients with
ASc have a particularly high risk of developing AS. Methods: We included
a total of 153 patients with visual signs of ASc and peak flow velocity (Vmax)
below 2.5 m/s at baseline echocardiography. Progression of CAVD to AS was defined
as an increase in Vmax
Graphical Abstract
Keywords
- calcific aortic valve disease
- CAVD
- aortic valve stenosis
- aortic calcification
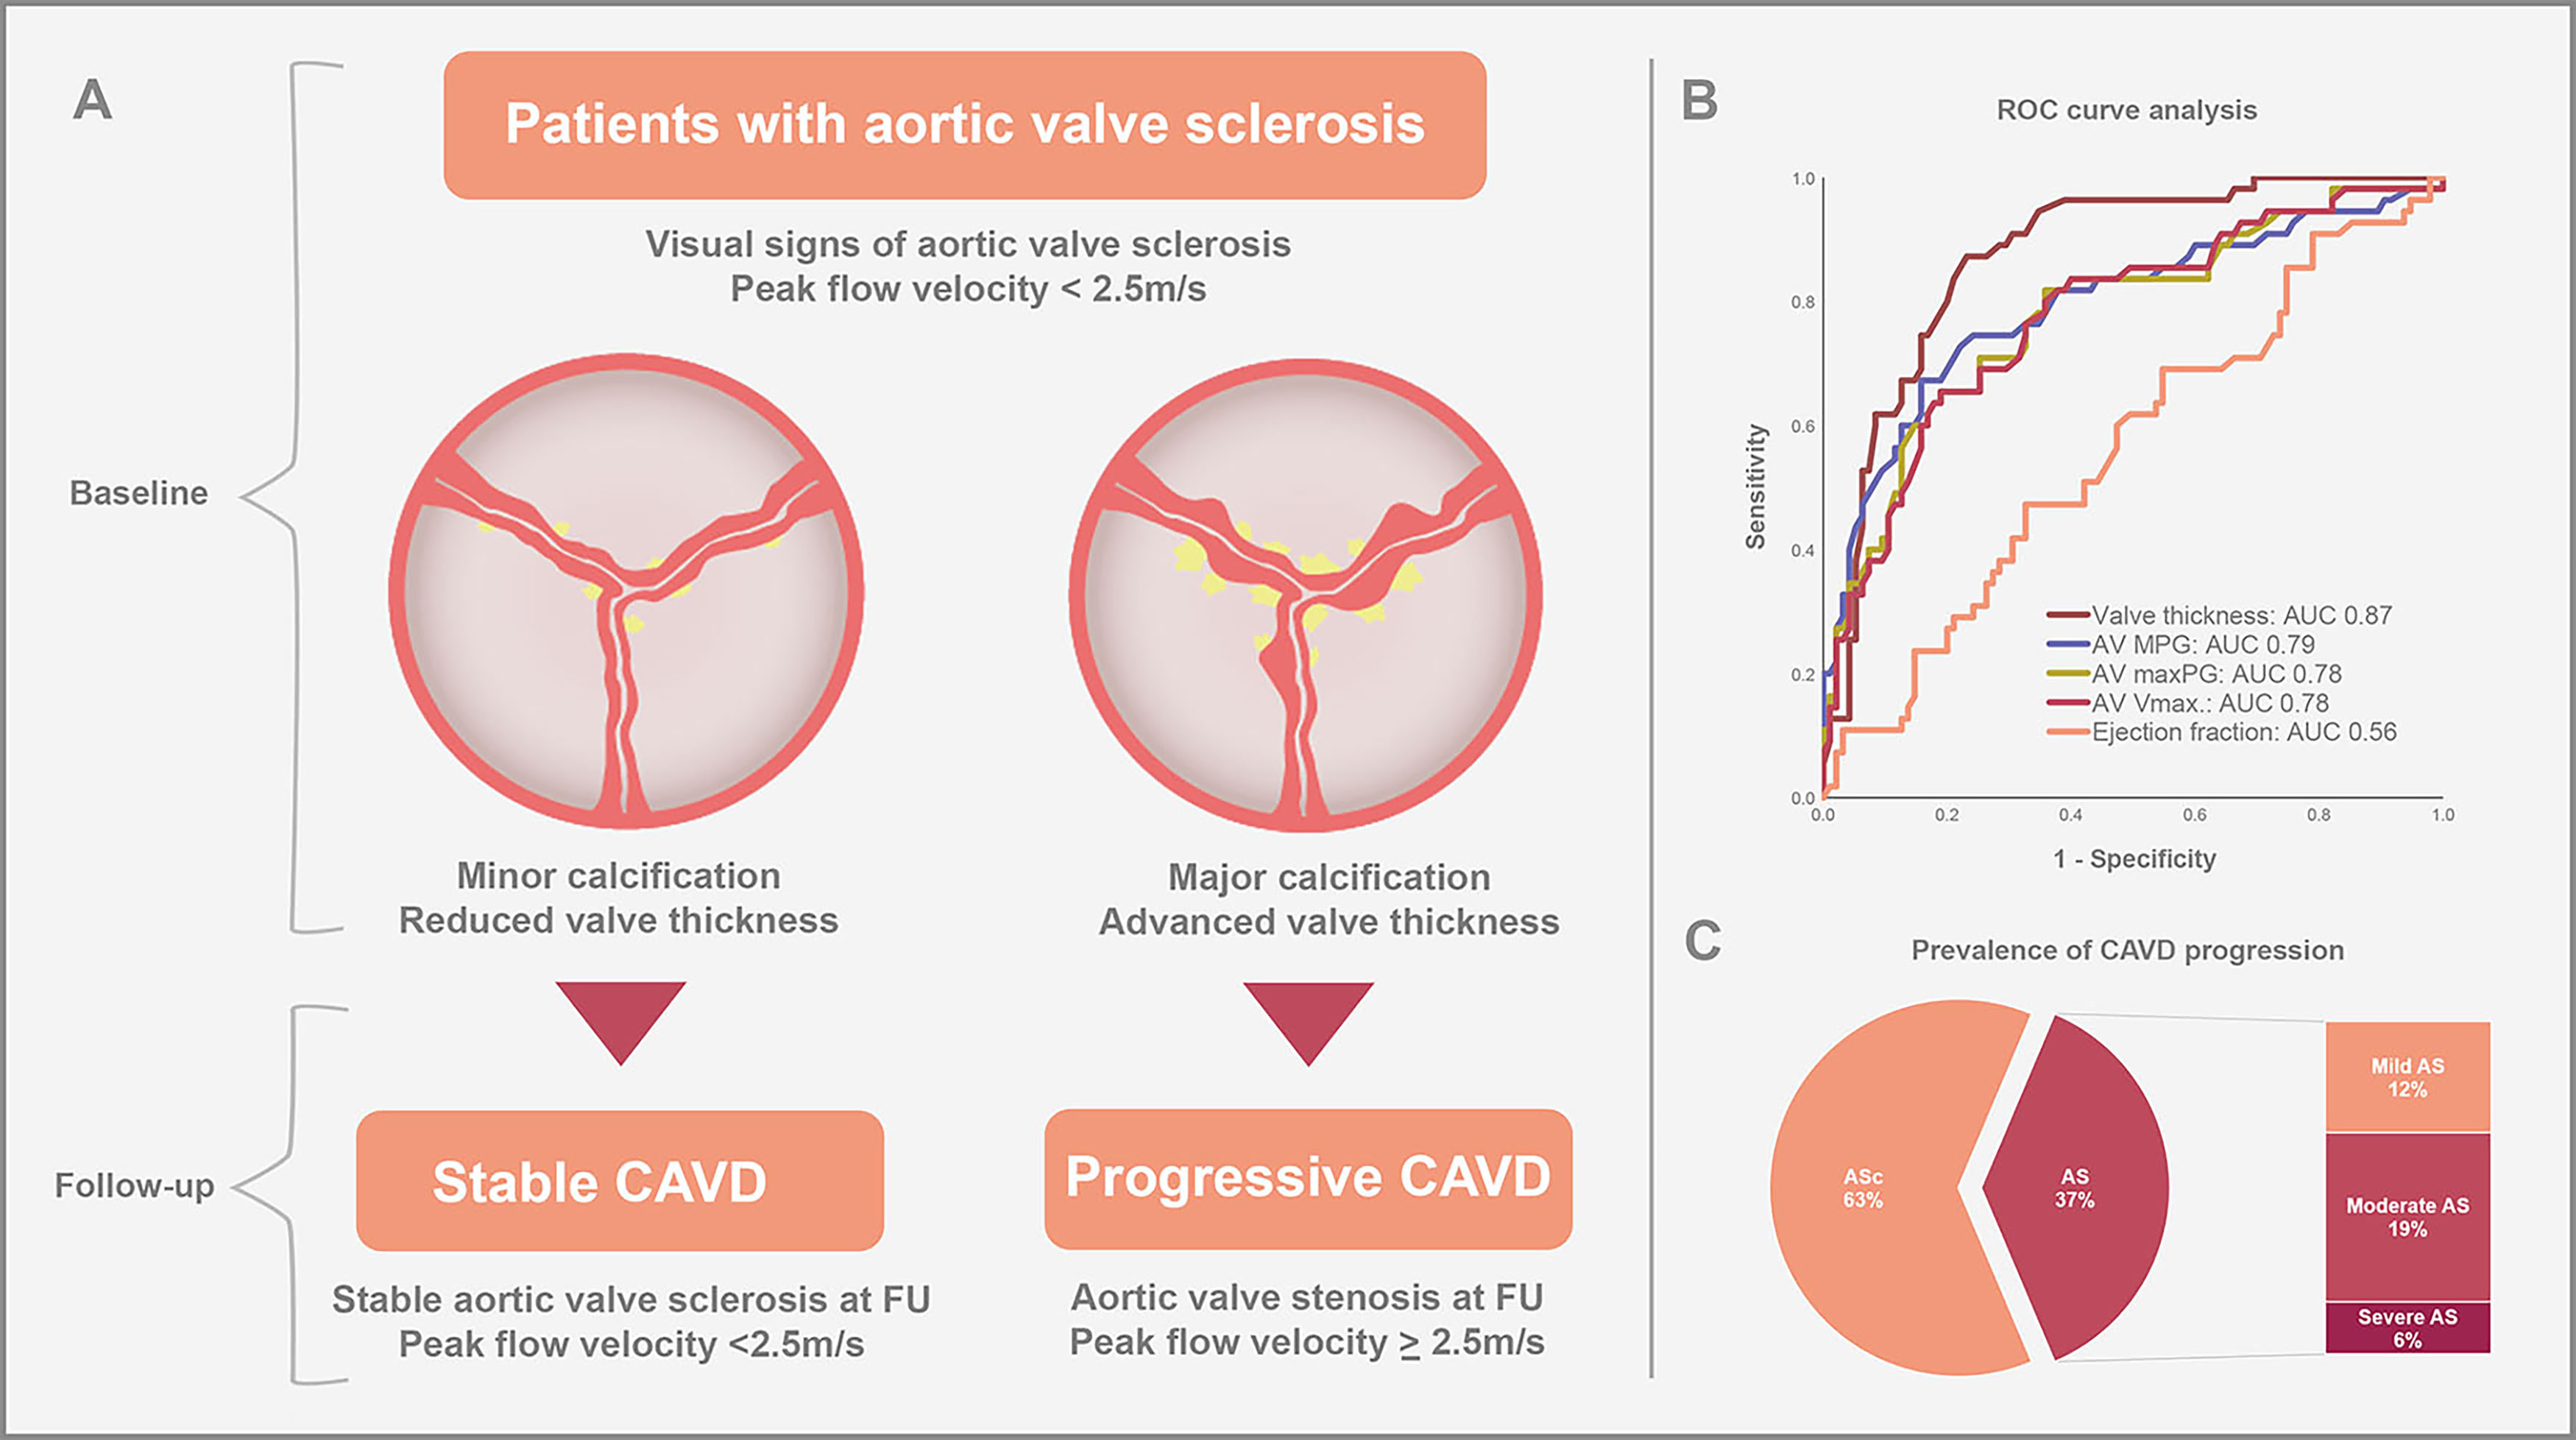
Calcific aortic valve disease (CAVD) is the most common valvular heart disease requiring interventional or surgical therapy in developed countries [1, 2]. CAVD ranges from aortic valve sclerosis (ASc) with no functional impairment of the aortic valve (AV) to severe aortic stenosis (AS) with hemodynamic impairment. Especially elderly patients are frequently affected and the prevalence of CAVD is increasing, due to global aging and more accurate diagnostic screening methods [3]. The initial stage of CAVD is characterized by visual signs of ASc without obstruction of the left ventricular outflow and is present in almost 30% of adults over 65 years of age [4]. Severe AS represents the end-stage of CAVD with hemodynamic compromise resulting in shortness of breath, loss of consciousness and/or chest pain due to obstruction of blood flow through the stenotic aortic valve. The prevalence of severe AS is about 3% in adults over 75 years of age [4, 5]. To date, there is no medical therapy available to prevent the progression of CAVD and it remains uncertain, which patients with ASc are at a particularly high risk of developing AS.
In this study, we evaluated the prevalence of CAVD progression in patients with pre-existent ASc and assessed echocardiographic parameters to predict disease progression and identify patients at a high risk of developing AS.
In this study, we compared clinical and echocardiographic parameters of patients with aortic valve sclerosis at baseline, who either developed aortic valve stenosis (mild, moderate or severe) during the follow-up echocardiography (AS group), or remained in the preceding stage with stable calcific aortic valve disease (ASc groups). The study design is shown in Fig. 1.
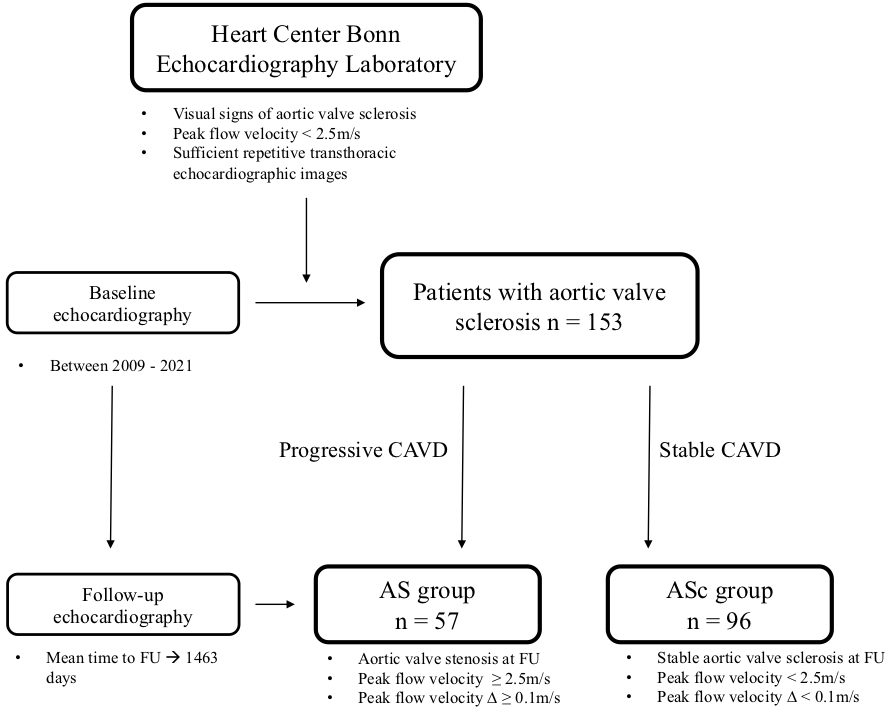 Fig. 1.
Study flow chart. AS, aortic stenosis; ASc, aortic valve sclerosis; CAVD, calcific aortic valve disease; FU, follow-up.
In detail, the database of the echocardiography laboratory of the Heart Center
Bonn, which is a consecutive patient data registry, was retrospectively analyzed
for patients with signs of aortic valve sclerosis without functional impairment
of the aortic valve, defined as peak flow velocity below 2.5 m/s in transthoracic
echocardiography. Prerequisite for the inclusion to the study was the
availability of repetitive echocardiographic images (at least two) to evaluate
the progression of CAVD over time. Exclusion criteria were missing or incomplete
echocardiographic images at baseline or follow-up. Patients with aortic valve
prostheses or bicuspid aortic valves were also excluded from the analysis. The
presence of aortic valve sclerosis was assessed by an experienced physician.
Progression of CAVD was defined as an increase of peak flow velocity
The primary endpoint was the progression of calcific aortic valve disease to any stage of AS. Clinical and echocardiographic parameters including CAVD stage were assessed at follow-up and used to assign patients into two groups according to disease progression: patients with stable calcific aortic valve disease (ASc group) and patients with any stage of aortic valve stenosis (AS group) in the follow-up echocardiography. For the statistical analysis, we compared baseline and echocardiographic parameters between these two groups and evaluated their predictive value for the development of aortic valve stenosis.
Transthoracic echocardiography is still the method of choice for the diagnosis and evaluation of aortic valve stenosis [6]. The following echocardiographic parameters were assessed and evaluated in this study: left ventricular outflow tract (LVOT) diameter, diameter of the aortic root and the ascending aorta, thickness of the left- (LCC), right- (RCC), and non-coronary cusp (NCC) (measured at the thickest point of the respective cusp), the aortic valve area (AVA) as calculated by continuity equation and measured by planimetry, the mean pressure gradient (MPG) of aortic valve, the maximum pressure gradient (maxPG) of aortic valve, the aortic valve peak flow velocity (AV Vmax), the time to peak velocity, the stroke volume, the systolic duration, the degree of aortic valve regurgitation, visual signs of calcification (divided into minor and major calcification as a binary parameter) and reduced mobility of the left-, right-, and non-coronary cusp (binary variable with the categories “yes” and “no”, respectively), the degree of mitral valve regurgitation, left ventricular hypertrophy, the diastolic and systolic interventricular septal thickness, the degree of diastolic dysfunction, the E/e’ ratio, the left ventricular ejection fraction (LVEF), the left ventricular end-diastolic and end-systolic volume, and the left atrial end-diastolic and end-systolic volume. All echocardiographic parameters were assessed in accordance with the recommendations from the American Society of Echocardiography [7].
Data are presented as mean
Statistical significance was assumed when the null hypothesis could be rejected
at p
We identified 153 patients eligible to be included in the study. Clinical and echocardiographic parameters are shown in Table 1.
| All patients | ||
| (n = 153) | ||
| Clinical parameters | ||
| Age, |
73.5 | |
| BMI, |
27.0 | |
| Male sex, n (%) | 102 (66.7) | |
| PAD, n (%) | 19 (12.4) | |
| CKD, n (%) | 37 (24.2) | |
| Dialysis, n (%) | 8 (5.2) | |
| Hypertension, n (%) | 132 (86.3) | |
| Diabetes, n (%) | 34 (22.2) | |
| Dyslipidemia, n (%) | 87 (56.9) | |
| Smoker, n (%) | 47 (30.9) | |
| Atrial fibrillation, n (%) | 76 (49.7) | |
| History of CAD, n (%) | 90 (58.8) | |
| Previous stroke, n (%) | 15 (9.8) | |
| MAPT, n (%) | 51(33.6) | |
| DAPT, n (%) | 25 (16.3) | |
| OAC/DOAC, n (%) | 79 (51.6) | |
| Echocardiographic parameters at baseline | ||
| AVA by continuity equation, cm |
1.9 | |
| MPG, mmHg | 6.7 | |
| maxPG, mmHg | 13.0 | |
| Vmax, m/s | 1.7 | |
| Aortic regurgitation, n (%) | ||
| Grade 0 | 71 (46.4) | |
| Grade I | 65 (42.5) | |
| Grade II | 17 (11.1) | |
| Grade III | - | |
| Mitral regurgitation, n (%) | ||
| Grade 0 | 15 (9.8) | |
| Grade I | 91 (59.5) | |
| Grade II | 42 (27.5) | |
| Grade III | 5 (3.3) | |
| Ejection fraction, % | 53.7 | |
| Aortic stenosis, n (%) | ||
| None | 153 (100) | |
| Mild | - | |
| Moderate | - | |
| Severe | - | |
| Echocardiographic parameters at follow-up | ||
| Time to follow-up, days | 1463 | |
| Aortic stenosis at follow-up, n (%) | ||
| None | 96 (62.7) | |
| Mild | 19 (12.4) | |
| Moderate | 29 (19.0) | |
| Severe | 9 (5.9) | |
| AVA by continuity equation, cm |
1.6 | |
| MPG, mmHg | 12.1 | |
| maxPG, mmHg | 23.6 | |
| Vmax, m/s | 2.3 | |
| Aortic regurgitation, n (%) | ||
| Grade 0 | 67 (43.8) | |
| Grade I | 73 (47.7) | |
| Grade II | 13 (8.5) | |
| Grade III | - | |
| Mitral regurgitation, n (%) | ||
| Grade 0 | 8 (5.2) | |
| Grade I | 93 (60.8) | |
| Grade II | 49 (32.0) | |
| Grade III | 3 (2.0) | |
| Ejection fraction, % | 54.5 | |
Values are displayed as mean (
AVA, aortic valve area; BMI, body mass index; CAD, coronary artery disease; CKD, chronic kidney disease; DAPT, dual antiplatelet therapy; DOAC, direct oral anticoagulant; maxPG, maximum pressure gradient; MAPT, mono antiplatelet therapy; MPG, mean pressure gradient; OAC, oral anticoagulant; PAD, peripheral artery disease; Vmax, peak flow velocity; IQR, interquartile range.
The mean age of the overall study cohort was 73.5
The mean time to follow-up was 1463
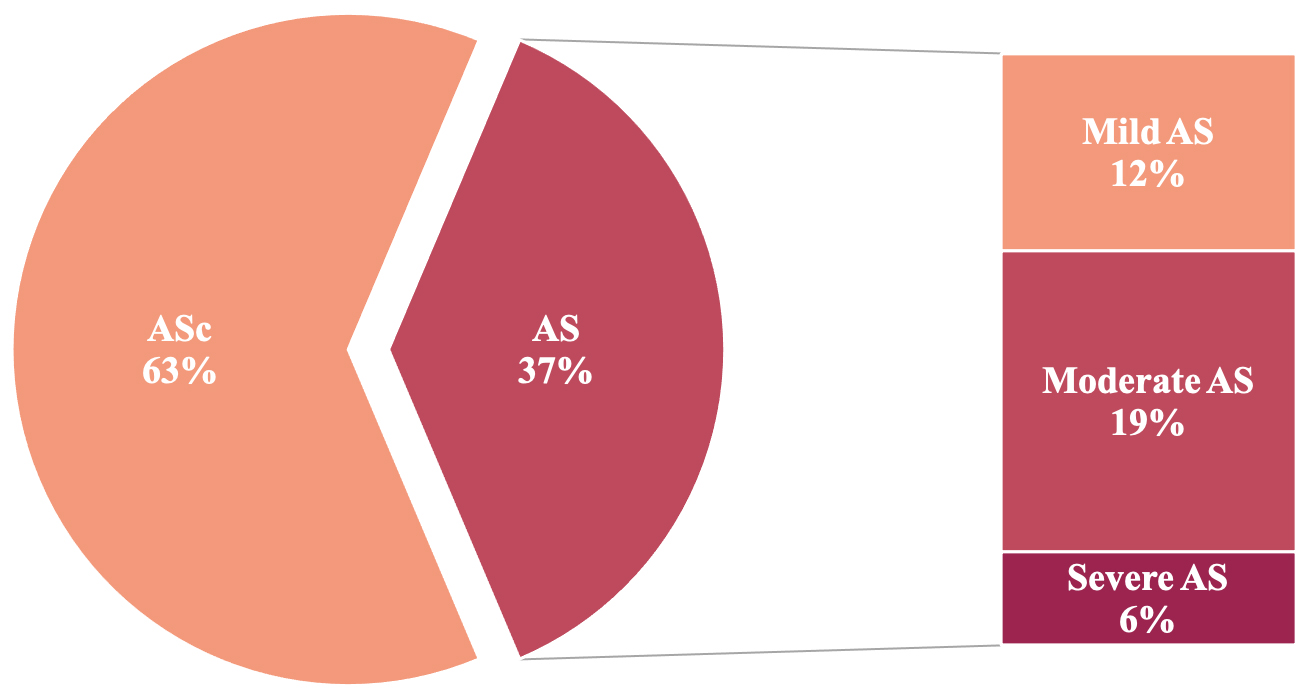 Fig. 2.
Prevalence of CAVD progression in patients with preexistent aortic valve sclerosis. According to the follow-up echocardiography 96 (63%) patients showed stable ASc, whereas 57 (37%) of the study patients experienced progression of CAVD; 12.4% of the patients developed mild AS, 19.0% showed moderate AS, and 5.9% suffered from severe AS. AS, aortic stenosis; ASc, aortic valve sclerosis; CAVD, calcific aortic valve disease.
Clinical parameters of the two CAVD groups (AS vs. ASc) are presented in Table 2. The AS group was younger (70.1
| AS group | ASc group | p-value | ||
| (n = 57) | (n = 96) | |||
| Clinical parameters | ||||
| Age, |
70.1 |
75.0 |
0.001 | |
| BMI, |
26.9 |
27.0 |
0.41 | |
| Male sex, n (%) | 41 (71.9) | 61 (63.5) | 0.29 | |
| PAD, n (%) | 8 (14.0) | 11 (11.5) | 0.64 | |
| CKD, n (%) | 20 (35.1) | 17 (17.7) | 0.015 | |
| Dialysis, n (%) | 6 (10.5) | 2 (2.1) | 0.023 | |
| Hypertension, n (%) | 49 (86.0) | 83 (86.5) | 0.93 | |
| Diabetes, n (%) | 15 (26.3) | 19 (19.8) | 0.34 | |
| Dyslipidemia, n (%) | 27 (47.4) | 60 (39.2) | 0.06 | |
| Smoker, n (%) | 22 (38.6) | 25 (26.3) | 0.11 | |
| Atrial fibrillation, n (%) | 26 (45.6) | 50 (52.1) | 0.44 | |
| History of CAD, n (%) | 31 (54.4) | 59 (61.5) | 0.39 | |
| Previous stroke, n (%) | 8 (14.0) | 7 (4.6) | 0.17 | |
| MAPT, n (%) | 17 (30.4) | 34 (35.4) | 0.52 | |
| DAPT, n (%) | 13 (22.8) | 12 (12.5) | 0.09 | |
| OAC/DOAC, n (%) | 26 (45.6) | 53 (55.2) | 0.25 | |
| Echocardiographic parameters at baseline | ||||
| LVOT diameter, cm | 2.2 |
2.1 |
0.037 | |
| Aortic root diameter, cm | 3.0 |
3.0 |
0.32 | |
| Ascending aorta diameter, cm | 2.6 |
2.8 |
||
| Cusp thickness NCC, cm | 0.31 |
0.24 |
||
| Cusp thickness LCC, cm | 0.29 |
0.23 |
||
| Cusp thickness RCC, cm | 0.33 |
0.24 |
||
| AVA plan., cm |
1.7 |
2.2 |
||
| AVA by continuity equation., cm |
1.7 |
2.2 |
0.017 | |
| MPG, mmHg | 8.7 |
5.5 |
||
| maxPG, mmHg | 16.6 |
10.9 |
||
| Vmax, m/s | 1.9 |
1.6 |
||
| Time to peak velocity, ms | 94.2 |
88.8 |
0.10 | |
| Stroke volume, mL | 55.6 |
57.2 |
0.39 | |
| Systolic duration, sec | 0.3 |
0.29 |
0.12 | |
| Aortic regurgitation, n (%) | ||||
| - Grade 0 | 25 (43.9) | 46 (47.9) | ||
| - Grade I | 21 (36.8) | 44 (45.8) | ||
| - Grade II | 11 (19.3) | 6 (6.3) | ||
| - Grade III | - | - | ||
| Calcification NCC, n (%) | 25 (43.9) | 20 (20.8) | 0.003 | |
| Calcification LCC, n (%) | 28 (49.1) | 11 (11.5) | ||
| Calcification RCC, n (%) | 44 (78.6) | 27 (28.4) | ||
| Calcification anulus, n (%) | 48 (84.2) | 94 (97.9) | 0.002 | |
| Calcification leaflet tips, n (%) | 48 (84.2) | 85 (88.5) | 0.44 | |
| Reduced mobility NCC, n (%) | 14 (24.6) | 4 (4.2) | ||
| Reduced mobility LCC, n (%) | 10 (17.5) | 2 (2.1) | ||
| Reduced mobility RCC, n (%) | 16 (28.6) | 8 (8.3) | ||
| Mitral regurgitation, n (%) | 0.60 | |||
| - Grade 0 | 7 (12.3) | 8 (8.3) | ||
| - Grade I | 30 (52.6) | 61 (63.5) | ||
| - Grade II | 18 (31.6) | 24 (25.0) | ||
| - Grade III | 2 (3.5) | 3 (3.1) | ||
| Heart rate, bpm | 73 (64/87.2) | 68 (60/81.7) | 0.17 | |
| LV hypertrophy, n (%) | 31 (54.4) | 54 (56.3) | 0.682 | |
| IVSd, cm | 1.3 |
1.3 |
0.37 | |
| IVSs, cm | 1.6 |
1.6 |
0.45 | |
| E/e’, |
16.3 (10.8/23.3) | 12.2 (10.2/19.0) | 0.08 | |
| Ejection fraction, % | 52.3 (12.2) | 54.5 (11.5) | 0.13 | |
| LVEDV, mL | 101.0 (86.8/126.9) | 101.4 (75.2/117.8) | 0.13 | |
| LVESV, mL | 47.9 (39.4/58.6) | 47.8 (28.9/58.6) | 0.044 | |
| LA volume end-diastolic, mL | 37.9 (22.1/70.1) | 35.6 (22.2/63.8) | 0.69 | |
| LA volume end-systolic, mL | 60.6 (41.2/89.5) | 55.5 (41.2/84.9) | 0.54 | |
| Diastolic dysfunction, n (%) | 0.46 | |||
| - Grade 0 | 20 (35.7) | 33 (34.4) | ||
| - Grade I | 24 (42.9) | 33 (34.4) | ||
| - Grade II | 5 (8.9) | 17 (17.7) | ||
| - Grade III | 7 (12.5) | 13 (13.5) | ||
| Echocardiographic parameters at follow-up | ||||
| Time to follow-up, days | 1547 |
1414 |
0.40 | |
| Aortic stenosis, n (%) | ||||
| - None | - | 96 (100) | ||
| - Mild | 19 (33.3) | - | ||
| - Moderate | 29 (50.9) | - | ||
| - Severe | 9 (5.9) | - | ||
| LVOT diameter, cm | 2.1 |
2.1 |
0.06 | |
| Aortic root diameter, cm | 3.0 |
3.0 |
0.47 | |
| Aortic ascendens diameter, cm | 2.6 |
2.9 |
0.001 | |
| Cusp thickness NCC, cm | 0.38 |
0.27 |
||
| Cusp thickness LCC, cm | 0.37 |
0.25 |
||
| Cusp thickness RCC, cm | 0.40 |
0.27 |
||
| AVA plan., cm |
0.9 |
2.0 |
||
| AVA by continuity equation., cm |
1.0 |
2.1 |
||
| MPG, mmHg | 22.4 |
5.9 |
||
| maxPG, mmHg | 42.9 |
13.2 |
||
| Vmax, m/s | 3.2 |
1.7 |
||
| Time to peak velocity, ms | 98.2 |
84.4 |
||
| Stroke volume, mL | 53.3 |
54.7 |
0.69 | |
| Systolic duration, sec | 0.3 |
0.3 |
0.16 | |
| Aortic regurgitation, n (%) | 0.14 | |||
| - Grade 0 | 42 (43.8) | 25 (43.9) | ||
| - Grade I | 49 (51.0) | 24 (42.1) | ||
| - Grade II | 8 (14.0) | 5 (5.2) | ||
| - Grade III | - | - | ||
| Calcification NCC, n (%) | 44 (77.2) | 35 (36.5) | ||
| Calcification LCC, n (%) | 49 (86.0) | 26 (27.1) | ||
| Calcification RCC, n (%) | 51 (91.1) | 46 (48.4) | ||
| Calcification anulus, n (%) | 56 (98.2) | 93 (96.9) | 0.61 | |
| Calcification leaflet tips, n (%) | 55 (96.5) | 88 (91.7) | 0.24 | |
| Reduced mobility NCC, n (%) | 42 (73.7) | 8 (8.3) | ||
| Reduced mobility LCC, n (%) | 35 (61.4) | 4 (4.2) | ||
| Reduced mobility RCC, n (%) | 47 (83.9) | 20 (20.8) | ||
| Mitral regurgitation, n (%) | 0.012 | |||
| - Grade 0 | 6 (10.5) | 2 (2.1) | ||
| - Grade I | 30 (52.6) | 63 (65.6) | ||
| - Grade II | 18 (31.6) | 31 (32.3) | ||
| - Grade III | 3 (5.3) | - | ||
| Heart rate, bpm | 70 (63.5/76) | 68 (58.2/81) | 0.19 | |
| LV hypertrophy, n (%) | 44 (77.2) | 57 (59.4) | 0.024 | |
| IVSd, cm | 1.4 (0.3) | 1.3 (0.3) | 0.009 | |
| IVSs, cm | 1.7 (0.3) | 1.6 (0.3) | 0.08 | |
| Ee’, |
16.5 (11.9/23.9) | 15.3 (11/23.6) | 0.20 | |
| Ejection fraction, % | 52.6 (13.5) | 55.6 (10.4) | 0.07 | |
| LVEDV, mL | 96.6 (76.6/130.2) | 96.7 (72.4/122.9) | 0.59 | |
| LVESV, mL | 44.9 (28.0/65.2) | 40.8 (29.5/56.1) | 0.53 | |
| LA volume (end-diastolic), mL | 55.4 (32.0/70.9) | 40.3 (25.4/64) | 0.06 | |
| LA volume (end-systolic), mL | 70.7 (45.5/97.5) | 62.2 (46.3/82.6) | 0.14 | |
| Diastolic dysfunction, n (%) | 0.12 | |||
| - Grade 0 | 19 (33.3) | 24 (25.0) | ||
| - Grade I | 25 (43.9) | 32 (33.3) | ||
| - Grade II | 4 (7.0) | 16 (16.7) | ||
| - Grade III | 9 (15.8) | 24 (25.0) | ||
Values are displayed as mean (
Statistical significance is highlighted in bold.
AS, aortic stenosis; ASc, aortic valve sclerosis; AVA, aortic valve area; AVA plan., aortic valve area plane; BMI, body mass index; CAD, coronary artery disease; CKD, chronic kidney disease; DAPT, dual antiplatelet therapy; DOAC, direct oral anticoagulant; E/e’, early mitral inflow velocity to mitral annular early diastolic velocity ratio; IVSd, diastolic interventricular septal thickness; IVSs, systolic interventricular septal thickness; LA, left atrial; LCC, left-coronary cusp; LV, left ventricular; LVEDV, left ventricular end-diastolic volume; LVESV, left ventricular end-systolic volume; LVOT, left ventricular outflow tract; MAPT, mono antiplatelet therapy; maxPG, maximum pressure gradient; MPG, mean pressure gradient; NCC, non-coronary cusp; OAC, oral anticoagulant; PAD, peripheral artery disease; RCC, right-coronary cusp; Vmax, peak flow velocity; CAVD, calcific aortic valve disease; IQR, interquartile range.
Baseline and follow-up echocardiographic parameters according to the CAVD groups
are shown in Table 2. Patients with CAVD progression (i.e., AS group) presented
with a mildly, but significantly elevated AV Vmax (AS group: 1.9
At follow-up echocardiography, 19 patients (33.3%) had mild AS, 29 patients
(50.9%) presented with moderate AS and 9 patients (5.9%) suffered from severe
AS (Fig. 2). The mean time to follow-up did not differ between the CAVD groups
(AS group: 1547
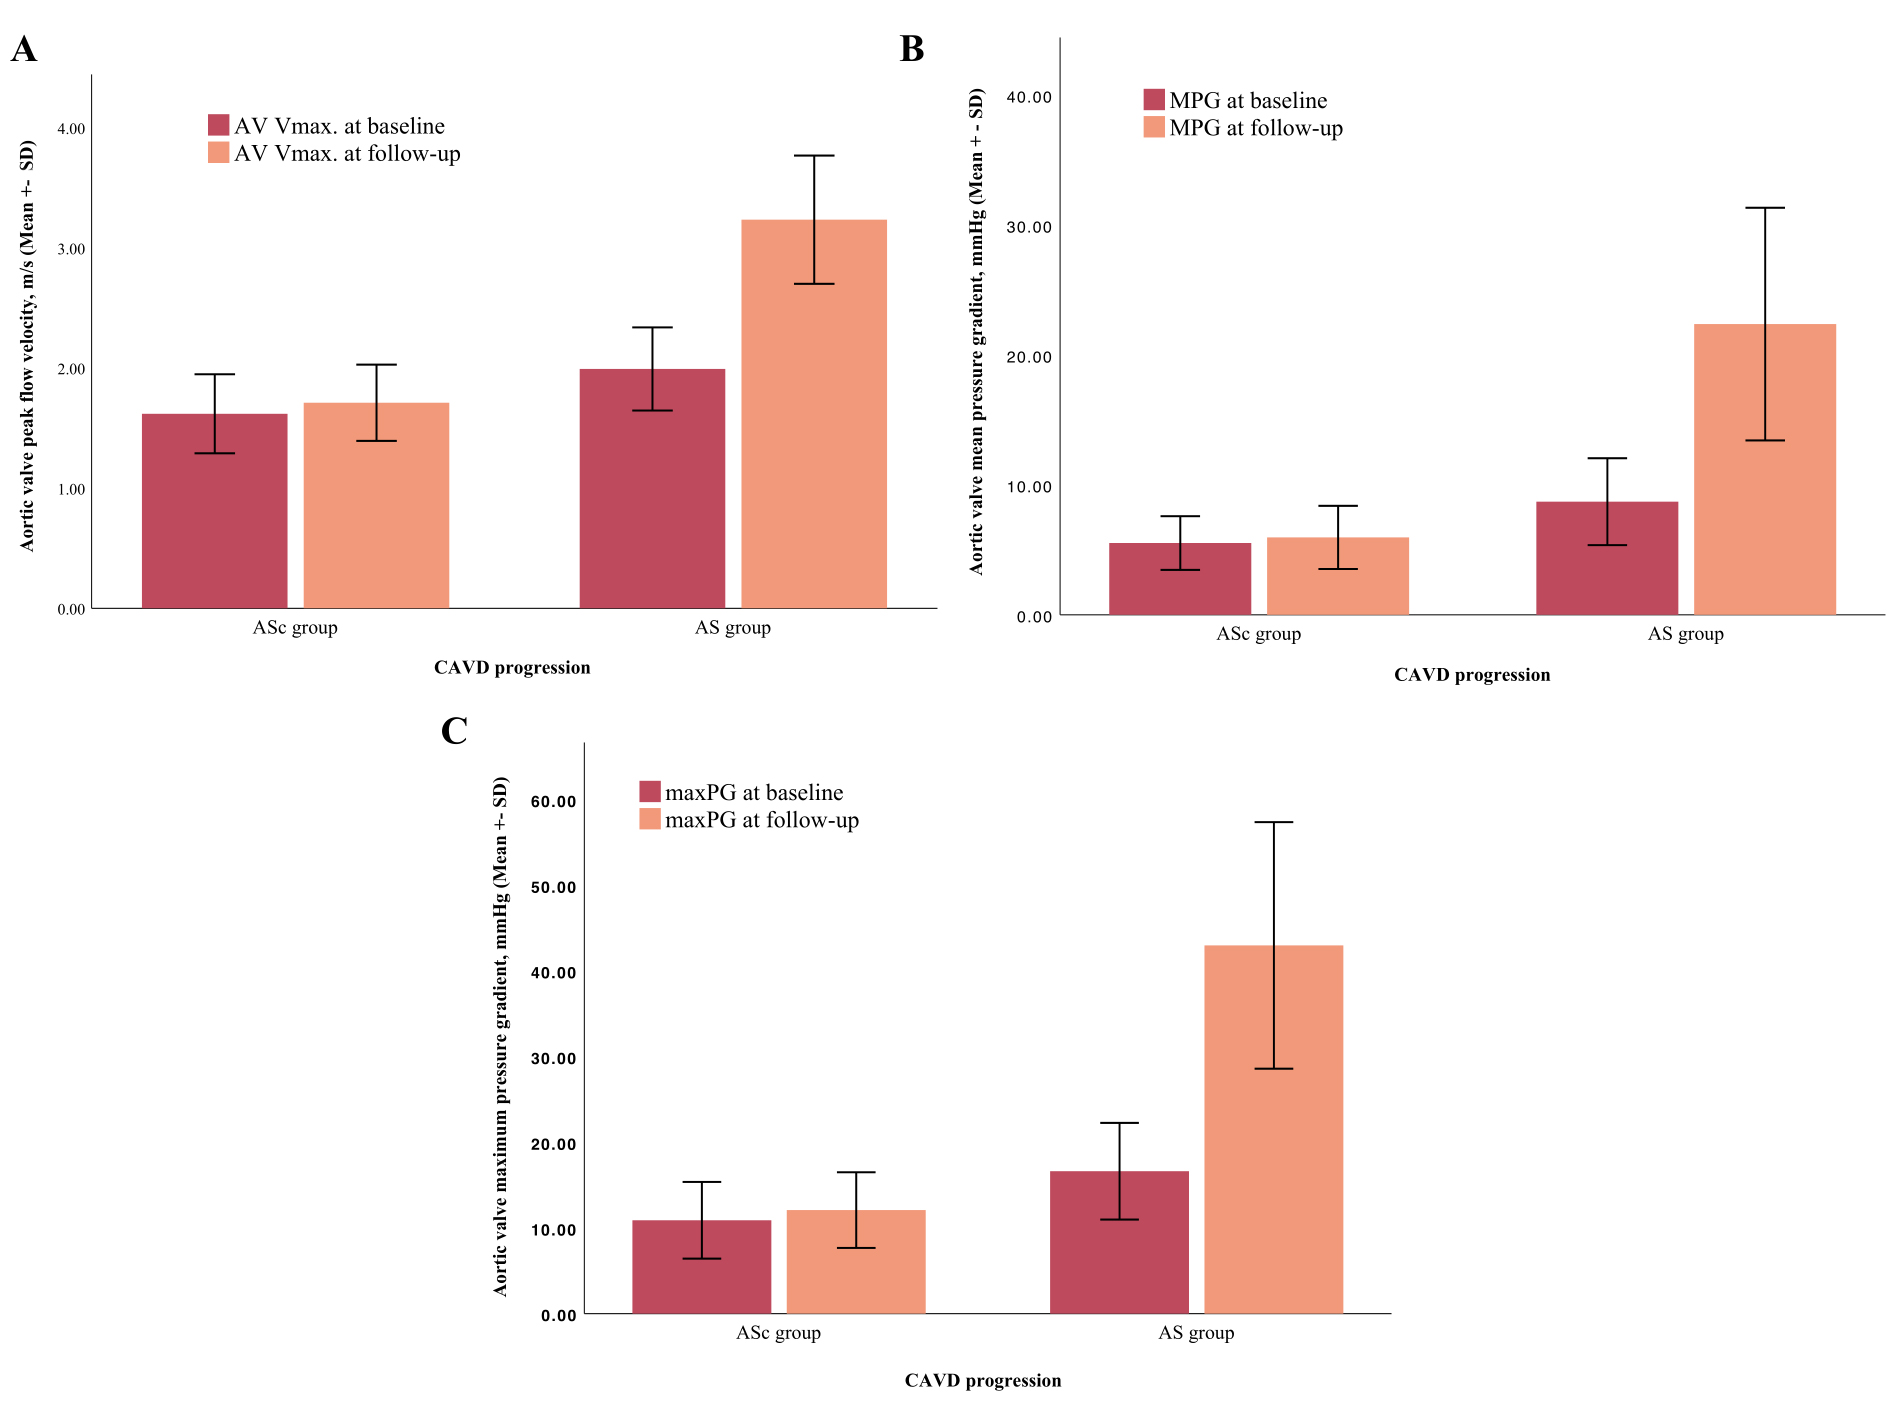 Fig. 3.
Comparison between echocardiographic parameters at baseline and follow-up in accordance with CAVD progression. The AV Vmax (A), MPG (B) and maxPG (C) increased significantly within the follow-up period of 4 years in the AS group. CAVD, calcific aortic valve disease; AS, aortic stenosis; ASc, aortic valve sclerosis; AV Vmax, aortic valve peak flow velocity; maxPG, maximum pressure gradient; MPG, mean pressure gradient; SD, standard deviation.
To identify independent predictors for disease progression, we performed a
multivariate regression analysis, which included univariate predictors with a
p-value
| Univariate analysis | p value | Multivariate analysis | p value | |
| HR (95% CI) | HR (95% CI) | |||
| Male sex | 2.8 (0.7–2.9) | 0.28 | - | - |
| Chronic kidney disease | 2.5 (1.8–5.3) | 0.017 | 3.3 (0.9–11.8) | 0.06 |
| Dialysis | 5.5 (1.0–28.3) | 0.04 | 5.5 (0.4–70.6) | 0.19 |
| Ejection fraction | 0.9 (0.9–1.1) | 0.25 | - | |
| Diabetes | 1.4 (0.6–3.1) | 0.35 | - | - |
| PAD | 1.2 (0.4–3.3) | 0.64 | - | - |
| Atrial fibrillation | 0.8 (0.4–1.4) | 0.43 | - | - |
| Arterial hypertension | 0.9 (0.4–2.5) | 0.93 | - | - |
| Nicotine abuse | 1.7 (0.8–3.5) | 0.11 | - | - |
| Dyslipidemia | 0.5 (0.3–1.0) | 0.07 | - | - |
| Moderate aortic regurgitation | 3.3 (1.1–10.2) | 0.03 | 1.6 (0.3–2.6) | 0.5 |
| Cusp thickness |
23.2 (9.2–58.5) | 16.6 (5.4–50.7) | ||
| Major valve calcification | 13.9 (5.1–38.0) | 4.8 (1.5–15.9) | 0.009 | |
| Reduced valve motion | 6.1 (2.8–13.5) | 2.0 (0.7–5.8) | 0.15 |
Statistical significance is highlighted in bold.
CI, confidence interval; HR, hazard ratio; PAD, peripheral artery disease.
In a receiver operating characteristics curve analysis, comparing the predictive
value of the different echocardiographic parameters for disease progression,
advanced valve thickness (area under the curve [AUC]: 0.87, 95% CI: 0.81–0.93,
p
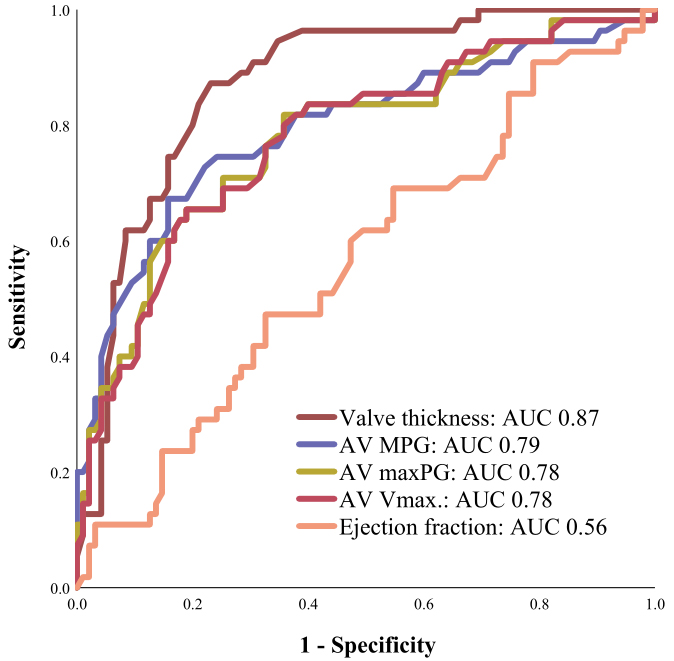 Fig. 4.
Receiver Operating Characteristics (ROC) curve analysis. Advanced valve thickness showed the strongest association with disease progression in ROC curve analysis. AUC, area under the curve; AV Vmax, aortic valve peak flow velocity; maxPG, maximum pressure gradient; AV, aortic valve; MPG, mean pressure gradient.
In this study including 153 patients with visual signs of ASc but without AS, we assessed echocardiographic parameters to evaluate the prevalence and the progression of CAVD to identify of patients at high risk of developing aortic valve stenosis. The main results of our study are as follows:
Out of 153 study patients, 1/3 experienced progression of CAVD,
Calcification and advanced thickness of the valve cusps
ASc, the preceding stage of CAVD, displays focal areas of valve calcification
and leaflet thickening without functional relevant obstruction of the left
ventricular outflow tract [8]. It is one of the most frequent findings in
transthoracic echocardiography with a growing incidence in the older population
[9]. ASc has been reported to be present in almost 30% of adults aged over 65
years [4, 10], whereas the prevalence of disease progression from ASc to AS
differs in the literature. One of the largest prospective studies included
Several studies have already evaluated the overlap of traditional cardiovascular risk factors (CRF) and the presence of aortic valve calcification [12, 13, 14, 15, 16]. In the past, comorbidities such as advanced age, male gender, arterial hypertension, dyslipidemia and smoking have been shown to be associated with the development of aortic valve calcification and atherosclerotic disease to a comparable degree [12, 17], supporting the hypothesis that both diseases have a shared pathomechanistic processes. These data are supported by our study results, as we observed a high prevalence of CRF and concomitant coronary artery disease at baseline in our study population. On the basis of a prospective analysis, including 70 patients with baseline aortic valve calcification, Messika-Zeitoun et al. [18] were able to show that the progression of established ASc was unrelated to cardiovascular risk factors, age and sex. Bellamy et al. [19] evaluated the association between CAVD progression and cholesterol levels at baseline in a cohort of 156 patients revealing no significant correlation between blood cholesterol concentrations and the progression of ASc. Corroborating results have been described by other major prospective studies including SEAS (Simvastatin and Ezetimibe in Aortic Stenosis), SALTIRE (Scottish Aortic Stenosis and Lipid Lowering Trial, Impact on Regression), ASTRONOMER (Effect of Cholesterol Lowering on the Progression of Aortic Stenosis in Patients With Mild to Moderate Aortic Stenosis). These trials could not find a relationship between LDL levels and progressive aortic valve disease on the one hand, and were not able to confirm the beneficial effect of statins on CAVD progression, on the other [20, 21, 22].
In our study, CKD and terminal dialysis-dependent renal insufficiency were the only clinical factors, that were significantly associated with disease progression. This result is not surprising, since CKD and especially long-term dialysis are often linked with the occurrence of cardiovascular events. Interestingly, patients with CAVD progression were significantly younger with a mean age of 70 years at baseline compared to patients with stable ASc, who were five years older on average. Higher rates of other traditional CRF were not significantly associated with disease progression. This result should nevertheless be considered cautiously, since our study is based on a retrospective analysis of a small sample population.
Our study results showed that the ASc group presented a more dilated ascending aorta compared to the AS group at baseline and follow-up. This result might be explained by the higher rates of CKD and dialysis in the ASc group, but also by the significantly older age of the ASc group, representing a known risk factor for the development of aortic dilatation and aneurysms.
Larger prospective studies are needed to identify clinical risk factors associated with disease progression, to pave the way for the development of targeted therapies.
The reliable and early identification of patients with ASc, who are at high risk of developing AS, should be another important goal in AV research. In this context, imaging techniques play an important role. Transthoracic echocardiography (TTE) is the gold standard for the evaluation of CAVD and the quantification of AS severity. Beside the visual assessment of the leaflet anatomy and the extent of valve calcification, the evaluation of functional parameters are pivotal during diagnostic work-up [23, 24].
In our study, we evaluated echocardiographic parameters with regard to their
forecast value to predict the development of AS and identified degree of
calcification, valve thickening and reduced valve motion to be associated with
CAVD progression. In the multivariate analysis, major calcification and valve
thickness
The assessment and quantification of aortic valve calcification with transthoracic echocardiography represents a major limitation of our study, as precise and objective measurements with this examination method are nearly impossible. In our study, the quantification of aortic valve calcification as a binary parameter is based on visual estimations and thus represents a subjective and examiner-dependent parameter. Cardiac computed tomography scans would have been needed to objectively quantify the degree of valve calcification and to confirm our results. Therefore, the results of this study should be considered hypothesis-generating. Prospective and larger trials are necessary to confirm our results.
One-third of patients with aortic valve sclerosis at baseline progressed to (any
degree of) AS within a follow-up period of four years. Advanced aortic valve
calcification and a cusp thickness
The dataset generated and analyzed during the current study is available from the corresponding author on reasonable request.
JS and SZ designed the research study. JS, CU, VM, and VV performed the research. JS, CU, BA, MW, AS, NW, VM, VV, MK, SB, GN and SZ provided help and advice on data collection and conceptualization. JS, VM, VV and SZ analyzed and interpreted the data. JS, VM, VV, and SZ wrote the manuscript. All authors contributed to editorial changes in the manuscript. All authors read and approved the final manuscript. All authors have participated sufficiently in the work and agreed to be accountable for all aspects of the work.
The study was approved by the Ethikkommission der Uniklinik Bonn (Lfd. Nr. 077/14) and all patients participated in this study, after written informed consent was obtained.
Not applicable.
G. Nickenig, S. Zimmer, S. Baldus, M. Kelm are supported by the Deutsche Forschungsgemeinschaft (SFB TRR Sonderforschungsbereich/Transregio] 259/1).
Prof. Baldus received research grants and speaker honoraria from Abbott, and Edwards Lifesciences. Dr. V. Veulemans has received speaker honoraria, grants or travel supports from Medtronic, Boston Scientific and Edwards Lifesciences. The other authors report no conflicts of interest.
References
Publisher’s Note: IMR Press stays neutral with regard to jurisdictional claims in published maps and institutional affiliations.