
†These authors contributed equally.
Academic Editors: Gianluca Rigatelli and Marco Zuin
Background: Proteomic studies investigating novel molecular markers of
coronary artery calcification (CAC) are scarce.This study compared the protein
expression in the serum of patients with severe CAC and non-CAC.
Methods: The serum from 30 patients with severe CAC and 30
matched-controls were screened by data-independent acquisition(DIA)-based
proteomic technology. Bioinformatics analysis tools were used to analyze the
underlying molecular mechanisms of the differentially expressed proteins.
Candidate proteins were further validated by an enzyme-linked immunosorbent assay
(ELISA) in an independent cohort. A receiver operating characteristic (ROC) curve
was used to estimate the diagnostic power of the candidate proteins.
Results: Among the 110 identified proteins, the expression of 81 was
significantly upregulated, whereas 29 proteins were downregulated (fold change
Coronary artery calcification (CAC) is a hallmark of advanced atherosclerosis and a well-established predictor of future cardiovascular events [1, 2]. The presence and extent of CAC can be assessed by traditional coronary angiography, intravascular ultrasound (IVUS), optical coherence tomography (OCT) and coronary computed tomographic angiography (CTA) [3]. Although vascular calcification was previously considered passive and degenerative, recent studies have suggested that it is an active process stimulated by inflammatory pathways [4]. Some risk factors for coronary disease including dyslipidemia and diabetes are correlated with the development of calcification [5]. However, long-term statin therapy and adequate diabetes control fail to stop the calcification process [6], indicating potential molecular mechanisms for calcification other than the conventional risk factors of atherosclerosis. The pathomechanism of vascular calcification is still obscure, therefore a greater understanding of the molecular mechanisms underlying coronary calcification could help to seek new intervention targets. Therefore, further elucidation of the dysregulated biological pathways and identification of novel diagnostic biomarkers specific for coronary calcification are needed.
Serum proteomic analysis is an important tool for disease biomarker discovery and provide information on the underlying pathological processes, possibly superior to genome or transcriptome [7]. Compared with traditional data-dependent acquisition (DDA)-based proteomics research, data-independent acquisition (DIA) is a powerful label-free technique in proteomic studies with high quantitative accuracy and reproducibility [8, 9]. However, studies using DIA technology to investigate the serum proteome profile for CAC patients are lacking.
In this study, we first utilized DIA proteomic techniques to identify serum proteins closely associated with CAC in the discovery phase. Differentially expressed proteins (DEPs) were further validated via an enzyme-linked immunosorbent assay (ELISA) approach in an independent sample. This study not only identified potential protein biomarkers for CAC diagnosis but also provides insights into the pathophysiological mechanisms of CAC.
Patients in this study were from our prospective registration study, in which patients with severe calcified coronary lesions on angiographic images who underwent percutaneous coronary intervention (PCI) with orbital atherectomy were recruited between February 2020 and May 2021 (registered on the Chinese Clinical Trial Registry [ChiCTR] 2000029775). Severe calcified coronary lesions were defined as the presence of apparent radiative opacities within the coronary lumen [10]. Based on qualitative visual assessment of calcified lesions using fluoroscopy, they were classified as severe (radio-opacities located on both sides of the coronary arterial wall before contrast injection and without cardiac movement), moderate (densities were acquired during the cardiac cycle before contrast injection), or none/mild calcified lesions according to the published literature [11]. An example of severe calcified coronary lesions on angiographic images is given in Fig. 1. Two cardiologists who were unaware of the patients included in this study assessed the angiographic calcification. Some cases of disagreement were adjudicated by a third independent cardiologist and given the final diagnosis. The recruited control subjects were matched by age, sex, and conventional risk factors. The control subjects were selected during the same period in the same hospital with non-calcific coronary angiography findings. Subjects with a known history of malignant tumors, serious system diseases, severe respiratory disease, renal or hepatic insufficiency, and acute infections were not included. The clinical and demographic information of the participants was recorded. The study protocol was approved by our institutional ethics committee, and written informed consent was obtained from all patients. The study was designed in accordance with the ethical guidelines of the Declaration of Helsinki.
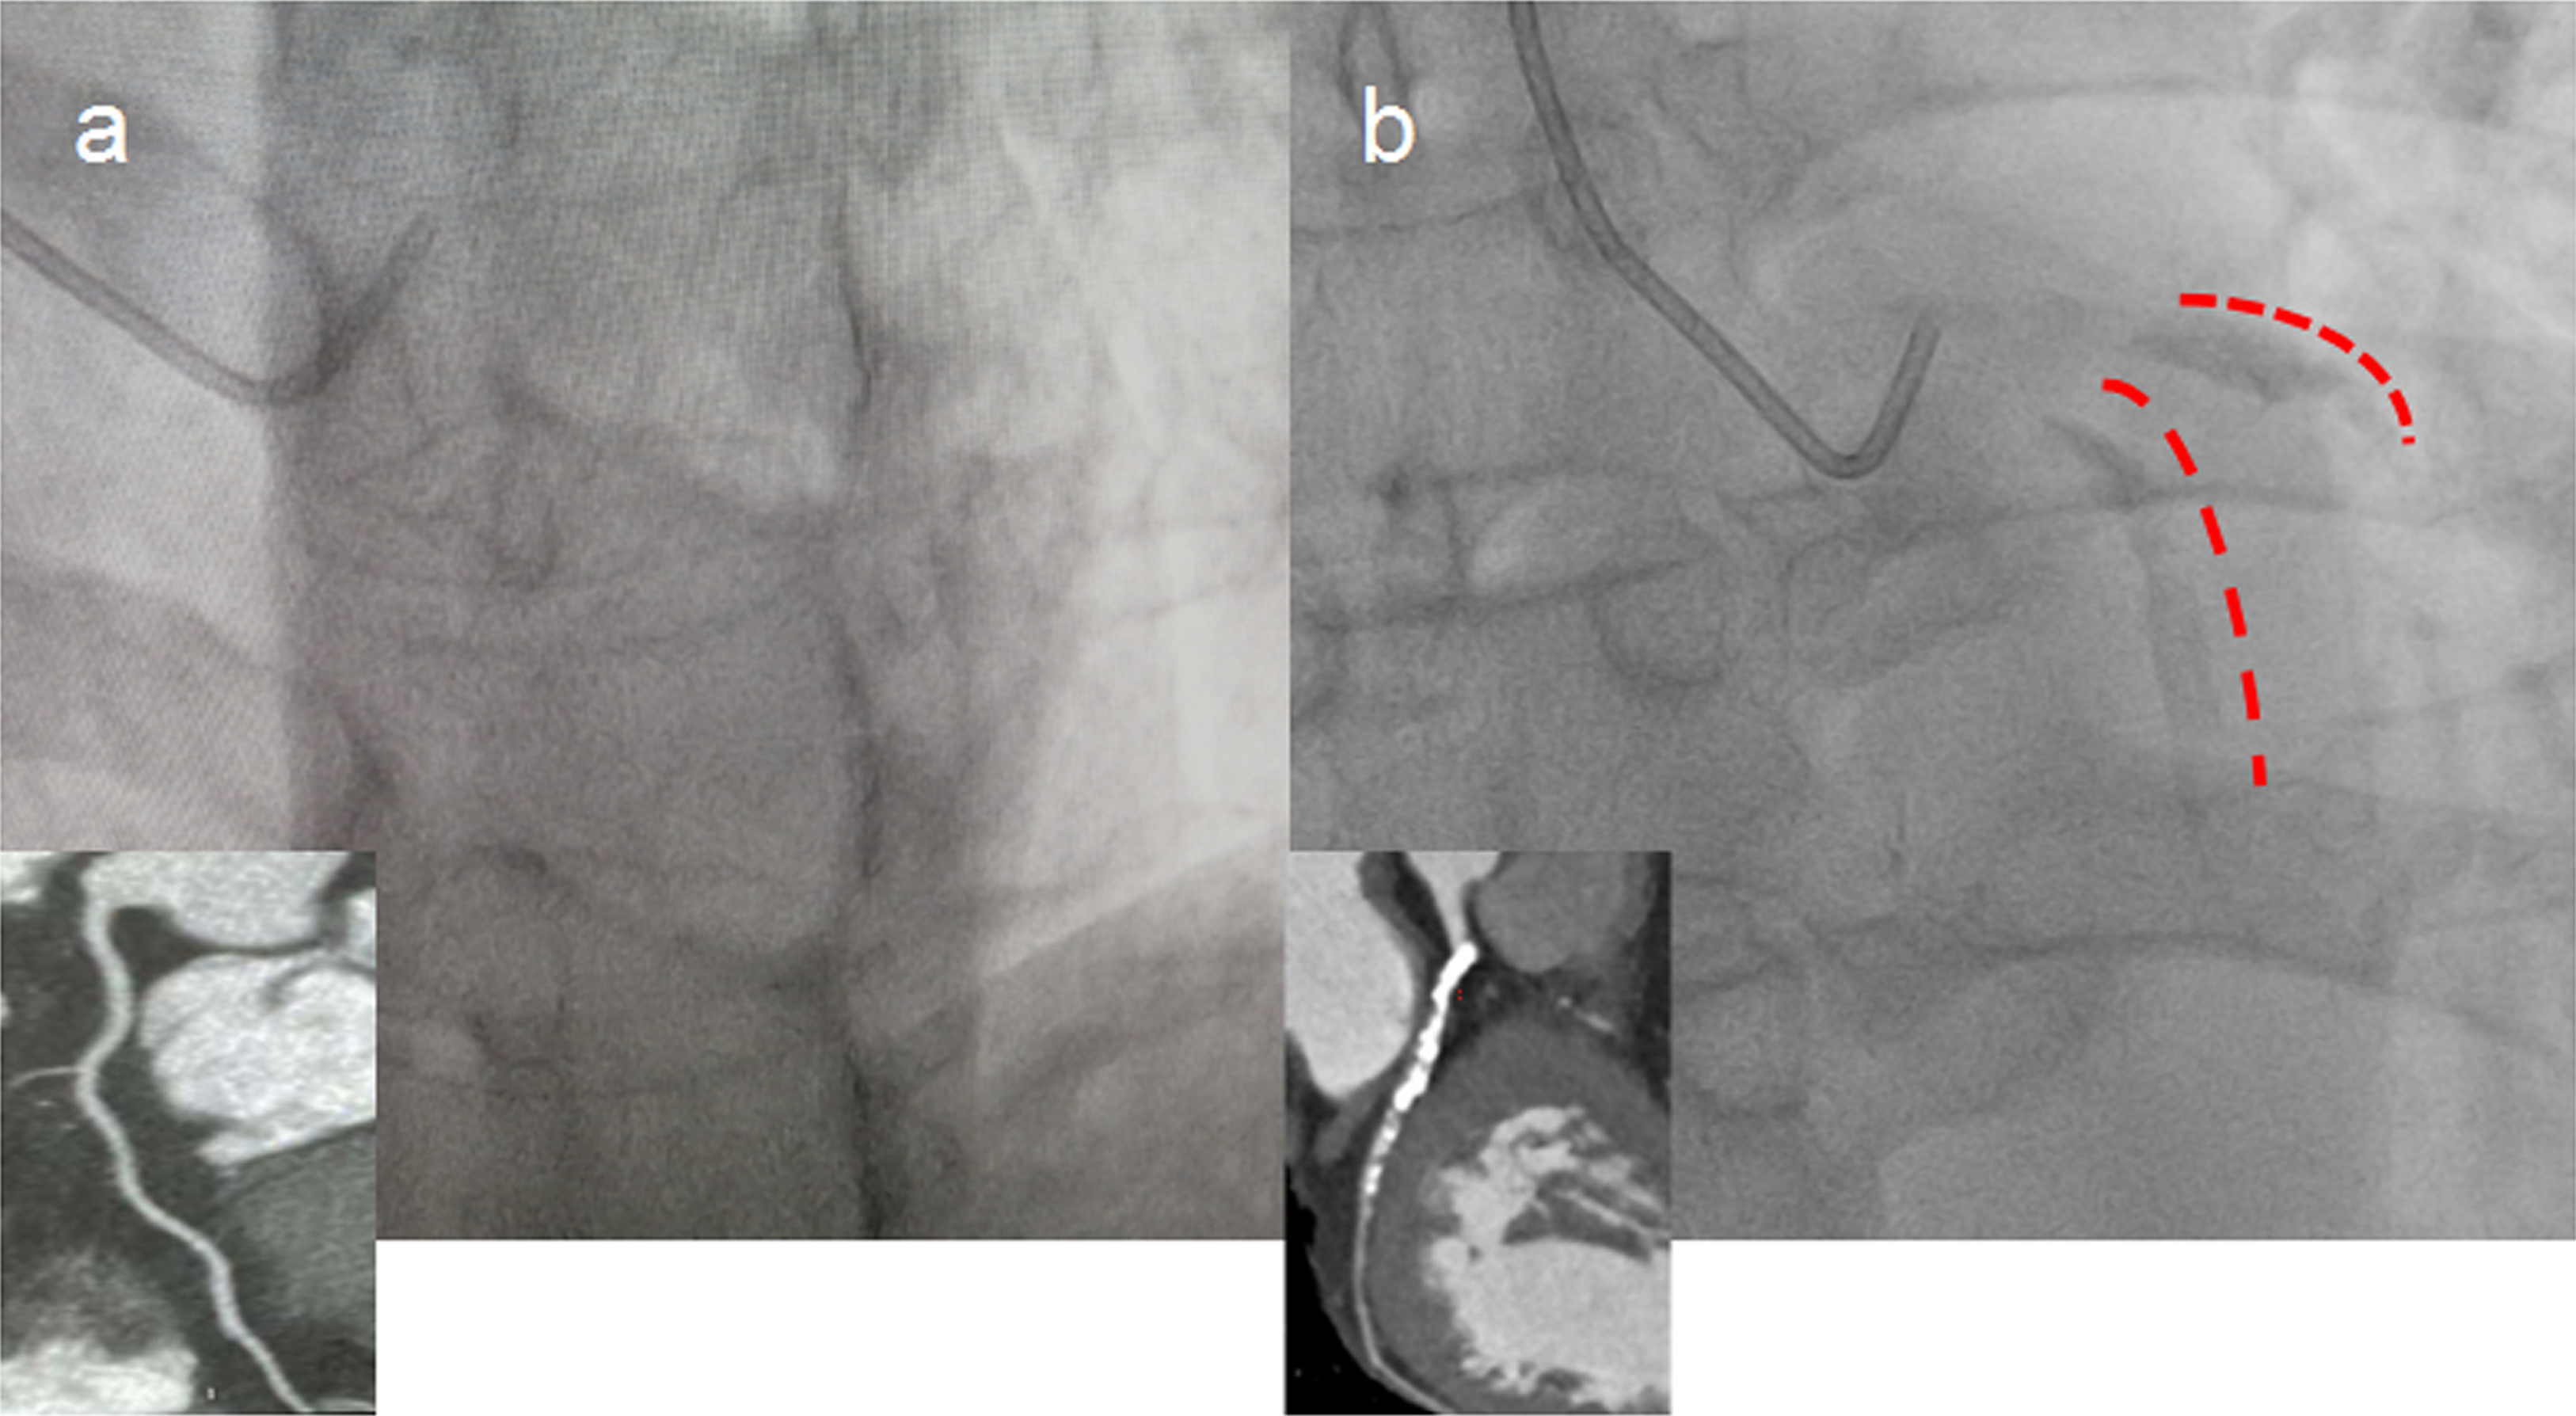 Fig. 1.
Representative image of severe calcified coronary lesions detected by coronary angiography. (a) Controls without coronary artery calcification (non-CAC). (b) Patients with coronary artery calcification (CAC). Red marks indicate severe calcified left anterior descending artery (LAD) lesions detected by x-ray and the corresponding image from coronary computed tomography angiography (CTA).
Thirty individuals were randomly selected from each group and subjected to proteomics analysis in a discovery setting. Fasting venous blood samples were collected preoperatively from CAC and control patients, centrifuged at 2500 g for 10 min to obtain serum, collected in EDTA-coated tubes, and stored at –80 °C until subsequent analysis.
High-abundant proteins from 20
Both high- and low-abundant proteins were subjected to a digestion procedure
modified from the filter-aided sample preparation (FASP) protocol as previously
described [12]. Briefly, 200
All fractions for data-dependent
acquisition (DDA) library generation were analyzed by the
Thermo Scientific Q Exactive HF X Mass Spectrometer connected to the Easy-nLC
1200 Chromatography System (Thermo Fisher Scientific, Waltham, MA, USA). The
peptide (1.5
The peptides from each sample were analyzed by liquid chromatography-tandem MS operating in the data-independent acquisition (DIA) mode by Shanghai Applied Protein Technology Co., Ltd. (Shanghai, China). Each DIA cycle contained one full MS–selected ion monitoring (SIM) scan, and 30 DIA scans covered a mass range of 350–1800 m/z with the following settings: SIM full scan resolution was 120,000 at 200 m/z, AGC 3e6, maximum IT 50 ms, and profile mode. The DIA scans were set at a resolution of 15,000, AGC target 3e6, maximum IT auto, and normalized collision energy 30 eV. The run time was 120 min with a linear gradient of buffer B (84% acetonitrile and 0.1% formic acid) at a flow rate of 250 nL/min. Quality control samples (pooled sample from an equal aliquot of each sample in the experiment) were injected in DIA mode at the beginning of the MS study and after every six injections throughout the experiment, which were used to monitor the MS performance.
The raw MS data were analyzed using MaxQuant software (Max Planck Institute of Biochemistry in Martinsried, Germany, version 1.5.3.17). The
database was Uniprot_human database, and iRT peptide sequence was added
(iRT-Kit; Biognosys, Schlieren, Switzerland). The parameters were set as follows:
enzyme was trypsin, max missed cleavages was 2, fixed modification was
carbamidomethyl (C), and the dynamic modification was oxidation (M) and acetyl
(protein N-terminus). All reported data were based on 99% confidence for protein
identification as determined by the false discovery rate (FDR = N(decoy)
The DEPs were further analyzed by Gene Ontology (GO) annotation and Kyoto Encyclopedia of Genes and Genomes (KEGG) using DAVID 6.8 database (https://david.ncifcrf.gov/).
The expression of the selected proteins from proteomics was verified by specific human ELISA kits (Abcam, Cambridge, MA, USA), and the experimental steps were performed in duplicate according to the manufacturer’s instructions.
Statistical analyses were performed using SPSS Statistics version 24.0
(SPSS Inc, Chicago, IL, USA). The clinical characteristics of the participants
were analyzed using the Student’s t-test, chi-square test, or Fisher’s
exact test as appropriate. Continuous variables with normal distribution are
presented as the mean
A total of 80 CAC patients and 80 matched-controls were included in this study. Among them, 60 serum samples (30 from CAC patients vs 30 from controls) were collected for proteomic analysis. For the validation set, serum samples from 100 participants, including 50 CAC patients and 50 matched controls, were utilized for ELISA. The clinical characteristics of the participants in the discovery and validation sets are presented in Table 1. There were no significant difference were observed in age, sex distribution, or traditional risk factors between the cases and controls. Consequently, the spectrum of clinical presentations was also well matched between the two groups in either the discovery or validation phase.
| Screening sample (DIA) | Validation sample (ELISA) | |||||
| Controls | CAC | p-value | Controls | CAC | p-value | |
| Number | 30 | 30 | 50 | 50 | ||
| Age (years) | 66.07 |
68.27 |
0.257 | 65.44 |
65.74 |
0.858 |
| Male, n (%) | 23 (76.67) | 24 (80.0) | 0.754 | 31 (62.0) | 36 (72.0) | 0.288 |
| BMI (kg/m |
25.73 |
24.15 |
0.075 | 24.56 |
25.65 |
0.147 |
| Smoker, n (%) | 11 (36.67) | 11 (36.67) | 1.00 | 5 (10.0) | 8 (16.0) | 0.372 |
| Drinking, n (%) | 14 (46.67) | 8 (26.67) | 0.108 | 12 (24.0) | 14 (28.0) | 0.648 |
| Diabetes, n (%) | 2 ( 6.67) | 4 (3.33) | 0.389 | 6 (12.0) | 12 (24.0) | 0.118 |
| Hypertension, n (%) | 20 (66.67) | 14 (46.67) | 0.118 | 14 (28.0) | 17 (34.0) | 0.517 |
| Cholesterol (mmol/L) | 4.09 |
3.77 |
0.218 | 4.48 |
4.10 |
0.092 |
| LDL (mmol/L) | 2.11 |
1.96 |
0.426 | 2.44 |
2.19 |
0.126 |
| Triglycerides (mmol/L) | 1.73 |
1.39 |
0.141 | 1.41 |
1.24 |
0.142 |
| HDL (mmol/L) | 1.08 |
1.06 |
0.832 | 1.22 |
1.13 |
0.129 |
| Glucose (mmol/L) | 4.87 |
5.14 |
0.299 | 4.91 |
5.13 |
0.266 |
| Clinical presentation, n (%) | 0.165 | 0.840 | ||||
| Stable angina | 18 (60.0) | 23 (76.67) | 21 (42.0) | 22 (44.0) | ||
| Unstable angina | 7 (23.33) | 2 (6.67) | 9 (18.0) | 10 (20.0) | ||
| NSTEMI | 4 (13.33) | 2 (6.67) | 4 (8.0) | 5 (10.0) | ||
| STEMI | 2 (6.67) | 0 (0) | 2 (4.0) | 1 (2.0) | ||
| Values are n (%) or mean Abbreviations: DIA, data-independent acquisition; ELISA, Enzyme-linked immunosorbent assay; CAC, coronary artery calcification; BMI, Body Mass Index; LDL, low-density cholesterol; HDL, high-density lipoprotein; NSTEMI, non-ST-elevation myocardial infarction; STEMI, ST-elevation myocardial infarction. | ||||||
A total of 1590 serum proteins were detected between the CAC and non-CAC groups,
and the quantitative values for all proteins are shown in Supplementary
Table 1. Proteins with fold change
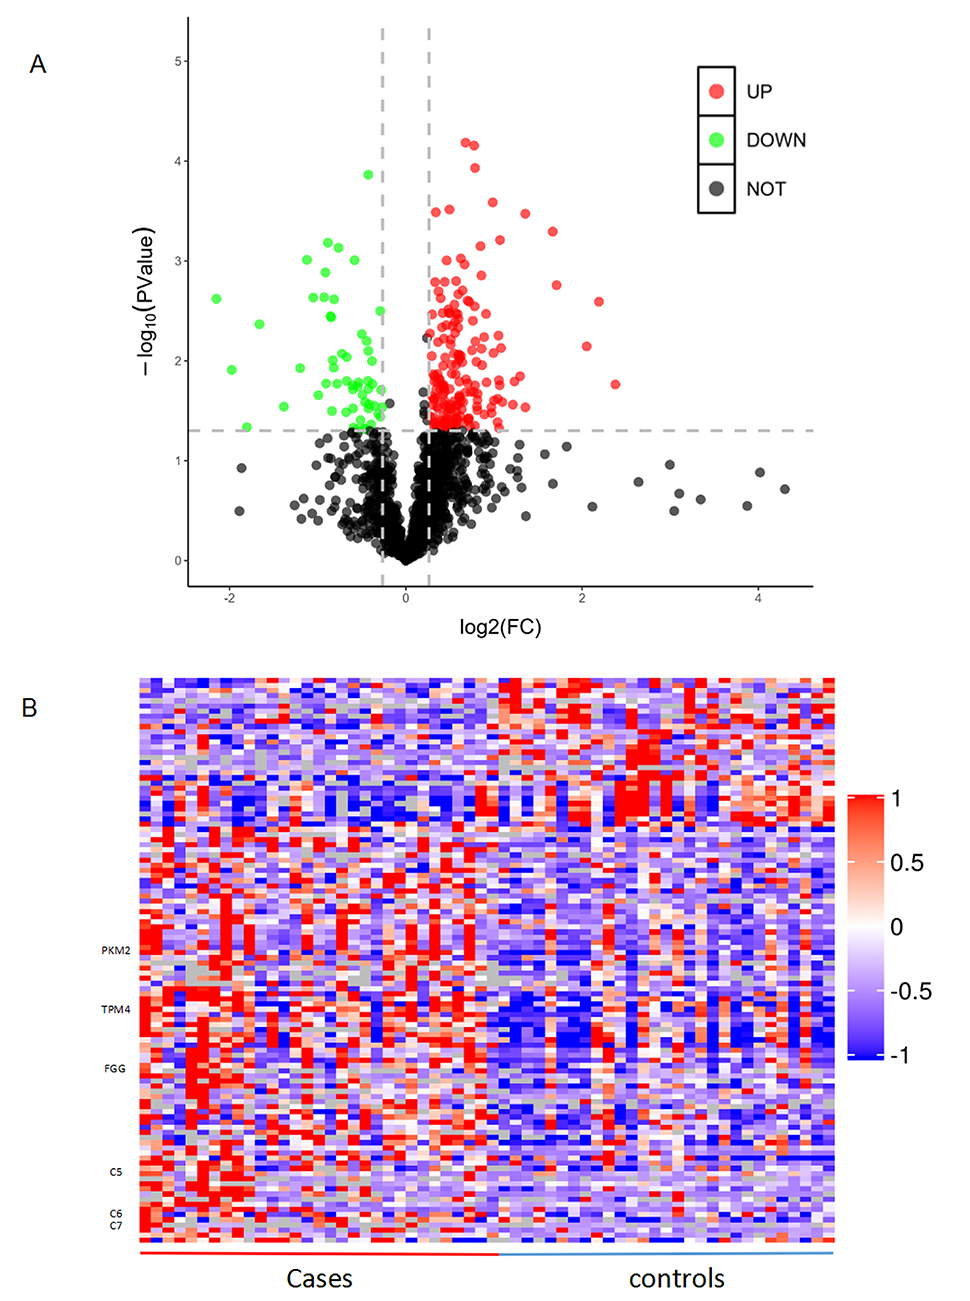 Fig. 2.
Differentially expressed proteins between patients with coronary artery calcification (CAC) and controls. (A) Volcano plot. X-axis represents log2 fold change and Y-axis shows –log10-transformed p values. Red dots indicate upregulated proteins, green dots indicate downregulated proteins, and gray dots represent proteins with no significant change. (B) Hierarchical clustering of the 110 dysregulated proteins. Red colour indicates the upregulated protein expression and blue indicates the downregulated protein expression.
GO and KEGG pathway analyses were performed to investigate the molecular mechanisms and functional activity of DEPs in coronary calcification. Detailed information on the biological process (BP), molecular function (MF), and cellular component (CC) by the GO enrichment analysis is shown in Fig. 3. In the BP category, DEPs were mainly involved in cytoskeleton organization, regulation of vasculature development, and actin cytoskeleton organization. Regarding MF classification, DEPs were associated with actin binding, cytoskeletal protein binding, signaling receptor binding, and cytokine receptor binding. Similarly, CC was mainly localized in the extracellular space, extracellular region, and extracellular vesicle. KEGG pathway results showed that the DEPs were mainly enriched in the complement and coagulation cascades, glycolysis/gluconeogenesis, regulation of the actin cytoskeleton, and platelet activation (Fig. 4).
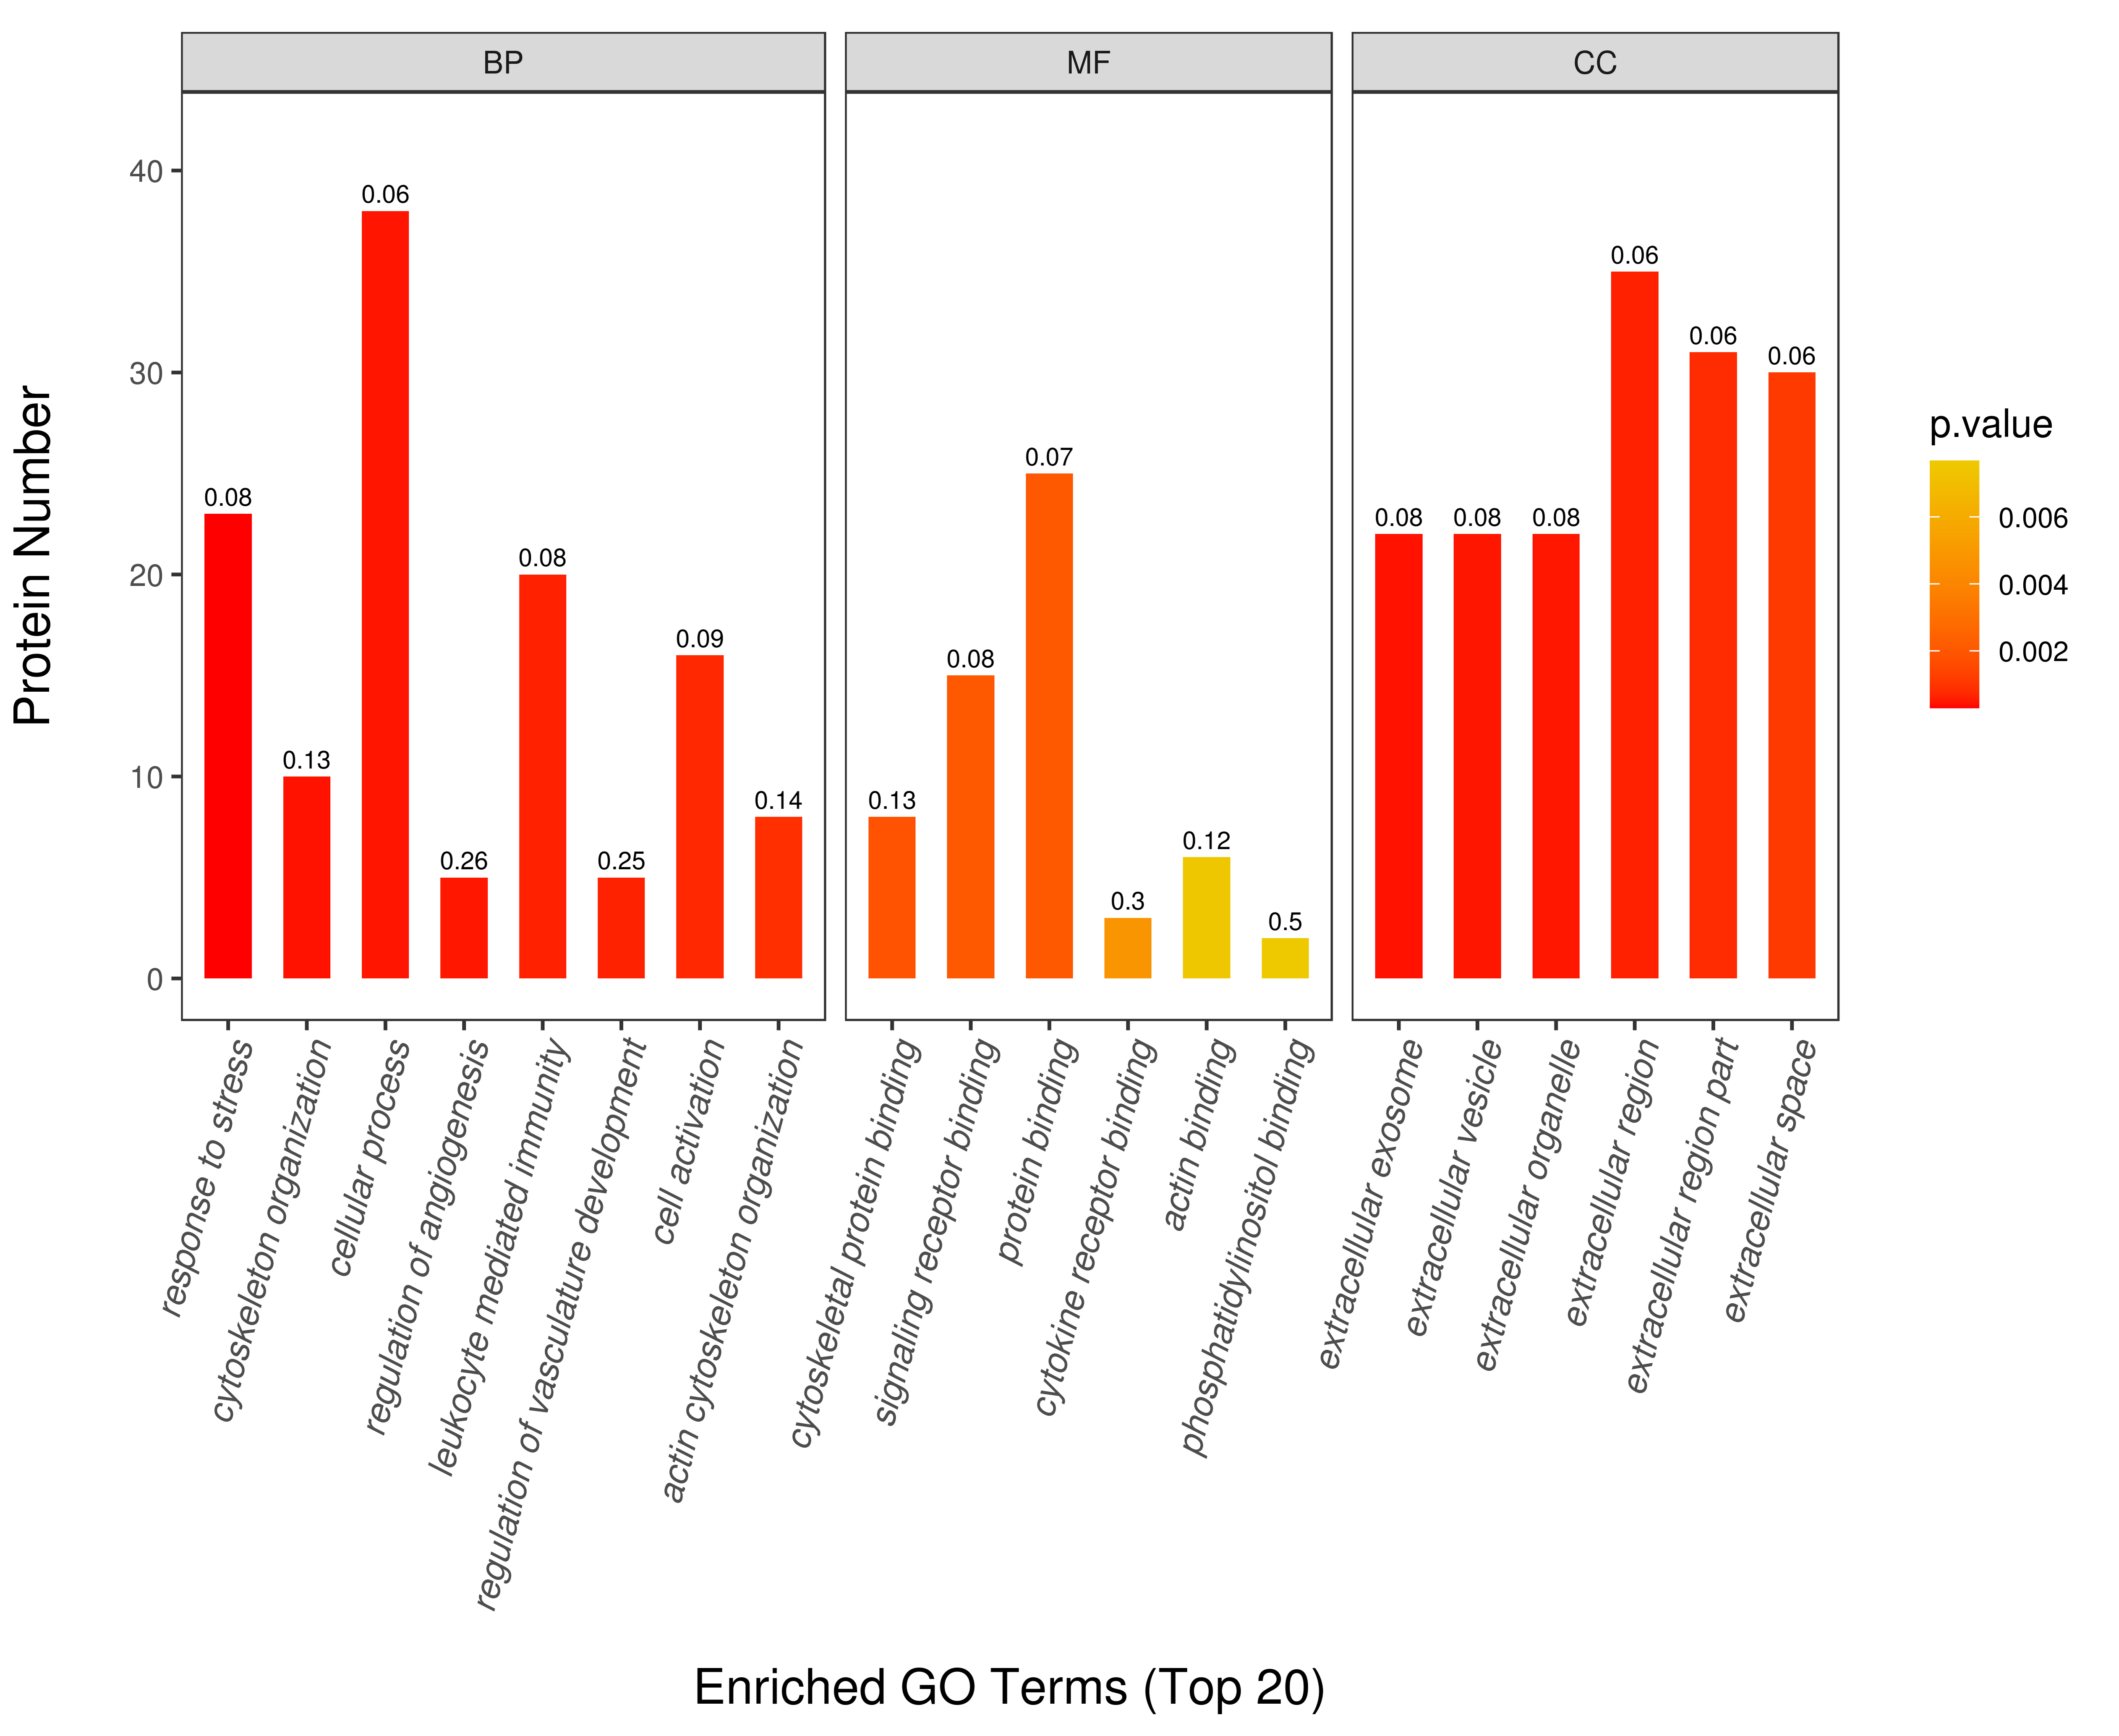 Fig. 3.
Gene ontology (GO) analysis of the differentially expressed
proteins between patients with coronary artery calcification (CAC) and controls.
GO function consist of biological process (BP), molecular function (MF) and cellular
component (CC). The Y-axis represents the number of different proteins
under each functional classification. The color gradient reflects the size of the
p value (p
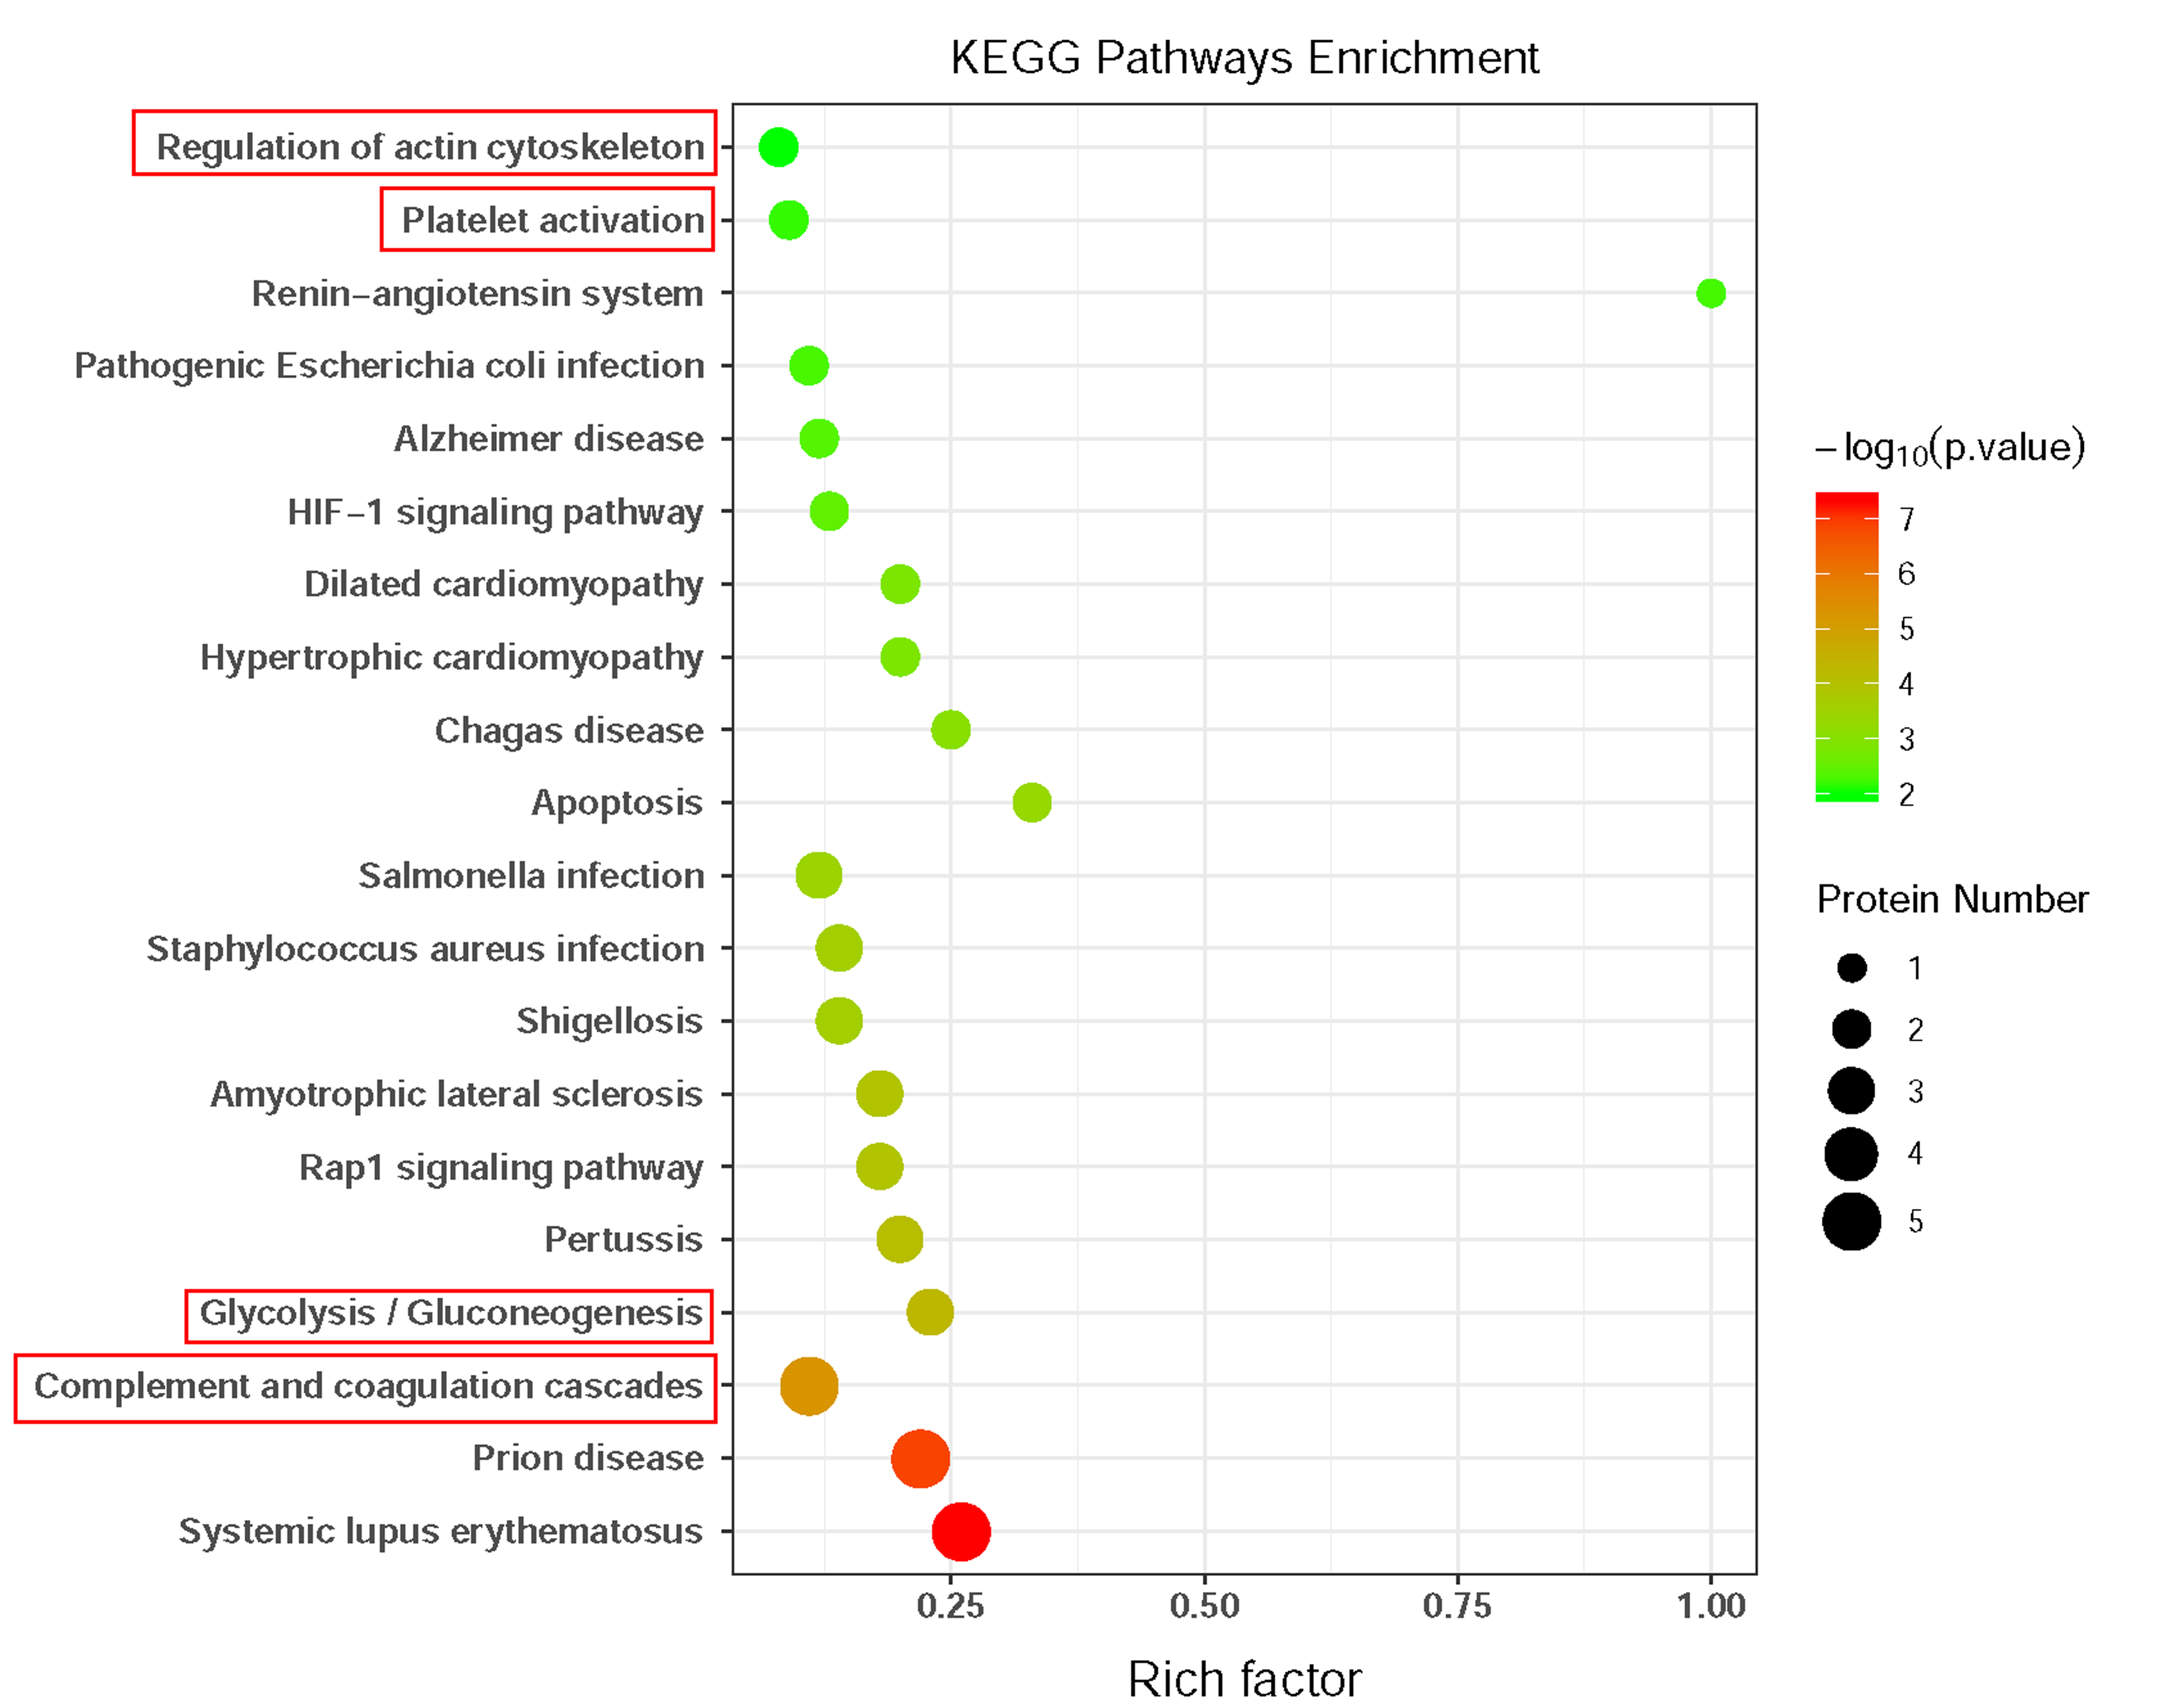 Fig. 4.
Kyoto Encyclopedia of Genes and Genomes (KEGG) pathways analysis of the differentially expressed proteins between patients with coronary artery calcification (CAC) and controls. The bubble color represents significant p value, the bubble size represents the number of differentially expressed proteins (DEPs) in the pathway. The X-axis is rich factor representing the ratio of DEPs over the total number of proteins in each pathway.
The validation of candidate protein biomarkers was based on the following
criteria: identified proteins containing more than one unique peptide,
differential expression fold change
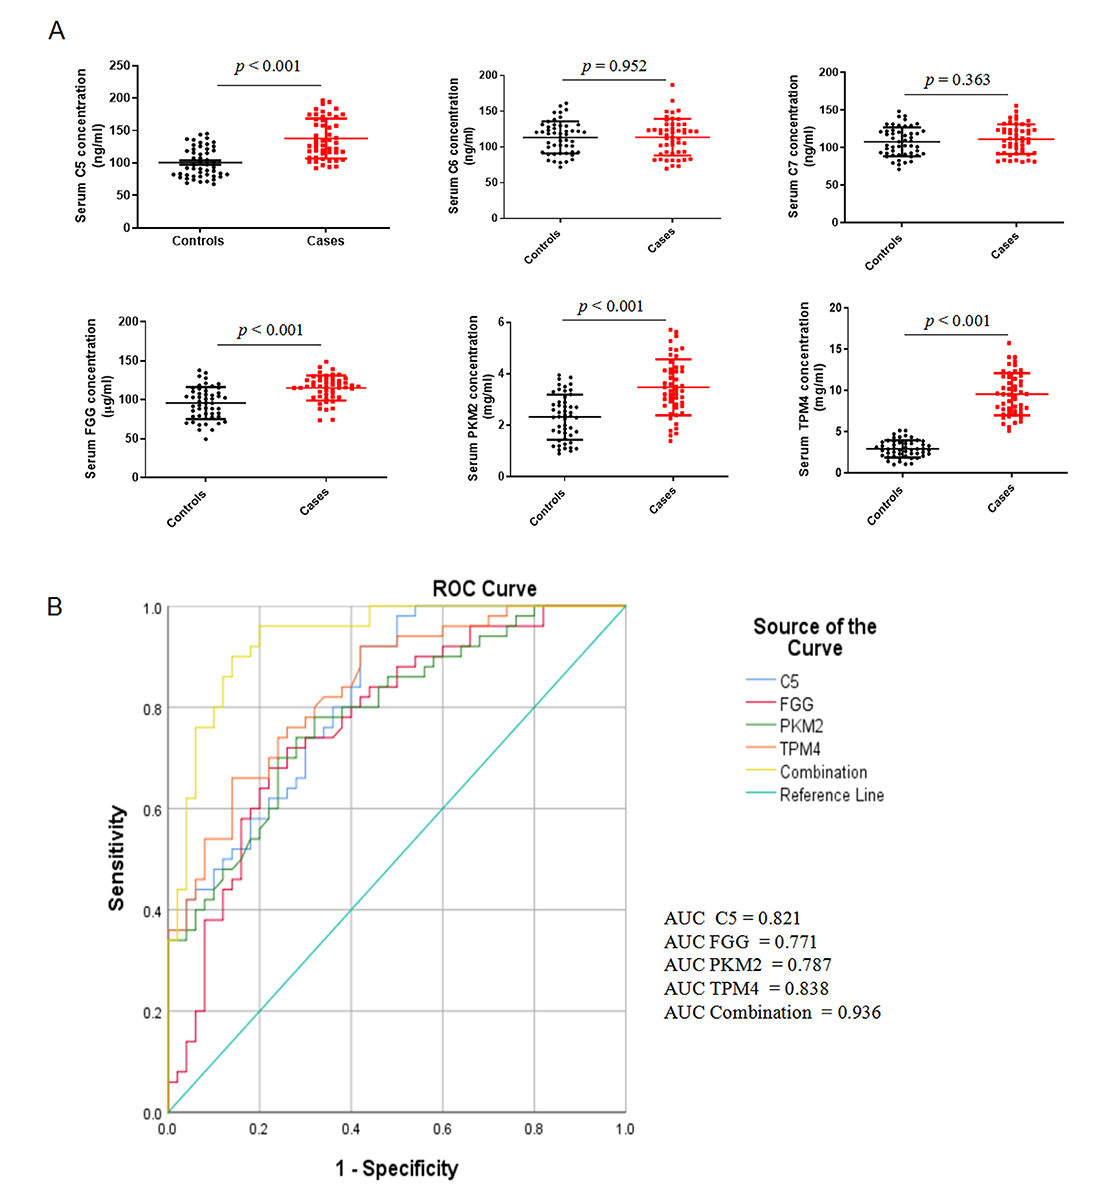 Fig. 5.
Validation of candidate serum proteins in an independent
cohort. (A) ELISA validation of six candidate serum proteins (C5, C6, C7, FGG,
PKM2, and TPM4) in 50 patients with severe coronary artery calcification and 50
matched controls. Data are presented as mean values
ROC curves were calculated to further determine the diagnostic power of serum
C5, FGG, PKM, and TPM4 in differentiating CAC patients from non-CAC controls
(Fig. 5B). As shown in Table 2, serum C5, FGG, PKM and TPM4 had an optimal AUC
| Proteins | AUC (95% CI) | p value | Cut-off value |
Sensitivity | Specificity |
| C5 | 0.821 (0.732–0.891) | 101.68 | 0.92 | 0.58 | |
| FGG | 0.771 (0.676–0.849) | 103.54 | 0.68 | 0.78 | |
| PKM2 | 0.787 (0.700–0.875) | 2.73 | 0.78 | 0.68 | |
| TPM4 | 0.838 (0.751–0.904) | 3.95 | 0.66 | 0.86 | |
| C5+FGG+PKM2+TPM4 | 0.936 (0.869–0.975) | 0.96 | 0.80 | ||
| Abbreviations: AUC, area under curve; CI, confidence interval.
Cut-off value | |||||
In this study, we employed a DIA-based quantitative proteomics strategy to explore the differential protein expression in the serum proteome of patients with severe CAC and non-CAC controls. Our results showed that 110 proteins were differentially expressed in both 30 patients with severe CAC and 30 healthy controls, of which 81 proteins were upregulated and 29 proteins were downregulated. KEGG pathway analysis of the DEPs indicated that the complement and coagulation cascade, glycolysis/gluconeogenesis, regulation of actin cytoskeleton, and the platelet activation signaling pathway were significantly changed in the development of coronary calcification.
To validate the proteomic analysis results, the six upregulated proteins with a potential role in coronary calcification were chosen for further study in another independent cohorts of subjects using ELISA. The validated results revealed that the serum levels of C5, FGG, PKM, and TPM4 were significantly increased in patients with CAC as compared to the levels of non-CAC controls. ROC curve analysis also demonstrated that the combined C5, FGG, PKM2, and TPM4 level was better in predicting CAC than use any single marker. To the best of our knowledge, this is the first proteomics analysis of differential protein expression in serum from patients with severe CAC.
This study detected the difference in serum protein expression between the two groups. For the discovery cohort, power calculations for proteomic analysis is the sample size of 60 participants (30 per group) to achieve a power of 80% and an alpha error of 0.05 referring to a previous study [16]. Indeed, the number of patients enrolled in this study does not seem so low when compared to other proteomics studies in coronary artery disease (sample size range from 10 to 20 patients each group) [17, 18, 19].
Accumulating studies provide evidence that innate immune system are key components in triggering cardiovascular calcification through inflammation response [20], whereas complement proteins is a powerful cascade of the innate immunity [21]. Whether complement system activation drives the pathology of vascular calcification has not been adequately addressed. The complement system is usually regulated by the classical, lectin, and alternative pathways. All three pathways merge at the central C3 molecule, leading to the C5 cleavage and a terminal C5b-9 complement complex formation [22]. Recent proteomics analysis identified that complement C5 expression was elevated in calcified aortic valve tissue [23] and subclinical atherosclerotic tissues [24]. Osteogenic transition implicated in the regulation of vascular calcification, and some studies have demonstrated that complement receptor C5 affects osteogenic-mediated vascular calcification by targeting the nuclear factor kappa B transcriptional activity in rodent models [25]. Other studies have revealed that inhibition of C3 and C5 activity can attenuate atherosclerosis [26, 27]. Our study indicates that serum C5 might be a potential biomarker in distinguishing CAC patients from non-CAC individuals, consistent with previous study [24].
Serum FGG levels are associated with prostate cancer and depressed patients [28, 29]. In addition, elevated serum levels of FGG increase the risk of myocardial infarction, which could be explained by platelet aggregation and fibrin formation [30]. Similarly, in this study, serum FGG was found at high levels in CAC patients compared with controls. However, whether FGG plays a causal role in coronary calcification or only acts as a biomarker has remained unclear. Therefore, the role of FGG in the development of coronary calcification needs further investigation.
Pyruvate kinase isoform M2 (PKM2) is a key rate-limiting enzyme for glycolysis and contributes to the vascular smooth muscle cell (VSMC) growth and proliferation during atherosclerosis [31]. Previous studies have shown that PKM2 influences the initiation and progression of atherosclerosis by regulating metabolic reprogramming, immune activation, and tissue inflammation [32, 33]. However, there is limited evidence on the role of PKM2 in vascular calcification. Our study fills the gaps and shows that the expression of serum PKM2 is significantly upregulated in CAC patients. The specific mechanism needs to be clarified in future studies.
Dedifferentiation of VSMCs from the contractile to the synthetic phenotype is a key process in atherosclerosis [34]. TPM4 is associated with several cell functions, such as motility and cytokinesis, is involved in SMC dedifferentiation [35]. TPM4 also contributes to the contractile and synthetic phenotypes of SMCs [36]. Therefore, TPM4 may have pro-atherogenic properties, whereas coronary calcification is strongly correlated with atherosclerosis. Our investigation showed significant upregulation of TPM4 in CAC patients, which suggests that TPM4 plays a critical role in the development of CAC.
This study had several limitations. First, it was a single-center study with a relatively small number of patients, as DIA technology is costly to apply to many samples. Second, this was a preliminary exploratory study for identifying diagnostic biomarkers for CAC, and more experiments are needed to explore the specific mechanisms of these candidate proteins.
In summary, our work screened out four proteins (C5, FGG, PKM, and TPM4) were significantly changed in the serum of CAC patients through DIA-based LC-MS/MS combined with ELISA. The pathway of complement and coagulation cascades, glycolysis/gluconeogenesis, regulation of actin cytoskeleton, and platelet activation may participate in the pathogenesis of coronary calcification. ROC curve analysis demonstrated that the combination of C5, FGG, PKM, and TPM4 was well able to distinguish between CAC and non-CAC patients. This work discovered several potential diagnostic markers and provides unique insights into protein expression in vascular calcification.
The mass spectrometry proteomics data have been deposited to the ProteomeXchange Consortium via the iProX partner repository with the dataset identifier PXD027139 (http://proteomecentral.proteomexchange.org/cgi/GetDataset?ID=PXD027139).
BCZ and LKM designed the research study; XYK, GQQ and LWL collected the serum samples and performed the research; LWL, XYK and GQQ analyzed the data and bioinformatic analysis; BCZ and LKM wrote the manuscript; LKM obtained funding. All authors contributed to editorial changes in the manuscript. All authors read and approved the final manuscript.
All subjects gave their informed consent for inclusion before they participated in the study. The study was conducted in accordance with the Declaration of Helsinki, and the protocol was approved by the Ethics Committee of The First Affiliated Hospital of University of Science and Technology of China (approval number: 2021KY-068).
We would like to express our gratitude to all those who helped us during the writing of this manuscript. Thanks to all the peer reviewers for their opinions and suggestions.
This work was funded by the “Borrow to transfer to supplement” Project of Hefei Independent Innovation Policy (No. J2019Y02) and research grants from AnHui provincial Health Commission (No: AHWJ 202 1b082).
The authors declare no conflict of interest.
Publisher’s Note: IMR Press stays neutral with regard to jurisdictional claims in published maps and institutional affiliations.