
†These authors contributed equally.
Academic Editor: Jerome L. Fleg
Background: Regular exercise improves the functional ability and
quality of life of patients with heart failure (HF). However, studies on the
results of intensity of exercise in the older population are scarce, especially
in the Asian population. Method and Results: A total of 8982
older people (age
Heart failure (HF) has become an important public medical concern due to an increase in aging population. HF causes socioeconomic burdens on individuals and society [1]. It also has high morbidity and mortality rates, with approximately 30–40% of patients dying within 1 year after being diagnosed with HF [2]. The prevalence of HF in Asia is reported to range between 1.2% and 6.7%, depending on the study population [3, 4].
Physical activity reduces not only vascular diseases but also nonvascular
morbidity as well as the mortality [5]. Recent guidelines recommend
moderate-intensity physical activity (MPA); 150–300 min/week and
vigorous-intensity physical activity (VPA); 75–150 min/week, which translates to
500–999 metabolic equivalent task min/week (MET-min/week) in population 65 years
or older [6, 7]. Completing
The effectiveness of exercise in HF patients is based on studies that actively implemented exercise-training programs within a safe range of exercise intensity in stable patients undergoing adequate medical treatment [10]. Meta-analyses showed that exercise can reduce the mortality risk in patients with HF, and these results were maintained even with short-term exercise (under 12 months) [11, 12, 13].
However, studies on the Asian population are still lacking and in particularly,
although the prevalence of heart failure is high, there are not many results
according to exercise intensity in the elderly population who has difficulty in
high-intensity exercise. The aim of this study was to determine the effect of
intensity of physical activity on the mortality risk in older individuals (age
Data were collected from the National Health Insurance Service of Korea (NHIS)-Senior database, which included data of 312,736 populations collected via a 10% simple random sampling method from a total of 5,500,000 populations 65 years or older in the National Health Information Database [14, 15]. The NHIS-Senior database included socioeconomic and insurance status, medical history, and check-up test results.
This study included the data of 8982 older adults (age
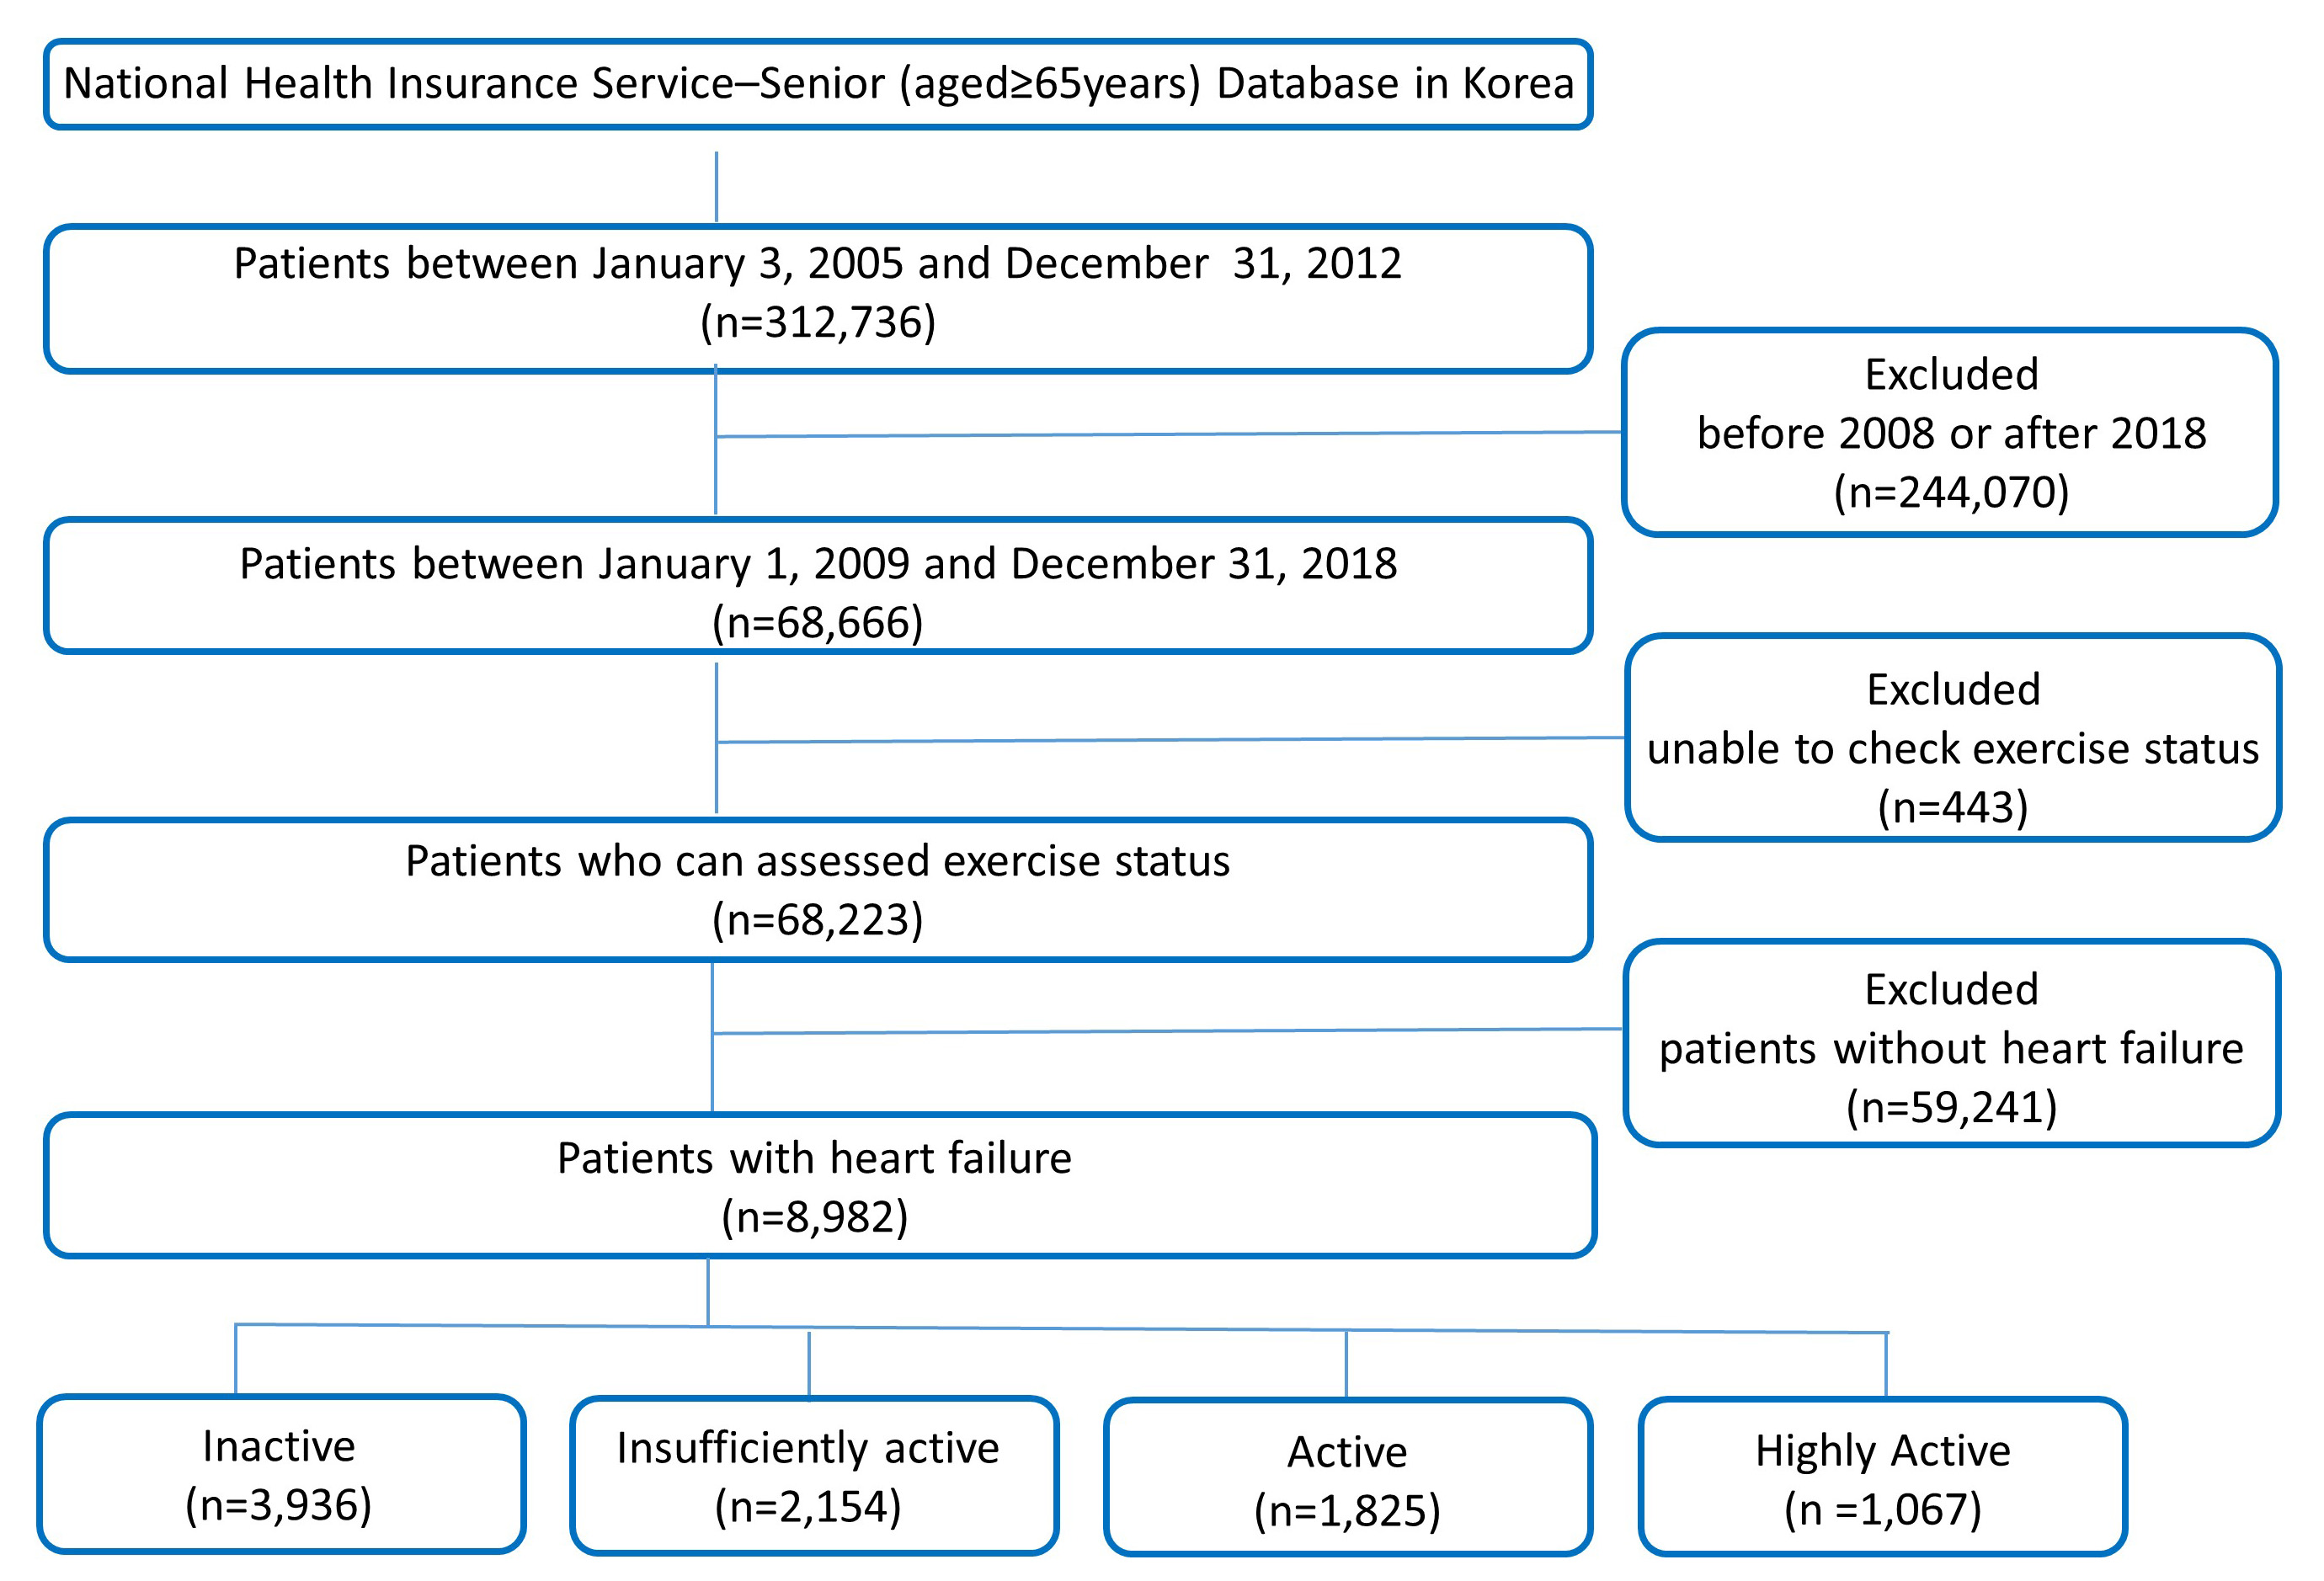 Fig. 1.
Flow diagram of the study population. A total of 8982 heart failure patients aged 65 years or older in Korea were classified according to exercise intensity.
The level of physical activity during waking time was evaluated through a self-report questionnaire using the 7-day recall method [16, 17, 18]. The questionnaire asked about frequency (days/week) of the following three intensity levels: (i) low-intensity physical activity (LPA) for at least 30 min, (ii) MPA for at least 30 min, and (iii) VPA for at least 20 min. LPA include slow speed of walking, MPA include like normal speed of walking and cycling and VPA include high speed of running and cycling.
Using the Ainsworth et al. [19] compendium, 3.3 METs for LPA, 4.0 METs
for MPA, and 8.0 METs for VPA were assigned. And the total physical
activity-related energy expenditure (MET-min/week) was the sum of duration
frequency and intensity of exercise [19]. The participants were stratified
according to their total weekly levels of physical activity as follows: (1)
highly active group: physical activity exceeding the guideline target range
(
Baseline comorbidities were assessed with the ICD-10 codes and drug prescription data (Supplementary Table 1). To ensure diagnostic accuracy, as in previous studies, if the diagnosis was registered at the time of discharge or the same diagnosis was registered twice or more in an outpatient clinic, the case was considered a corresponding comorbidity [15, 21, 22]. We performed analysis of drug history for heart failure. Among ACE (angiotensin-converting enzyme) inhibitor or ARB (angiotensin II receptor blocker), BB (beta blocker), loop diuretics and mineralocorticoid receptor antagonist, HF medication group I was assumed if no medications were taken or only ACE inhibitors or ARBs were taken. HF medication group II was assumed if BB or loop diuretics were taken but not mineralocorticoid receptor antagonist, and HF medication group III for patients taking mineralocorticoid receptor antagonist [23].
The primary outcome was all-cause mortality. Information on death (cause and time) was checked through a unique identification number in the demographics of the National Statistical Office [15, 22]. Since the NHIS is a national institution for all Koreans, this approach was used to ensure event-related information. And the mortality was analyzed by dividing them into CVD-related death and non-CVD-related death.
The secondary outcome was all-cause hospitalization. The hospitalization cause was based on the diagnosis at the time of discharge. Eligible causes of hospitalization such as exacerbation of HF, CVD, chronic ischemic heart disease, coronary vascular disease, and ischemic stroke were included. The accuracy of diagnosis based on NHIS claims data has already been verified [22]. The details of the clinical outcomes are described in Supplementary Table 1. Follow-ups of mortality and hospitalization were conducted until December 2015.
Descriptive statistics were used to analyze the baseline characteristics of participants. Categorical variables are expressed as ratios (percentages), and continuous variables are expressed as median and interquartile range. Fisher’s test or chi-square test was used for comparison between categorical variables, and Student’s t-test was used for comparison between continuous variables. The incidence of each clinical outcome was expressed as number of events/100 person-years.
Competing risk regression for all-cause death events was carried out with the Fine-Gray method. Multivariable regressions were carried out with adjustment for age, gender, hypertension, diabetes, dyslipidemia, vascular disease, stroke, renal disease, lung disease, cancer, body mass index, smoking and drinking. Additionally, investigate the effects of physical activity as continuous value (0 MET-min/week as reference) on mortality via cubic spline curve.
All test with values of p
A total of 8982 individuals 65 years or older (mean age, 75.5
| Inactive | Insufficiency active | Active | Highly active | p value | ||
| (N = 3936) | (N = 2154) | (N = 1825) | (N = 1067) | |||
| Demographic | ||||||
| Age, years | 76.9 |
75.2 |
74.1 |
73.2 |
||
| Male | 927 (23.6%) | 577 (26.8%) | 633 (34.7%) | 508 (47.6%) | ||
| Body mass index, kg/m |
24.0 |
24.6 |
24.5 |
24.8 |
||
| Waist, cm | 83.7 |
85.0 |
84.7 |
85.8 |
||
| Systolic blood pressure, mmHg | 130.7 |
130.5 |
131.8 |
132.4 |
0.005 | |
| Diastolic blood pressure, mmHg | 77.8 |
77.7 |
78.0 |
78.5 |
0.243 | |
| Smoking | 549 (13.9%) | 378 (17.5%) | 403 (22.1%) | 329 (30.8%) | ||
| Alcohol | 305 (7.7%) | 274 (12.7%) | 293 (16.1%) | 254 (23.8%) | ||
| Risk scores | ||||||
| Hospitality frailty risk score | 5.3 |
3.3 |
2.7 |
2.4 |
||
| Charlson comorbidity index | 5.7 |
5.6 |
5.4 |
5.3 |
||
| Comorbidities | ||||||
| Hypertension | 3633 (92.3%) | 2000 (92.9%) | 1696 (92.9%) | 991 (92.9%) | 0.774 | |
| Diabetes mellitus | 1268 (32.2%) | 710 (33.0%) | 613 (33.6%) | 362 (33.9%) | 0.628 | |
| Dyslipidemia | 2783 (70.7%) | 1579 (73.3%) | 1393 (76.3%) | 813 (76.2%) | ||
| Chronic kidney disease | 298 (7.6%) | 146 (6.8%) | 122 (6.7%) | 65 (6.1%) | 0.290 | |
| Vascular disease | 1114 (28.3%) | 577 (26.8%) | 503 (27.6%) | 302 (28.3%) | 0.619 | |
| Ischemic stroke or TIA | 1461 (37.1%) | 716 (33.2%) | 600 (32.9%) | 317 (29.7%) | ||
| COPD | 1062 (27.0%) | 580 (26.9%) | 393 (21.5%) | 229 (21.5%) | ||
| Malignancy | 793 (20.1%) | 489 (22.7%) | 376 (20.6%) | 236 (22.1%) | 0.094 | |
| Osteoporosis | 2362 (60.0%) | 1203 (55.8%) | 899 (49.3%) | 477 (44.7%) | ||
| Previous MI | 577 (14.7%) | 269 (12.5%) | 221 (12.1%) | 130 (12.2%) | 0.012 | |
| Peripheral artery disease | 697 (17.7%) | 378 (17.5%) | 334 (18.3%) | 205 (19.2%) | 0.638 | |
| Laboratory findings | ||||||
| Fasting blood glucose, mmol/L | 109.0 |
109.0 |
110.1 |
111.9 |
0.135 | |
| Total cholesterol, mg/dL | 189.7 |
190.8 |
189.4 |
187.5 |
0.220 | |
| Triglyceride, mg/dL | 143.8 |
146.4 |
143.3 |
143.8 |
0.624 | |
| LDL-cholesterol, mg/dL | 111.2 |
110.3 |
109.3 |
107.4 |
0.025 | |
| HDL-cholesterol, mg/dL | 51.1 |
51.6 |
52.0 |
51.3 |
0.657 | |
| AST, U/L | 25.5 |
26.7 |
26.9 |
26.5 |
0.017 | |
| ALT, U/L | 20.2 |
21.8 |
22.8 |
22.7 |
||
| Gamma GT, U/L | 31.8 |
34.6 |
35.4 |
37.8 |
0.001 | |
| Serum creatinine, mg/dL | 1.1 |
1.1 |
1.1 |
1.1 |
0.798 | |
| eGFR, mL/min/1.73 m |
63.8 |
65.1 |
66.4 |
68.5 |
||
| Medication history | ||||||
| Aspirin | 3093 (78.6%) | 1682 (78.1%) | 1426 (78.1%) | 831 (77.9%) | 0.944 | |
| P2Y12 inhibitor | 1214 (30.8%) | 619 (28.7%) | 547 (30.0%) | 321 (30.1%) | 0.400 | |
| Vitamin K antagonist | 318 (8.1%) | 181 (8.4%) | 147 (8.1%) | 87 (8.2%) | 0.972 | |
| NOAC | 15 (0.4%) | 9 (0.4%) | 12 (0.7%) | 6 (0.6%) | 0.460 | |
| ACE inhibitors or ARB | 3111 (79.6%) | 1714 (79.6%) | 1446 (79.2%) | 833 (78.1%) | 0.800 | |
| Beta-blockers | 2680 (68.1%) | 1466 (68.1%) | 1228 (67.3%) | 737 (69.1%) | 0.801 | |
| Diuretics | 3566 (90.6%) | 1910 (88.7%) | 1599 (87.6%) | 922 (86.4%) | ||
| Mineralocorticoid receptor antagonist | 1643 (41.7%) | 812 (37.7%) | 642 (35.2%) | 346 (32.4%) | ||
| Statin | 1897 (48.2%) | 1074 (49.9%) | 941 (51.6%) | 571 (53.5%) | 0.007 | |
| Values are presented as mean | ||||||
During the mean follow-up period of 92.8
| Patients (n) | Events (n) | Events/100 PYR | Unadjusted HR (95% CI) | p value | Adjusted HR (95% CI) | p value | ||
| All-cause mortality | ||||||||
| Inactive | 3936 | 776 | 6.7 | Reference | Reference | |||
| Insufficiently active | 2154 | 283 | 4.2 | 0.63 (0.55–0.72) | 0.82 (0.71–0.94) | 0.010 | ||
| Active | 1825 | 218 | 3.8 | 0.56 (0.48–0.65) | 0.81 (0.70–0.95) | 0.010 | ||
| Highly active | 1067 | 82 | 2.4 | 0.35 (0.28–0.44) | 0.52 (0.41–0.67) | |||
| CVD mortality | ||||||||
| Inactive | 3936 | 261 | 2.2 | Reference | Reference | |||
| Insufficiently active | 2154 | 95 | 1.4 | 0.63 (0.50–0.79) | 0.90 (0.70–1.14) | 0.370 | ||
| Active | 1825 | 77 | 1.3 | 0.59 (0.46–0.76) | 0.94 (0.72–1.24) | 0.670 | ||
| Highly active | 1067 | 30 | 0.9 | 0.38 (0.26–0.56) | 0.68 (0.45–1.01) | 0.060 | ||
| Non-CVD-related mortality | ||||||||
| Inactive | 3936 | 515 | 4.5 | Reference | Reference | |||
| Insufficiently active | 2154 | 188 | 2.8 | 0.63 (0.53–0.74) | 0.78 (0.65–0.93) | 0.010 | ||
| Active | 1825 | 141 | 2.5 | 0.55 (0.45–0.66) | 0.75 (0.62–0.91) | |||
| Highly active | 1067 | 52 | 1.5 | 0.33 (0.25–0.44) | 0.46 (0.34–0.62) | |||
| HR, hazard ratio; CI, confidence interval; CVD, cardiovascular disease; PYR, person-years at risk. The model was adjusted for age, sex, body mass index, hypertension, diabetes, dyslipidemia, chronic kidney disease, chronic obstructive pulmonary disease, malignancy, previous myocardial infarction, peripheral artery disease, vascular disease, prior stroke or transient ischemic attack, osteoporosis, Hospital Frailty Risk Score, Hospital Frailty Risk Score category, Charlson Comorbidity Index, smoking, and alcohol drinking. | ||||||||
 Fig. 2.
Weekly level of physical activity and adjusted hazard ratio for all-cause hospitalization in older adults with heart failure. MET, metabolic equivalent task. Non-linear cubic spline curve of weekly physical activity level against hospitalization. Black line represents the fitted line of the association between weekly physical activity level and adjusted hazard ratio of hospitalization, whereas the shaded region represents the 95% confidence interval.
The incidence of non-CVD-related mortality was 4.5, 2.8, 2.5, and 1.5/100 person-years in the inactive, insufficiently active, active, and highly active groups, respectively. Compared to the inactive group, the adjusted risk of non-CVD-related mortality was reduced in the insufficiently active (HR, 0.78; 95% CI, 0.65–0.93), active (HR, 0.75; 95% CI, 0.62–0.91), and highly active (HR, 0.46; 95% CI, 0.34–0.62) groups. However, the adjusted risk of cardiovascular-related mortality was not reduced by physical activity (Table 2).
During the follow-up period, 5788 patients (64.4%) were hospitalized. The overall incidence of all-cause hospitalizations during follow-up was 35.8/100 person-years. When divide the patients according to their level of intensity of physical activity, the incidence rates were 39.8, 35.9, 33.1, and 27.9 cases/100 person-years in the inactive, insufficiently active, active, and highly active groups, respectively (Table 3). In the Fine-Gray competing risk multivariable regression models, compared with the inactive group, the insufficiently active (HR, 0.98; 95% CI, 0.91–1.04), active (HR, 0.94; 95% CI, 0.88–1.01), and highly active (HR, 0.81; 95% CI, 0.74–0.89) groups were showed a lower risk of hospitalization. Fig. 2 presents the risk of hospitalization associated with continuous values of level of physical activity with a cubic spline curve. A non-linear relationship between physical activity and the risk of hospitalization was evident. Although the risk of hospitalization was further reduced with increased level of physical activity, the benefit of increased physical activity did not increase beyond 1500 MET-min/week.
| Patients (n) | Events (n) | Events/100 PYR | Unadjusted HR (95% CI) | p value | Adjusted HR (95% CI) | p value | ||
| Hospitalization due to all-cause | ||||||||
| Inactive | 3936 | 2613 | 39.8 | Reference | Reference | |||
| Insufficiently active | 2154 | 1400 | 35.9 | 0.91 (0.85–0.97) | 0.004 | 0.98(0.91–1.04) | 0.490 | |
| Active | 1825 | 1156 | 33.1 | 0.84 (0.79–0.90) | 0.94(0.88–1.01) | 0.110 | ||
| Highly active | 1067 | 619 | 27.9 | 0.72 (0.66–0.79) | 0.81(0.74–0.89) | |||
| Hospitalization due to heart failure | ||||||||
| Inactive | 3936 | 287 | 2.6 | Reference | Reference | |||
| Insufficiently active | 2154 | 146 | 2.3 | 0.88 (0.72–1.08) | 0.216 | 1.04 (0.85–1.27) | 0.740 | |
| Active | 1825 | 107 | 1.9 | 0.75 (0.60–0.93) | 0.010 | 0.96 (0.77–1.21) | 0.750 | |
| Highly active | 1067 | 49 | 1.4 | 0.56 (0.42–0.76) | 0.75 (0.54–1.02) | 0.070 | ||
| Cardiovascular disease | ||||||||
| Inactive | 3936 | 159 | 1.4 | Reference | Reference | |||
| Insufficiently active | 2154 | 79 | 1.2 | 0.86 (0.66–1.13) | 0.273 | 0.92 (0.70–1.21) | 0.550 | |
| Active | 1825 | 78 | 1.4 | 0.99 (0.76–1.30) | 0.939 | 1.04 (0.78–1.38) | 0.790 | |
| Highly active | 1067 | 51 | 1.5 | 1.08 (0.79–1.48) | 0.633 | 1.11 (0.80–1.54) | 0.520 | |
| Stroke | ||||||||
| Inactive | 3936 | 246 | 2.2 | Reference | Reference | |||
| Insufficiently active | 2154 | 135 | 2.1 | 0.95 (0.77–1.17) | 0.643 | 1.02 (0.82–1.26) | 0.870 | |
| Active | 1825 | 108 | 1.9 | 0.87 (0.70–1.10) | 0.242 | 0.93 (0.73–1.17) | 0.520 | |
| Highly active | 1067 | 50 | 1.5 | 0.67 (0.49–0.91) | 0.009 | 0.70 (0.51–0.96) | 0.030 | |
| HR, hazard ratio; CI, confidence interval; PYR, person-years at risk. The model was adjusted for age, sex, body mass index, hypertension, diabetes, dyslipidemia, chronic kidney disease, chronic obstructive pulmonary disease, malignancy, previous myocardial infarction, peripheral artery disease, vascular disease, prior stroke or transient ischemic attack, osteoporosis, Hospital Frailty Risk Score, Hospital Frailty Risk Score category, Charlson Comorbidity Index, smoking, and alcohol drinking. | ||||||||
Compared to the inactive group, the incidence and risk of stroke were reduced in the highly active group (2.2 vs. 1.5/100 person-years; HR, 0.70; 95% CI, 0.51–0.96; p = 0.030) (Table 3). However, the risks of HF admission and CVD were not reduced by increased physical activity.
The risk of mortality was assessed in different patient subgroups. A risk reduction of mortality was observed regardless of the patient’s age, sex, hypertension, diabetes, chronic kidney disease, and previous history of stroke (Fig. 3). In subgroup analysis according to gender, the adjusted risk of all-cause mortality was reduced in the insufficiently active (in female: HR, 0.81; 95% CI, 0.67–0.97 and in male: HR, 0.81; 95% CI, 0.64–1.03), active (in female: HR, 0.79; 95% CI, 0.64–0.99 and in male: HR, 0.85; 95% CI, 0.68–1.07), and highly active (in female: HR, 0.58; 95% CI, 0.40–0.84 and in male: HR, 0.50; 95% CI, 0.36–0.68) groups (Supplementary Table 2). The adjusted risk of all-cause hospitalization was presented at Supplementary Table 3.
 Fig. 3.
Subgroup analyses of all-cause mortality in older
adults with heart failure. AF, atrial fibrillation; CI, confidence interval; DM,
diabetes mellitus; HF, heart failure; HTN, hypertension; PYR, person-years at
risk. Forest plot showing the adjusted hazard ratios of all-cause death in older
(age
In a subgroup analysis of the HF medication group, for all-cause mortality and non-CVD-related mortality, there was no difference in outcome with increasing exercise in HF medication group I—none or ACE inhibitor/ARB, but all-cause mortality and non-CVD-related mortality were decrease with increasing exercise in HF medication group II—beta blocker or diuretics, III—spironolactone (Supplementary Table 4). On the other hand, in the case of hospitalization due to heart failure and cardiovascular disease, exercise had a positive effect on outcome in HF medication group I—none or ACE inhibitor/ARB, but in HF medication group II—beta blocker or diuretics, III—spironolactone, there was no significant correlation between exercise change and outcome (Supplementary Table 5).
This large scale, real-world nationwide cohort study of older Asians with HF demonstrated the following results. First, known effects of exercise on HF were reconfirmed in an older Asian population. Increased level of physical activity decreased the risk of all-cause mortality. In particular, the risk of non-CVD mortality (vs. CVD-related mortality) was significantly reduced with increased physical activity. Moreover, increased physical activity also reduced the risk of hospitalization in older patients with HF. Second, and more importantly, the effect of decreasing mortality with more physical activity started at level lower of physical activity compared to the World Health Organization (WHO) guideline of 500–999 MET-min/week.
The recent Cochrane review of exercise training [12], including 33 trials in 4740 patients with HF (primarily HF with a reduced ejection fraction), showed that exercise tends to reduce mortality in trials using 1 year of follow-up. Compared to the control group, the exercise-trained group had lower hospitalization rates (both all-cause and HF-related hospitalizations) and improved the quality of life of patients. Practical recommendations for exercise training have been published by the Heart Failure Association [24]. Also, a single large-scale randomized controlled trial showed a modest decrease in the primary composite outcome of all-cause mortality or all-cause hospitalization [25]. However, this study did not show a significant reduction in mortality [25, 26]. Therefore, although the importance of exercise in HF has been proven, there is insufficient information on the results of exercise intensity, with limited number of related studies, especially on Asians.
As the life expectancy of HF peoples increases, comprehensive medical support for them, including lifestyle modifications, such as exercise, has become increasingly important. In this study, the dose-response relationship between physical activity and mortality was evaluated by calculating the total duration physical activity as a continuous variable. The positive benefits of increased physical activity on mortality started to appear at lower levels of activity (Fig. 4). These results showed that little activity is better than no activity at all.
 Fig. 4.
Adjusted hazard ratio for all-cause mortality in older adults with heart failure by weekly physical activity levels. MET, metabolic equivalent task. Non-linear cubic spline curve of physical activity level against all-cause mortality. Black line represents the fitted line of the association between weekly physical activity level and adjusted hazard ratio of mortality, whereas the shaded region represents the 95% confidence interval.
Also, the same results were confirmed in the analysis by gender difference. Although many studies demonstrated that physical activity and physical exercise may prevent negative cardiovascular adaptations associated with the postmenopausal period, which in turn could lead to the development of heart failure [27, 28], this study showed that physical activity reduced all-cause mortality and all-cause hospitalization even in elderly females with HF.
In the past, exercise was performed for the prevention of diseases including heart failure and it is already known that exercise has therapeutic implications [29, 30]. This is also specified in current treatment guidelines [7]. This study showed that the therapeutic effect of such exercise was also applied to Asian, older adults, and heart failure patients, and that even lower-intensity exercise than the guideline was meaningful.
This study had limitations. First, it did not include echocardiographic data, such as left ventricular ejection fraction, or assessment of symptoms, such as the New York Heart Association Functional Classification, since the diagnostic criteria of HF were based on the ICD codes. Although we presented the outcome according to the different degree of medication for heart failure, the severity of HF could not be evaluated. This can be an important limitation of this study, as severe HF condition can reduce physical activity. Further studies based on the severity of HF are required. Second, such studies using administrative databases could be susceptible to errors arising from coding inaccuracies. To minimize this problem, we applied the definitions that were already validated in previous studies using the Korean NHIS cohort [15, 20, 21, 22, 23, 24, 25, 26, 27, 28, 29, 30, 31]. Third, CV-related information was relatively well known in NHIS data, but it was difficult to identify all other causes of death. Therefore, we only divided total deaths into two categories: CVD-related and non-CVD-related deaths. Fourth, this study relied on self-reported data at a single point in time. Therefore, questionnaire answers may not reflect the overall patient’s condition. Fifth, although physical activity plays an important role in reducing CVD-related incidents, recent data showed that activity alone is not enough to reduce the risk of CVD in older adults [32, 33]. In this study, other factors such as sedentary behavior were not considered; therefore, additional research on these factors in the elderly Asian population is required. Despite these limitations, this study was still significant in that it was a large-sized study using physical activity data in older Asian population with HF. Herein, we assessed the correlation between exercise intensity and clinical outcomes in HF patients. Overall, our analysis may serve as the first step in determining the optimal exercise intensity for older adults with HF.
In older population with HF, increased level of physical activity was reduced risk of all-cause mortality. The benefit of increased physical activity on mortality began at a lower physical activity level compared to the WHO guideline of 500–999 MET-min/week, and the risk reduction of all-cause death increased with increased level of physical activity.
Conceptualization—GY and BJ; methodology—PY; software—EJ; validation—PY and EJ; formal analysis—GY; investigation—MK and MJ; resources—MK; data curation—MJ; writing—original draft preparation—GY; writing—review and editing—BJ; visualization—HY and TK; supervision—HP and ML; project administration—BJ; funding acquisition—BJ. All authors have read and agreed to the published version of the manuscript.
Not applicable.
The National Health Insurance Service (NHIS) of Korea provided the NHIS of Korea-Senior database. The authors would like to thank the NHIS for their cooperation.
This research received no external funding.
The authors declare no conflict of interest. Boyoung Joung is serving as one of the Editorial Board members of this journal. We declare that Boyoung Joung had no involvement in the peer review of this article and has no access to information regarding its peer review. Full responsibility for the editorial process for this article was delegated to Jerome L. Fleg.