
The objective of this study was to explore the effects of myocardial bridge compression on blood flow, normal stress, circumferential stress and shear stress in mural coronary artery. An original mural coronary artery simulative device has been greatly improved and its measured hemodynamic parameters have been expanded from a single stress (normal stress) to multiple stresses to more fully and accurately simulate the true hemodynamic environment under normal stress, circumferential stress and shear stress. This device was used to more fully explore the relationship between hemodynamics and mural coronary atherosclerosis under the combined effects of multiple stresses. Results obtained from the mural coronary artery simulator showed stress abnormality to be mainly located in the proximal mural coronary artery where myocardial bridge compression was intensified and average and fluctuation values (maximum minus minimum) of proximal stress were significantly increased by 27.8% and 139%, respectively. It is concluded that myocardial bridge compression causes abnormalities in the proximal hemodynamics of the mural coronary artery. This is of great significance for understanding the hemodynamic mechanism of coronary atherosclerosis and has potential clinical value for the pathological effect and treatment of myocardial bridge.
Myocardial bridge (MB) refers to the myocardial bundle covering the surface of the coronary artery, while mural coronary artery (MCA) refers to the coronary artery covered by the myocardial bridge. A growing body of research shows that under certain conditions MB can change the structure of the coronary artery wall compressed by the MB and local hemodynamic abnormalities appear that lead to different degrees of cardiac event (De Marco et al., 1988).
The development of modern medical technology has enabled the clinical observation and evaluation of the changes in MCA hemodynamic caused by MB, such as coronary angiography and observation of MB in systolic pressure conditions (Hashimoto and Takekoshi, 1984; Pola'cek and Kralove, 1961). Intracavitary ultrasound can track changes in cross-sectional area of the MCA during the cardiac cycle, where the shape of the lumen changes from circular to elliptical; especially the characteristic wall structure with diagnostic value "half-moon phenomenon (Möhlenkamp et al., 2002)". Intracavitary Doppler spectrum examination shows the change of blood flow rate of the coronary artery after compression in each segment (Schwarz et al., 1997). These new techniques have greatly enriched the understanding of the clinical significance of MB compression on coronary artery. However, due to the inherent limitations of these techniques and the diversity of MBs and MCAs, clinical observations and in vivo studies lack systemicity. The randomness affecting the hemodynamic parameters of clinical study subjects (such as the width of the MB and MCA pressure level, blood pressure and heart rate) makes them difficult to systematically and comprehensively study. Currently, there are no satisfactory methods for measurement of hemodynamic parameters, such as stress and blood flow. Therefore, there is limited knowledge of hemodynamic changes in MCAs caused by MBs.
In an in vitro simulation of blood vessel stress, Hu et al. (2006) used ultrasonic Doppler to determine arterial pressure, flow velocity, inner diameter and average wall thickness, amongst other aspects Naruse and Sokabe (1993) used a strain cavity system to simulate the tensile stress environment of blood vessels. He and Li (2007) numerically simulated the residual stress and strain of a normal arterial wall. Those studies provide conditions for simulating the stress environment of normal blood vessels in vitro. Therefore, the current study constructed a device to simulate MB compression of MCA, collect relevant parameters such as normal stress (i. e. blood pressure), shear stress and circumferential stress and maintain, repeat and control experimental conditions for extended periods. This, allowed the analysis of relationships between changes in the mural coronary arterial hemodynamic environment and atherosclerotic lesions.
An in vitro device was developed for simulation of the coronary arterial hemodynamics in MB. It was composed of a simulated blood circulation and parameter measurement module and a MB module. The device block diagram and the physical picture are shown in Fig. 1.
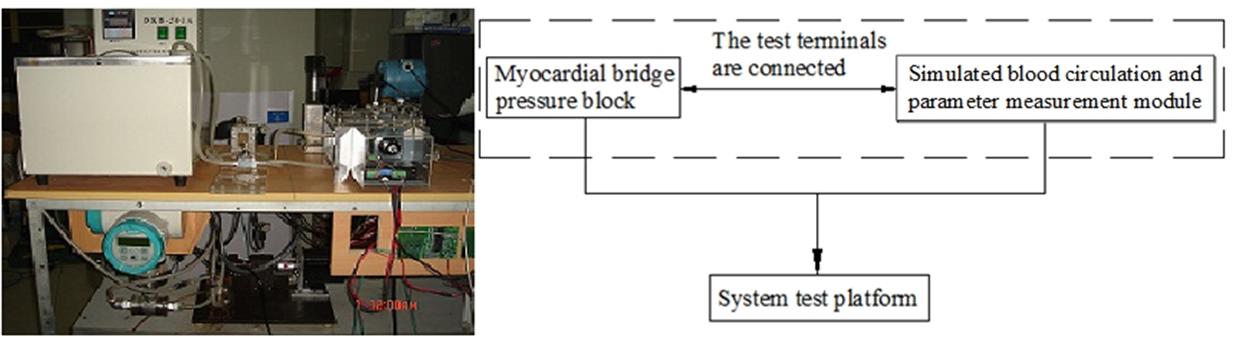 Figure 1.
Block diagram (left) and hemodynamic model (right) of mural coronary artery simulation device.
The simulated blood circulation and parameter measurement module is a circulatory system composed of dynamic, heart pump, piping, and measurement systems. As shown in Fig. 2, test point 1 in the graph is used to place the pressure sensor and temperature sensor. The pressure difference sensor is placed between test points 1 and 2. Measuring test point 3 is placed at the flow sensor. Three stress states (normal stress, circumferential stress and shear stress) can be obtained through analysis of the data obtained from these sensors. Adjustment of the heart pump pulse frequency to simulate different heart rates by altering the loads A, B and accumulators, changes peripheral resistance and compliance values. This allows the flow, pressure and pressure differentials flowing through the test section to be monitored in real time.
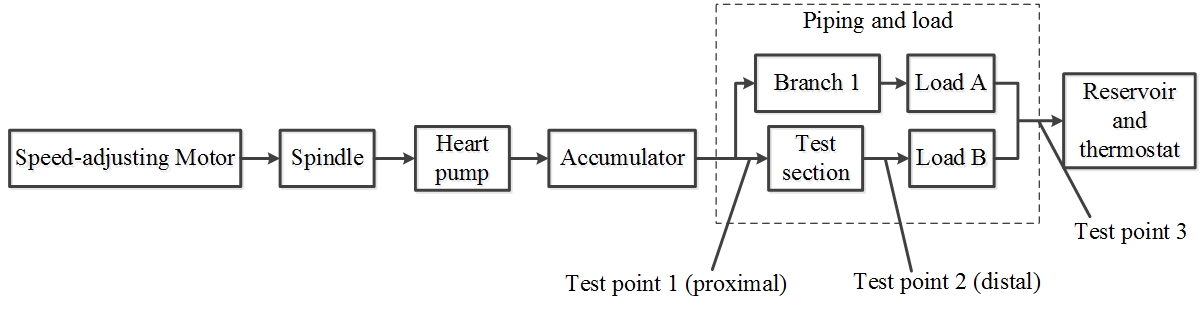 Figure 2.
Block diagram of blood flow simulation and mural coronary artery-myocardial bridge module.
The main body of the module is the air pressure regulating chamber, a closed cube. The cube contains a circular (silicone) tube flow chamber and MB pressure block. The cube has a liquid inlet and an outlet. By combining the interface module with the hemodynamic parameter testing system module, the cube provides a pipe flow chamber simulation of the three-dimensional flow field and the corresponding stress environment (normal stress, shear stress and circumferential stress). The MB pressure block is positioned on both sides of the radial circular tube flow chamber and is driven by a motor external to the cube. Adjustments to the area of the MB pressure block and degree of compression can be made by changing pressure block size and the stroke of the driving motor, respectively. There is also a gas inlet at the bottom of the cube. The gas passes through the external air pump, gas storage and proportional pressure valve to the inside of the cube. Air storage is used to stabilize gas pressure and a pressure sensor is placed at the top of the gas storage to measure the pressure in the cube. The proportional pressure valve is inflated or exhausted according to the air pressure in the closed cube. This series of components is composed of a gas pressure measurement and control system to achieve the external pressure of the elastic chamber to adjust the circumferential stress. The block diagram of the module is shown in Fig. 3.
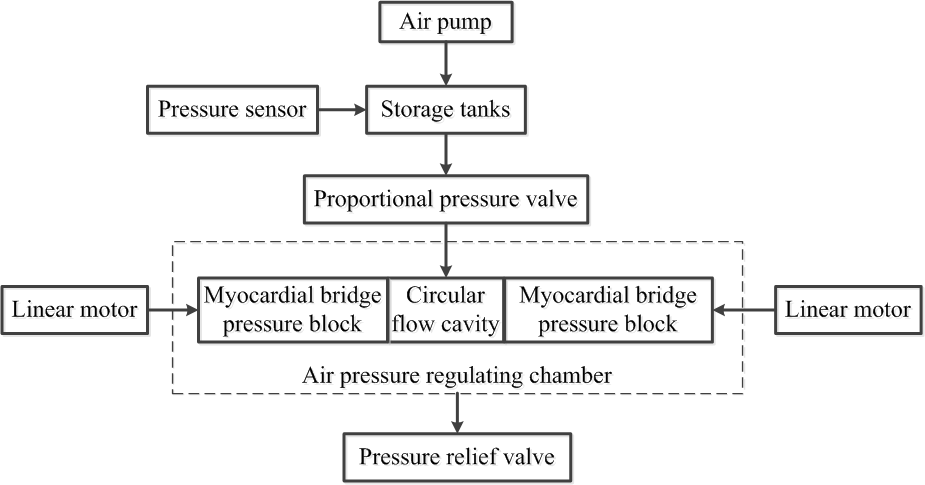 Figure 3.
Block diagram of myocardial bridge module.
In the MB module test points 1 and 2 are used to measure the proximal pressure at the inflow end of the fluid and the distal pressure at the outflow end, respectively (Fig. 4). The MB pressure blocks are located on both sides of the simulated MCA. The motor-driven MB pressure block compresses the simulated MCA according to a preset compression target and reciprocates linearly along the guide rail. According to simulation requirements, either two-sided or one-side compression can be applied and different sizes of pressure block can be inserted according to the compression requirements.
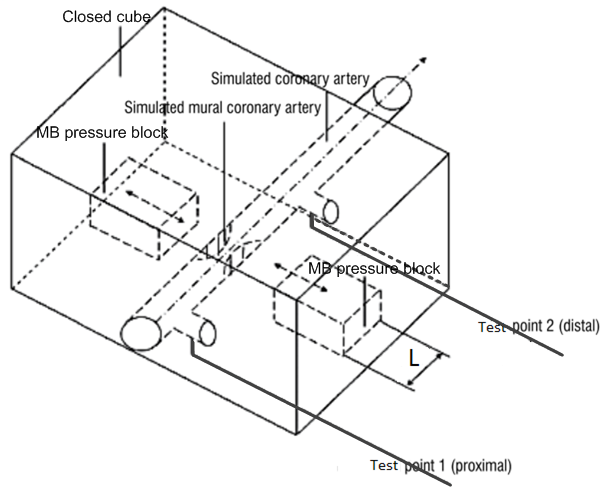 Figure 4.
Mechanical structure diagram of myocardial bridge module.
The proximal normal stress is measured directly by the pressure sensor (test point 1) and the distal normal stress is obtained by subtracting the value of the pressure sensor (test point 1 and test point 2) from the pressure sensor value of test point 1. The pressure sensor was model MC20WA, precision 0.25% FS, and the differential pressure sensor was model MC3351DP4E22B3, accuracy 0.1% FS.
Blood vessels were modelled by straight silicone tubes with an inner diameter of 4.3 mm (${{R}_{i}}=2.15\times {{10}^{-3}}m$) and length 80 mm. The simulated blood density was $\rho =1.05\times {{10}^{3}}kg/{{m}^{3}}$, the dynamic viscosity $\mu =4\times {{10}^{-3}}N\cdot s/{{m}^{2}}$ and the cardiac cycle $T=0.85s$.
2.4.1 Calculation of circumferential stress
The circumferential stress
where, ${{\sigma }_{\theta }}$ is the wall circumferential stress, ${{q}_{1}}$ the pressure inside the tube wall, ${{q}_{2}}$ the external pressure of the pipe wall, ${{r}_{0}}$ the external radius after loading and ${{r}_{i}}$ the inner radius after loading, $r$ is an arbitrary radius after loading and is necessary for the calculation of the inner-wall circumferential stress. Therefore, $r$ is the loaded inner radius (${{r}_{i}}$).
According to Eqn. 1, to calculate the blood vessels
The relationship between the inner diameter and diameter of the silicone tube under loading conditions is
Here, $\lambda_{z}$ is the axial elongation ratio. By introducing the relevant experimental data into Eqn. 3, the calculation formula of the circumferential stress can be obtained as:
In Eqn. 4 ${{q}_{1}}$ can be determined by the post-adjustment load and measured by the pressure sensor, and ${{q}_{2}}$ is determined by the air compressor and proportional pressure valve and measured by the pressure sensor. The variation of the outer diameter of the pipe wall ${{r}_{0}}$ was measured by a parallel optical camera. The value of the circumferential stress can be calculated from this and the change rule of circumferential stress determined.
2.4.2 Calculation method of shear stress
Direct measurement of the round tube wall shear stress is still technically difficult because not only does it require detection of the velocity gradient adjacent to the round wall of the simulated blood vessel to have relatively high spatial resolution, but there also must be no damage during real-time continuous measurement. It is especially difficult to detect the change of the wall shear stress in the pulsation period during pulsating flow.
The method of calculating the shear stress of the tube wall by measuring the fluid velocity on the pipe shaft was proposed by Liu et al. (2001). Here, it is used to calculate the shear stress of the wall surface of the simulated coronary artery in the simulator.
An ultrasonic Doppler velocimeter was used to detect the flow velocity $V(0,t)$ at the wall $y=0$ of the coronary artery near the proximal and distal ends of the tube. Shear stress was then calculated according to:
where, $\mu $ is the dynamic viscosity of simulative blood; $\rho $ the density of simulative blood; $R$ the inner diameter of the simulative artery. ${{R}_{e}}$ refers to the real part, ($j=\sqrt{-1}$), ${{J}_{0}}$ is a zero-order Bessel function, ${{J}_{1}}$ a first-order Bessel function, $\omega =\frac{2\pi }{T}$ represents the harmonic circular frequency, $y=\frac{r}{R}$, ${{\alpha }_{k}}$, is the Womersley number ($k=0$,1,2……$N$), ${{V}_{0}}$ and ${{V}_{k}}$ represent the velocity components of zero-order and K-order respectively.
According to Eqn. 5, 6 and 7, the corresponding average shear stress (i. e., constant shear stress) $\bar{\tau }(y)$ can be calculated, along with the pulsating shear stress $\tilde{\tau }(y,t)$ and the total periodic oscillation shear stress $\tau (y,t)$.
According to experimental measurement, the heart pump’s per stroke output ranges between 2.8 and 19 ml, with a stroke rate ranging from 40 to 200 per minute. The flow rate that the actual device provides ranges from 0.11 to 3.9 l/min, which is much larger than the experimental requirements of 0.25 to 1.25 l/min. The plots of Fig. 5 show that the pump pressure waveform curve of the simulator is consistent with the human left ventricular wave curve.
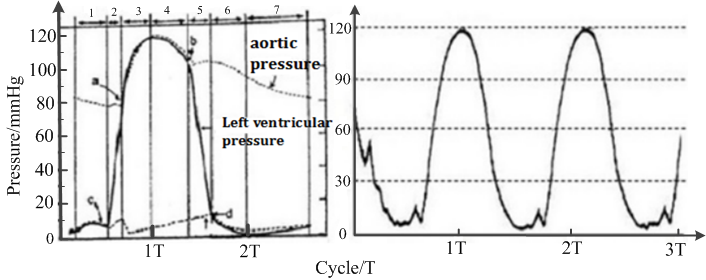 Figure 5.
Pressure waveform of human left ventricle (left) and the heart pump (right).
Clinical testing of patients was performed with MB Doppler graphics to reflect the blood flow velocity. The sudden acceleration of early diastolic coronary artery blood flow formed a prominent peak, showing a "finger-tip phenomenon", diastolic blood flow speed then rapidly declined and subsequently declined at a slower pace constitute the late diastole platform. When the systolic phase begins, blood flow velocity again falls rapidly. When the MCA is compressed, the Doppler spectrum of the human body and the simulation device is shown in Fig. 6.
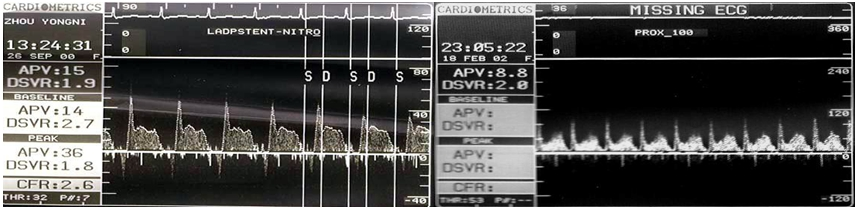 Figure 6.
Doppler spectrum graphics of human coronary artery (left) and simulated mural coronary artery (right).
The pressure pattern recorded by a simulated MCA replicates that of clinical MB patients (Klues et al., 1997; Fig. 7). As the MB presses the MCA, the systolic and mean pressures at the proximal end increase, resulting in a "water hammer phenomenon". The average heart pressure at the distal end is effectively unchanged and the diastolic blood pressure decreases.
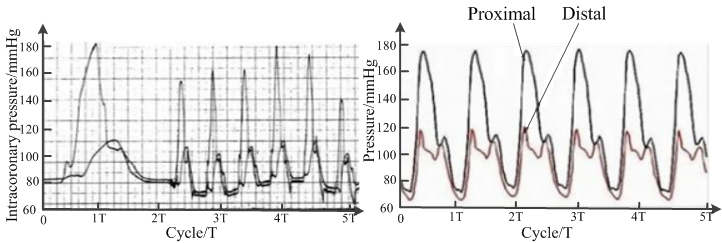 Figure 7.
Pressure waveform of human coronary artery (left) and simulated mural coronary artery (right).
Clinical studies have shown (Dong and Qian, 2006; Liu et al., 2011) that the MB compresses the MCA during systole but not during diastole. In the simulations reported here, the design of the device is based on clinical studies where heart pump compression is synchronized with the MB pressure. Consequently, the pressure waveform in the coronary artery is in phase with the pressure waveform imposed by the MB on the MCA.
With increased MB compression on the coronary artery, the average normal stress and fluctuation value of the proximal coronary artery were gradually increased, while the normal distal stress was unchanged. Results showed that when there was no MB compression, the proximal maximum pressure was 122 mm Hg, the lowest pressure was 76 mm Hg, the average value was 97 mm Hg and the fluctuation value was 46 mm Hg; the distal end exhibited a maximum pressure of 120 mm Hg, minimum pressure of 75 mm Hg, average value of 93 mm Hg and a fluctuation value of 45 mm Hg. When the degree of compression was close to 100%, the highest pressure at the proximal end was 180 mm Hg, the lowest pressure 70 mm Hg, the average value 124 mm Hg, the fluctuation value 110 mm Hg and the average and fluctuation values were increased by 27.8% and 139%, respectively, whereas, the maximum pressure of the distal end was 121 mm Hg, the minimum pressure was 69 mm Hg, the average value 93 mm Hg and the fluctuation value 52 mm Hg.
With the increased MB compression on the coronary artery, the average and fluctuation values of the proximal circumferential stress of the simulated coronary artery were gradually increased, while the distal circumferential stress was effectively unchanged. According to Eqn. 4 the circumferential stress change law is consistent with the normal stress and the circumferential stress is proportional to the normal stress regardless of changes in pipe diameter.
When MB compression was increased, the average value of the proximal shear stress of the simulated coronary artery was lower than at the distal end, while the fluctuation value was higher than that of the distal end (Fig. 8). With no MB compression, the maximum shear stress of the proximal wall was 4.912 Pa, the minimum value 2.261 Pa, the average value 3.73 Pa and the fluctuation value 2.651 Pa; the maximum wall shear stress at the distal end was 4.677 Pa, the minimum value 2.329 Pa, the average value 3.84 Pa and the fluctuation value 2.348 Pa. When the degree of compression was close to 100%, the maximum value of the proximal shear stress was 14.36 Pa, the minimum value 0.058 Pa, the average value 4.17 Pa and the fluctuation value 14.3 Pa; the maximum shear stress at the distal end was 11.84 Pa, the minimum value 0.137 Pa, the average value 5.07 Pa, and the fluctuation value 11.71 Pa.
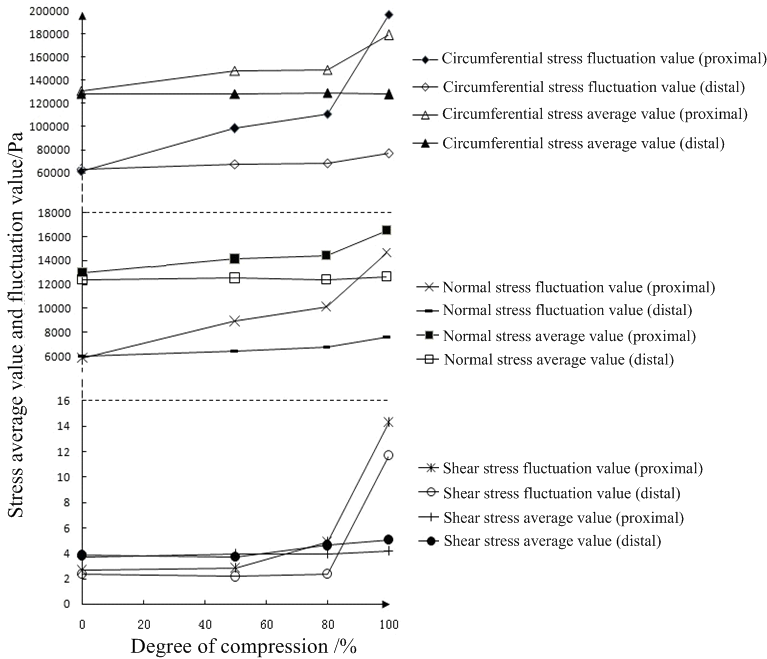 Figure 8.
Average and fluctuation values of stress.
In recent years, many studies have suggested that the MB is not only a morphological change, which can cause severe myocardial ischemia and related clinical events, mainly related to its location and anatomy (Pagliaro et al., 2019). MCAs, by repeated compression or distortion, are more likely to go into spasm. Due to turbulence and other hemodynamic disorders, the proximal heart is more prone to atherosclerosis (AS) followed by plaque rupture, hemorrhage, thrombosis and coronary artery spasm. At the same time, it may also lead to the occurrence of acute coronary syndrome (Lee et al., 2001).
The simulation results of the change of the stress reported here all have a common mechanical background. Because of the existence of MB and its mechanical compression of the MCA in systole, the original normal hemodynamic condition is destroyed. For the MCA, the compression of MB results from an external force disturbance and the disturbance in the MB coronary arterial hemodynamic environment is the real reason for the abnormal phenomenon.
The simulation results reported here show that the myocardial bridge mural coronary artery (MB-MCA) hemodynamics are quite different from the normal coronary hemodynamics, especially at the proximal end of the MB-MCA. In summary, abnormalities of mural coronary arterial hemodynamics are primarily summarized by the following points.
(1) Normal stress (i. e. blood pressure)
The greater the pressure on the MCA, the greater the pressure change and the temporal fluctuations of proximal blood pressure. Compared with the normal coronary artery, the blood pressure of the MCA changes significantly. As the MB gradually compresses the coronary artery systolic pressure and the mean pressure of the proximal end of the MB increase and the diastolic blood pressure decreases. However, there is almost no change in systolic blood pressure and mean pressure at the distal end of the MB and diastolic blood pressure decreases. When compression is close to 100% the average value of the proximal normal stress and the fluctuation value increase by 27.8% and 139%, respectively.
(2) Circumferential stress
The circumferential stress of the MCA is very abnormal compared with the normal coronary artery. Especially in the proximal end, circumferential stress oscillation is severe. With the intensification of the MB compression, the mean value and fluctuation of the circumferential stress at the proximal end of the MCA increased significantly, while the circumferential stress at the distal end remained basically unchanged.
(3) Wall shear stress
As the MB presses deeper, oscillation of wall shear stress becomes increasingly severe, with the shear stress of the proximal end greater than that of the distal end. When the pressure is 100%, the highest shear stress at the proximal end is 14.36 Pa, the lowest 0.058 Pa and the fluctuation value is 14.3 Pa; when the MB was not affected, the highest proximal shear stress reached 4.912 Pa, the lowest was 2.261 Pa and the amplitude was 2.651 Pa.
(4) Flow rate
As MCA pressure is increased, the blood flow velocity during systole is slowed down, while the blood flow velocity during diastole is significantly increased. This creates a sharp contrast between the diastolic high speed and the systolic low velocity. When the MCA pressure is close to 100%, the near-central Doppler spectrum showed a special phenomenon. In the early stage of diastole, it rises rapidly to form a prominent peak and then rapidly drops, thus forming a characteristic "finger-tip phenomenon" (Fig. 6).
It was shown that the existence of the MB affects the average stress value (shear stress, normal stress and circumferential stress) and stress fluctuation value in the MCA.
The greater the degree of MB compression of the MCA, the greater the stress and circumferential stress values become at the proximal end of the MCA, while the average shear stress increases at the distal end. Increased normal stress occurs when the MB compresses the coronary artery and the kinetic energy of blood flow is converted into pressure. The proximal circumferential stress increases correspondingly because the circumferential stress is proportional to the normal stress. An increased average MCA distal shear stress is due to instantaneous compression of the MB, which results in increased distal blood flow.
The greater the degree of MB compression on the MCA, the greater the stress fluctuation value of the intramural MCA while the proximal normal stress, circumferential stress and shear stress fluctuate more intensely than at the distal end. In the proximal end of the MCA, the instantaneous MB compression blocks the normal blood flow. This results in a "water hammer" phenomenon and a sharp increase in the normal and circumferential stresses. Similarly, blockage of blood flow leads to a sharply decreased flow, which in turn leads to increased shear stress fluctuation.
Simulation results reflect the complexity of hemodynamic changes in the proximal vessels. This places the proximal MCA under a long-term fatigue load; increased proximal fluctuation accelerates the local MCA fatigue damage and increases the risk of vascular endothelial cell damage. It is this damage of vascular intima that leads to the occurrence and development of AS (Valenta et al., 1999). Simultaneously, damaged intima of blood vessels can lead to increased blood flow resistance and to maintain the requisite blood flow, blood pressure is forced to rise further. As mentioned above, changes in the proximal vascular flow field cause vascular intima damage, which in turn aggravates the abnormal changes in the vascular flow field to worsen vascular damage. Research into this kind of phenomenon, has found a causal relationship between high blood pressure and atherosclerosis (Liu et al., 2007; Sipahi et al., 2006), so increased proximal blood pressure of MCA caused by MB is closely related to AS. Increased average circumferential stress in the proximal part of the MCA causes a local tensile stress concentration phenomenon, which induces an increased circumferential stress in the proximal part that is much higher than that of the peripheral area. However, a rising circumferential stress fluctuation aggravates blood vessels that undergo fatigue loading, due to the fatigue load sensitivity of the stress concentration. This increases the likelihood of fatigue damage to blood vessels and this damage is the main reason for the focal distribution of AS (Doriot, 2003).
The numerical simulation results show that MB-MCA hemodynamics are quite different from the normal coronary hemodynamics and the blood flow, wall shear stress and wall shear stress gradient are different. For MB-MCA the change of proximal wall shear stress and wall shear stress gradient is much greater than at the distal end. The numerical calculations of the simulations reported here confirm the experimental results: the abnormality of stress is mainly located at the proximal end of the MCA. As the MB compression increases, the mean stress and fluctuation value of the proximal end increases significantly and MB compression causes abnormalities in the proximal hemodynamics of the MCA.
In conclusion, hemodynamic factors such as blood pressure, shear stress and circumferential stress can cause changes in the structure and function of the cels of the vascular wall, which are important factors leading to AS (Krizanac-Bengez et al., 2004). Hemodynamic abnormalities can regulate the occurrence and development of AS through multiple pathways such as endothelial cell surface receptors, G-protein, intracellular transduction signals and gene expression (Cunningham and Gotlieb, 2005).
The simulator developed for this study can achieve simultaneous myocardial bridge compression in three stress environments, which is close to the real hemodynamic environment. However, there are several issues that require further study.
(1) The simulation device models the coronary artery as a straight tube with a constant diameter. However, real coronary arteries are not straight but tortuous with a radius that varies during the heart cycle. The simulator can be improved to better model the real situation.
(2) Silicone tubing is used as an approximate model of blood vessels, but there are differences in their constitutive relationship with real blood vessels. The real vascular material is viscoelastic and anisotropic; the silicone tube material is elastic and isotropic. Therefore, it is necessary to further improve the match between the biological materials and the simulator in the development of a better model of blood vessels.
(3) The shear stress calculation in the simulation device uses the model of Liu et al. (2001). Since elastic silicone tubing is used in the simulation device reported here, it is still different from the rigid circular tube used by Liu et al. (2001). Further, due to the deformation of the lumen caused by the compression of MB by MCA, the wall shear stress in the simulation device is still only an approximate calculation.
(4) In the simulations reported here, the pulsating flow in a closed cube can reasonably be assumed to be one-dimensional. The turbulent state induced by vessel bifurcation, combined with the basic equation of one-dimensional tube flow (Huo and Kassab, 2007) was not considered here. A more realistic mathematical model of real vascular fluid should be studied in depth.
The data used to support this study are available upon request from the corresponding author.
This work was supported by the Shanghai Natural Science Foundation [grant number 17ZR1413500] by the Shanghai Science and Technology Commission.
The authors would like to express their sincere gratitude for the guidance and help received from Professor Shixiong Xu from Fudan University.
The authors declare that they have no conflict of interests.