

 , Li Lin 1,*
1 Institute for Nutrition and Food Safety, Sichuan Center for Disease Control and Prevention, 610000 Chengdu, Sichuan, China
Abstract
This study investigated the contamination levels of phthalates (PAEs) in Baijiu (Chinese liquor) from Sichuan Province, China, and assessed the associated dietary exposure and health risks for the local adult population.
Commonly consumed Baijiu products were collected from Sichuan Province. PAEs were analyzed using gas chromatography-mass spectrometry (GC-MS). Daily dietary exposure was estimated by combining the measured PAE concentrations with local Baijiu consumption data obtained from the China Nutrition and Health Surveillance in 2022 (CNHS 2022).
5 PAEs were detected in these samples. Among these PAEs-positive samples, the detection rates were as follows: primarily di-n-butyl phthalate (DBP) (detection rate 75.69%), diisobutyl phthalate (DIBP) (40.33%), dimethyl phthalate (DMP) (20.44%), di-(2-ethyl) phthalate (DEHP) (11.05%), and butyl benzyl phthalate (BBP) (8.29%). DBP showed the highest mean concentrations of 0.44 mg kg-1. The cumulative exposure from Baijiu alone was significantly below the safety threshold (hazard index, HI <1). And a risk assessment based on relative potency factors (RPFs) further indicated that the cumulative exposures (mean 0.315 μg kg-1 bw d-1, P95 1.904 μg kg-1 bw d-1) were well below the group-tolerable daily intake (TDI) of 50 μg kg-1 bw d-1. However, after proportionally adjusting the group-TDI based on Baijiu’s estimated contribution (2.16%) to total dietary PAE exposure, a Baijiu-specific adjusted limit of 1.08 μg kg-1 bw d-1 was derived. Compared to this stricter limit, the mean exposure from Baijiu (0.315 μg kg-1 bw d-1) remained within the safe range, whereas the P95 exposure (1.904 μg kg-1 bw d-1) exceeded it by 76.63%, indicating a potential risk for high-consumption individuals.
In summary, PAE exposure via Baijiu is low-risk for most but concerning for high consumers. This highlights the need for enhanced monitoring, stricter controls on DBP, and promoting moderate intake.
Keywords
- phthalates
- occurrence
- Baijiu
- Chinese liquor
- dietary exposure
- risk assessment
Phthalates (PAEs), a series of ester derivatives of phthalic acid [1], are widely used as plasticizers to enhance the flexibility of polyvinyl chloride (PVC) products [2] and are also prevalent in diverse consumer goods such as food packaging, medical devices, and children’s toys [3]. Since PAEs are not chemically bound to the polymer matrix, they can readily migrate from products into the environment under common conditions [4, 5, 6]. As a result, PAEs have been frequently detected in various environmental media, including air, indoor dust, soil, food, and water bodies [7, 8, 9], establishing them as ubiquitous environmental contaminants.
Critically, PAEs are recognized as environmental endocrine-disrupting chemicals (EDCs) whose ability to interfere with hormonal systems constitutes their primary public health concern [10]. Exposure to these EDCs has been consistently linked to multiple adverse health outcomes driven by endocrine disruption, including reproductive and developmental toxicity [11, 12, 13], immune and metabolic dysfunction [14, 15, 16], and neurodevelopmental impairments [17, 18].
Studies have shown that diet is the main source of human exposure to PAEs [10]. Investigating specific foods that may contribute significantly to this exposure is therefore essential. Baijiu is one such food that requires focused study [19, 20]. It can be contaminated by PAEs from plastic equipment during production [21], and it is widely consumed. This concern is supported by data indicating that about 0.64% of adult drinkers in China exceed the DBP intake safety limit through their diet [10], identifying alcohol consumption as a potential risk factor. This fact, coupled with past food safety incidents involving plasticizers, underscores the critical need to assess dietary exposure through specific vectors like Baijiu and to evaluate the associated health risks.
Global regulatory responses to this issue vary significantly. For example, the European Food Safety Authority (EFSA) established a group-TDI of 50 µg kg-1 bw day-1 for key PAEs [22], while China’s national standard (GB 9685-2016) sets specific migration limits (SMLs) for compounds like DEHP, di-isononyl phthalate (DINP), and DBP [23]. Similarly, the U.S. Food and Drug Administration (FDA) strictly limits the types of PAEs permitted in food contact applications [24]. These differences highlight the critical need for exposure and risk assessments within specific local contexts, particularly for regionally important foods like Baijiu in China.
Despite its significance, data on PAE contamination in Baijiu remain limited, which severely constrains the accuracy of region-specific risk assessments. While earlier studies have confirmed the presence of PAEs in Baijiu [10], their data are outdated and do not reflect current practices or regional specifics, especially in major producing areas like Sichuan Province. The absence of contemporary, locally-representative contamination profiles means that existing risk assessments either rely on extrapolated data or produce only generic, national-level estimates. Such approaches fail to capture the unique exposure scenarios shaped by local production practices, consumption habits, and regulatory enforcement, leading to potential over- or under-estimation of health risks for the local population.
To address this question, this study introduces a specific exposure assessment approach. First, we adjusted the TDI of key PAEs specifically to Baijiu consumption, based on its documented contribution to total dietary exposure. This refined model enables a direct and realistic estimation of exposure attributable to Baijiu, moving beyond generic dietary assessments to provide a targeted risk evaluation that reflects actual consumption patterns in Sichuan. Therefore, the objectives of this study are to: (1) determine the concentrations of major PAEs in Baijiu commercially available in Sichuan; (2) estimate the dietary exposure to PAEs specifically attributable to Baijiu consumption among the Sichuan population; and (3) assess the potential health risks, with emphasis on endocrinerelated endpoints, posed by Baijiu exposure. This work aims to provide the first comprehensive, quantitative risk assessment of PAE exposure via Baijiu that is explicitly tailored to a specific region. The findings are expected to generate crucial scientific evidence to support targeted monitoring, regionally-adapted regulatory strategies, and precise public health communication for this culturally significant beverage, thereby addressing a clear and important gap in food safety research of Sichuan Province.
A total of 181 Baijiu samples were collected in 2023 from six major producing cities within the Sichuan Basin: Chengdu, Deyang, Luzhou, Mianyang, Suining, and Yibin. The sample types included in bulk samples and packed samples. Trained investigators bought Baijiu from local grocery stores, supermarkets, online stores and liquor manufacturers. The collected samples were promptly transported to the laboratory and stored in a cool environment to preserve until chemical analysis could be conducted.
A total of 18 kinds of PAEs were detected in liquor, including Dimethyl phthalate (DMP), diethyl phthalate (DEP), diallyl phthalate (DAP), diisobutyl phthalate (DIBP), di-n-butyl phthalate (DBP), di-(2-methoxy) ethyl phthalate (DMEP), di-phthalate (4-methyl-2-amyl) ester (BMPP), O-phthalate Di-(2-ethoxy) ethyl phthalate (DEEP), diamyl phthalate (DPP), dihexyl phthalate (DHXP), butyl benzyl phthalate (BBP), di-cyclohexyl phthalate (2-butoxy) ethyl phthalate (DBEP), dicyclohexyl phthalate (DCHP), di-(2-ethyl) phthalate (DEHP), Diphenyl phthalate (DPhP), di-n-octyl phthalate (DNOP), di-isononyl phthalate (DINP), and di-nononyl phthalate (DNP).
The analysis was performed using gas chromatography-mass spectrometry (GC-MS) with an external standard method, based on Chinese National Food Safety Standards for foods [25, 26, 27] with modifications.
Briefly, standard solutions were prepared by diluting a mixed intermediate
solution of 18 PAEs in n-hexane. For quantification, a suite of deuterated
internal standards (ISTDs) was employed: D4-DMP, D4-DBP, and D4-DEEP, each at a
concentration of 10 µg mL-1. These ISTDs were selected based on their
structural analogy and chromatographic behavior to represent different subgroups
of the target PAEs: D4-DMP for short-chain dimethyl phthalate, D4-DBP for
mid-chain dibutyl phthalate and its isomers (e.g., DIBP), and D4-DEEP for
high-molecular-weight phthalates such as DEHP, DINP, and DIDP. This approach
allows for effective correction of matrix effects and instrumental variability
across the entire analyte range. Calibration standards contained these ISTDs at
0.5 µg mL-1 (D4-DINP at 5.0 µg mL-1 to match its higher
typical concentration), with working ranges of 0.1–10 µg mL-1 for
DINP/DIDP and 0.01–1.0 µg mL-1 for other PAEs. A fresh calibration
curve was established prior to each batch of sample analysis, requiring the
relative standard deviation (RSD) of the relative response factors for all
calibration points to be
For sample preparation, 2.0 mL of Baijiu sample was transferred into a 10 mL
glass tube. After spiking with 100 µL of internal standard solution, the
ethanol content was adjusted to 20% (v/v) with ultrapure water to control matrix
effects. Liquid-liquid extraction was then performed by adding 2 mL of toluene,
followed by vortex mixing for 3 min and centrifugation at 3000 r/min for 5 min.
The organic phase was analyzed using a GC-MS/MS system (Agilent 7890A - 7000B)
equipped with a DB-5ms UI column (30 m
The detection of PAEs was conducted at reference laboratories for China’s national food safety risk monitoring system. This system operates under the Food Safety Law of China, with the National Health Commission (NHC) taking the lead in organizing the implementation of national monitoring plans. The technical execution, including food contamination monitoring and dietary exposure surveys, is primarily carried out by the China National Center for Food Safety Risk Assessment (CFSA) and the nationwide network of Centers for Disease Control and Prevention (CDC) at various levels (provincial, municipal, county). All personnel were trained, and all laboratories followed a unified analytical protocol before commencing analysis. Each batch of samples was analyzed alongside quality control (QC) samples, and formal sample testing began only after the QC data met predefined acceptance criteria. Any result that exceeded the corresponding regulatory limit was retested, and only the confirmed qualified data were used for the risk assessment. All procedures, including sample pretreatment, instrumental analysis, and standard preparation, were performed according to documented standard operating procedures (SOPs). Comprehensive quality assurance measures were implemented throughout the analytical process. Procedural blanks and reagent blanks were processed with each batch of samples (maximum 20 samples per batch) to monitor and account for any background contamination. All target PAEs in blank samples were confirmed to be below the method limits of detection (LODs). The accuracy and precision of the method were evaluated through matrix spike recovery experiments. Baijiu samples were spiked with standard solutions at low, medium, and high concentration levels (n = 6). The average recoveries for all target compounds ranged from 80% to 120%, with intra-day and inter-day relative standard deviations (RSDs) below 10%. The LODs were 0.3 mg kg-1 for DBP, 9.0 mg kg-1 for DINP, and the other 16 target compounds were 0.5 mg kg-1. The limits of quantification (LOQ) were defined as 3.3 times the LOD for each compound.
According to the recommended procedure of “Reliable Evaluation of Low Level Pollutants in Food” issued by the World Health Organization (WHO), if the proportion of non-detected (ND) results is less than 60%, all the undetected value are substituted for 1/2 LOD; If the proportion greater than 60%, 0 and LOD values are substituted for the undetected value in statistical calculation [28]. In this study, for the purpose of statistical analysis, concentrations between the LOD and LOQ were treated as non-detects.
Food consumption data were obtained from the China Nutrition and Health Surveillance 2022 project. This nationwide cross-sectional study, led by the National Health Commission of the People’s Republic of China, targeted children, adolescents, adults, pregnant women, and lactating women. Data on nutrition and health indicators were collected from the Chinese population through interviews, physical examinations, laboratory tests, and dietary surveys. The study employed a multistage, stratified, systematic, clustered random sampling design across all 31 provincial-level administrative divisions in mainland China, with a total of 200 survey sites randomly selected nationwide.
Sichuan Province was one of the 31 survey sites included in the study, and the Baijiu consumption data were sourced from this region (Table 1). Ten counties and cities in Sichuan Province were selected, and the sample encompassed residents aged 18 years or older. The sample was representative in terms of urban–rural distribution and geographical region. Data were systematically collected by professionally trained investigators. All participants provided written informed consent prior to their voluntary engagement in the survey. Briefly, Baijiu consumption was assessed through face-to-face interviews using a structured food frequency questionnaire (FFQ). The study involved 5472 permanent residents of Sichuan Province (2608 males and 2864 females). Participants completed the FFQ, which included detailed questions on their Baijiu consumption patterns over the preceding 12 months. They were asked to recall both the frequency (times per day, week, month, or year) and the average quantity (in milliliters, mL) of Baijiu consumed per occasion. For exposure assessment, the reported volume was converted to mass (grams) using the typical density of Baijiu, and the alcohol content was not used as a conversion factor, as the risk assessment focused on the chemical contaminants in the beverage matrix itself, not on the effects of ethanol. Trained investigators concurrently collected demographic and anthropometric data (e.g., age, gender, body weight) using standardized questionnaires during the interviews.
| Gender-Age group | N | BW (Kg) | Consumption (g/per day) | |||
| Mean | P50 | P95 | Max | |||
| Female (18 |
2021 | 58.21 | 2.98 | 0.00 | 10.00 | 500.00 |
| Male (18 |
1768 | 67.29 | 12.96 | 0.00 | 85.71 | 500.00 |
| Female (over 59 years old) | 843 | 55.30 | 3.09 | 0.00 | 7.31 | 300.00 |
| Male (over 59 years old) | 840 | 61.53 | 18.35 | 0.00 | 100.00 | 600.00 |
| Overall adults | 5472 | 61.21 | 8.58 | 0.00 | 50.00 | 600.00 |
The tolerable daily intakes (TDIs) for DBP (0.01 mg kg–1 bw d–1), BBP (0.5 mg kg–1 bw d–1), and DEHP (0.05 mg kg–1 bw d–1) were derived by the European Food Safety Authority (EFSA) based on a review of the literature, which focused primarily on their reproductive effects [22]. For DINP, EFSA established an individual TDI of 0.15 mg kg–1 bw d–1 in its 2005 evaluation, based on hepatic effects. Subsequently, EFSA grouped DBP, BBP, DEHP, and DINP for a cumulative assessment, assigning relative potency factors with DEHP as the reference substance to derive a group-TDI of 0.05 mg kg–1 bw d–1 [22]. For DIBP and DMP, the Threshold of Toxicological Concern (TTC) approach was applied. Using the Cramer structural classification, both compounds were assigned to Class I, which corresponds to a TTC value of 0.03 mg kg–1 bw d–1 [29].
The daily intake of each PAE for each individual was calculated by multiplying
their individual consumption data by the corresponding mean PAE concentration.
From the distribution of these estimated individual exposures across all
participants, the mean, 50th percentile (P50), 95th percentile (P95), and maximum
exposure levels were derived for the overall adult population and for each
demographic subgroup: females (18–59 years), males (18–59 years), females
(
The equation was as follows:
where EXPᵢ is the estimated daily intake of PAEs for consumer i (µg kg–1 bw d–1); C is the mean concentration of a given PAE in Baijiu (mg kg–1); Fᵢ is the daily Baijiu consumption for consumer i (g d–1); and BWᵢ is the body weight of consumer i (kg).
Based on their similar reproductive effects, EFSA grouped DBP, BBP, DEHP, and DINP for a cumulative assessment. Relative potency factors (RPFs) were allocated using DEHP as the reference substance to derive a group-TDI [22]. Accordingly, the aggregated dietary exposure to these phthalates was calculated by incorporating their respective RPFs, using the following equation:
Where EXPm is the cumulative PAEs intake adjusted by the RPFs (µg kg-1 bw d-1); EXPi is the estimated intake of phthalate i (µg kg-1 bw d-1); and RPFi is the RPF for phthalate i. Using DEHP as the reference substance, the RPFs for DEHP, DBP, BBP and DINP are 1, 5, 0.1 and 0.3, respectively [22].
The hazard quotient (HQ) for each PAE from Baijiu was calculated by dividing the estimated daily intake (EXP) by its corresponding TDI. The cumulative risk from exposure to multiple PAEs was assessed using the hazard index (HI) method. The HQ and HI were calculated as follows:
Where EXPi is the estimated daily intake of the i-th type of PAEs
(µg kg-1 bw d-1), and
A total of 181 Baijiu samples were analyzed for 18 PAEs. Five compounds were detected: DBP, DIBP, DMP, DEHP, and BBP. Their detection frequencies (positive rates) were 75.69%, 40.33%, 20.44%, 11.05%, and 8.29%, respectively. The concentrations of PAEs across the 181 samples ranged from not detected (ND) to 10.30 mg kg-1. DBP exhibited the highest mean concentration at 0.44 mg kg-1, while BBP showed the lowest at 0.04 mg kg-1. The mean concentrations of DEHP, DIBP, and DMP were all below 0.2 mg kg-1 (Table 2).
| PAEs | Samples | Positive samples | Content (mg kg-1)a | |||
| N | N (%) | Mean (95% confidence interval for mean) | P50 | P95 | Range | |
| DEHP | 181 | 20 (11.05) | 0.03 (0.02–0.03) | 0.02 | 0.04 | NDb–0.21 |
| DBP | 137 (75.69) | 0.44 (0.27–0.61) | 0.09 | 1.57 | ND–10.30 | |
| DIBP | 73 (40.33) | 0.12 (0.06–0.19) | 0.02 | 0.40 | ND–5.38 | |
| DMP | 37 (20.44) | 0.08 (0.03–0.13) | 0.02 | 0.26 | ND–4.10 | |
| BBP | 15 (8.29) | 0.04 (0.03–0.06) | 0.02 | 0.17 | ND–0.65 | |
a PAEs content were calculated as LOD when PAEs levels were below the LOD;
b ND, Not detected.
PAEs, phthalates; DEHP, di-(2-ethyl) phthalate; DBP, di-n-butyl phthalate; DIBP, diisobutyl phthalate; DMP, dimethyl phthalate; BBP, butyl benzyl phthalate; LOD, limits of detection.
For a more detailed analysis, samples were classified by packaging type (bulk
vs. bag). The occurrence of PAEs was compared between these two categories. No
statistically significant difference in PAE contamination was found between
bulk-packed and bag-packed samples (
| Packing types | Parameter | DEHP | DBP | BBP | DIBP | DMP |
| In bags | Percentages, N (%)a | 10 (11.11) | 64 (71.11) | 9 (10.00) | 44 (48.89) | 18 (20.00) |
| Meanb, (mg kg-1) | 0.025 | 0.208 | 0.056 | 0.153 | 0.055 | |
| 95% Confidence Interval for Mean | 0.020–0.030 | 0.135–0.281 | 0.030–0.081 | 0.028–0.278 | 0.029–0.081 | |
| P50b, (mg kg-1) | 0.020 | 0.064 | 0.020 | 0.020 | 0.020 | |
| Range (mg kg-1) | NDc–0.210 | ND–2.210 | ND–0.650 | ND–5.380 | ND–0.810 | |
| In bulk | Percentages, N (%) | 10 (10.99) | 73 (80.22) | 6 (6.60) | 29 (31.87) | 19 (20.88) |
| Mean (mg kg-1) | 0.025 | 0.670 | 0.030 | 0.089 | 0.107 | |
| 95% Confidence Interval for Mean | 0.021–0.030 | 0.340–1.000 | 0.021–0.038 | 0.044–0.134 | 0.014–0.199 | |
| P50 (mg kg-1) | 0.020 | 0.170 | 0.020 | 0.020 | 0.020 | |
| Range (mg kg-1) | ND–0.140 | ND–10.300 | ND–0.240 | ND–1.660 | ND–4.100 | |
| χ2 | _ | 0.355 | ||||
| p | _ | 0.551 | ||||
a Number and percentage of contaminated samples above LOD.
b Mean and P50 values are calculated as LOD when PAEs levels were below the LOD.
c ND, Not detected.
Samples were further classified by sampling site into three categories: local
grocery stores (including affiliated online stores), supermarkets, and liquor
production enterprises/workshops. The highest detection frequencies for most PAEs
were observed in samples from local grocery stores (including their online
channels), with the exception of DMP (Table 4). However, a chi-square test
revealed no statistically significant difference in PAE occurrence across these
site categories (
| Sampling sites | Parameter | DEHP | DBP | BBP | DIBP | DMP |
| Local grocery store or online store | Percentages (%), N (%)a | 3 (12.00) | 23 (92.00) | 3 (12.00) | 9 (36.00) | 5 (20.00) |
| Meanb, (mg kg-1) | 0.027 | 0.502 | 0.040 | 0.121 | 0.228 | |
| 95% Confidence Interval for Mean | 0.016–0.038 | 0.228–0.775 | 0.169–0.062 | 0.015–0.257 | 0.113–0.568 | |
| P50b, (mg kg-1) | 0.020 | 0.290 | 0.020 | 0.020 | 0.020 | |
| Range (mg kg-1) | NDc–0.140 | ND–3.040 | ND–0.220 | ND–1.660 | ND–4.100 | |
| Supermarket | Percentages, N (%) | 14 (11.38) | 91 (73.98) | 9 (7.32) | 53 (43.09) | 26 (21.14) |
| Mean (mg kg-1) | 0.024 | 0.423 | 0.046 | 0.140 | 0.059 | |
| 95% Confidence Interval for Mean | 0.021–0.028 | 0.210–0.635 | 0.027–0.065 | 0.047–0.233 | 0.036–0.082 | |
| P50 (mg kg-1) | 0.020 | 0.090 | 0.020 | 0.020 | 0.020 | |
| Range (mg kg-1) | ND–0.210 | ND–10.300 | ND–0.650 | ND–5.380 | ND–0.810 | |
| Liquor production enterprises or workshops | Percentages, N (%) | 3 (9.10) | 23 (69.70) | 3 (9.10) | 11 (33.33) | 6 (18.18) |
| Mean (mg kg-1) | 0.027 | 0.457 | 0.032 | 0.051 | 0.053 | |
| 95% Confidence Interval for Mean | 0.017–0.036 | 0.043–0.957 | 0.016–0.047 | 0.027–0.007 | 0.024–0.082 | |
| P50 (mg kg-1) | 0.020 | 0.057 | 0.020 | 0.020 | 0.020 | |
| Range (mg kg-1) | ND–0.150 | ND–8.040 | ND–0.240 | ND–0.260 | ND–0.330 | |
| χ2 | _ | 1.115 | ||||
| p | _ | 0.573 | ||||
a Number and percentage of contaminated samples above LOD;
b Mean and P50 values were calculated as LOD when PAEs levels were below the LOD;
c ND, Not detected.
Considering the relatively high PAE levels in these samples and the completeness
of their toxicological data, the average daily intake of DEHP, DBP, BBP, DINP,
DIBP, and DMP from Baijiu consumption was estimated for the general adult
population (
| PAEs | Intake (µg kg-1 bw d-1)a | %TDI/TTCb | %TDI/TTCc | |||
| Mean | P50 | P95 | Max | |||
| DEHP | 0.003 | 0.000 | 0.021 | 0.268 | 0.007 | 0.042 |
| DBP | 0.061 | 0.000 | 0.366 | 4.697 | 0.606 | 3.663 |
| BBP | 0.003 | 0.000 | 0.021 | 0.268 | 0.001 | 0.004 |
| DINP | 0.028 | 0.000 | 0.166 | 2.135 | 0.018 | 1.423 |
| DIBP | 0.017 | 0.000 | 0.101 | 1.291 | 0.056 | 0.336 |
| DMP | 0.011 | 0.000 | 0.068 | 0.866 | 0.037 | 0.225 |
a PAEs intake was calculated by multiplying individual consumption data with corresponding mean concentrations (undetected values were replaced by LOD);
b %TDI was the percentage of mean intake to TDI/TTC (DEHP: 50 µg kg-1 bw d-1; DBP: 10 µg kg-1 bw d-1; BBP: 500 µg kg-1 bw d-1; DINP: 150 µg kg-1 bw d-1; DIBP and DMP: 30 µg kg-1 bw d-1);
c %TDI/TTC was the percentage of P95 intake to TDI/TTC.
TDI, tolerable daily intake; TTC, Threshold of Toxicological Concern.
Specifically, for DEHP, the mean and 95th percentile (P95) exposures were 0.003 and 0.021 µg kg–1 bw d–1, representing only 0.007% and 0.042% of its tolerable daily intake (TDI of 50 µg kg–1 bw d–1). Similar low-level exposures were observed for DBP (0.061 and 0.366 µg kg–1 bw d–1, accounting for 0.606 and 3.663% of its TDI of 10 µg kg–1 bw d–1) and BBP (0.003 and 0.021 µg kg–1 bw d–1, representing 0.001 and 0.004% of its TDI of 500 µg kg–1 bw d–1).
Notably, DINP was not detected in any samples, with estimated exposures below the limit of detection. For DIBP and DMP, which were assessed using the threshold of toxicological concern (TTC of 30 µg kg–1 bw d–1), exposures were also extremely low (0.017–0.101 and 0.011–0.068 µg kg–1 bw d–1, respectively), constituting less than 0.34% of the TTC.
Demographic analysis showed consistent trends across all compounds. The highest
exposures occurred in men aged
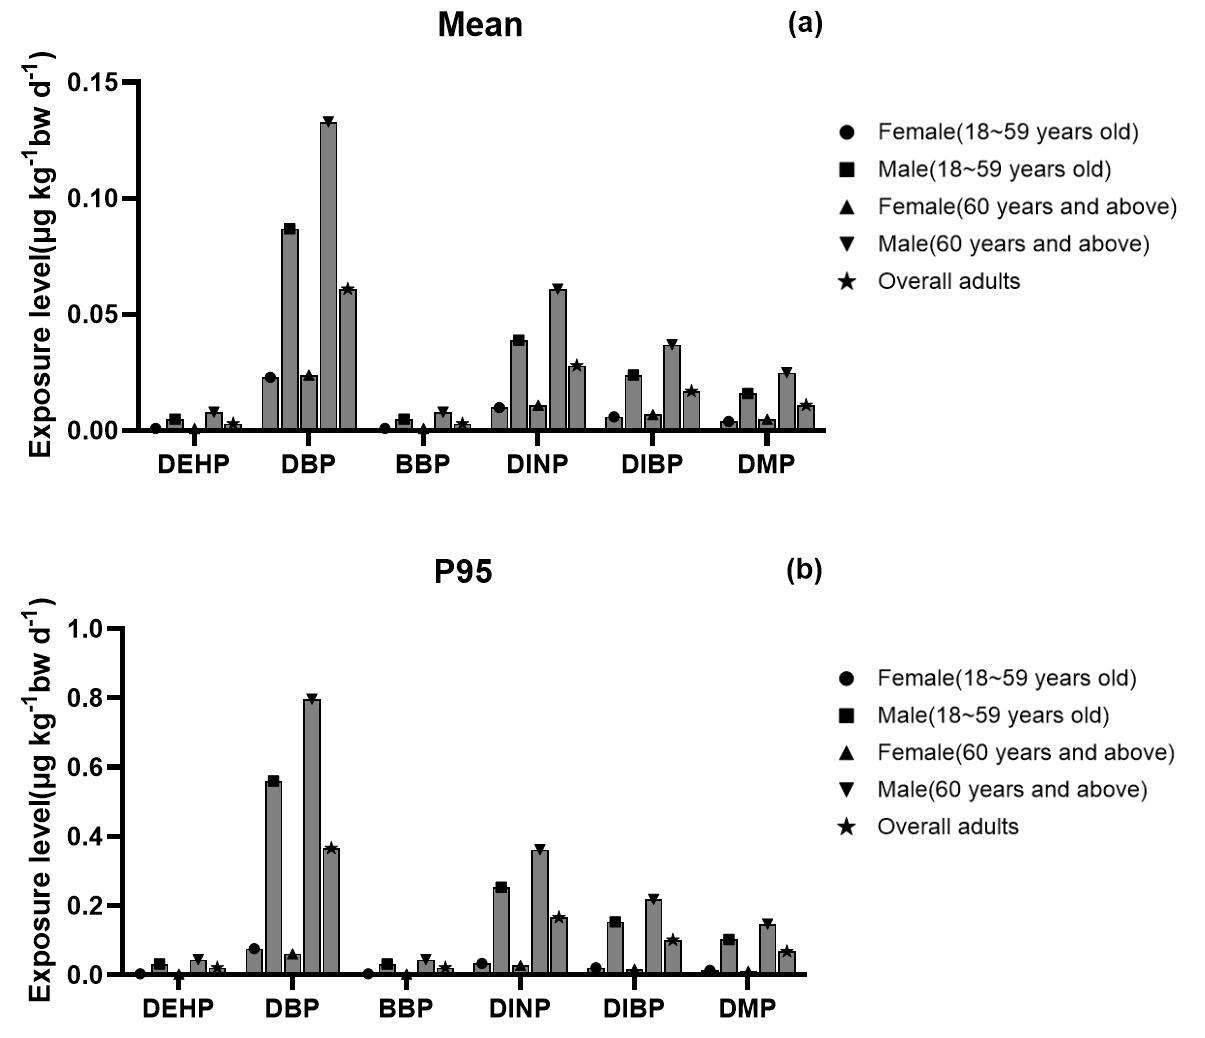 Fig. 1.
Dietary exposure to PAEs from Baijiu among different demographic groups in Sichuan Province. (a) Mean exposure levels of PAEs across demographic groups; (b) 95th percentile (P95) exposure levels of PAEs across demographic groups. PAEs, phthalates.
3.3.2.1 HI Method
A comprehensive risk assessment for the six PAEs was conducted using the HI
method. This included the four PAEs with established reproductive toxicity (DEHP,
DBP, BBP, DINP) as well as DIBP and DMP. The results demonstrated that both the
mean and 95th percentile (P95) HI values for cumulative exposure to these six
PAEs remained below the safety threshold of 1 across all demographic groups
studied (Table 6). Specifically, the highest mean HI value (0.016) was observed
in males aged
| Group | N | HI | Consumers of HI | |||
| Mean | P50 | P95 | Max | |||
| Female (18 |
2021 | 0.003 | 0.000 | 0.009 | 0.442 | 0 |
| Male (18 |
1768 | 0.010 | 0.000 | 0.067 | 0.524 | 0 |
| Female (60 years and above) | 843 | 0.003 | 0.000 | 0.007 | 0.258 | 0 |
| Male (60 years and above) | 840 | 0.016 | 0.000 | 0.095 | 0.562 | 0 |
| Overall adults | 5472 | 0.007 | 0.000 | 0.044 | 0.562 | 0 |
HI, hazard index.
3.3.2.2 Relative Potency Factors (RPF) Method
Due to their shared reproductive toxicity endpoint, the cumulative exposure to
DEHP, DBP, BBP, and DINP was assessed. As DINP was not detected in any sample,
its exposure was estimated by substituting the limit of detection (LOD) for
non-detect values. The mean and 95th percentile (P95) cumulative exposure levels
for these four PAEs were 0.315 µg kg-1 bw d-1 and 1.904 µg
kg-1 bw d-1, respectively (Table 7). These values are substantially
below the group-TDI of 50 µg kg-1 bw d-1, representing only
0.631% and 3.808% of this threshold. Demographically, the highest mean
cumulative exposure was observed in males aged
| Group | PAEs intake (µg kg-1 bw d-1)a | %Group-TDI b | %Group-TDI c | |||
| Mean | P50 | P95 | Max | |||
| Female (18 |
0.118 | 0.000 | 0.394 | 19.222 | 0.237 | 0.787 |
| Male (18 |
0.451 | 0.000 | 2.910 | 22.783 | 0.902 | 5.819 |
| Female (60 years and above) | 0.127 | 0.000 | 0.315 | 11.213 | 0.254 | 0.630 |
| Male (60 years and above) | 0.692 | 0.000 | 4.145 | 24.420 | 1.384 | 8.289 |
| Overall adults | 0.315 | 0.000 | 1.904 | 24.420 | 0.631 | 3.808 |
a Group Phthalates exposure expressed as DEHP equivalents (µg
kg-1 bw d-1) = DEHP
b %Group-TDI was the percentage of mean PAEs intake to TDI (50 µg kg-1 bw d-1);
c %Group-TDI was the percentage of P95 PAEs intake to TDI (50 µg kg-1 bw d-1).
However, these results must be interpreted with caution, as they reflect exposure solely from Baijiu and do not account for contributions from other dietary sources. Hence, a comparative analysis with existing literature—which often reports PAEs total dietary exposures—will be presented in the following paragraph to contextualize our findings within the overall exposure scenario.
3.3.2.3 A Specific Adjusted Group-TDI Method
However, single-source assessment does not fully capture cumulative total dietary risk. Baijiu-derived PAEs to total dietary PAE exposure and the corresponding health risk assessment results were accounted. Based on established total dietary exposure estimates [10, 22], the total dietary exposure levels of PAEs were as follows: DEHP (2.23 µg kg-1 bw d-1), DBP (2.35 µg kg-1 bw d-1), BBP (1.00 µg kg-1 bw d-1), and DINP (1.81 µg kg-1 bw d-1). Thus, the single exposure contribution rates of DEHP, DBP, BBP, and DINP from Baijiu were calculated to be 0.16%, 2.58%, 0.35%, and 1.52%, respectively, with a cumulative exposure contribution rate of 2.16%. By reallocating the TDI based on these contributions, adjusted TDIs for DEHP, DBP, BBP, and DINP were determined to be 0.07, 0.26, 1.73, and 2.28 µg kg-1 bw d-1, respectively. The adjusted group-TDI value was calculated as 1.08 µg kg-1 bw d-1. Consequently, the mean (0.315 µg kg-1 bw d-1) and P95 (1.904 µg kg-1 bw d-1) exposures from Baijiu represented 29.25% and 176.63% of this adjusted group-TDI, respectively. This indicates a potential risk for high-consumption individuals, underscoring the importance of moderate alcohol intake.
Ensuring the safety of Baijiu is of paramount importance, as it safeguards both consumer health and industry interests. Previous reports indicate that several Baijiu products have contained PAE levels exceeding the national standard [31]. Given that prior risk assessments were conducted approximately a decade ago [10], evolving economic conditions and industrial practices necessitate a contemporary reevaluation. Therefore, this study investigates current PAE levels in Baijiu and assesses the associated health risks for consumers.
In this survey, DBP was identified as the predominant contaminant, with a maximum concentration of 0.44 mg kg–1 and a detection rate of 75.69%, followed by DIBP, DMP, and BBP. Notably, contamination levels were generally lower than those reported in earlier studies [19, 32], a trend likely attributable to increasingly stringent regulations (e.g., GB 9685-2016) and improved production practices.
These findings suggest that while recent measures have reduced overall PAE levels, DBP concentrations remain notably high. The subsequent dietary exposure assessment, considering Baijiu as a single source, revealed that both mean and 95th percentile (P95) exposures for adults in Sichuan Province did not exceed respective health guidance values [22]. Furthermore, cumulative exposure assessment indicates via the HI was much less than 1. A more precise assessment using the group-TDI (50 µg kg-1 bw d-1) based on common reproductive toxicity endpoints [22] confirmed that the relative potency factor (RPF)-adjusted cumulative mean and P95 values were significantly lower than this threshold.
However, this single-source assessment does not fully capture cumulative total dietary risk. To place the exposure from Baijiu into a more realistic context, we employed established total dietary exposure estimates for major PAEs [10, 22]. Within this total diet framework, the relative contribution of Baijiu was found to be modest. However, a more refined, source-adjusted risk assessment was conducted by proportionally allocating the health-based guidance value (group-TDI) according to this contribution. This approach yielded a Baijiu-specific safety threshold. The comparison with this refined threshold elucidates a notable finding: while the average exposure from Baijiu remains well within safety limits, the exposure level for high-consumption individuals (95th percentile) exceeds this context-specific benchmark. This divergence underscores that the risk profile is not uniform across the population. The primary public health implication of this analysis is that for the majority of consumers, Baijiu poses a negligible risk from a PAE exposure standpoint. Conversely, for the high-intake subgroup, Baijiu consumption can become a contributing factor of concern within their total dietary PAE burden.
These results yield to two critical implications. First, the observed decline in contamination levels likely reflect positive outcomes from regulatory and industrial actions, though persistently high DBP warrants continued attention. Second, and more importantly, this analysis highlights the necessity of a cumulative exposure perspective. Even with a low aggregate contribution, Baijiu can become a significant risk factor for high-consumption individuals when combined with exposure from other foods. This finding validates that single sources assessments are insufficient for comprehensive risk evaluation and reinforces the need for future research to incorporate human biomonitoring to accurately quantify total internal exposure. Therefore, we recommend a comprehensive nationwide survey and consideration of adjustments to current DBP limits in food-contact materials (GB9685-2016), with particular emphasis on protecting high-consumption subgroups.
This study investigated PAE levels in both bulk and packaged Baijiu samples from diverse locations. However, no significant differences were found between bulk and bag packaging, or across different sampling locations, indicating a remarkable homogeneity in PAE contamination. This observed uniformity can be attributed to three interconnected factors that create a comprehensive contamination pathway throughout the product lifecycle. First, geographically concentrated production in the Sichuan Basin creates a uniform environmental exposure background, leading to similar baseline contamination from air, water, and soil [33, 34]. Second, PAE contamination occurs consistently across production stages: raw materials are exposed during cultivation [35], processing equipment introduces PAEs during brewing, and shared plastic components in packaging contribute further [36]. Third, due to their high solubility in ethanol [37, 38], PAEs likely reach migration equilibrium during storage, leading to homogeneous distribution regardless of initial packaging. This analysis not only explains our specific findings but also highlights a systemic challenge: effective risk mitigation requires integrated control measures addressing all potential exposure points from raw material to final product, rather than focusing solely on a single stage like final packaging.
This study has certain methodological limitations. The refined risk assessment relied on external estimates for total dietary PAE exposure, which introduces uncertainty into the adjusted TDI values. Additionally, the geographical scope was confined to Sichuan Province. While this focus addresses a key regional data gap, the findings may lack national representativeness. Future work would therefore benefit from a national-scale survey to enable a comprehensive assessment.
This study analyzed 18 PAEs in Baijiu, detecting five compounds: DBP, DEHP, DIBP, BBP, and DMP. DBP was identified as the most prevalent contaminant. Although overall contamination levels were lower than historical reports, the persistent prominence of DBP is noteworthy. Dietary exposure to PAEs from Baijiu alone was within safe limits for the general population. However, a conservative assessment that accounts for Baijiu’s contribution to total dietary exposure, using an adjusted group-TDI, suggests a potential risk for high consumers (95th percentile). Given DBP’s endocrine-disrupting properties [39], these findings underscore the need to revise the specific migration limits for DBP in China’s food contact material regulations (e.g., GB 9685-2016) and to strengthen contamination control measures through the production chain.
All data generated or analyzed during this study are included in this published article. Any supplementary datasets are available from the corresponding author upon reasonable request.
BZ, YS, and MM designed the research study. YS and MM performed the research. LL and YX provided help and advice on the experiments. YX analyzed the data. BZ drafted the manuscript. All authors contributed to critical revision of the manuscript for important intellectual content. All authors read and approved the final manuscript. All authors have participated sufficiently in the work and agreed to be accountable for all aspects of the work.
This study did not require formal ethics committee approval as it did not involve sensitive topics, collection of identifiable personal data, or clinical interventions. All participants provided written informed consent prior to their involvement in the study.
We thank the participants of this study and the laboratories that performed the analytical work.
This research received no external funding.
The authors declare no conflict of interest.
References
Publisher’s Note: IMR Press stays neutral with regard to jurisdictional claims in published maps and institutional affiliations.