
- Academic Editor
Background: The impact of
polycystic ovary syndrome (PCOS) on endometrial receptivity
and embryo quality is a subject of debate. Different PCOS patient types may
exhibit different effects on these factors. This study aimed
to identify causes for low live birth rate by comparing endometrial receptivity
and embryo quality among different PCOS types. Methods: Overall, a total of 767 PCOS patients with first in vitro fertilization (IVF)/intracytoplasmic sperm
injection (ICSI) treatment classified into phenotype A (n =
167 patients) and phenotype D (n = 600
patients) were eligible for analysis. Patients with single
polycystic ovary (n = 406 patients) served as a control group
to exclude the advantages of clinical outcome from higher number of oocytes
retrieved in women with PCOS. Results: In phenotype A
and D, Anti-Müllerian hormone (AMH), antral follicle count
(AFC) and basic estradiol were significantly higher compared to
single polycystic ovary. However,
estradiol, progestin and endometrial thickness on the human chorionic
gonadotropin (hCG) day were significantly decreased. In fresh
cycles, phenotype A had a significant statistical decrease in the live birth rate
compared with single polycystic ovary (35/78 [44.87%]
vs. 135/233 [57.94%], p
Polycystic Ovary Syndrome (PCOS), also known as a metabolic reproductive syndrome, is the most prevalent endocrine disorder among women of reproductive age [1]. The prevalence of PCOS in reproductive age women ranges widely from 4% to 21%; the syndrome is characterized by oligo or anovulation, clinical and/or biochemical signs of hyperandrogenism and polycystic ovaries [2, 3].
Women with PCOS had a higher rate of spontaneous abortion compared with women without PCOS undergoing assisted reproductive treatment (ART) [4]. The hyper androgenic milieu affects the expression of insulin-signaling factors and glucose transporters in the endometrium of patients with PCOS [5]. Insulin resistance (IR) is prevalent in PCOS patients, particularly those with obesity and hyperinsulinemia. Systemic IR, hyperinsulinemia, obesity, and inflammation can aggravate the IR degree of target tissues, destroy endometrial energy homeostasis, and affect the expression of gene expression profiles associated with decidualization and endometrial receptivity [6].
Moreover, embryos of patients with PCOS had a lower developmental potential and a higher rate of cell cycle arrest than patients without PCOS. Lu et al. [7] found that embryos took longer to reach the four-cell stage in PCOS patients when examined using a time-lapse system. It was observed that oocytes with PCOS had higher consumptions of nicotinamide adenine dinucleotide phosphate (NADPH) content, glucose and pyruvate, indicating increased reactive oxygen species production [8]. Lu et al. [7] observed significant down-regulation of genes related to oxidative phosphorylation, cellular biosynthesis and metabolic processes in PCOS arrested embryos. They also noted up-regulation of lipopolysaccharide (LPS) biosynthesis and glutamate catabolism compared to control embryos [7]. Those might associate with the early developmental arrest in embryos of PCOS patients.
In the PCOS group, the number of oocytes retrieved and the live birth rate remained unchanged. Additionally, older women with PCOS had a higher cumulative live birth rate (CLBR) over two years compared to age- and body mass index (BMI)-matched counterparts without PCOS [9]. In comparison to age- and BMI-matched women without PCOS, patients exhibited a better oocyte reserve and had more available embryos. This phenomenon helped overcome compromised oocyte quality, especially in older PCOS patients [9].
The risk of ovarian hyperstimulation syndrome could be reduced by frozen embryo transfer, while the live-birth rate among ovulatory women with infertility was not significantly different between fresh-embryo transfer and frozen-embryo transfer [10]. According to multivariate logistic regression analysis, the polycystic ovarian morphology did not affect CLBR [11]. In anovulatory women with PCOS, elective frozen-embryo transfer has been shown to lead to a higher live-birth rate than fresh-embryo transfer [12]. Yang et al. [13] evaluated the pregnancy outcome of patients with PCOS undergoing in vitro fertilization and embryo transfer (IVF-ET) predicted by the follicular output rate (FORT). FORT is a powerful tool for measuring ovarian reactivity. A high FORT can achieve better pregnancy outcome owing to high-quality embryos and frozen embryo transfer [13].
There has been debate on whether PCOS affects patients’ endometrial receptivity or embryo quality. PCOS was classified into four types based on the 2003 Rotterdam consensus [14, 15]; varying outcomes for IVF-ET may be observed among these different types. The study result might be biased because patients with PCOS phenotype B had insufficient oocyte reserve, leading to a notable decrease in CLBR. Hence, PCOS patients classified into four phenotypes were analyzed to identify potential causes for the low live birth rate, by comparing endometrial receptivity and embryo quality. Additionally, we conducted a detailed comparison between live births and non-live births in fresh cycles, analyzing the potential factors influencing live births among women with PCOS.
Patients
All patients used standard
gonadotropin-releasing hormone (GnRH) agonist protocol or GnRH
antagonist protocol. Patients following the GnRH agonist protocol received
intramuscular injections of
gonadotropin-releasing hormone analogue
(H20030578, Ipsen Pharma Biotech, Signes, France) from the mid-luteal phase.
Once downregulation was achieved, patients
commenced treatment with recombinant follicle-stimulating
hormone (FSH) (JS20160044, Merck Serono
S.p.A., Modugno, Apulia, Italy) to promote ovulation. The GnRH antagonist
protocol commenced with recombinant FSH
(JS20160044, Merck Serono S.p.A., Modugno, Apulia, Italy) at 100–150 U, with the
dose adjusted according to the follicle growth measured by vaginal B ultrasound.
Human menopausal
gonadotrophin (HMG) (H10940097, Lizhu Pharmaceutical Trading
Co., Zhuhai, China) was used to promote ovulation in the middle and late stage of
follicles. Patients were given GnRH
antagonist (H20050128, Baxter Oncology GmbH, Halle, Saxony-Anhalt, Germany) at a
dose of 0.25 mg daily when the dominant follicle reached 12 mm in diameter.
At the clinician’s discretion, the administration of
5000–10,000 IU human chorionic gonadotropin (hCG) (H44020672,
Lizhu Pharmaceutical Trading Co., Zhuhai, China) was used to trigger the ovary as
soon as one-third of all follicles reached a diameter of
IVF/ICSI was carried
out at 3–4 h after oocytes retrieval, and
fertilization methods were performed depending on sperm parameters.
IVF was performed by 30 to 50 µL micro droplets at 1 to
2 oocytes per drop with a concentration of 200,000 sperm per
milliliter.
The granule cells surrounding the oocytes were then removed from 4 to 6 h after
fertilization. The evidence of fertilization was evaluated
16–18 hours after insemination, and zygotes with two pronuclei indicated that
fertilization was normal. The cleavage-stage embryo morphology was observed on
the third day after oocyte retrieval as follows: good, 7–10 cells,
In
fresh cycles, Flavestin
(H20041902, Zhejiang Xianju Pharmaceutical Co., Ltd., Xianju, Zhejiang, China)
patients received intramuscular injection for luteal support
from the day of oocytes retrieval. According to the estradiol level on the hCG
injection day, appropriate estradiol (H20160679, DELPHARM
Lille S.A.S., Cedex, France) was supplemented on the transplant
day. In frozen ET
cycles, the endometria were prepared by
natural
or artificial cycles. Patients with regular
menstruation underwent natural cycle monitoring. A dose of 10,000 IU hCG was
administered intramuscularly on the day when follicles matured (
A pregnancy test was
performed on day 14 after ET, and a positive result was indicated by a serum
Statistical analyses were performed with
SPSS version 23 (IBM Corporation, Armonk, NY, USA). The non-normally distributed
continuous variables were expressed as median (25th quartile, 75th quartile), and
comparisons were performed using the Wilcoxon rank sum test. Count data were
indicated as a percentage (%), and
comparisons were performed using the
Overall, a total of 767 PCOS patients with first IVF/ICSI treatment classified into two types (A: n = 167, and D: n = 600) were eligible for analysis, together with 406 single polycystic ovary patients as control group (Fig. 1). Data reported in Table 1 show that female age and insemination method were comparable among the three groups. The basic progestin, BMI, and primary infertility rate in phenotypes A and D of PCOS were significantly higher than those in single polycystic ovary. All types of PCOS had a higher basic testosterone than single polycystic ovary. Insulin resistance by homeostatic model assessment (HOMA-IR), AMH, AFC, basic estradiol, and basic luteinizing hormone (LH) were significantly increased in phenotype A and D relative to single polycystic ovary, but estradiol, progestin and endometrial thickness on the hCG day were significantly decreased (Table 2).
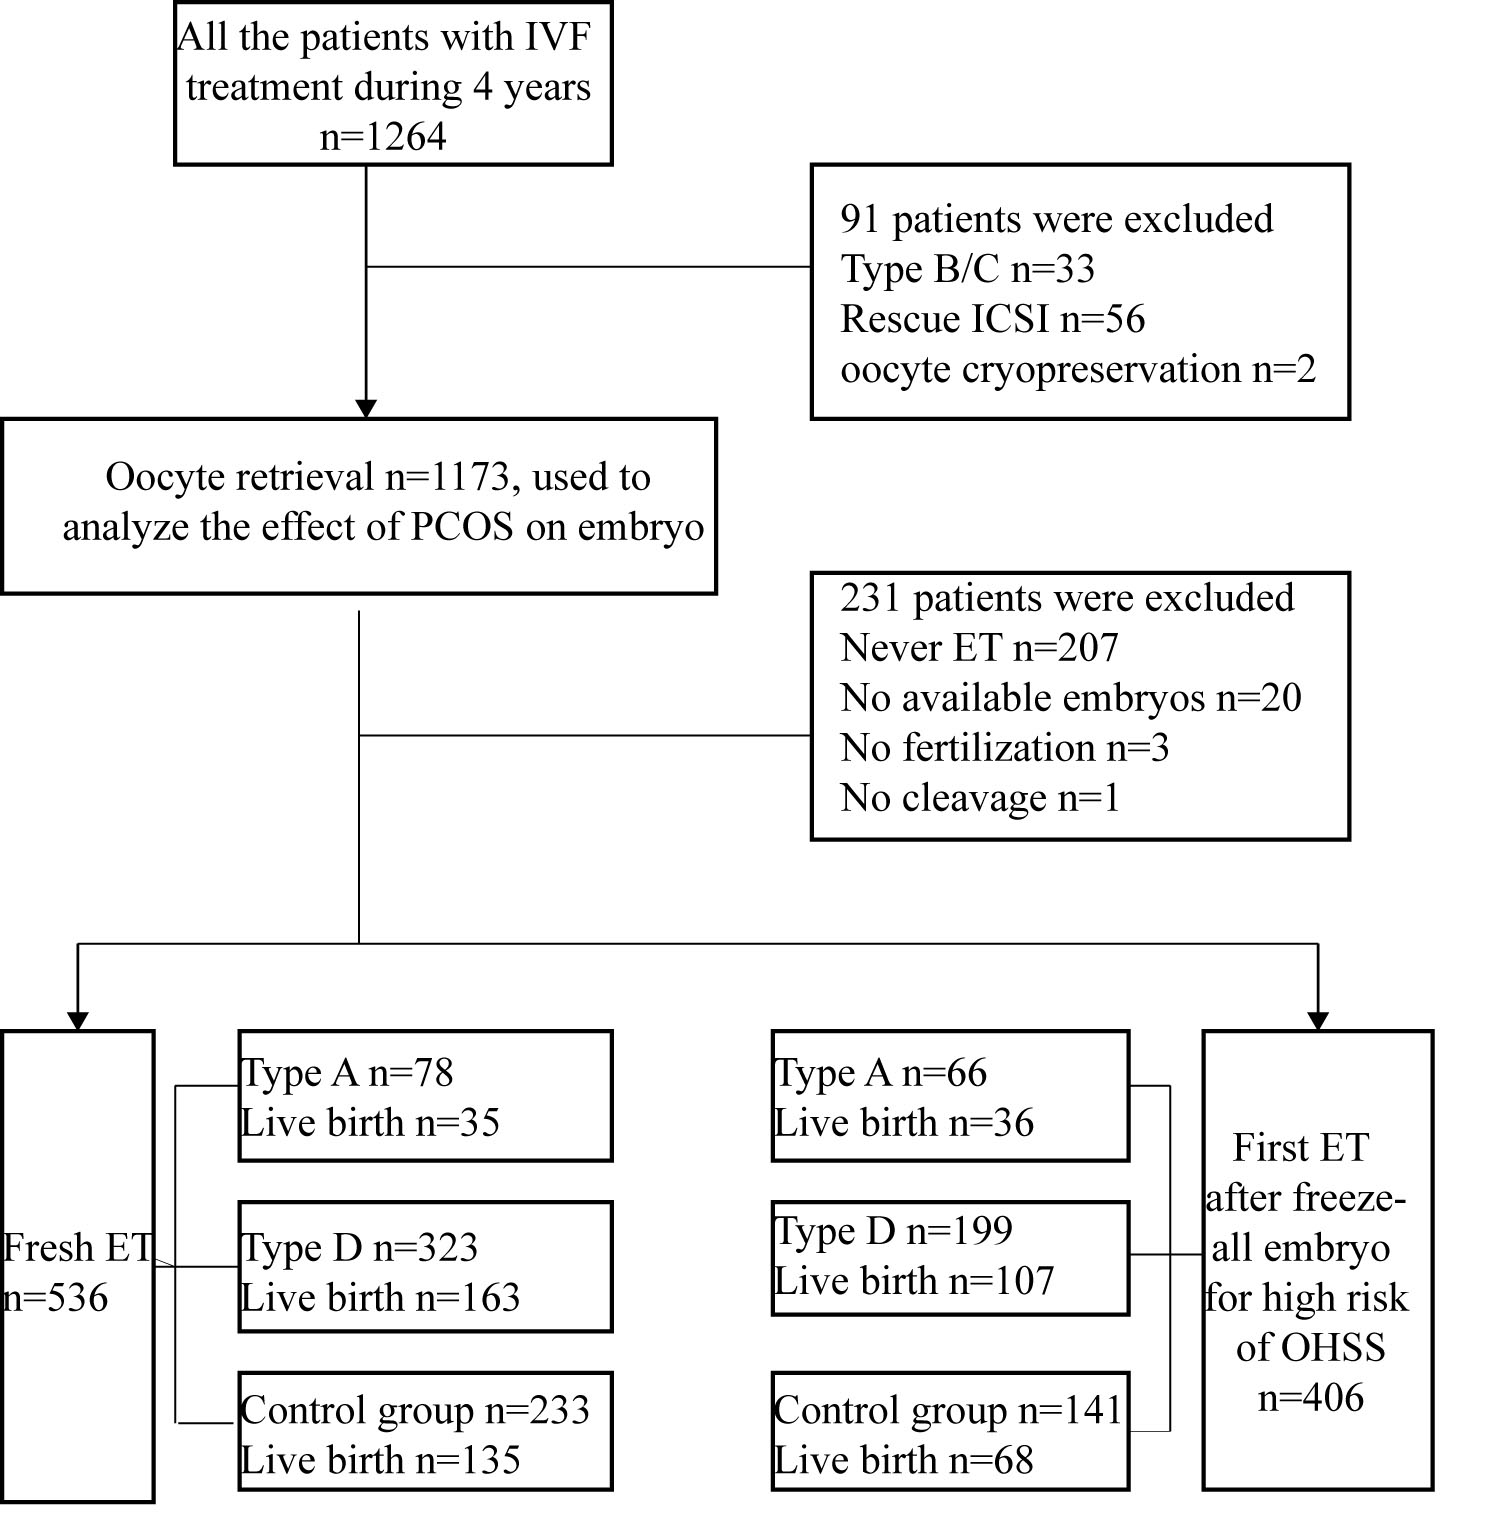 Fig. 1.
Trial flow chart. An overview of the patient selection and the overall reproductive outcomeout of fresh embryo transfer (ET) and first frozen embryo transfer ET (FET). IVF, in vitro fertilization; OHSS, ovarian hyperstimulation syndrome.
| Phenotype A | Phenotype D | Control group | |
| Cases, n | 167 | 600 | 406 |
| Female age, years | 28 (25, 30) | 28 (26, 31) | 28 (26, 31) |
| BMI, kg/m |
25.4 (22.8, 27.6) * | 24.7 (22.4, 27.5) * | 23.0 (20.8, 25.7) |
| HOMA-IR | 2.48 (1.41, 3.55) * | 2.29 (1.24, 3.55) * | 1.51 (0.45, 2.61) |
| primary infertility rate, % | 65.87 (110/167) * | 54.83 (329/600) * | 43.10 (175/406) |
| ICSI, % | 18.56 (31/167) | 25.17 (151/600) | 22.66 (92/406) |
| AMH, ng/mL | 8.54 (5.63, 11.90) * | 7.20 (5.05, 9.95) * | 4.81 (3.35, 6.46) |
| AFC, n | 30 (26, 37) * | 27 (24, 33) * | 24 (22, 26) |
| Basic FSH, IU/L | 5.55 (4.58, 6.61) * | 5.74 (4.81, 6.93) | 5.98 (5.05, 7.04) |
| Basic estradiol, ng/mL | 50.3 (38.0, 66.2) * | 41.0 (31.4, 54.6) * | 37.0 (25.9, 49.1) |
| Basic progestin, ng/mL | 0.36 (0.25, 0.51) | 0.30 (0.20, 0.42) | 0.33 (0.24, 0.46) |
| Basic luteinizing hormone, IU/L | 10.10 (5.88, 13.60) * | 7.58 (4.43, 11.2) * | 4.54 (3.21, 5.89) |
| Basic testosterone, ng/dL | 38.6 (26.0, 51.2) * | 20.0 (20.0, 29.5) * | 20.0 (20.0, 20.0) |
PCOS, polycystic ovary syndrome; BMI, body mass index; HOMA-IR, insulin resistance by homeostatic model assessment; ICSI, intracytoplasmic sperm injection; AMH, anti-mullerian hormone; AFC, antral follicle count; FSH, follicle-stimulating hormone. Statistics presented as median (P25, P75) or percentage (number/total number). *Statistically significant compared with the control group.
| Phenotype A | Phenotype D | Control group | ||
| Cases, n | 167 | 600 | 406 | |
| Protocol | ||||
| Long GnRH agonist protocol, % | 80.84 (135/167) * | 83.50 (501/600) * | 97.78 (397/406) | |
| GnRH antagonist protocol, % | 19.16 (32/167) * | 16.50 (99/600) * | 2.46 (10/406) | |
| Total Gn dose, IU | 1850 (1450, 2263) * | 1925 (1550, 2475) | 2013 (1650, 2419) | |
| Duration of Gn stimulation, days | 11 (9, 12) * | 11 (10, 12) | 11 (10, 12) | |
| Estradiol, hCG day, ng/mL | 3961 (2877, 5740) * | 3947 (2676, 5728) * | 4417 (3208, 5835) | |
| Progestin, hCG day, ng/mL | 0.68 (0.50, 0.94) * | 0.70 (0.51, 0.96) * | 0.85 (0.63, 1.15) | |
| Endometrial thickness, hCG day, mm | 10.3 (9, 12) * | 11 (9, 12) * | 12 (10, 13) | |
| FORT, % | 61.3 (48.9, 75.0) * | 60.6 (47.6, 77.8) * | 72.0 (58.4, 88.2) | |
| Oocytes retrieved rate, % | 90.50 (74.00, 100.00) | 89.50 (75.00, 100.00) * | 93.90 (80.80, 100.00) | |
| No. of oocytes retrieved, n | 16 (12, 21) | 15 (11, 20) | 16 (13, 20) | |
| No. of normal fertilization, n | 9 (7, 13) * | 9 (6, 13) * | 10 (7, 14) | |
| No. of transferable embryos, n | 5 (3, 7) * | 4 (3, 6) | 4 (2, 6) | |
| No. of high-quality embryos, n | 2 (1, 5) | 2 (1, 4) | 2 (1, 4) | |
| Blastocyst formation rate, % | 42.42 (694/1636) * | 41.19 (2358/5724) * | 38.90 (1532/3938) | |
| OHSS rate, % | 5.39 (9/167) | 8.50 (51/600) | 6.65 (27/406) | |
GnRH, gonadotropin-releasing hormone; Gn, gonadotropin; hCG, human chorionic gonadotropin; FORT, follicular output rate; OHSS, ovarian hyperstimulation syndrome. Statistics presented as median (P25, P75) or percentage (number/total number). *Statistically significant compared with the control group.
This phenomenon could be related to a significant reduction of total Gn dose (1850 [1450, 2263] vs. 2013 [1650, 2419] IU), Gn duration (11 [9, 12] vs. 11 [10, 12] days) and FORT (61.3 [48.9, 75.0] vs. 72.0 [58.4, 88.2] %) in phenotype A relative to single polycystic ovary. No significant difference was observed in number of oocytes retrieved, high-quality embryo rate and moderate-severe OHSS rate among the three groups. Interestingly, although number of normal fertilizations was lower, the blastocyst formation rates were higher in phenotype A and D relative to single polycystic ovary. Moreover, the number of transferable embryos was significantly higher in phenotype A (5 [3, 7] vs. 4 [2, 6]) than single polycystic ovary.
There was no significant difference in the ET cancel rate for
OHSS risk and the cumulative live
yield per oocyte retrieval among the three
groups (Table 3). In
fresh cycles, phenotype A had a significant
statistical decrease in the live birth rate compared with single polycystic ovary
(35/78 [44.87%] vs. 135/233 [57.94%], p
| Type | Phenotype A | Phenotype D | Control group | |
| In fresh cycles | ||||
| Cases, n | 78 | 323 | 233 | |
| ET cancel for OHSS risk, % | 53.89 (90/167) * | 46.17 (277/600) | 42.36 (172/406) | |
| Estradiol, hCG day, ng/mL | 3327 (2417, 4435) * | 3384 (2346, 4603) | 3881 (2913, 5082) | |
| Progestin, hCG day, ng/mL | 0.57 (0.42, 0.78) * | 0.63 (0.45, 0.83) | 0.79 (0.60, 1.06) | |
| Endometrial thickness, mm | 10.5 (10.0, 12.0) * | 11.0 (9.5, 12.5) * | 12.0 (10.5, 13.0) | |
| No. of transferred embryos, n | 1.85 |
1.88 |
1.87 | |
| Biochemical pregnancy rate, % | 76.92 (60/78) | 73.38 (237/323) | 75.97 (177/233) | |
| Clinical pregnancy rate, % | 60.26 (47/78) | 60.06 (194/323) | 64.81 (151/233) | |
| Live birth rate, % | 44.87 (35/78) * | 50.46 (163/323) | 57.94 (135/233) | |
| Implantation rate, % | 45.14 (65/144) | 45.71 (277/606) | 48.28 (210/435) | |
| In the first frozen ET cycles withheld fresh ET due to the risk of OHSS | ||||
| Cases, n | 66 | 199 | 141 | |
| Estradiol, ovulation day, ng/mL | 263 (189, 390) * | 290 (192, 455) | 281 (196, 448) | |
| Progestin, ovulation day, ng/mL | 0.62 (0.22, 12.9) * | 10.40 (0.26, 16.50) | 9.76 (0.28, 16.80) | |
| Endometrial thickness, mm | 9 (8.05, 9.6) | 9 (8, 9.9) | 8.8 (8, 10) | |
| No. of transferred embryos, n | 1.73 |
1.8 |
1.7 | |
| Biochemical pregnancy rate, % | 80.30 (53/66) * | 74.37 (148/199) | 68.09 (96/141) | |
| Clinical pregnancy rate, % | 66.67 (44/66) | 63.82 (127/199) | 55.32 (78/141) | |
| Live birth rate, % | 54.55 (36/66) | 53.77 (107/199) | 48.23 (68/141) | |
| Implantation rate, % | 49.12 (56/114) | 45.25 (162/358) | 43.33 (104/240) | |
| Cumulative live birth rate, % | 76.47 (104/136) | 79.31 (391/493) * | 72.83 (252/346) | |
ET, embryo transfer; FET, frozen embryo transfer ET. Statistics presented as median (P25, P75) or percentage (number/total number). *Statistically significant compared with the control group.
Women with phenotype A,
phenotype D and single polycystic ovary were divided into two
subgroups according to whether they produced live births in fresh cycles;
however, women with phenotype B, C were excluded due to the
small number of cases. Women with live birth
had a higher estradiol on the hCG day in the phenotype A (3763 [3121,
4752] vs. 2954 [2112, 4036] ng/mL) while a lower
estradiol in the single polycystic ovary (3312 [2341, 4465]
vs. 3417 [2350, 4638] ng/mL) (Table 4). There were no significant
differences of estradiol on the hCG day in the phenotype D. Furthermore, there
was no significant difference in female age, BMI, HOMA-IR, AFC, number of oocytes
retrieved, FORT, LH, FSH, progesterone (P) and endometrial
thickness on the hCG between two subgroups (Table 4). In multivariate logistic
regression analysis, after adjusting for female age, BMI, HOMA-IR, AFC,
endometrial thickness, FSH, LH on the hCG days, and estradiol on the hCG day were
significant independent factors predicting live birth in fresh ET for women with
phenotype A (OR
| Phenotype A | Phenotype D | Control group | ||||
| No live birth | Live birth | No live birth | Live birth | No live birth | Live birth | |
| Cases, n | 43 | 35 | 160 | 163 | 98 | 135 |
| Female age, years | 29 (26, 30) | 29 (26, 30) | 29 (26, 31) | 28 (27, 31) | 29 (26, 31) | 28 (27, 31) |
| BMI, kg/m |
25.5 (22.9, 27.0) | 26.0 (22.9, 28.4) | 25.1 (22.7, 27.3) | 24.7 (22.4, 27.1) | 25.1 (22.7, 27.3) | 24.7 (22.4, 27.1) |
| HOMA-IR | 2.17 (1.55, 2.72) | 2.98 (1.47, 4.01) | 2.24 (1.17, 3.35) | 2.28 (1.11, 3.28) | 2.24 (1.17, 3.35) | 2.28 (1.11, 3.28) |
| AFC, n | 29 (26, 39) | 29 (24, 37) | 27 (23, 30) | 26 (23, 30) | 27 (23, 30) | 26 (23, 30) |
| No. of oocytes retrieved, n | 14 (10, 18) | 16 (13, 19) | 14 (11, 17) | 14 (11, 17) | 14 (11, 17) | 14 (11, 17) |
| FORT, % | 55.90 (43.90, 66.10) | 59.70 (52.40, 073.30) | 60.00 (47.80, 75.00) | 59.10 (48.20, 70.80) | 60.00 (47.80, 75.00) | 59.10 (48.20, 70.80) |
| Estradiol, hCG day, ng/mL | 2954 (2112, 4036) | 3763 (3121, 4752) * | 3417 (2350, 4638) | 3312 (2341, 4465) | 3417 (2350, 4638) | 3312 (2341, 4465) * |
| LH, hCG day, IU/L | 0.94 (0.66, 1.21) | 0.89 (0.76, 1.23) | 0.85 (0.67, 1.16) | 0.87 (0.66, 1.17) | 0.85 (0.67, 1.16) | 0.87 (0.66, 1.17) |
| FSH, hCG day, IU/L | 10.40 (8.38, 12.5) | 11.20 (8.84, 14.20) | 11.20 (8.99, 13.90) | 11.40 (9.84, 14.20) | 11.20 (8.99, 13.90) | 11.40 (9.84, 14.20) |
| P, hCG day, ng/mL | 0.57 (0.37, 0.73) | 0.58 (0.45, 0.79) | 0.63 (0.45, 0.83) | 0.62 (0.45, 0.83) | 0.63 (0.45, 0.83) | 0.62 (0.45, 0.83) |
| Endometrial thickness, hCG day, mm | 10.0 (9.0, 12.4) | 11.0 (9.8, 12.6) | 11.0 (9.5, 12.5) | 11.0 (10.0, 12.5) | 11.0 (9.5, 12.5) | 11.0 (10.0, 12.5) |
LH, luteinizing hormone; P, progesterone. *Statistically significant compared with the control group
| Phenotype A | Control group | |||||||
| β | Standard error | p value | Exp (β) (95% confidence interval) | β | Standard error | p value | Exp (β) (95% confidence interval) | |
| Female age | 0.015 | 0.091 | 0.868 | 1.015 (0.849, 1.21) | 0.021 | 0.043 | 0.632 | 1.021 (0.939, 1.110) |
| BMI | 0.040 | 0.108 | 0.709 | 1.041 (0.843, 1.29) | 0.013 | 0.052 | 0.807 | 1.013 (0.914, 1.122) |
| HOMA-IR | 0.354 | 0.200 | 0.077 | 1.425 (0.962, 2.11) | 0.158 | 0.092 | 0.083 | 1.172 (0.979, 1.402) |
| AFC | –0.047 | 0.039 | 0.233 | 0.954 (0.884, 1.03) | 0.028 | 0.039 | 0.471 | 1.029 (0.952, 1.111) |
| Endometrial thickness, hCG day | 0.156 | 0.138 | 0.259 | 1.168 (0.892, 1.53) | –0.050 | 0.069 | 0.464 | 0.951 (0.831, 1.088) |
| Estradiol, hCG day | 0.001 | 0.001 | 0.034 | –0.001 | 0.001 | 0.013 | ||
| LH, hCG day | 0.498 | 0.415 | 0.231 | 1.645 (0.729, 3.71) | –0.057 | 0.161 | 0.725 | 0.945 (0.690, 1.295) |
| FSH, hCG day | 0.036 | 0.069 | 0.600 | 1.037 (0.906, 1.19) | –0.065 | 0.039 | 0.090 | 0.937 (0.869, 1.010) |
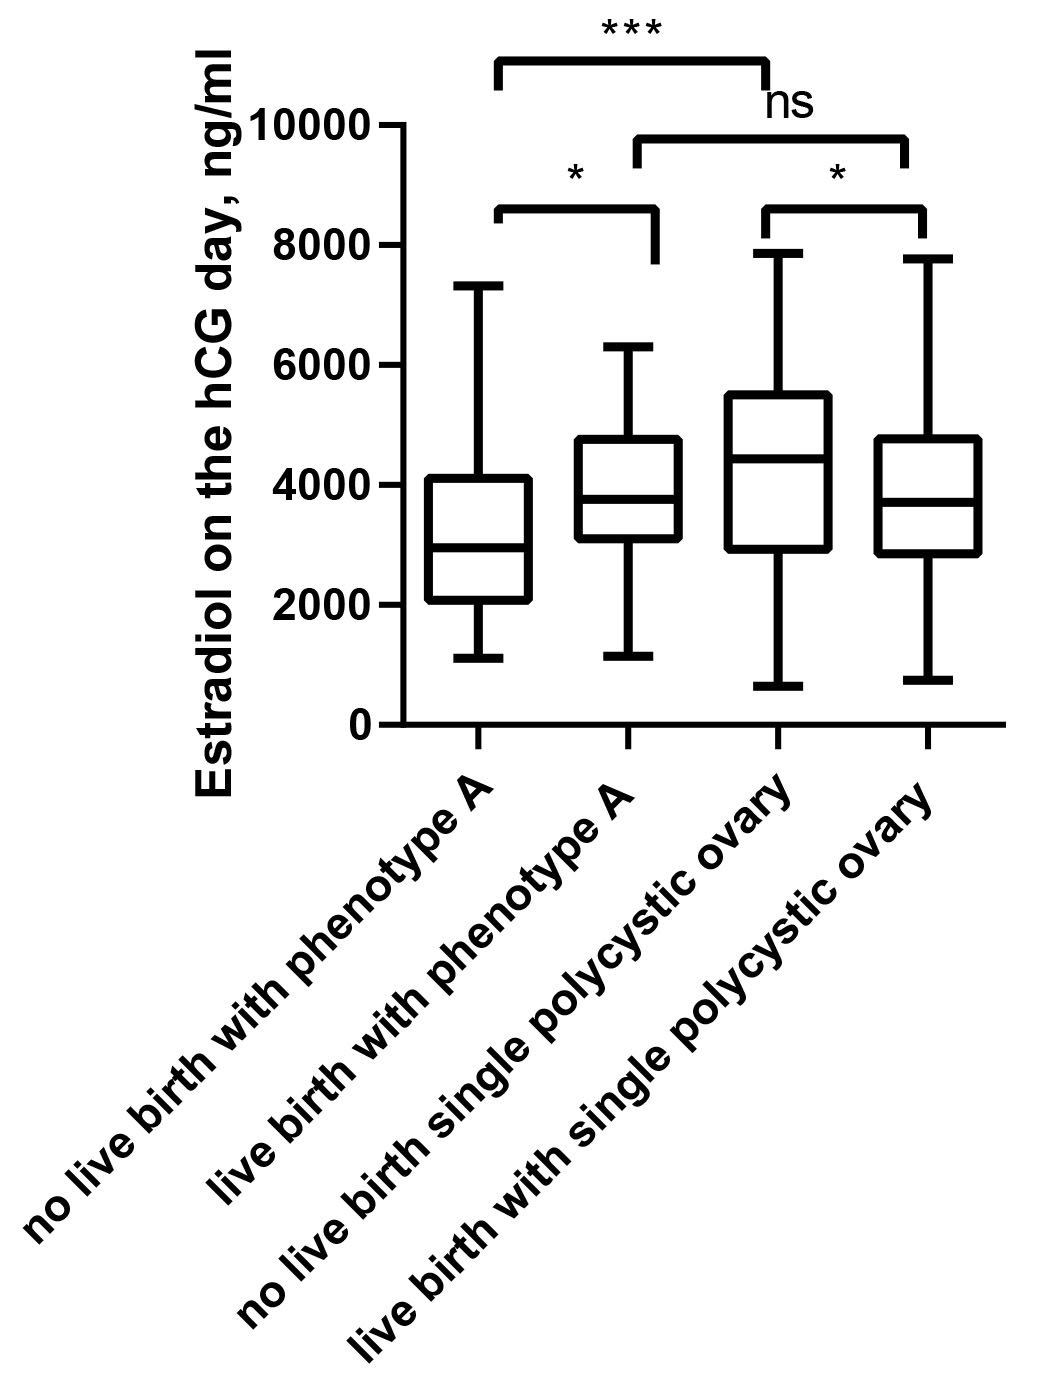 Fig. 2.
Comparison of the estradiol on the hCG day between live births
and non-live births in fresh cycles. * p
Women with PCOS had
a higher rate of spontaneous abortion
compared with women without PCOS undergoing assisted
reproductive treatment (ART) [4]. However,
most studies have shown that polycystic ovary does not affect embryo quality and
CLBR, and may even improve pregnancy outcomes in older women [9, 10, 11]. Patients
with single polycystic ovarian morphology (PCOM) were selected as control groups
in this study to exclude the advantages of better clinical outcome from a higher
number of oocytes retrieved in patients with PCOS [18]. Similarly,
patients were found to have lower live birth in phenotype A of
PCOS compared with PCOM (35/78 [44.87%] vs. 135/233 [57.94%],
p
Patients with PCOS were classified into phenotype A and D while phenotype B and C were excluded due to the small number of cases in this study. Clinical manifestations vary substantially among different subtypes of PCOS. There was no difference in the number of oocytes retrieved among the other groups, although AFC was higher in the groups of phenotype A and D. This finding is perhaps attributable to the deliberate reduction of FORT to reduce the OHSS rate. However, it is also possible that phenotype A and D are independent risk factors associated with low ovarian response, while rates of oocytes retrieved were significantly lower than those in the single polycystic ovary. This conclusion is supported by a previous retrospective observational study wherein oligo/amenorrhea is an independent risk factor associated with low ovarian response [21]. Interestingly, although number of normal fertilizations was lower, the blastocyst formation rates were higher in phenotype A and D relative to the single polycystic ovary. Moreover, the number of transferable embryos was significantly higher than in the cases of single polycystic ovary. This fact supports the supposition that PCOS has no adverse effect on the IVF embryo outcome. There was no significant difference in cumulative live birth rate among the three groups; as reported, the factors of cumulative live birth rates were primarily number of oocytes retrieved and embryo quality [9, 22].
There was no significant difference in the clinical pregnancy rate of fresh embryo transfer among the three groups, but the live birth rate of PCOS phenotype A was significantly lower than that of single polycystic ovary. The biochemical pregnancy rate of phenotype A was significantly higher than that of the single polycystic ovary group. This also indicates that the low live birth rate of PCOS might not be due to embryo quality but to endometrial receptivity. It was found that estradiol, progestin and endometrial thickness of PCOS phenotype A on trigger day were significantly lower than in the case of single polycystic ovary. The endometrium is a dynamic tissue that undergoes cycles of growth, remodeling, and shrinkage steered by variations in the levels of estradiol and progestin [23]. Although the ovary is known to produce numerous steroids throughout the menstrual cycle, only estradiol and progestin have been shown to be necessary for the induction of endometrial receptivity [24, 25]. The role of Rab-mediated intracellular transport modulated by estradiol and progestin is important in endometrial receptivity [23].
This study also compared the clinical data between live births and non-live births in fresh cycles. Interestingly, women with live births had similar estradiol levels between the phenotype A and the single polycystic ovary. However, women with live birth had a higher estradiol on the hCG day in the phenotype A vs. a lower estradiol in the single polycystic ovary. In multivariate logistic regression analysis, after adjusting for female age, BMI, HOMA-IR, AFC, endometrial thickness, FSH, LH on the hCG days, and estradiol on the hCG day were significant independent factors predicting live birth in fresh ET for women with phenotype A (OR = 1.000, 95% CI: 1.000–1.001, p = 0.034) and single polycystic ovary (OR = 1.000, 95% CI: 0.999–1.000, p = 0.013). Low levels of estradiol may be the reason for the reduced live birth rates owing to significant reduction of total Gn dose, Gn duration and FORT as a result of low incidence of OHSS in phenotype A.
Estradiol, progestin, and endometrial thickness on the day of ovulation did not differ significantly among the three groups in the first frozen ET cycles. Meanwhile, there were no statistically significant differences in clinical pregnancy rates and live birth rates among the three groups. The live birth rate in the first frozen ET cycles was greatly improved compared with fresh embryo transfer. These findings also support the hypothesis that PCOS may not have a direct effect on endometrial receptivity and embryo quality. Our results also confirm that women with live births had similar estradiol levels between the phenotype A and the single polycystic ovary. However, women with live births had a higher estradiol on the hCG day in the phenotype A, but a low estradiol in the single polycystic ovary.
Limitations of this study include the fact that patients with PCOS phenotype B and C could not be carefully analyzed due to the small number of cases. Whether FET or appropriate estrogen supplementation can improve live births is worthy of further exploration.
The various subtypes of PCOS have no significant adverse effect on IVF embryonic outcome. Low levels of estradiol may be the reason for the reduced live birth rate owing to significant reduction of total Gn dose, Gn duration and FORT as a result of low incidence of OHSS in phenotype A.
The datasets generated and analyzed during the current study are not publicly available, since the dataset will be used for other retrospective analyses. The data are available from the corresponding author upon reasonable request.
BZ, FD and SW contributed to conception and design of the study. FD and YG organized the database. MD, LT and GL performed the statistical analysis. FD wrote the first draft of the manuscript. All authors contributed to editorial changes in the manuscript. All authors read and approved the final manuscript. All authors have participated sufficiently in the work and agreed to be accountable for all aspects of the work.
All procedures used in this study were conducted in accordance with the principles of conducting experiments with human participants as outlined in the Declaration of Helsinki. This study adopted the consent of the Ethics Committee of Xingtai Infertility Specialized Hospital (approval number: 2022-05). All process in IVF-ET were obtained by written informed consent.
We would like to express our gratitude to all those who helped us during the writing of this manuscript. Thanks to all the peer reviewers for their opinions and suggestions.
The work was supported by the Health Commission of Hebei Province (Grant No. 20221862).
The authors declare no conflict of interest.
Publisher’s Note: IMR Press stays neutral with regard to jurisdictional claims in published maps and institutional affiliations.