
- Academic Editor
†These authors contributed equally.
Background: Intrapartum cesarean delivery has been the focus of many researchers. We derived and validated a model to predict cesarean for low-risk Chinese nulliparous undergoing induction of labor. Methods: We developed a risk model for cesarean by including variables in univariate and multivariable logistic regression using the development set (3841 pregnant women). The performance of the model was assessed for the receiver operating characteristic (ROC) curve, calibration and decision curve analysis (DCA). Additionally, we validated the model externally using an independent dataset (3421 pregnant women). Results: Multivariable logistic regression analysis showed that age, height, body mass index (BMI), weight change during pregnancy, gestational age, premature rupture of membranes (PROM), meconium-stained amniotic fluid and neonatal sex were independent factors affecting cesarean outcome. Two models were established, depending on whether the sex of the fetus was included. The area under the ROC curve of two models were 0.755 and 0.748, respectively. We verified externally, and the area under the ROC curve of two models were 0.758 and 0.758, respectively. The calibration plots demonstrated a good correlation. DCA demonstrated that two models had clinical application value. The online web servers were constructed based on the nomograms for convenient clinical use. Conclusions: These two models can be used as useful tools to assess the risk of cesarean for low-risk Chinese nulliparous undergoing induction of labor.
Cesarean is a life-saving surgery within the obstetric domain. However, it may have risks for subsequent pregnancies as well as long-term effects for both mothers and their offsprings that are still undertaking research [1, 2]. With the development of urbanization, the relaxation of the one-child policy, and the introduction of the universal two-child policy and three-child policy in China, a growing number of pregnant women are accessing medical information about pregnancy and childbirth through the Internet, realizing the disadvantages and risks of caesarean section and preferring to deliver vaginally [3, 4]. Unfortunately, delivery is a complex and dynamic process. Sometimes vaginal delivery doesn’t go so well, resulting in pregnancies have to undergo the emergency operation. And yet, maternal and perinatal complications are higher when a failed trial of labor results in an emergency cesarean delivery [5, 6, 7]. Arduous birth experience could impose life-long negative effects and have an unpleasant procedure on the life of the mother, child, family, clinic, and society [8, 9]. In the era of foreseeable medicine, a prediction algorithm to determine women at risk of an intrapartum cesarean could potentially reduce morbidity and mortality associated with labor.
Currently, several published models studied on prediction of cesarean delivery were mostly focused on the white populations [6, 10, 11, 12, 13, 14], and there is a lack of sufficient data regarding the majority of Han ethnic backgrounds in the Chinese population. To date, China lacks the relevant researches, and there is limited empirical evidence and clinical experience reported.
Therefore, our study aimed to develop and validate a clinical prediction model that utilizes maternal and fetal data, incorporating readily available variables, for predicting cesarean delivery risk in nulliparous women with low-risk at term who undergo labor induction. The use of calculators may provide physicians with an evidence-based tool to assist in patient counseling and to provide individualized guidance of delivery mode.
We conducted a retrospective cohorts study of low-risk nulliparous women with singleton, term, cephalic pregnancies who delivered at the Hospital of the First Affiliated Hospital of Soochow University and Sihong county People’s Hospital. The former hospital is a tertiary referral center, while the latter is a secondary referral center. There were two distinct phases to the overall study, the development and the validation phases. The prediction model was developed among women who delivered at the First Affiliated Hospital of Soochow University between January 1, 2011, and August 31, 2017. External validation was conducted using data from Sihong county People’s Hospital between January 1, 2013, and December 31, 2019. This was done to confirm that the model has consistent predictive ability outside of the original study population.
This study obtained Institutional Review Board approval from both hospitals, which waived the need for informed consent due to the retrospective nature of the study. The study adhered to the methods and reporting guidelines outlined in the TRIPOD (Transparent Reporting of a multivariable prediction model for Individual Prognosis or Diagnosis) statement [15].
We recruited nulliparous women with low-risk pregnancies, undergoing labor with singleton cephalic pregnancies at term (37 0/7 weeks of gestation or greater). Women had antepartum intrauterine fetal death or fetal anomalies were excluded. Exclusion criteria were as follows:
(i) Women had complications during pregnancy (e.g., cardiac failure, severe liver and kidney diseases, hypertensive disorders of pregnancy, diabetes, oligohydramnios, placenta previa, vasa previa and fetal growth restriction); (ii) Women had a scarred uterus (e.g., myomectomy); (iii) Women had contraindications to vaginal delivery; (iv) Women had the cesarean delivery on maternal request; (v) Women entered labor naturally or received intervention measures such as oxytocin augmentation and amniotomy when their cervical dilation was greater than or equal to 6 cm.
The pregnant women who meet the criteria were divided into the intrapartum cesarean delivery group and the vaginal delivery group according to their delivery modes.
Data on maternal characteristics and perinatal parameters were collected by reviewing the patient’s medical records from the obstetrics database maintained by the institution.
The outcome of interest was defined as cesarean. A cesarean delivery was performed if there was fetal distress, arrested active phase, prolonged latent phase, prolonged second stage, arrested descent, suspected chorioamnionitis, and other medical indications, such as threatened uterine rupture. It is worth noting that we only collected the major indications. We selected candidate predictor variables that could be easily obtained from maternal and fetal data. A systematic review of the literature was conducted to identify easily accessible predictor variables [6, 10, 11, 12, 13, 14, 16, 17, 18]. The recorded variables included maternal age, height, weight, baseline (i.e., pre-pregnancy) body mass index (BMI), weight change during pregnancy, gestational age at delivery, premature rupture of membranes (PROM), meconium-stained amniotic fluid, intervention measures (oxytocin, amniotomy, disposable cervical dilator balloon, prostaglandin (Propess or Misoprostol), neonatal sex, and neonatal birth weight.
The relevant guidelines [19, 20] were used to determine cesarean delivery indications such as arrest of descent and a prolonged second stage of labor.
We analyzed the labor process of each participant. The induction group referred to women who received intervention measures when their cervical dilation was less than 6 cm. The cut-off point of 6 cm was chosen because contemporary labor data indicated that active labor starts at 6 cm of cervical dilation [21]. We used the following modes to group the induction group.
Oxytocin induction group: women who received only oxytocin induction.
Amniotomy group: women who received artificial rupture of membranes or both
artificial rupture of membranes and oxytocin induction (amniotomy after using
Prostaglandin E
Disposable cervical dilator balloon group: women who received disposable cervical dilator balloon induction.
Prostaglandin E
Continuous variables were assessed for normality before comparison. The Student’s t-test was used to compare normally distributed continuous variables, while the Mann-Whitney test was used for non-normally distributed or discrete variables. For categorical variables, we used the chi-square test or Fisher exact test, depending on the sample size. Descriptive statistics such as mean and standard deviations or median and interquartile range were used for continuous variables, while percentages and frequencies were used for categorical variables. We used the statistical software package SPSS (24.0, IBM Corp., Chicago, IL, USA) and R (3.6.3, R Foundation for Statistical Computing, Vienna, Austria) for data analysis.
Variables that had a p-value
The discrimination and calibration of the prediction model were evaluated. Discrimination is the extent to which patients with cesarean delivery is identified likely to have this positive outcome. Calibration refers to the extent to which the calculated risks reflect the actual percentage of women with the outcome in each group. It is the agreement between observed outcomes and predictions. Discrimination is assessed by measuring the area under the receiver operating characteristic curve (AUC ROC), where an AUC of 0.5 indicates a non-informative model, while an AUC between 0.5 and 0.7 indicates poor discrimination, an AUC between 0.7 and 0.8 indicates acceptable discrimination, an AUC between 0.8 and 0.9 indicates excellent discrimination, and an AUC greater than 0.9 indicates outstanding discrimination [22]. The calibration of the prediction model was assessed using the Hosmer-Lemeshow goodness-of-fit test (a non-significant p-value indicates good calibration) and/or calibration plot (the ideal curve should be a 45-degree straight line). Additionally, a perfect calibration model would have a slope of 1 and an intercept of 0 on the calibration plot. Decision curve analysis (DCA) was utilized to evaluate the clinical utility of the model by assessing the net benefit. The DCA involved plotting a decision curve to provide clinicians with information about the range of threshold probabilities in which the model would be clinically valuable when implemented in clinical practice. To demonstrate the performance of the model, we evaluated its internal validity using a bootstrapping technique with 1000 resamples. We conducted an external verification of the final model in another hospital. In the validation cohort, we assessed the predictive performance of the model using the same measures of discrimination and calibration as in the development cohort. We also created a graphical nomogram based on the final model using R, and established a dynamic nomogram using the rms DynNom package. Additionally, we developed a web-based application through shinyapps. All statistical tests were two-tailed, and a significance level of 5% was used.
During the study period, 18,228 deliveries were managed at our tertiary referral
center. After exclusion of ineligible patients, 3841 women were enrolled
(Supplementary Fig. 1). The induction methods were oxytocin induction
(29.37%, 1128/3841); amniotomy (63.97%, 2457/3841); disposable cervical dilator
balloon (2.08%, 80/3841); and prostaglandin E
Participants were divided into vaginal delivery and cesarean delivery groups, and the comparisons of demographics and clinical characteristics were displayed in Table 1. The women in cesarean delivery group were older and shorter in height, had higher baseline BMI and higher weight gain during pregnancy and delivered later compared with those in vaginal delivery group. The incidence of PROM and the proportion of cases with meconium-stained amniotic fluid were all higher in cesarean delivery group. There were more male infants and higher neonatal birth weight in the cesarean delivery group as well. Table 2 presented results of the univariable logistic analysis.
| Variable | Cesarean delivery (n = 462) | Vaginal delivery (n = 3379) | p | |
| Maternal characteristics | ||||
| Maternal age (year) | 27.42 |
26.88 |
||
| Height (cm) | 159.45 |
161.73 |
||
| Baseline BMI (kg/m |
21.58 |
20.89 |
||
| Weight change during pregnancy (kg) | 14.78 |
14.35 |
0.04 | |
| Gestational age (day) | 282.23 |
279.49 |
||
| Labour and others characteristics | ||||
| PROM | 108 (23.38%) | 660 (19.53%) | 0.053 | |
| Meconium-stained amniotic fluid | ||||
| None | 342 (74.03%) | 3116 (92.22%) | ||
| I | 28 (6.06%) | 124 (3.67%) | ||
| II | 24 (5.19%) | 90 (2.66%) | ||
| III/ bloody | 68 (14.72%) | 49 (1.45%) | ||
| Neonatal characteristics | ||||
| Neonatal sex (male) | 262 (56.71%) | 1704 (50.43%) | 0.011 | |
| Neonatal birth weight (g) | 3534.91 |
3384.18 |
||
BMI, body mass index; PROM, premature rupture of membranes.
| Variables | Univariate logistic analysis | Multivariable logistic analysis 1 |
Multivariable logistic analysis 2 | |
| OR (95% CI) | OR (95% CI) | OR (95% CI) | ||
| Maternal age (year) | 1.059 (1.026–1.093) | 1.071 (1.035–1.108) | 1.069 (1.033–1.106) | |
| Height (cm) | 0.893 (0.873–0.913) | 0.888 (0.867–0.910) | 0.889 (0.868–0.910) | |
| Baseline BMI (kg/m |
1.100 (1.062–1.139) | 1.067 (1.026–1.109) | 1.066 (1.026–1.108) | |
| Weight change during pregnancy (kg) | 1.024 (1.001–1.048) | 1.047 (1.021–1.074) | 1.046 (1.020–1.072) | |
| Gestational age (day) | 1.060 (1.045–1.077) | 1.066 (1.048–1.083) | 1.063 (1.046–1.081) | |
| PROM | 1.257 (0.997–1.584) | 1.791 (1.381–2.323) | 1.786 (1.378–2.315) | |
| Meconium-stained amniotic fluid | ||||
| None | Ref = 1 | Ref = 1 | Ref = 1 | |
| I | 2.057 (1.345–3.147) | 2.041 (1.307–3.188) | 2.065 (1.325–3.220) | |
| II | 2.430 (1.528–3.864) | 2.615 (1.600–4.273) | 2.547 (1.563–4.153) | |
| III/ bloody | 12.644 (8.613–18.561) | 11.692 (7.724–17.700) | 11.538 (7.635–17.435) | |
| Male fetus | 1.288 (1.059–1.567) | 1.473 (1.193–1.819) | - | |
Factors with a p value
At the same time, due to China’s relevant policies that the sex of the fetus was unknown until they had born, we also established a prediction model (Model 2) that did not include fetal sex.
| variables | Model 1 | Model 2 | |||||||
| B | S.E. | Wald | p | B | S.E. | Wald | p | ||
| Maternal age (year) | 0.068 | 0.017 | 15.219 | 0.067 | 0.017 | 14.588 | |||
| Height (cm) | –0.119 | 0.012 | 93.9 | –0.118 | 0.012 | 92.8 | |||
| Baseline BMI (kg/m |
0.065 | 0.02 | 10.758 | 0.001 | 0.064 | 0.02 | 10.593 | 0.001 | |
| Weight change during pregnancy (kg) | 0.046 | 0.013 | 13.042 | 0.045 | 0.013 | 12.191 | |||
| Gestational age (day) | 0.064 | 0.009 | 55.789 | 0.061 | 0.008 | 52.698 | |||
| PROM | 0.583 | 0.133 | 19.274 | 0.580 | 0.132 | 19.226 | |||
| Meconium-stained amniotic fluid | 147.233 | 146.734 | |||||||
| I | 0.713 | 0.228 | 9.83 | 0.002 | 0.725 | 0.227 | 10.255 | 0.001 | |
| II | 0.961 | 0.251 | 14.709 | 0.935 | 0.249 | 14.061 | |||
| III/ bloody | 2.459 | 0.212 | 135.099 | 2.446 | 0.211 | 134.799 | |||
| male fetus | 0.387 | 0.108 | 12.923 | - | - | - | |||
| Constant | –5.201 | 3.07 | 2.87 | 0.090 | –4.473 | 3.057 | 2.141 | 0.143 | |
BMI, body mass index; PROM, premature rupture of membranes. B, partial regression coefficient; S.E, standard error; Wald, wald test statistic.
The areas under the receiver operating characteristic curve, calibration plot and decision curve analysis were presented in Fig. 1. For Model 1, the ROC curve for this predictive model achieved an AUC of 0.755 (95% confidence interval (CI): 0.732–0.778) (Fig. 1A). The correlation between the predicted and actual probabilities of cesarean delivery in Model 1 was demonstrated to be good through the calibration plot (Hosmer-Lemeshow test: p = 0.314, the slope and intercept of the calibration plot were 1 and 0, respectively. Fig. 1B). The AUC curves for Model 2 were 0.748 (95% CI: 0.724–0.772) (Fig. 1A). The Hosmer-Lemeshow goodness-of-fit test indicated that there was no statistically significant difference between the 45-degree straight line and the calibration plot, indicating good calibration in Model 2 (Hosmer–Lemeshow test: p = 0.457, the slope and intercept of the calibration plot were 1 and 0, respectively. Fig. 1C).
 Fig. 1.
The discrimination, calibration and decision curves with prediction models. (A) ROC curves of two models. (B,C) Calibration plot for Model 1 and Model 2. (D) Decision curve analysis (DCA) for two models. (E,F) Use Model 1 and Model 2 to predict risk stratification for 1000 people. The red curve or bule curve indicated the number of people classified as positive by the Model 1 or Model 2 at each threshold probability, the green curve was the number of true. AUC, area under the curve; ROC, receiver operating characteristic.
DCA is a novel method that can examine diagnostic and prognostic strategies, can be used to evaluate and compare different predictive models, and identify the net benefit of a prediction model [23]. Thus, we used DCA for models to predict the correct diagnosis of cesarean delivery. The results (Fig. 1D) indicated that two models were useful for threshold probabilities of 5% to 60%. There was no significant difference in the net benefit between two models. This indicated that the additional benefits of incorporating fetal sex into the model was not significantly increased. This also showed that the application of Model 2 in China was feasible when the fetus sex was unknown before they had born. Furthermore, the clinical impact curve of the prediction models were plotted to predict the risk stratification in 1000 patients (Fig. 1E,F). These curves demonstrated that within the most beneficial threshold probability range, the predicted high-risk women were always more than the women actually had the cesarean delivery, accompanying with acceptable cost-benefit ratio.
Results of the internal validation using bootstrap method indicated that the cesarean delivery rates predicted by both models were consistent with the real data (Fig. 2A,B).
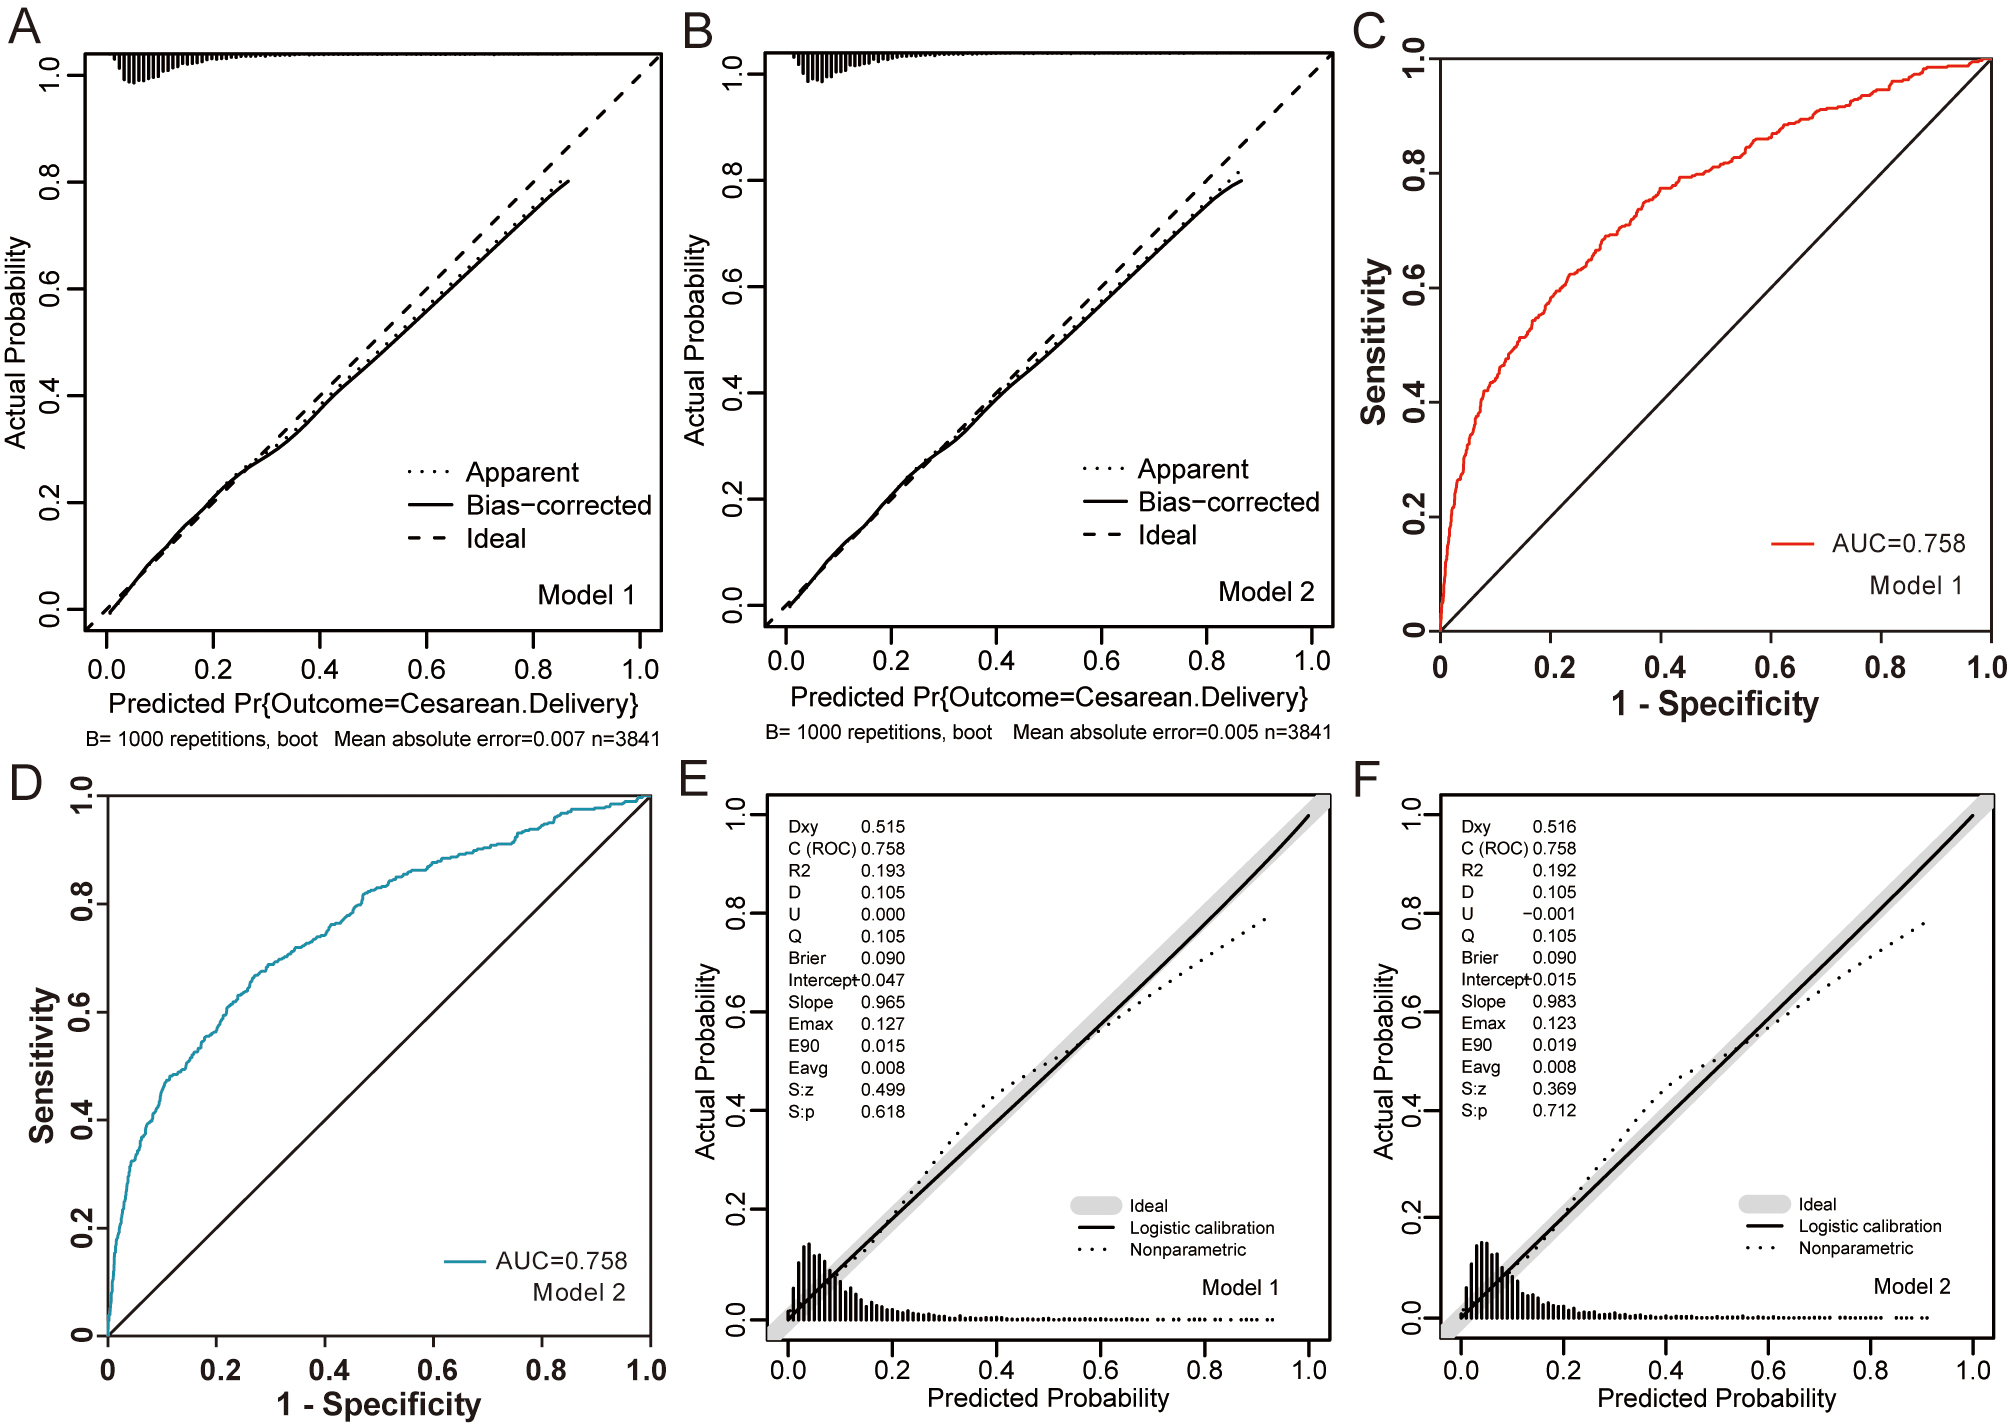 Fig. 2.
Internal and external validation and predictive performance. (A,B) Calibration curves of the two models using 1000 bootstrap re-samples. (C,D) The red ROC curve represents data from the Model 1 and bule ROC curve represents data from the Model 2. (E,F) Calibration curves of the two models in the external validation set.
We validated the two formulas by using a separate data set which was derived from another hospital (Sihong county People’s Hospital).
To validate the logistic regression equations, an external cohort of 3421 low-risk nulliparous women who met the same inclusion criteria as those in the original dataset was used (Supplementary Table 1). It is worth noting that cervical dilator balloon and Propess were not routinely used as induction methods in Sihong county People’s Hospital in this study. In this hospital, 25 micrograms of misoprostol was used prostaglandin for induction of cervical ripening. Considering that misoprostol is also a prostaglandin drug induction method, therefore, when we verified externally, it replaced Propess in induction method. When these two formulas were applied to this cohort, it achieved AUC of 0.7576 (95% CI: 0.7311–0.7840) and 0.7578 (95% CI: 0.7313–0.7842) (Fig. 2C,D). The calibration plots presented an acceptable agreement in the validation cohort between the prediction and actual observation for the Model 1 and Model 2 (Fig. 2E,F).
A graphic nomogram was constructed to visualize the logistic regression model, which allows for the calculation of an individualized risk for intrapartum cesarean delivery (Fig. 3A,B). We also developed a friendly software-based calculator that can give the percentage likelihood of cesarean delivery. It can be found at: https://fangcan.shinyapps.io/Nomogramsex/, https://fangcan.shinyapps.io/nomogramnosex/.
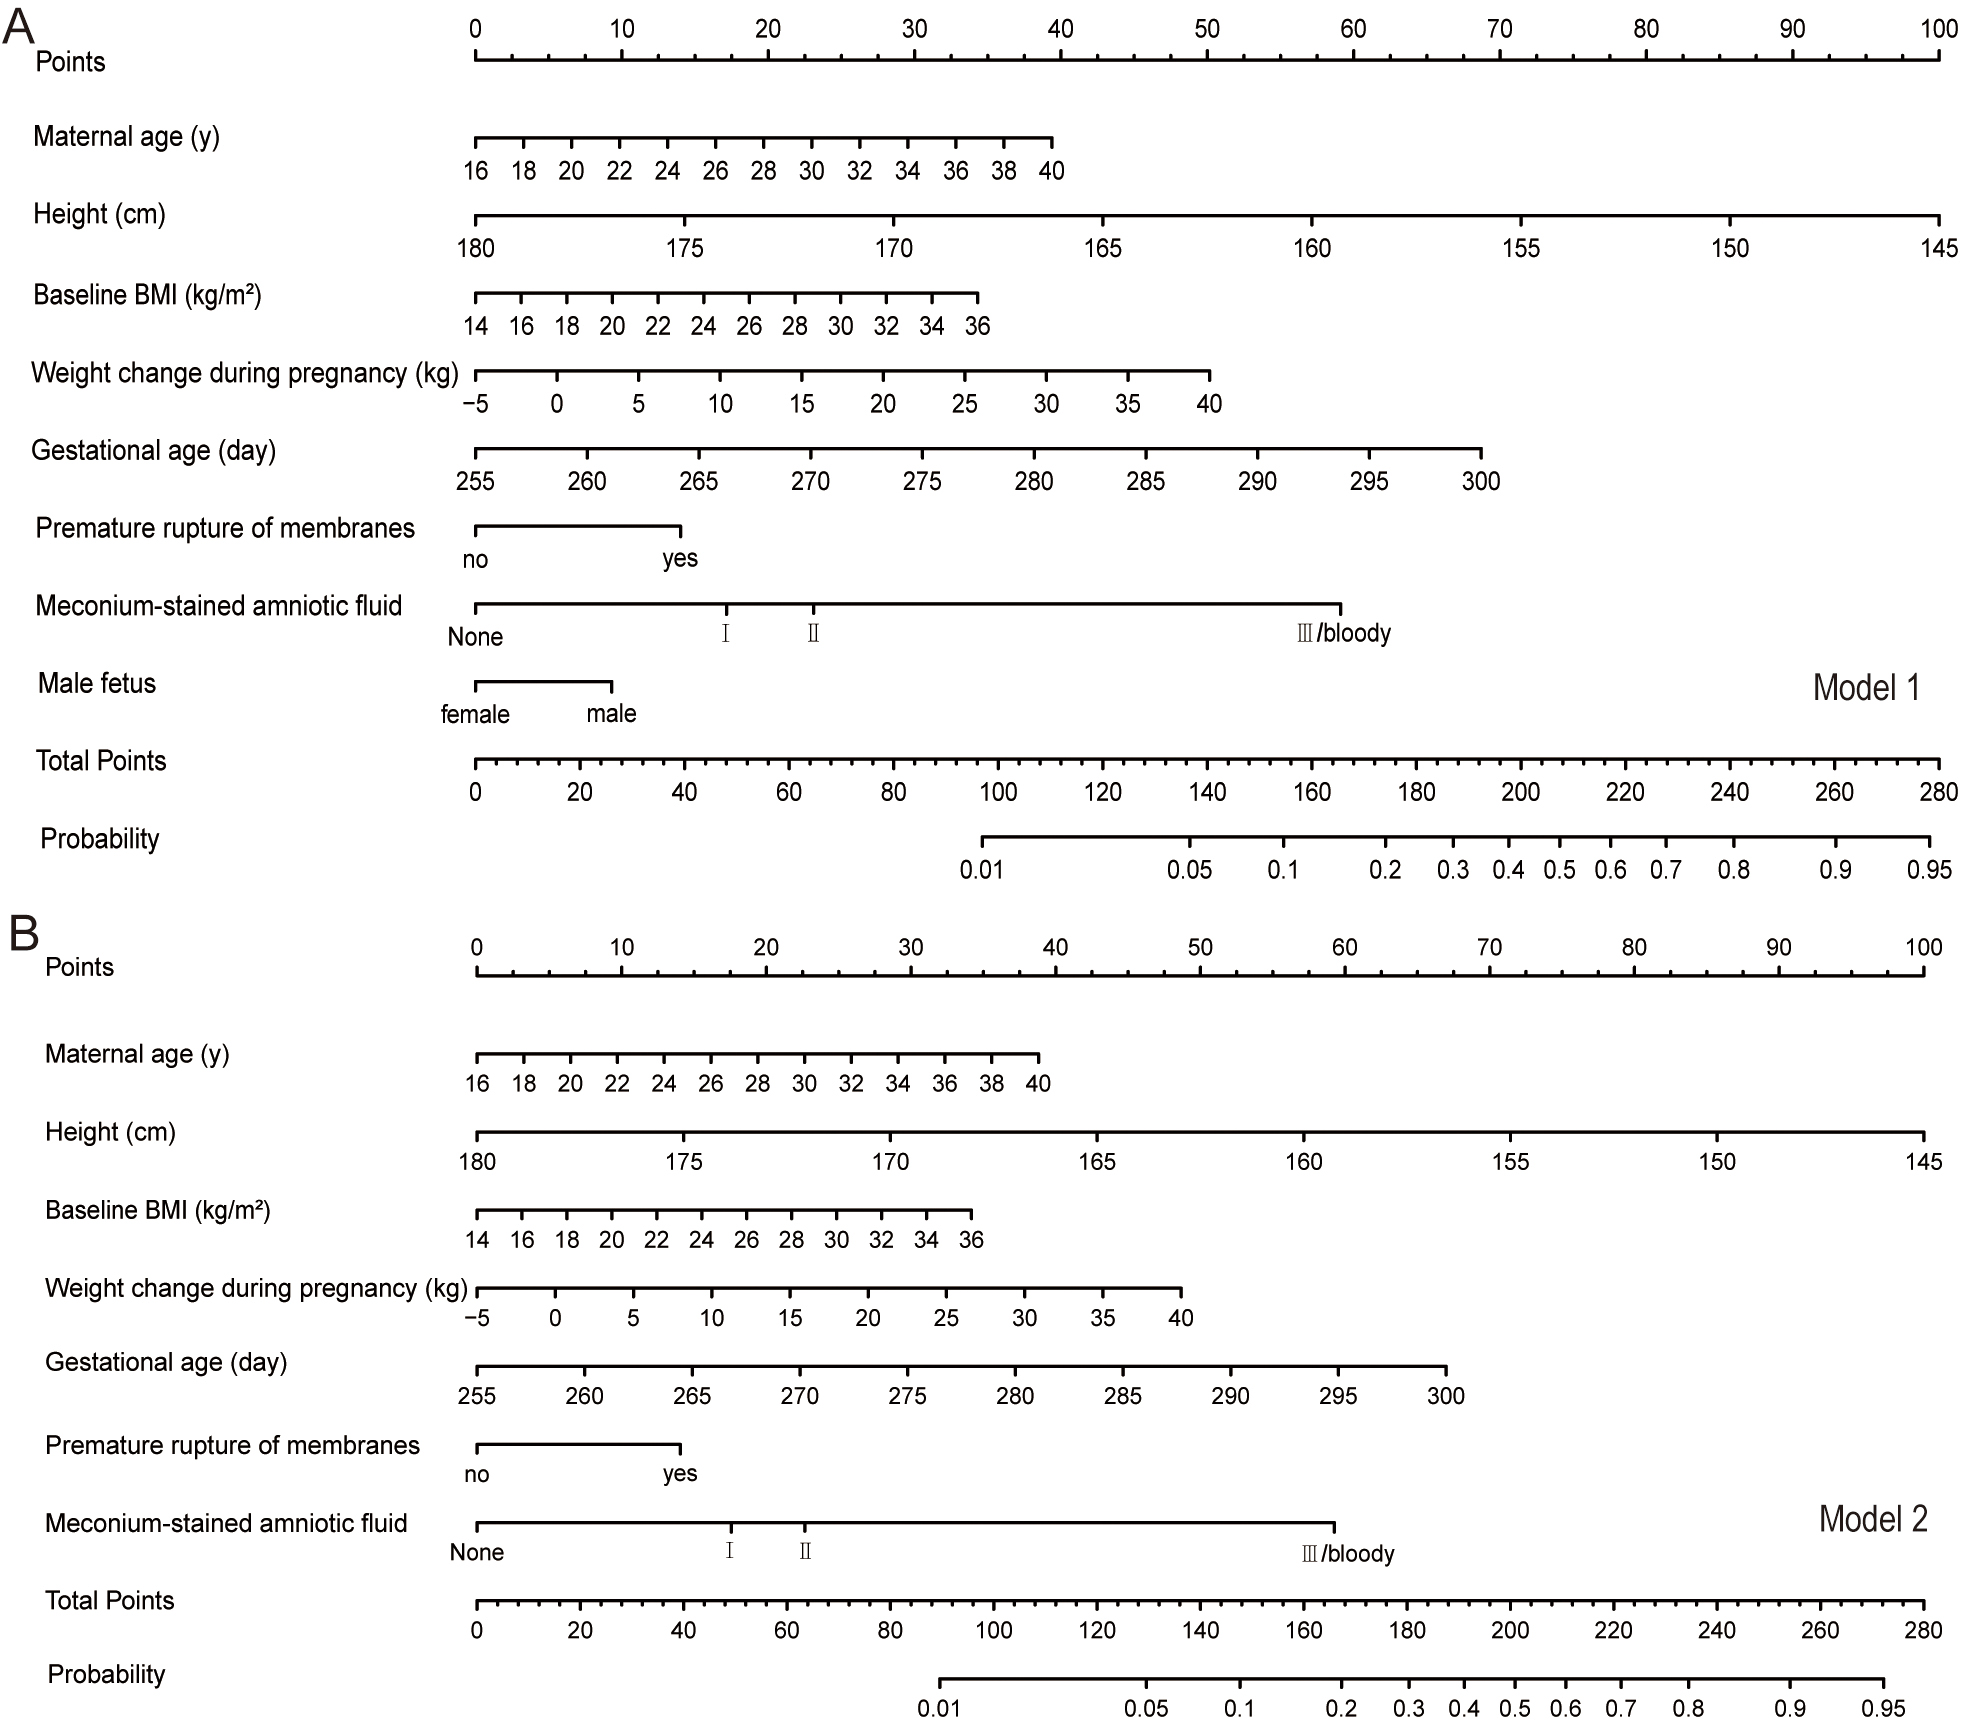 Fig. 3.
The nomograms of the two models. (A) The nomogram for Model 1 (B) The nomogram for Model 2.
Intrapartum cesarean delivery has been concerned by many researchers. This study was aiming to identify the predictors for cesarean experience among low-risk women and develop a clinical prediction model. The model allows physicians to assess the individual and systematic risks of pregnant women before childbirth. It can be used during counseling to increase acceptance of vaginal delivery for those with a high chance of success and to minimize procedures performed on women with low chances for a successful vaginal delivery. Screening for high-risk women and applying appropriate interventions may reduce the risk of adverse outcomes. To achieve the best outcomes for mothers and babies, medical staff need to provide the pregnant women with the proper suggestion of delivery.
The model highlight the importance of variables such as maternal age, maternal height, baseline BMI, gestational age, weight gain during pregnancy, degree of meconium-stained amniotic fluid, indicator for occurrence of premature rupture of membranes and male fetus in determining the cesarean delivery when women failed the trial of labor. These results are consistent with the existing literature on the risk of cesarean delivery [18, 24, 25, 26]. Past studies also found gestational age of induced labor and induction methods were related to the incidence of caesarean [27, 28]. The ethnic disparity was observed in cesarean delivery rates, Stark et al. [29] showed that the frequency of cesarean was lowest in non-Hispanic white women and highest in non-Hispanic black women. In addition, delivery time, clinicians’ personal beliefs and pregnant women themselves’ views of decision-making also have an impact on delivery mode [30, 31, 32].
Currently, given the maternal and fetal implications of intrapartum cesarean, a
number of prediction models aimed at determining the likelihood of cesarean
delivery had been developed. A study by Levine et al. [11] used a
nomogram to develop and validate a predictive model for women undergoing an
induction of labor with an unfavorable cervix. Nulliparity, BMI, gestation age
The applicability of these models to Chinese women is uncertain. At the same time, China is a yellow race and people are relatively thin and have a low BMI. To date, China lacks the studies in relevant researches. Therefore, based on the analysis of clinically relevant factors of existing prediction models and the Fertility Policy of China (fetal sex identification is prohibited), this study established risk prediction models suitable for low-risk pregnant women for cesarean delivery through the multivariable Logistic regression analysis. These prediction models discriminated well (Model 1: AUC was 0.755, Model 2: AUC was 0.748). Moreover, an external validation of women from another hospital was conducted, which demonstrated a consistent measure of discrimination with the AUC of 0.7576 (95% CI: 0.7311–0.7840) and 0.7578 (95% CI: 0.7313–0.7842), respectively. The results of external validation showed that our prediction model can be further extended to the data set of another research center, indicating that the application value of the model has been greatly expanded. The online web server was constructed based on the nomogram to facilitate clinical practice. Clinicians can carry out a risk assessment and provide appropriate suggestion on patients at any time through mobile phones.
To our knowledge, this is the first study to develop a model for predicting the likelihood of cesarean delivery in low-risk Chinese nulliparous women using maternal and fetal factors. These models still show good prediction ability in both internal and external validation populations. In particular, we performed external validation of the model using a separate dataset from another hospital in China, which was lacking in many studies. In addition, based on the statistical analysis, the nomograms and the software-based calculators were also created for individual risk assessment.
The limitation of this study may include the following aspects. Firstly, this study has a retrospective design. In addition, the definition of indications for intrapartum cesarean was not completely consistent. The study [33] found that the frequency of various indications for cesarean delivery changed over time. The decline in the rate of labor arrest widely exceeding the increase in the rate of nonreassuring fetal status. In settings where maternal age is higher, in vitro fertilization conception more common and local thresholds for intervention due to obstructed labor or non reassuring fetal status are different, the performance of their models may be different. In fact, it is difficult to unify or standardize labor standard in clinical practice. There will be individual differences among women and different interventions in labor. At the same time, the indication of intrapartum cesarean during labor is not only related to the progress of labor but also affected by pregnant women, fetuses, and medical staff. Then, the sample size of the study was relatively small, and the included subjects were only the single-centered population in the region. The selection of the population also targeted only low-risk nulliparous. Given the diversity of geography, economy, medical level and environment throughout China, our findings may not representative the Chinese population in many jurisdictions. Finally, the neonatal birth weight had been associated with an increased risk of cesarean, but it was not included in the final prediction model because it could not be accurately known before delivery. Further investigation of model validity and impact before generalizing is important and should be undertaken.
In conclusion, multivariable analysis showed that maternal age, height, baseline BMI, weight gain during pregnancy, gestational age, meconium-stained amniotic fluid, presence of PROM and fetal sex were independent risk factors for cesarean delivery in this study. These variables were used to develop a clinically useful calculator to predict an individualized patient risk assessment for intrapartum cesarean among low-risk nulliparous women at term. The adjustment in China’s family planning strategy and the release of the second-child policy and three-child policy have resulted in more pregnant women being faced with the choice of delivery mode. The prediction model established by these factors has a better prediction performance. Obstetricians and midwives can use the tool to predict which women will need surgery. Those who as high-risk women could be offered elective cesarean, which could avoid additional adverse effects. Those at low risk should be comforted and encouraged to adopt vaginal delivery. However, before implementing a model into clinical practice, it is important to demonstrate its benefits. Further study is warranted to optimize these models by conducting multicenter researches studies with large samples. It is worth noting that these models should be combined with the clinical practice of patients rather than applied in isolation. It provides evidence-based knowledge to support their delivery mode choices and to improve maternal and perinatal outcomes and to optimize the allocation of resources.
The datasets analyzed during the current study are not publicly available due to their containing information that could compromise the privacy of participants, but are available from the corresponding author on reasonable request.
FCS, FFW, YGC, MHS and BH designed the research study. FCS, FFW, HYC and QQS performed the research. YGC provided help and advice on data collection. FCS, HYC and QQS analyzed the data. FCS wrote the first draft of the paper. BH, MHS and FCS provided critical reviews and interpretation of the results. All authors contributed to editorial changes in the manuscript. All authors read and approved the final manuscript. All authors have participated sufficiently in the work to take public responsibility for appropriate portions of the content and agreed to be accountable for all aspects of the work in ensuring that questions related to its accuracy or integrity.
Institutional Review Board approval by The First Affiliated Hospital of Soochow University (2018019) and Sihong county People’s Hospital were obtained for the study waiving informed consent for this retrospective study.
Not applicable.
This project was supported by Natural Science Foundation of the First Affiliated Hospital of Soochow University (BXQN202222).
The authors declare no conflict of interest.
Publisher’s Note: IMR Press stays neutral with regard to jurisdictional claims in published maps and institutional affiliations.