
- Academic Editor
Background: This study aimed to evaluate the clinical significance of
maternal serum creatinine, cystatin C, and uric acid levels in relation to fetal
death in pregnant women with preeclampsia. Methods: This retrospective
study evaluated 708 women with preeclampsia, and 738 healthy pregnant women were
selected as control. Medical records were reviewed to collect obstetric,
neonatal, and biochemical data, including creatinine, cystatin C, and uric acid
concentrations. Results: Maternal serum creatinine, cystatin C, and uric
acid concentrations were significantly higher in the preeclamptic group than in
the control (p
Preeclampsia (PE) is the most common hypertensive disorder of pregnant women, with a morbidity of 3%–10% globally, causing significant maternal complications and fetal mortality [1]. In spite of this, the etiology of PE remains unclear; endothelial dysfunction and inflammation are thought to play a central role in its occurrence [2, 3].
Kidney damage is one of the key components of the pathophysiological process involved in PE [4]. Being of critical importance in blood pressure regulation via salt and water homeostasis [5], kidney function frequently deteriorates in patients with PE even before proteinuria is evident [6]. Renal blood flow volume and glomerular filtration rate (GFR) decreases by 30%–40% in preeclamptic patients, mostly due to tubular cell and podocyte dysfunction [7, 8]. Creatinine, cystatin C, and uric acid are common biomarkers of kidney function. The first two are significantly related to GFR [9] and uric acid is a useful indicator of pregnancy outcomes in preeclamptic patients [10, 11]. Although serum creatinine is a diagnostic indicator of renal injury, this biomarker only shows a significant increase when the GFR falls to at least 50% [12]. Cystatin C is produced by nucleated cells at a constant rate. It could be a promising biomarker for the detection of PE in the late stages of the pregnancy [13]. Additionally, it has the potential to predict preterm delivery in patients with severe PE [14]. Similarly, elevated uric acid levels are an early biomarker of kidney injury in women with PE and is a predictive factor of adverse fetal outcomes [15, 16].
Few studies have addressed their predictive value in relation to different trimesters and their variations during pregnancy remain unclear. Therefore, this study was designed to detect the inter-trimester variabilities and tendencies of serum creatinine, cystatin C, and uric acid concentrations in preeclamptic patients, to further evaluate the clinical implication of these biomarkers and their relationship to fetal death in preeclamptic women.
In this multi-center study, we reviewed the electronic medical records of pregnant women who underwent general physical examinations between December 2018 and December 2021 at the People’s Hospital of Guangxi Zhuang Autonomous Region, China. We selected 3340 total potentially eligible participants, including 784 pregnant women that diagnosed of PE as potentially eligible PE participants and 2556 healthy singleton pregnant women as potentially eligible controls. Data on 708 women with PE were collected after screening, and 738 randomized healthy pregnant women were selected from 2556 women as a control group. PE was defined as the new onset of hypertension and proteinuria after the 20th gestational week, or hypertension without proteinuria but with hematological complications, renal dysfunction, impaired hepatic function, and neurologic symptoms. The study protocol was approved by the ethics committee at the People’s Hospital of Guangxi Zhuang Autonomous Region, and the study was conducted in accordance with the Declaration of Helsinki.
Blood pressure was gauged using a mercury sphygmomanometer. A sustained systolic
blood pressure of
The body mass index (BMI) of women was calculated as kg/m
The cut off values for quartiles of uric acid levels in the study were
calculated by SPSS (software version 11.0, IBM Corp., Armonk, NY, USA) and
divided into four groups of data. For the first trimester: quartile I
Results are shown as numbers (%), mean standard deviation (
This study collected data from pregnant women who underwent examinations from 2018 and 2021 at the People’s Hospital of Guangxi Zhuang Autonomous Region. In 784 potentially eligible PE participants, 43 patients with pre-existing hypertension, nephropathy, tumors, or cardiovascular disease were excluded from the analysis. From the 741 included PE patients, 33 PE patients were lost due to invalid phone number, out of touch, or transferred to another hospital. Ultimately, 708 PE patients satisfied the research requirements of this study as a PE group. Of these, 38 preeclamptic women miscarried due to stillbirths in the second trimester.
We selected 2556 health singleton pregnancy women from electronic medical records and ordered them by alphabetical using the last names, and we randomly selected 738 healthy controls from them as a control group, randomized-selection was implemented with SPSS. The study’s recruitment process is shown in Fig. 1.
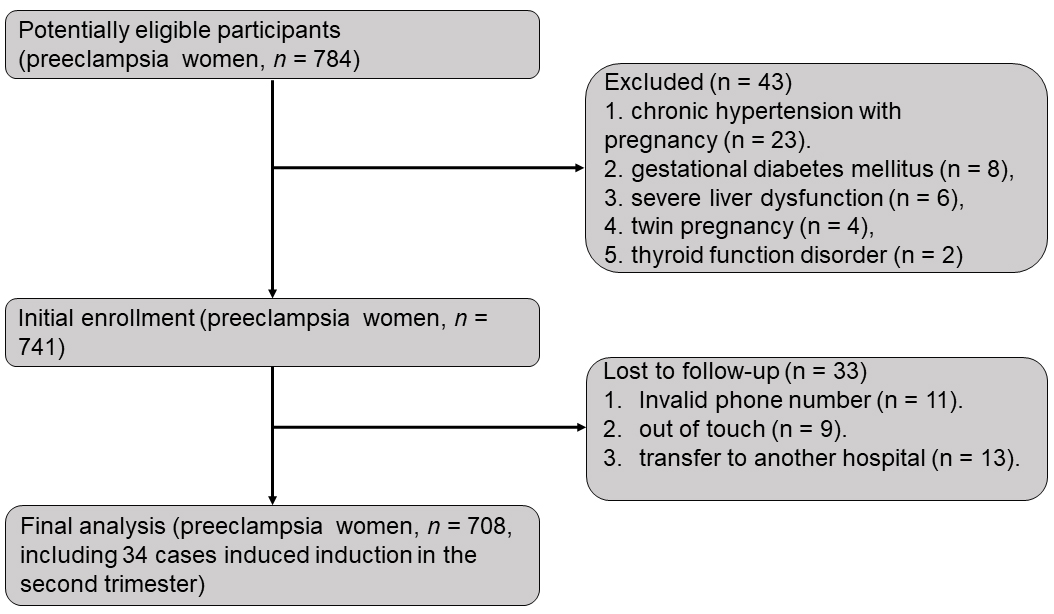 Fig. 1.
Flow chart of participants enrollment.
The clinical parameters of patients with PE and control patients are shown in
Table 1. Comparing the two groups, patients with PE had higher serum levels of
creatinine (p
| Preeclampsia | Control | p | ||
|---|---|---|---|---|
| N = 708 | N = 738 | |||
| Age (years) | 32.68 |
30.78 |
||
| Creatinine | ||||
| First trimester ( |
46.65 |
47.47 |
0.062 | |
| Second trimester ( |
52.71 |
48.91 |
||
| Third trimester ( |
62.77 |
48.68 |
||
| Cystatin C | ||||
| First trimester (mg/L) | 0.59 |
0.49 |
||
| Second trimester (mgl/L) | 1.00 |
0.73 |
||
| Third trimester (mg/L) | 1.37 |
0.95 |
||
| Uric acid | ||||
| First trimester ( |
263.00 |
225.00 |
||
| Second trimester ( |
339.96 |
264.58 |
||
| Third trimester ( |
436.29 |
337.15 |
||
| Gestational weight gain (kg) | 12.44 |
13.02 |
0.016 | |
| Body mass index (kg/m |
28.32 |
25.96 |
||
| Neonatal weight (kg) | 2.06 |
3.16 |
||
| Previous abortions | 1 (0, 2) | 0 (0, 1) | ||
| Parity | 0 (0, 1) | 1 (0, 1) | ||
| Gestational age at delivery (weeks) | 35.44 |
39.21 |
0.002 | |
| Adverse pregnancy history (n) | 63 (8.90%) | 17 (2.30%) | ||
| Fetal death (n) | 73 (10.31%) | 1 (0.14%) | ||
Data are shown as mean
The clinical characteristics of patients with PE are shown in Table 2. The fetal
death group had significantly higher serum creatinine levels during the second
(p
| Survival | Fetal death | p-value | ||
|---|---|---|---|---|
| N = 635 | N = 73 | |||
| Age (years) | 32.63 |
32.23 |
0.319 | |
| Creatinine ( |
||||
| First trimester | 46.44 |
48.43 |
0.091 | |
| Second trimester | 51.57 |
62.70 |
||
| Third trimester | 61.18 |
71.18 |
0.001 | |
| Cystatin C (mg/L) | ||||
| First trimester | 0.59 |
0.58 |
0.776 | |
| Second trimester | 0.99 |
1.06 |
0.045 | |
| Third trimester | 1.35 |
1.43 |
0.327 | |
| Uric acid ( |
||||
| First trimester | 260.04 |
288.74 |
0.002 | |
| Second trimester | 329.05 |
434.89 |
||
| Third trimester | 425.65 |
512.15 |
||
| Gestational weight gain (kg) | 12.88 |
8.59 |
||
| Body mass index (kg/m |
28.44 |
27.25 |
0.009 | |
| Neonatal weight (kg) | 2.21 |
0.80 |
||
| Previous abortions | 1.00 (0, 2) | 1.00 (0, 2) | 0.145* | |
| Parity | 0.00 (0, 1) | 1.00 (0, 1) | 0.930* | |
| Gestational age at delivery (weeks) | 36.24 |
28.53 |
||
| Adverse pregnancy history (n) | 53 (9.06%) | 10 (0.14%) | 0.130 | |
Data are shown as mean
The results of the paired t-test indicated that
creatinine,
cystatin C, and uric acid concentrations increased progressively in women with PE
throughout pregnancy in both the survival and fetal death groups (p
 Fig. 2.
The mean
ROC curves results revealed the significant ability of creatinine and uric acid
concentrations to predict the risk of fetal death (Fig. 2G,I). Besides, maternal
serum uric acid threshold that predicted fetal death at delivery in the second
and third trimesters were 390.5
The fetal death rate increased significantly with quartiles of uric acid
concentrations, from 6.67% to 18.08% in the first trimester, from 3.35% to
26.14% in the second trimester, and from 1.78% to 10.71% in the third
trimester (Fig. 3A,B). Fetal mortality in patients with PE that had a high serum
uric acid level was higher than in patients with low serum uric acid levels
during pregnancy (p
 Fig. 3.
The correlation between uric acid level and fetal death. Cases of survival and fetal death in patients with PE by quartiles of uric acid in pregnancy (A). Fetal mortality during pregnancy by quartiles of uric acid (B). Fetal survivorship curves in patients with PE by quartiles of uric acid during the first (C), second (D) and third (E) trimesters.
| Crude OR | Univariable Analysis | p value | Adjusted OR | Multivariable Analysis | p value | ||
|---|---|---|---|---|---|---|---|
| HR (95% CI) | HR (95% CI) | ||||||
| Age (years) | 0.95 | 0.92–0.99 | 0.024 | 0.91 | 0.83–0.99 | 0.024 | |
| Creatinine ( |
|||||||
| First trimester | 1.02 | 0.997–1.04 | 0.092 | - | - | - | |
| Second trimester | 1.04 | 1.03–1.05 | 0.99 | 0.95–1.03 | 0.739 | ||
| Third trimester | 1.02 | 1.01–1.03 | 0.002 | 0.99 | 0.97–1.03 | 0.738 | |
| Cystatin C (mg/L) | |||||||
| First trimester | 0.79 | 0.16–3.97 | 0.776 | - | - | - | |
| Second trimester | 2.07 | 0.99–4.33 | 0.054 | - | - | - | |
| Third trimester | 1.69 | 0.78–3.67 | 0.182 | - | - | - | |
| Uric acid ( |
|||||||
| First trimester | 1.01 | 1.00–1.01 | 0.001 | 0.99 | 0.99–1.00 | 0.049 | |
| Second trimester | 1.01 | 1.01–1.01 | 1.01 | 1.00–1.02 | 0.007 | ||
| Third trimester | 1.01 | 1.00–1.01 | 1.00 | 0.99–1.01 | 0.661 | ||
| Gestational weight gain (kg) | 0.81 | 0.76–0.86 | 0.95 | 0.86–1.04 | 0.240 | ||
| Body mass index (kg/m |
0.91 | 0.84–0.97 | 0.008 | 1.01 | 0.90–1.14 | 0.828 | |
| Neonatal weight (kg) | 0.02 | 0.01–0.05 | 0.08 | 0.03–0.26 | |||
| Previous abortions | 1.13 | 0.92–1.39 | 0.233 | - | - | - | |
| Parity | 1.42 | 1.00–2.01 | 0.048 | 2.72 | 1.37–5.40 | 0.004 | |
| Gestational age at delivery (weeks) | 0.62 | 0.57–0.68 | 0.97 | 0.82–1.15 | 0.706 | ||
| Adverse pregnancy history | 1.74 | 0.85–3.60 | 0.133 | - | - | - | |
OR, odds ratio; HR: hazard ratio; CI, confidence interval.
This study evaluated the predictive value of creatinine, cystatin C, and uric acid in pregnant women with PE, because they are the most widely used serum markers of renal function. Among our patients with PE, we found significantly higher levels of creatinine, cystatin C, and uric acid during their pregnancies compared to those observed in healthy controls. Calculations indicate a relationship between renal injury and PE. Moreover, preeclamptic pregnant women with fetal deaths had higher levels of creatinine during their second and third trimesters, higher serum cystatin C levels during the second trimester, and higher uric acid concentrations throughout pregnancy.
Elevated uric acid levels are caused by impaired renal clearance due to a decreased GFR and poor trophoblast invasion in women with PE. This promotes the production of lactic acid, which impairs uric acid excretion in the renal tubules [17]. Studies confirm that increased uric acid levels promote systemic hypertension, which subsequently induces kidney injury, vascular disease and endothelial cell apoptosis [18]. Uric acid can behave as a pro-oxidant molecule, leading to cellular oxidative damage in an antioxidant-depleted environment, where it plays a role in inflammation, oxidative stress, and endothelial dysfunction [19]. Hyperuricemia inhibits nitric oxide production in endothelial cells, leading to an abnormal trophoblast invasion and migration, and thus interferes with the circulation of nutrients and oxygen supply from the mother to the fetus [17]. Therefore, high levels of uric acid may affect the fetal prognosis in preeclamptic patients.
Previous studies have examined whether elevated uric acid concentrations in
pregnancy are related to adverse outcomes. High uric acid levels performed better
than creatinine in predicting low birth weight in Indian women [20].
Additionally, a study conducted in Korean
found that in women with PE, uric acid levels were a good predictor of preterm
birth and low birth weight [11]. Although Armando et al. [21] reported
that serum uric acid levels
In this study, ROC analysis indicated that only elevated creatinine and uric acid levels were predictive of fetal death. In contrast, cystatin C were poorly sensitive in this regard and proved to be of little utility for predicting fetal death, this indicates that a sustained increase in uric acid levels may lead to a higher risk of fetal death in patients with PE, and uric acid concentrations play different roles in predicting fetal death in different time points of the pregnancy. More importantly, we identified that inter-trimester variation is significant in patients with PE, so it is not appropriate to evaluate the prognostic value of uric acid levels only at specific time point in pregnancy.
Afterwards, the preeclamptic patients were divided into four groups based on quartiles of uric acid levels. Fetal death rates increased significantly with increased levels of uric acid during pregnancy, indicating that uric acid was related to fetal death in patients with PE. After adjusting for age, creatinine, gestational weight gain, BMI, parity and gestational age at delivery, multivariable logistic regression indicated that uric acid concentration was an independent risk factor associated with fetal death in patients with PE during the first and second trimesters, this study demonstrated that uric acid can affect fetal development in the first and second trimesters.
Previous studies showed that pregnant women with advanced maternal age were associated with an increasing proportion of adverse neonatal outcomes [24, 25], and the risk for stillbirth was substantially elevated among very high and extremely high parity women [26], these are consistent with the results of this study, indicating that maternal status may affect the development of fetus. The present study suffers from some drawbacks. It failed to account for maternal factors that might affect uric acid concentrations, such as dietary habits, alcohol consumption, smoking and medical interventions. These factors should be considered in future studies.
In conclusion, the present study confirmed that in Chinese patients with PE, increased levels of uric acid in the first and second trimesters were significantly related to fetal death, it is not appropriate to evaluate the prognostic value of uric acid levels only at specific time point in pregnancy. Future prospective studies should address the utility of serial uric acid monitoring in the management of patients with PE.
The datasets generated and analyzed during the current study are not publicly available due to patient privacy, but are available from the corresponding author on reasonable request.
Conception and design—JPJ and WYQ, provision of study materials or patients—JPJ, JLW, GFH, XFW and WYQ, collection and assembly of data—JPJ, JLW, JL, GFH and WYQ, data analysis and interpretation—JPJ, WYQ and GFH, manuscript writing—JPJ and WYQ.
The study protocol was approved by the ethics committee at the People’s Hospital of Guangxi Zhuang Autonomous Region (KY-KJT-2023-22).
We are grateful to the support of Department of Medical Laboratory of the People’s Hospital of Guangxi Zhuang Autonomous Region.
The Science Fund for Distinguished Young Scholars of the People’s Hospital of Guangxi Zhuang Autonomous Region, Grant/Award Number: QN2021-03 and QN2020-12.
The authors declare no conflict of interest.
Publisher’s Note: IMR Press stays neutral with regard to jurisdictional claims in published maps and institutional affiliations.