
- Academic Editor
Background: Females benefit from ultrasound screening and diagnosis of
breast cancer, and artificial intelligence has enabled the automatic
identification of medical conditions on medical imaging. Methods: This
study aimed to develop machine learning (ML) and deep learning (DL) models for
the detection and classification of breast cancer in a breast ultrasound image
(BUSI) and United States (US) ultrasound images datasets and to compare the
models’ performance to previous studies. The ultrasound scans were collected from
women between the ages of 25 and 75. The dataset contains 780 images with a
resolution of 500
Breast cancer is a disorder in which the cells of the breast proliferate uncontrollably. Breast cancer is one of the most often diagnosed cancers in women throughout the world [1, 2]. Breast cancer affects about 2.3 million people each year, making it the most frequent cancer among adults [3, 4]. On 3 February 2023, the World Health Organization (WHO) unveiled a new Global Breast Cancer Initiative Framework that provides a roadmap for achieving the aim of saving 2.5 million lives from breast cancer by 2040. To meet the objectives, the WHO framework advises that nations apply the three pillars of health promotion for early detection, timely diagnosis, and complete care of breast cancer. Breast cancer prevention and treatment is a critical public health concern in Sub-Saharan Africa. Breast cancer survival rates in Sub-Saharan Africa are abysmal at 40% five years following diagnosis, compared to over 90% in most high-income nations [3, 5]. Early breast cancer has a 90% probability of cure, but if it spreads to the lymph nodes or elsewhere, the chance of cure drops dramatically [6].
The chances of survival after being diagnosed with a malignant tumor are quite slim. Early identification of breast cancer in women can significantly minimize and/or mitigate its consequences. The breast’s complicated anatomy makes early disease identification more difficult. Manual cancer detection may be inaccurate. It should be noted that the invasive method of identifying breast cancer takes time. In recent years, researchers have developed non-invasive methods for detecting and screening breast cancer. Mammography and ultrasound images are two of the most common sources of data utilized in breast cancer investigation. The use of mammography for analysis and breast cancer detection [7], and computer aided diagnosis (CAD) [8] for breast cancer diagnosis have been developed. Breast images are captured using a low-dose X-ray in mammography. The shot is taken from several perspectives to aid in diagnosis. Breast ultrasound, on the other hand, is non-invasive and non-radiation in nature; it uses sound waves to obtain photos of the breast [9]. Several computer-aided design (CAD)-based frameworks are being created by various researchers in order to provide faster and more accurate identification.
Conventional machine learning (ML) and deep learning (DL) approaches are gaining popularity due to their promising results [10]. Zerouaoui et al. [11] developed deep hybrid heterogenous ensembles that combined the strength of seven deep learning techniques to classify breast cancer. Their research found that deep hybrid heterogeneous ensembles outperformed both singles and deep stacked ensembles in terms of accuracy. Their proposed deep hybrid heterogeneous ensembles can be used for breast cancer detection to help pathologists reduce missed diagnoses and offer appropriate therapies to patients. Furthermore, Islam et al. [12] examined five supervised machine learning algorithms to predict breast cancer: support vector machine (SVM), K-Nearest Neighbors (KNN), random forests, artificial neural networks (ANNs), and logistic regression. Their study utilized the Wisconsin Breast Cancer dataset in their analysis. Their findings showed that the ANNs had the best accuracy, precision, and F1 score.
Hou et al. [13] used 10 breast cancer risk indicators to analyze and compare the efficacy of four machine learning algorithms in predicting breast cancer in Chinese women. Reshma et al. [14] created an automatic segmentation approach that is then followed by self-driven post-processing activities to successfully identify the Fourier Transform based segmentation in the CAD system to improve its performance when it comes to the use of ML and DL models for classification and prediction of breast cancer in women. The performance of each ML and DL technique varies in phases depending on the dataset used. The classical DL techniques often require large amounts of data to aid in the training of the algorithms. It has been proven that, ML and DL have been utilized in detection and prediction of breast cancer in various domains. Furthermore, this paper presents the current state of development of a novel artificial intelligence (AI) framework for breast cancer classification. Some significant contributions in this study, as adapted from Afrifa et al. [15], are as follows:
(1) In this study, some conventional machine learning techniques are proposed for more accurate breast cancer classification.
(2) The study additionally proposes a classical deep learning model for more accurate breast cancer classification. In this case, a softmax activation function is used to improve the training models and accuracy estimations.
(3) Machine learning and deep learning models are employed to detect benign, malignant, and normal masses.
(4) Instead of using single observation performance, this study applies 10-fold cross-validation for fair performance analysis. In addition, four standard evaluation metrics were used to assess the models’ performance.
(5) The study employs a combination of quantitative and qualitative techniques to provide many viewpoints on the subject issue of breast cancer classification.
(6) It is a fresh contribution to the literature in that it proposes new AI models for breast cancer classification.
It should be noted that this study adds to the body of knowledge on breast cancer classification. Despite numerous research have been conducted in the domain of breast cancer classification, this study gives an improvement with similarities and differences of the utilized state-of-the-art models. This study suggests utilizing conventional machine learning and classical deep learning approaches to classify breast cancer. Table 1 (Ref. [12, 13, 16, 17, 18, 19]) summarizes the proposed model’s differences and similarities with previous research.
| Research | Year | Method utilized | Dataset | Dataset description |
| Islam et al. [12] | 2020 | Random Forest (RF), Support Vector Machine (SVM) | Wisconsin breast cancer data | Binary data |
| Hou et al. [13] | 2020 | Random Forest (RF) and Deep Neural Network (DNN) | West China Hospital of Sichuan University | Binary data |
| Jia et al. [16] | 2022 | Whale Optimization Algorithm and Support Vector Machine (WOA-SVM) | Wisconsin breast cancer data | Binary data |
| Nrea et al. [17] | 2022 | Convolutional Neural Network (CNN) | Breast mammograms | Binary data |
| Michael et al. [18] | 2022 | K-Nearest Neighbor (KNN), Support Vector Machine (SVM), Random Forest (RF) | Breast ultrasound images (BUSI) | Binary data |
| Gedam et al. [19] | 2023 | Naïve Bayes (NB), Random Forest (RF), Artificial Neural Networks (ANNs) | Wisconsin breast cancer data | Binary data |
| Proposed models | Random Forest (RF), K-Nearest Neighbor (KNN), Convolutional Neural Network (CNN) | Breast ultrasound images (BUSI) | Non-binary (benign, malignant, normal) |
The results in Table 1 show that the dataset used comprises non-binary breast ultrasound images; consequently, it contains benign, malignant, and normal masses in comparison to the state-of-the-art. Furthermore, the proposed models attempt to learn the dataset using conventional ML of RF and KNN, as well as classical DL of convolutional neural networks (CNN).
The remainder of the study is structured as follows: The methodological approach employed in this study is presented in Section 2. Section 3 follows directly after Section 2 and shows the results achieved from using the methodology used in this study, including both quantitative and qualitative outcomes. Section 4 contains the discussion, which explains the study in depth. The limitations of the sudy is presented in Section 5. Finally, Section 6 summarizes the study’s findings and future plans.
This section presents the method used in this study and the app achieve the results obtained for the analysis.
The present study made use of the publicly accessible Breast Ultrasound Images
(BUSI) dataset, that can be found at
https://scholar.cu.edu.eg/?q=afahmy/pages/dataset[20] and United States (US)
breast ultrasound images found at
https://qamebi.com/breast-ultrasound-images-database/[21], both of which were
accessed on May 1, 2023 and August 10, 2023 respectively. The ultrasound scans
(BUSI) were collected from women between the ages of 25 and 75. The data was
acquired in 2018 at Cairo’s Baheya Hospital for Early Detection and Treatment of
Women’s Cancer using a LOGIQ E9 ultrasound system and a LOGIQ E9 Agile ultrasound
[22]. There are 600 female patients in all. The data is divided into three
categories: normal, benign, and malignant. The dataset contains 780 images with a
resolution of 500
This study employs a framework for classifying the breast masses shown in Fig. 1. The BUSI and US ultrasound images data underwent several preprocessing stages, such as, image augmentation to improve the deep learning models’ performance and generalization capabilities for computer vision tasks. To facilitate quick training, the RGB (Red, Green, Blue) images were transformed to grayscale. As a result of the lower dimensionality, training models on grayscale images is often faster than training models on RGB images. It should be noted that converting RGB to grayscale is a typical preprocessing step in deep learning models, especially when color information is not critical or when lowering input dimensionality is crucial. Deep learning models might suffer from noise in the dataset. It can introduce inconsistencies, outliers, or irrelevant data from which the model can learn and generalize. The suspected noise in the dataset was removed so that the model could focus on the key patterns and characteristics in the data, resulting in increased performance and more accurate predictions.
 Fig. 1.
The proposed workflow of the study. *The classifiers are random forest (RF); K-Nearest Neighbor (KNN); and convolutional neural network (CNN).
Furthermore, feature extraction is an important stage in deep learning. This was done to enable automated learning of complex representations, reduce data dimensionality, improve computer efficiency, enhance transfer learning, promote generalization, and facilitate interpretability. The dataset was separated into training (70%) and testing (30%) sets after the data preparation phases. A percentage of the testing set (30%) was utilized to validate the models to be trained. The random forest (RF), K-Nearest Neighbor (KNN), and convolutional neural network (CNN) are the machine learning (ML) and deep learning (DL) classifiers utilized to train the dataset in this study. These artificial intelligence (AI) techniques were utilized to categorize breast masses as benign, malignant, or normal. Finally, the proposed models’ outputs were evaluated utilizing several evaluation metrics.
The preprocessing techniques used in this study are explained in the following subsections. Data preprocessing is the process of modifying and preparing data in order to make it more suited for the job at hand and to improve the performance of machine learning and deep learning algorithms [15]. Data preprocessing is critical for ensuring the quality, dependability, and efficacy of future analysis or modeling techniques [23]. Figs. 2,3 show the distribution of the BUSI and US ultrasound image datasets before augmentation. It is essential to note that the BUSI dataset is multiclass (normal, benign, and malignant), whereas the US ultrasound images dataset is binary (benign and malignant).
 Fig. 2.
The original distribution of the breast ultrasound image (BUSI) dataset.
 Fig. 3.
The original distribution of the United States (US) ultrasound images dataset.
Data augmentation is a technique for enhancing the training set artificially by making modified copies of a dataset from existing data [24]. Data augmentation is effective for improving the performance and results of machine learning models by generating additional and unique instances for training datasets. A machine learning model works better and more correctly when the dataset is rich and sufficient. The augmented approaches used in this study are re-scaling and rotation. The images are loaded and augmented using the Image Data Generator class in Keras version 2.13 (Google LLC, Mountain View, California, United States). These techniques were utilized to improve model prediction accuracy by incorporating additional training data into models and avoiding scarcity of data for better models [25]. Data overfitting is reduced, and data variability is created. Table 2 lists the Image Data Generator class parameters and their associated configurations.
| Parameter | Value |
| Rotation | 10° |
| Width shift | 2 pixels |
| Height shift | 22 pixels |
| Shear | 0.2 radians |
| Rescale | [0, 255] to [0, 1] |
| Fill mode | Nearest |
The data after augmentation in both the BUSI and the US ultrasound images are represented in Figs. 4,5. It is crucial to note that the datasets were adjusted to a maximum value of 500, which increased the decision threshold and allowed the classes to check for data imbalance throughout the augmentation stages.
 Fig. 4.
The augmented distribution of the BUSI dataset.
 Fig. 5.
The augmented distribution of the US ultrasound images dataset.
In image processing, grayscale removes all forms of color information, leaving just distinct shades of gray; the brightest being white and the deepest being black [26]. Its intermediate hues are generally as vibrant as the basic colors: red, green, and blue (RGB). The RGB primary colors’ average pixel values (ranging from 0–255) are merged. Each color band’s luminous intensity (24 bits) is blended into an acceptable estimated grayscale value (8 bits). The formula for converting RGB to grayscale is presented in Eqns. 1,2.
Grayscale conversion aids in the simplification of algorithms as well as the elimination of complications associated with processing needs.
The technique of reducing noise from an image is known as image denoising. The addition of noise will result in information loss. Image noise is a random change in the brightness or color information in acquired images [27]. The image is denoised using bilateral filtering, which takes into account the spatial proximity and intensity similarity of pixels. The aim of this filtering is to smoothen each image while preserving the borders and features by reducing the influence of distant or different pixels. Ardakani et al. [28] examined 67 denoising filters and chose the best one for ultrasound picture denoising. They concluded that the Spatial correlation (SCorr) filter produced the greatest results, much superior than the other nine filters. However, the bilateral filter was employed since, according to Feng et al. [29], breast lesions segmentation had the maximum performance among eight filters when image denoising was performed. The Eqn. 3 represents the mathematical formula of noise in an image.
Where
The process of converting raw data into numerical features that may be processed while keeping the information in the original data set is referred to as feature extraction. The purpose of feature extraction is to minimize the number of features in a dataset by producing new ones from existing ones (and subsequently eliminating the original ones) [30, 31]. The image generator is used to iterate through batches of 32 images for feature extraction. The mask image is loaded and applied to the original image for each image in a batch, resulting in a masked image. The masked image is added to a list of batch features, which is then transformed to an array and added to a list of all features. A list of all labels is added with batch labels. All feature and label arrays are concatenated and molded into a single array. Deep learning models can learn complex representations from raw data automatically.
The model can use feature extraction to turn the input data into a more relevant and informative representation. In this study, extracted features such as corners, edges, areas of interest points, and ridges are input into model classifiers adapted from a study by Sun et al. [32]. However, feature reduction was employed to finish computing operations in order to accomplish model functions. The model may capture the underlying patterns and structures in the data by extracting key features, allowing for more effective learning and prediction.
In this study, three artificial intelligence techniques are employed to train the dataset to classify breast masses as benign, malignant, or normal: random forest, K-Nearest Neighbor, and convolutional neural network. It should be stressed that optimization is an important part of model training. The goal of optimization is to reduce the risk of mistakes or loss from these forecasts while also improving the model’s accuracy [33]. Depending on the dataset and the complexity of the task at hand, optimization strategies may differ. The hyperparameter and validation strategies were employed to optimize the models in this study. The 60% training, 20% validation, and 20% testing hyperparameter approach is used. To evaluate the model’s performance and prevent overfitting, 5-fold cross validation was used. The 5-fold aids in estimating the model’s generalization capabilities.
The breast masses in the dataset were classified using the machine learning approach random forest (RF). The variable space of each decision tree in the RF is partitioned into a smaller subspace, resulting in data that is as homogeneous as possible throughout each zone [34]. To increase classification or regression accuracy, the RF fits a variety of decision trees using subsamples from the entire data set [35, 36]. The RF concept is that multiple individual predictors each forecast insufficiently in different conditions, and that by combining the prediction outputs of the independent predictors, total prediction accuracy may be increased.
K-Nearest Neighbor (KNN) is a classic machine learning (ML) algorithm that employs the supervised learning methodology. The KNN algorithm assumes similarity between new and existing data and assigns new data to the category most similar to the existing categories [37]. The KNN algorithm preserves all existing data and classifies new data points based on similarity. This means that as new data is received, it may be promptly sorted into a suitable category using the KNN algorithm.
A CNN is a deep learning system that can take an input image, assign importance (learnable weights and biases) to separate aspects/objects in the image, and identify one from the other [10]. The CNN was used to classify the breast masses in the present study. The visual geometry group network (VGGNet) architecture, notably the VGG16, was used by the CNN. The CNN architecture includes convolutional and max-pooling layers. The softmax activation function was utilized, with a regularization of a = 0.0001 and a maximum iteration of 10. Softmax is an activation function that is often employed in the output layer of CNNs, particularly for multi-class classification problems [38]. The softmax function was chosen because of the data’s multi-class classification, which included normal, benign, and malignant. This turns raw scores (logits) into meaningful probabilities, allowing the model to make informed decisions about which class is the most likely label for a particular input instance.
Summary of the CNN Classifier
With the sequential model, the CNN used convolutional layers and max-pooling layers. After the convolutional layers were completed, the data was flattened to generate three completely connected layers for output with the softmax activation function. The entire number of parameters is 14,789,955, but only 75,267 are trainable, and the remaining parameters are utilized using VGG16 pre-trained values. The CNN utilized in the study has two convolutional layers, two max pooling layers, two dropout layers, a flatten layer, and two fully connected layers.
By minimizing overfitting, fostering robust feature learning, and quickly managing enormous and convoluted models, the two dropouts are critical tools for boosting the performance and generalization capabilities of CNNs [39]. The first dropout reduces noise from the feature maps, while the second is used to control the entire CNN architecture for better output. Furthermore, the flattened layer reshapes the spatially organized feature maps into a one-dimensional vector that fully connected layers may utilize to make predictions. This flattened representation is required in the network’s design to connect the convolutional layers to fully connected layers. Finally, the fully connected layers classify the images thus identifying the breast masses. The fully connected layer makes final predictions based on the hierarchical features learned by the convolutional and pooling layers [40]. A visualized version of the CNN architecture is shown in Fig. 6.
 Fig. 6.
Visualized view of the CNN architecture.
Model evaluation is critical since it measures a classifier’s performance as a generic model [41]. The purpose of a performance evaluation is to measure a model’s generalization accuracy on unseen/out-of-sample data [42]. Accuracy, precision, recall, and Receiver Operating Characteristics (ROC) are among the performance evaluation measures utilized. Tenfold cross validation was used to validate the dataset. The accuracy, precision, and recall are represented by Eqns. 4,5,6, respectively.
Where true positive (TP), true negative (TN), false positive (FP), and false negative (FN) values. The area under the curve-receiver operating characteristics (AUC-ROC) curve is a classification performance statistic with variable threshold values. The AUC is a measure of separability, whereas the ROC is a probability curve. The ROC curve is plotted as a function of true positive rate (TPR) vs. false positive rate (FPR), with TPR on the y-axis and FPR on the x-axis. The flowchart of the proposed method from start to end, taking into account the phases involved in achieving model classification results and performance assessments, is shown in Fig. 7.
 Fig. 7.
Flowchart of the proposed workflow.
Breast ultrasound images consisting of benign, malignant, and normal images. The dataset’s classes were used to train the convolutional neural network deep learning model, as well as the random forest and K-Nearest Neighbor machine learning models. The models performed better in terms of accuracy and performance assessment measures. The classification of breast ultrasound images (dataset) is displayed (Fig. 8).
 Fig. 8.
Classification of the BUSI dataset.
The study used a non-binary (benign, malignant, and normal) data description in the training of the proposed models, which included random forest, K-Nearest Neighbor, and convolutional neural network. The performance scores of the models used in this study are shown in Table 3 below. The presented findings are the outcome of training models based on the techniques employed. These classifiers were trained using the models and evaluation scores described in the deep learning and machine learning classifiers and their accompanying evaluation metrics. The Google Colaboratory (Colab) platform is used to train the models. The Google Colab assists in the creation and execution of arbitral decisions and is well-suited to ML and DL, data analysis, and education.
| Models | Accuracy | Precision | Recall |
| CNN | 0.9610 | 0.9724 | 0.9412 |
| RF | 0.6146 | 0.4966 | 0.4987 |
| KNN | 0.6439 | 0.3220 | 0.5800 |
Table 3 shows that the CNN achieved the highest accuracy with 0.9610, followed by the KNN with 0.6439. With 0.6146, the RF had the worst performance. Furthermore, the CNN obtained significant precision (0.9724) and recall (0.912) values. The results reveal that deep learning outperforms conventional machine learning techniques in training image datasets. The results obtained from the three models used in this study are summarized in Fig. 9.
 Fig. 9.
Summary outcomes of the models in the BUSI dataset.
Additionally, the receiver operating characteristics (ROC) of the models were calculated for each of the artificial intelligence models. The Receiver Operating Characteristics (ROC) scores are used to assess the efficacy of the models. The ROC score is a well-known machine learning assessment metric. The capacity of a classification model to differentiate between the breast masses data across numerous classification criteria is measured by the ROC. Figs. 10,11,12 show the ROC values for CNN, RF, and KNN, respectively. At various classification thresholds, the ROC shows the true positive rate (TPR) vs. the false positive rate (FPR). Based on the training sets, the CNN had a ROC value of 0.99, the RF had a ROC value of 0.85, and the KNN had a ROC value of 0.56.
 Fig. 10.
Receiver operating characteristics (ROC) values of the CNN classifier in the BUSI dataset.
 Fig. 11.
ROC values of the RF classifier in the BUSI dataset.
 Fig. 12.
ROC values of the KNN classifier in the BUSI dataset.
From the Fig. 10, it can be observed that, the CNN classifier achieved a value of ROC = 0.99 in terms of the training and validation sets. The ROC score shows that the model achieved their best discrimination between classes, which means that it properly categorized all positive examples with no false positives. It should be noted that the data used in this study is well labeled and free of imbalances. Other evaluation metrics were utilized to examine the model’s performance in order to determine these values. This is evident when compared to the precision and recall values obtained by the CNN classifier in Table 3.
Furthermore, the ROC values obtained in Fig. 11 illustrate the distribution of the RF model. The validation ROC score for the RF is 0.54 while the training ROC value is 0.85. During the model’s training operation, the RF attained critical thresholds. It is also important to remember that a ROC of 0.5 or more is considered noteworthy in all circumstances [10]. This means that the RF did well in classifying the breast masses in all cases.
In the case of the KNN model (Fig. 12), the model attained crucial values of more than 0.5 in the ROC, indicating that the model can differentiate between the classes and is superior to random guessing.
The ROC score is less impacted by unbalanced class distributions than other measures such as accuracy. When one class dominates the dataset, accuracy can be deceiving, but ROC provides a more reliable judgment. It is important to recognize, however, that the ROC score has a few drawbacks. Table 4 presents the ROC curve values for the models’ training and validation outcomes. The CNN earned the highest ROC value in both the training (0.99) and validation (0.99) sets. The RF had the second-best ROC score in the training set but the worst fared in the validation sets is to the KNN (0.48).
| Models | Training ROC | Validation ROC |
| CNN | 0.99 | 0.99 |
| RF | 0.85 | 0.50 |
| KNN | 0.81 | 0.48 |
A range of assessment metrics were utilized in this study to provide a full understanding of models’ performance. This approach provides vivid understanding of model performance in the study of machine learning and deep learning. Table 5 shows the performance of the ML and DL on US ultrasound image datasets. It is clear that the CNN had the greatest accuracy of 0.8251, followed by the KNN with 0.7557. The RF had the lowest accuracy (0.6602). Furthermore, the models attained significant recall and precision values. It should be noted that the models utilized in this study can train both multiclass and binary class datasets. The capacity of the models to survive data imbalance and overfitting in all parts of the training models is what makes them unique.
| Models | Accuracy | Precision | Recall |
| CNN | 0.8251 | 0.8253 | 0.8251 |
| RF | 0.6602 | 0.6670 | 0.6624 |
| KNN | 0.7557 | 0.8386 | 0.7494 |
The ROC of the training and validation sets for the CNN, RF, and KNN models in the US ultrasound images dataset is shown in the Figs. 13,14,15.
 Fig. 13.
ROC values of the CNN classifier in the US ultrasound images dataset.
 Fig. 14.
ROC values of the RF classifier in the US ultrasound images dataset.
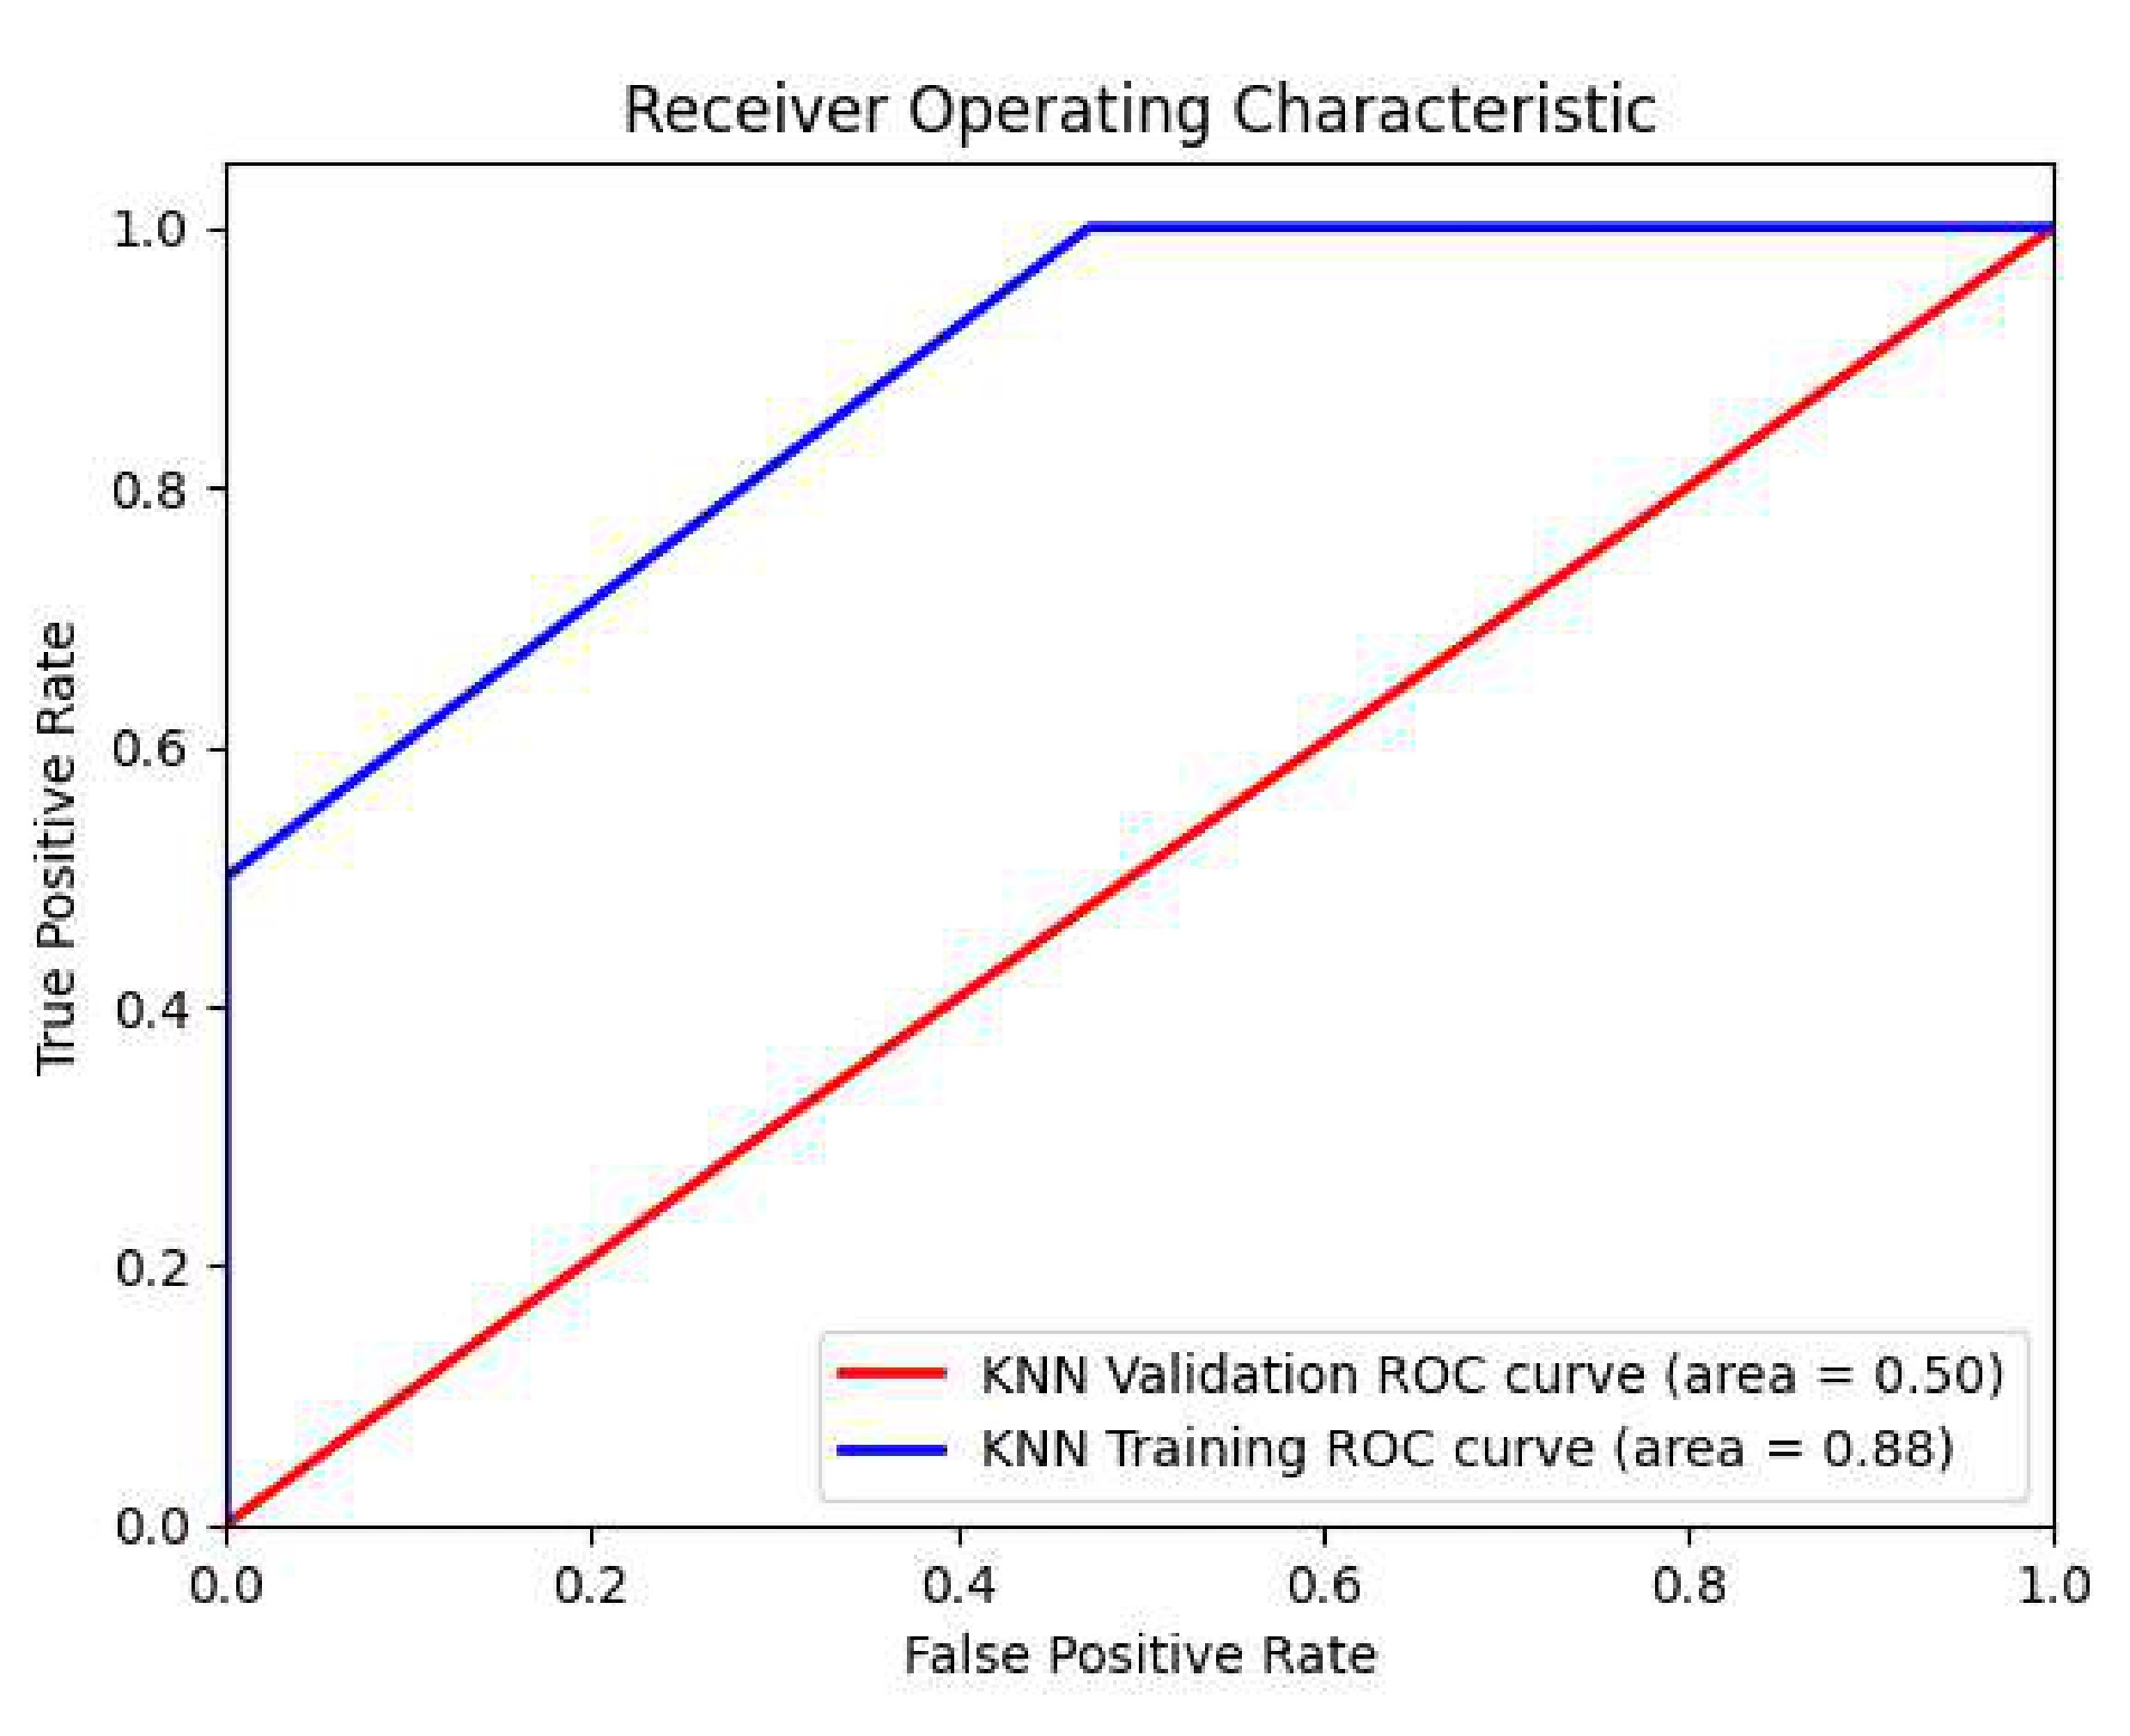 Fig. 15.
ROC values of the KNN classifier in the US ultrasound images dataset.
Table 6 summarizes the ROC for the CNN, RF, and KNN models in the US ultrasound images dataset.
| Models | Training ROC | Validation ROC |
| CNN | 0.91 | 0.88 |
| RF | 0.76 | 0.48 |
| KNN | 0.88 | 0.50 |
The CNN, RF, and KNN models were therefore trained using the Google Colab platform using Python software version 3.11.4 (The Python Software Foundation (PSF), 1209 Orange Street, Wilmington, DE, USA). The installed Random Access Memory (RAM) is 12.0 gigabytes (GB), and the operating system is 64-bit. Table 7 provides a tabular representation of the system specs and experimental settings used to reach the results.
| Processor | 11th Gen Intel(R) Core(TM) i5-1155G7 @2.50Ghz 2.50GHz |
| Installed Random Access Memory (RAM) | 12.0 Gigabyte (GB) |
| System Type | 64-bit operating system |
Our experimental system consists of five nodes, each with an Intel(R) Core(TM) i5-1155G7 @ 2.50GHz, eight cores, and twelve gigabytes of RAM. The platform stack is made up of the Google Colab platform. In these studies, we have one master and up to four slaves. We developed a series of tests based on the system’s hardware limits. The product of ‘number of cores per executor’ and ‘number of executors’, for example, can range from 1 to the maximum number of cores in the cluster. Table 8 shows the experimental configurations used to acquire training data. We created and evaluated AI prediction models of three sorts, namely CNN, RF, and KNN, with data volumes ranging from 5 GB to 15 GB. A windows bash script runs each application for each of the parameter values listed in Table 8. A few possibilities are incorrect owing to resource mismatches and are thus skipped. We could gather around 400 data points as a training set for each application in order to create the AI models.
| Configuration parameter | Minimum value | Maximum value |
| Number of executors (-num-executor) | 2 | 10 |
| Number of cores per Executor (-executor-cores) | 1 | 8 |
| Executor memory (-executor-memory) | 1 | 12 |
| Data size | 1 GB | 15 GB |
Breast cancer is a major health problem for women all over the world. Early identification and preventative actions are critical in lowering the disease’s effect. Women can take important precautions to protect their breast health. This study shows some qualitative empirical performances to lessen the consequences of breast cancer in women. To begin, knowing one’s family history and personal risk factors is critical to taking charge of breast cancer prevention. Women should enquire about their family’s medical history, particularly about breast cancer, and share this information with their healthcare professional. Women who are aware of their risk factors are better able to make educated decisions and take preventative steps. Women are urged to follow a healthy lifestyle after learning about their family history of breast cancer as a proactive start toward minimizing their chance of having breast cancer. Women can actively lower the likelihood of breast cancer incidence by cultivating a healthy lifestyle. Regular physical exercise aids in weight control and adds to a healthy body mass index (BMI) [13]. Limiting alcohol use, not smoking, and limiting exposure to environmental contaminants all help mitigate the risk.
In addition, women are advised to practice breast self-examination (BSE) as a simple yet powerful technique for monitoring changes in their breast health [16]. By conducting BSE on a regular basis, women become acquainted with the usual appearance and feel of their breasts, allowing them to detect any abnormal changes quickly. To guarantee consistency and accuracy, BSE should be tested periodically, ideally a few days after menstruation. Women can take an active role in their breast health by incorporating BSE into their routine, as well as visiting healthcare professionals for clinical breast examination (CBE) to provide an additional layer of assessment and expertise. It should be noted that the researchers in this study are not health practitioners; however, they use technological tools to train health data, as well as experience and encounters with women in community services, recommend the aforementioned approaches to mitigate breast cancer risk. Remember that these are basic guidelines, and women should speak with their healthcare professionals to build a tailored strategy based on their unique risk factors and medical history.
Every year, breast cancer kills hundreds of women. Manual breast cancer diagnosis is time-consuming, difficult, and prone to error. Several imaging approaches are being investigated for the diagnosis of breast cancer. This study used machine learning and deep learning approaches to classify breast cancer using a dataset of breast ultrasound images. In addition, the dataset was divided into training, testing, and validation sets to aid in data analysis. To aid in model training, the dataset was subjected to certain data preparation techniques. Random forest, K-Nearest Neighbor, and convolutional neural network models were used in this study. The models excelled in terms of accuracy, precision, recall, and ROC. To train the datasets, this study applies cutting-edge approaches. In terms of accuracy and model performance, CNN performed better in categorizing breast cancers as benign, malignant, or normal. Deep learning approaches outperform contemporary machine learning models in classifying BUSI datasets, according to this study. The findings of the study outperformed those of Jabeen et al. [43], Raza et al. [38], and Balaha et al. [44] in a comparable study that also used the BUSI dataset. It should be noted that Balaha et al. [44] constructed an abstract CNN and proposed a hybrid DL and genetic algorithm (GA) (HMB-DLGAHA). Table 9 (Ref. [38, 44, 45, 46, 47, 48]) provides an overview of known approaches for breast cancer classification. It should be noted that the findings of this study outperformed the performance of the approaches (state-of-the-art) summarized in Table 9.
| Reference, Year | Methods | Features | Dataset | Performance |
| Raza et al. [38], 2023 | CNN | Deep Learning (DL) | Breast Ultrasound images (BUSI) | 95.90% |
| Sirjani et al. [45], 2023 | DL with multicenter evaluation | Deep Learning | BUSI | 95.60% |
| Sahu et al. [46], 2023 | CNN and Hybrid-CNN | Deep Learning | BUSI | 94.50% |
| Boumaraf et al. [47], 2021 | CNN with VGG19 | Conventional machine learning (ML) and DL | BUSI | 95.00% |
| Sadad et al. [48], 2020 | Hilbert transform and Watershed | Hybrid ML | BUSI | 96.00% |
| Balaha et al. [44], 2022 | CNN and HMB-DLGAHA | Hybrid DL | BUSI | 90.00% |
| Proposed Model | CNN with VGG16 | Conventional ML and DL | BUSI | 96.10% |
HMB-DLGAHA, hybrid DL and genetic algorithm; VGG, visual geometry group.
Breast cancer is common among women, and reducing the chance of getting the illness should be a top priority for all females globally. Knowing one’s family history and personal risk factors, in addition to prioritizing BSE and CBE techniques, is critical for taking charge of breast cancer prevention. Remember that each woman’s situation is unique, so work with your healthcare practitioner to establish a tailored strategy based on your own risk factors and medical history. Women may help reduce the risk of breast cancer and increase overall well-being by taking preventive actions, remaining educated, and prioritizing their breast health.
The study produced an enhanced version of the breast cancer disease classification. However, there are certain limits that should be mentioned. To begin, the data used in this study are secondary, and more data from other regions will aid in model applicability. Furthermore, the performance of classifiers, including the deep learning model, may be enhanced. It should be noted that, due to dataset constraints, we only tested a small number of deep learning and machine learning models. More work can be done to contribute to higher-performing classifiers, which will lead to higher detection performance using the present framework.
Breast cancer is a prevalent disease in women that affects a large number of them. Women’s mortality rates will be reduced if breast cancer is detected early. For classifying breast ultrasound images, this study offered automated machine learning and deep learning algorithms. The proposed method included a series of actions. The breast ultrasound image data was initially submitted to data preprocessing procedures. To begin, the data is augmented to aid in model training and to address data imbalance. The data was then transformed to grayscale from red, green, and blue (RGB). Furthermore, anticipated noise was eliminated, and features were extracted from the dataset. The selected features are then utilized to train the models used in the study. Random forest, K-Nearest Neighbor, and convolutional neural networks were used in this study. A number of experiments were carried out, and the presented models produced significant results. The random forest obtained 61.46% accuracy, the K-Nearest Neighbor achieved 64.39% accuracy, and the convolutional neural network achieved 96.10% accuracy. The models also excelled in terms of accuracy, recall, and receiver operating characteristics. The study’s findings demonstrated that deep learning approaches outperform conventional machine learning in classifying image datasets. When compared to current research (state-of-the-art), the findings obtained using the proposed approach demonstrate an improvement. In the future, we hope to expand the collection by gathering primary breast cancer data. Support vector machine (SVM), naïve bayes (NB), least short-term memory (LSTM), and hybrid convolutional layers will be used to train this dataset. The hybrid-CNN architecture would be created by mixing CNN and LSTM networks, with CNN extracting complex features from images and LSTM acting as a classifier. Furthermore, ensemble and hybrid types of conventional machine learning will be employed to train the dataset.
AI, artificial intelligence; ML, machine learning; DL, deep learning; CAD, computer aided design; CT, computed tomography; BUSI, breast ultrasound image; KNN, K-Nearest Neighbor; RF, random forest; CNN, convolutional neutral network; ROC, receiver operating characteristics.
The dataset used in this study is publicly available via the link https://scholar.cu.edu.eg/?q=afahmy/pages/dataset (Accessed: 1 May 2023) and https://qamebi.com/breast-ultrasound-images-database/ (Accessed: 10 August 2023).
SA, TZ, VV, and PA provided the research conceptualization. SA performed the data curation. TZ, VV, and PA supervised the study. VV, TZ, and PA provided help and advice on the study experiments. SA and PA provided the visualization. VV and TZ provided funding and resources. SA analyzed the data. All authors contributed to the editorial changes in the manuscript. All authors read and approved the final manuscript. All authors have participated sufficiently in the work and agreed to be accountable for all aspects of the work.
Not applicable. It used an identified publicly accessible data set of images, and as such IRB approval is not required.
The authors are grateful to Adwoa Afriyie and Eric Afrifa for their encouragement and advice throughout the study.
This research received no external funding.
The authors declare no conflict of interest.
Publisher’s Note: IMR Press stays neutral with regard to jurisdictional claims in published maps and institutional affiliations.