
- Academic Editor
Background: Exosomes, harboring donor-cell-derived biomarkers, are implicated in transferring oncologic protein and genetic materials. CD200, an immune checkpoint, has been engineered to affect immunosuppression in ovarian cancer. However, the potential of CD200 to serve as a predictor of ovarian cancers remains unexplored. Methods: We performed dynamic measurements of exosome-mediated or serum CD200 levels at primary diagnosis, post-operation, and three cycles after chemotherapy. The receiver operating characteristic curve and cumulative survival rate were paralleled to decode the predictive and prognostic profiles. Results: Independent enrichment and identification of exosomes revealed a significant concentration of CD200, predominantly located within these exosomes. The CD200 level was elevated in non-responders compared to responders at the serial points and significantly decreased after treatment. At the 335.50 pg/mL cut-off, CD200 at primary diagnosis enabled accurate discrimination between responders and non-responders with an area under the curve (AUC) of 0.94 (95% confidence interval (CI) = 0.902–0.979, p = 0.01). With the cut-off dropping from 311.00 pg/mL to 265.00 pg/mL, the AUC decreased from 0.918 (95% CI = 0.873–0.963, p = 0.02) to 0.908 (95% CI = 0.862–0.955, p = 0.02), respectively. Elevated levels of CD200 levels at both primary diagnosis and three cycles after chemotherapy were identified as independent predictors for poor progression-free survival (PFS) (hazard ratio (HR) = 2.8, 95% CI = 2.08–3.49, p = 0.01; HR = 6.7, 95% CI = 4.01–8.02, p = 0.01, respectively) and overall survival (OS) (HR = 3.5, 95% CI = 2.14–4.99, p = 0.04; HR = 5.6, 95% CI = 3.01–7.34, p = 0.01, respectively). Based on CD200 dynamics, patients were stratified into high- and low-AUC groups. High CD200-AUC was independently associated with unfavourable PFS and OS (HR = 4.6, 95% CI = 3.6–15.7, p = 0.01; HR = 3.2, 95% CI = 1.5–6.3, p = 0.01, respectively). Conclusions: This study proposes high exosome-mediated CD200 as a liquid-based biomarker indicative of chemotolerance and dismal survival in ovarian neoplasms.
Advanced high-grade serous ovarian cancer (HGSOC), the most lethal subtype of gynaecological malignancy, ranks as the seventh most commonly diagnosed tumor among women [1]. Approximately 230,000 cases are recorded and 15,000 deaths are documented, annually [2]. Primary debulking or radical resection, complemented by neoadjuvant or adjuvant therapy such as platinum-based chemotherapeutics, has become a backstone in managing ovarian neoplasms, with widespread adoption and utilization. Despite this, the advanced stage presents a rate of 29% of 5-year survival, in contrast to 92% in the early stage [3]. Patients defined as platinum-resistant, experiencing relapse within six months post-chemotherapy, exhibited a significant decrease in overall survival (OS) of approximately 12 months, as well as dismal progress-free survival (PFS) of about four months [4]. While most HGSOC occurs in post-menopausal women, 12.1% of those with reproductive fertility are younger than 44 years old [5]. Cryopreservation and the closed verification system represent the established method in the clinical field of fertility [6].
Carrying informative biomarkers in heterogeneous cargos, exosomes comprise growth factors, membrane receptors, and nucleic acids, mirroring the originating cell and modulating tumorigenic pathways [6]. More recently, exosomes have been shown to function in tumor malformation, metastasis [7, 8] and especially in chemoresistance [9, 10, 11]. For instance, Battke et al. [12, 13] reported that tumor cell-derived exosomes could confer drug resistance through immune cell regulation by interaction with TGFb1 and PDL-1; Nabet Barzin Y et al. [14] proved that unshielded RN7SL1, mediated by exosome, exasperated drug resistance by binding and activating retinoic acid-inducible gene I.
A range of biomarkers has been decoded to facilitate therapy monitoring and predict prognosis. However, none of them bore fruit when exploited in clinical routine. CD200, formerly termed OX-2, a highly conserved transmembrane glycoprotein, was previously targeted as an immune checkpoint. Together with its receptors CD200R1-R4, CD200 is predominantly located in endothelial cells, neurons, and T and B lymphocytes [15]. The interaction of CD200 and receptors facilitates the downstream of immunosuppressive pathways, leading to the repression of regulator T cells [16], the switch of cytokine from Th1 to Th2 [17] and peripheral tolerance [18]. Siva et al. [19] reported that strong stained CD200 might permit a highlighted anti-tumor response when blocked with an antagonistic antibody in ovarian tumors. Chen et al. [20] identified CD200 as an anti-inflammatory mediator, preventing ovarian hyperstimulation syndrome by maintaining the vascular barrier. However, the predictive or prognostic role of CD200 in HGSOC remains unexplored.
In this study, we attempted to unravel the predictive and prognostic role of CD200 by dynamically monitoring the lineage change from the onset of surgery to the completion of chemotherapy. We interrogated: (i) whether CD200 would be overexpressed in exosomes or serum; (ii) whether CD200 could predict response and survival.
This project was predominantly conducted at the Department of Gynaecology and Obstetrics in Nanjing Second Hospital. 175 primary documented ovarian cancers were consecutively included from January 2015 to March 2017. All patients provided written informed consent before participation. Eligibility criteria were biopsy-proven HGSOC, International Federation of Gynecology and Obstetrics (FIGO) stage III or IV, dubulking resection followed by front-line platinum-based adjuvant chemotherapy, and presence of both ascites and serum samples for analysis. Exclusion criteria were at least 20% sample points not available across the treatment, neoadjuvant chemotherapy, uncontrollability of diabetes mellitus or hypertension, chemotherapy contraindications (infection, intestinal ileus), and secondary malignancies. All included cases experienced the primary tumor debulking aiming at macroscopic clearance, followed by first-line platinum-based chemotherapeutics. Bevacizumab was consecutively delivered, particularly in patients with at least FIGO IIIb, regardless of platinum sensitivity or resistance.
OS was defined as the interval from surgical intervention to death or the last
follow-up. PFS was calculated from the onset of surgery until the date of
relapse, including local recurrence or distant metastasis. Platinum-free interval
(PFI) was the time elapsed from the last platinum dose until clinical recurrence,
defining platinum-sensitivity/responder (PFI
Ascites were withdrawn through transabdominal tubes, immediately rotary mixed,
and transferred into sterile centrifuge tubes. Within 1 hour after withdrawal,
the floating cells were removed by certification at 300
Sodium cacodylate buffer was used to wash exosomes at pH 7.35–7.45, after which 3% osmium tetroxide was applied for post-fixation. Exosomes were dehydrated using a propylene oxide wash for 5 minutes and rinsed with ethanol again, followed by incubation in propylene oxide for up to 24 hours in 60 °C incubators. A mixture of propylene oxide was administrated to embed the specific exosome pellets at 60 °C for one night. 80 nm sections were cut using tramicrotome RM2235 (Leica GmbH, Wetzlar, German) and contrasted with 4% uranylacetate and Sato’s stain. Transmission electron microscope JEM-1010 (JEOL, Akisima, Tokyo, Japan) was performed to capture the samples at 80 kV.
The total RNA was extracted from 100 µL purified exosomes or ascites
samples employing Reagent
The concentrations of CD200 in ascites, purified exosomes and serum were
quantified using the commercially available CD200 enzyme-linked immunoabsorbent
assay kit (catalog: P41217, Wuhan Enfei Biotechnology, Wuhan, Hubei, China).
After equilibration at 20–25 °C, the samples and reagents were
incubated at 37 °C for 90 minutes. In the standard diluent buffer,
samples (2
Chi-squared and Student’s t-tests were employed to discriminate the
descriptive parameters. Mann-Whitney U was performed for testing CD200
homogeneity between groups, and Wilcoxon rank-sum for CD200 dynamics within
groups. The receiver operating characteristic curve (ROC) was plotted, and the
area under the curve (AUC) was calculated. At the maximum of the Youden index,
the optimal cut-off was determined. The Kaplan-Meier curve was constructed to
parallel the cumulative rate of OS to PFS using the Log-rank test. Univariable
and multivariable Cox proportional regressions were modeled. A hazard ratio (HR)
and 95% confidence interval (CI) were indicated. SPSS version 26 (SPSS Inc.,
Chicago, IL, USA) and GraphPad Prism 8 (GraphPad Software, LaJolla, CA, USA) were
developed for analysis and presentation. Two-tailed p
From January 2015 to March 2017, 175 patients were enrolled at the Department of
Gynaecology and Obstetrics in the Nanjing Second Hospital. Twelve patients
withdrew written informed consent, and 15 cases declined before the project
launch. Missing data (61/444,
| Non-responder n = 57 (%) | Responder n = 91 (%) | p | Logistic regression | |||
| 95% CI | p | |||||
| Age (years) | 52.3 |
51.6 |
0.76 | 0.92–1.03 | 0.60 | |
| Menopause | Yes | 32 (56.1) | 52 (57.1) | 0.905 | 0.37–4.38 | 0.70 |
| No | 25 (43.9) | 39 (42.9) | ||||
| FIGO (2013) | III | 25 (43.9) | 37 (40.6) | 0.701 | 0.09–1.92 | 0.267 |
| IV | 32 (56.1) | 54 (59.4) | ||||
| Macroscopic residual | Yes | 35 (61.4) | 54 (59.3) | 0.803 | 0.50–10.4 | 0.28 |
| No | 22 (38.6) | 37 (40.7) | ||||
| BRCA1/2 mutation | Mutated | 16 (28.1) | 28 (30.8) | 0.727 | 0.54–2.43 | 0.71 |
| Not yet | 41 (71.9) | 63 (69.2) | ||||
| HRD status | Positive | 20 (35.1) | 35 (38.5) | 0.827 | 0.55–3.10 | 0.65 |
| Negtive | 37 (64.9) | 56 (61.5) | ||||
| Bevacizumab administration | Yes | 11 (19.3) | 15 (16.5) | 0.70 | 0.34–4.35 | 0.65 |
| No | 46 (80.7) | 76 (83.5) | ||||
| TC cycles | 4.9 |
5.1 |
0.51 | 0.80–1.45 | 0.48 | |
| CA125 (U/mL) | 2545 |
2704 |
0.20 | 0.13–1.34 | 0.25 | |
Data presented as mean
FIGO, International Federation of Gynecology and Obstetrics; HRD, homologous
recombination deficiency; TC, taxol and carboplatin; CI, confidence interval.
We isolated the exosomes at super speed and identified those specific particles
utilizing a Transmission electron microscope. In Fig. 1a (responder) and Fig. 1b
(non-responder), exosomes were displayed between 30–170 nm in diameter.
Validated by real-time PCR, those vehicles were highly enriched based on the
expression of exosome biomarkers ALIX, CD60 and the absence of
 Fig. 1.
Isolation and characterization of exosome drawn from ascites.
Electron microscopy identifying exosome isolated from responder (a) and
non-responder (b) at 80 kv. Vehicles are displayed between 40–190 nm in
diameter. Real-time PCR validating highly enriched exosome colony (c) based on
common exosome markers, including ALIX, CD60 and the absence of
We detected CD200 levels in HGSOC at primary diagnosis, post-operation and three
cycles after chemotherapy (Fig. 2). CD200 appeared to be predominantly located in
serous ovarian cancer (Fig. 2a). In serum or ascites without exosome, CD200 was
scarcely observed, with levels holding stable across treatment (Fig. 2b,d). A
linear correlation test proposed a weak linear relation between serum CA125 and
exosome-mediated CD200 (R
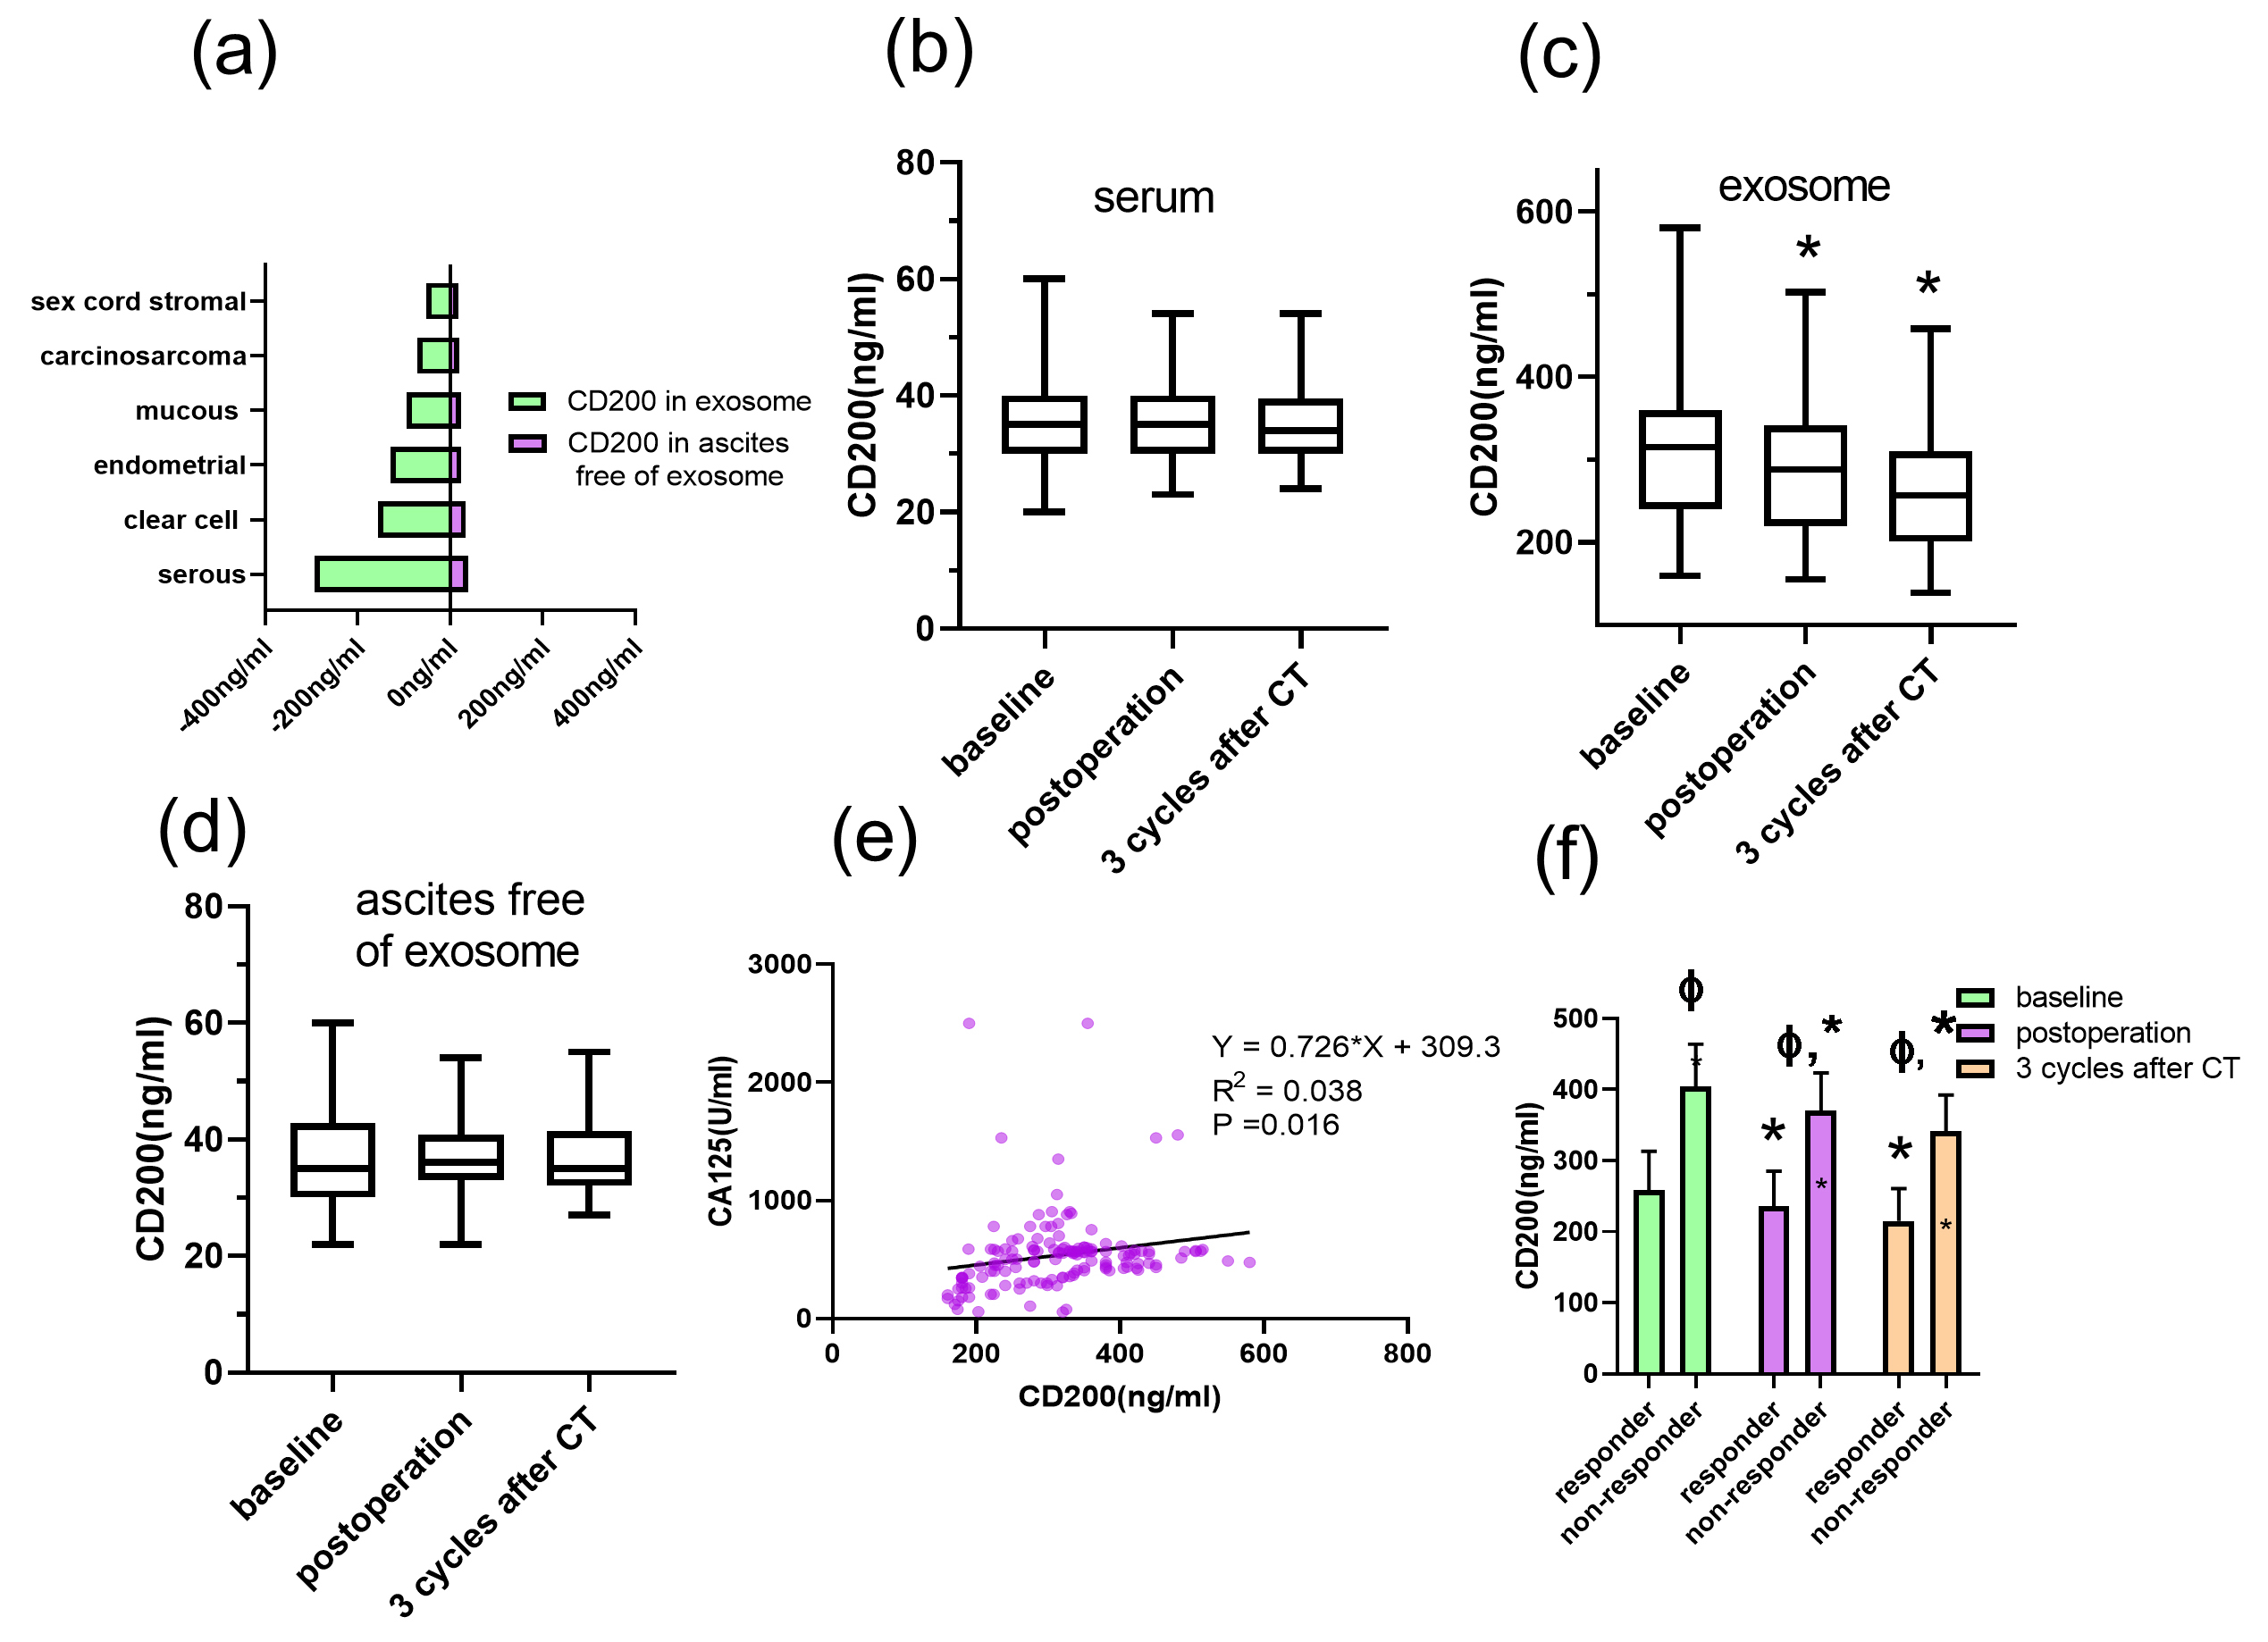 Fig. 2.
Dynamic CD200 levels across surgery and adjuvant platinum-based
therapy. The CD200 level was compared in various histologies (a). The CD200 in
serum (b), exosome (c) and ascites free of exosome (d) was detected at primary
diagnosis, as well as after radical resection (post-operation) and three cycles
after chemotherapy (post-3 cycles). The linear correlation between CA125 and
CD200 was examined (e). CD200 concentration was predominantly detected in
responders and non-responders (f). A p-value is calculated using the
Maan-Whitney U test for independent samples and the Wilcoxon rank sum test for
paired samples. *, p
ROC analysis showed that CD200 at the primary diagnosis enabled robust discrimination between responders and non-responders with an AUC of 0.94 (95% CI = 0.902–0.979, p = 0.01). Responders were detectable from the total cohort at 335.50 pg/mL, exhibiting a sensitivity of 0.842 and specificity of 0.92 (Fig. 3a); as the cut-off dropped to 311.00 pg/mL, the discriminative power decreased to 0.918 (95% CI = 0.873–0.963, p = 0.02), representing a sensitivity of 0.78 and a specificity of 0.89 (Fig. 3b); with 265.00 pg/mL as a cut-off after completion of 3-cycle chemotherapy, the AUC declined to 0.908 (95% CI = 0.862–0.955, p = 0.02), resulting in a sensitivity of 0.89 and specificity of 0.77. (Fig. 3c)
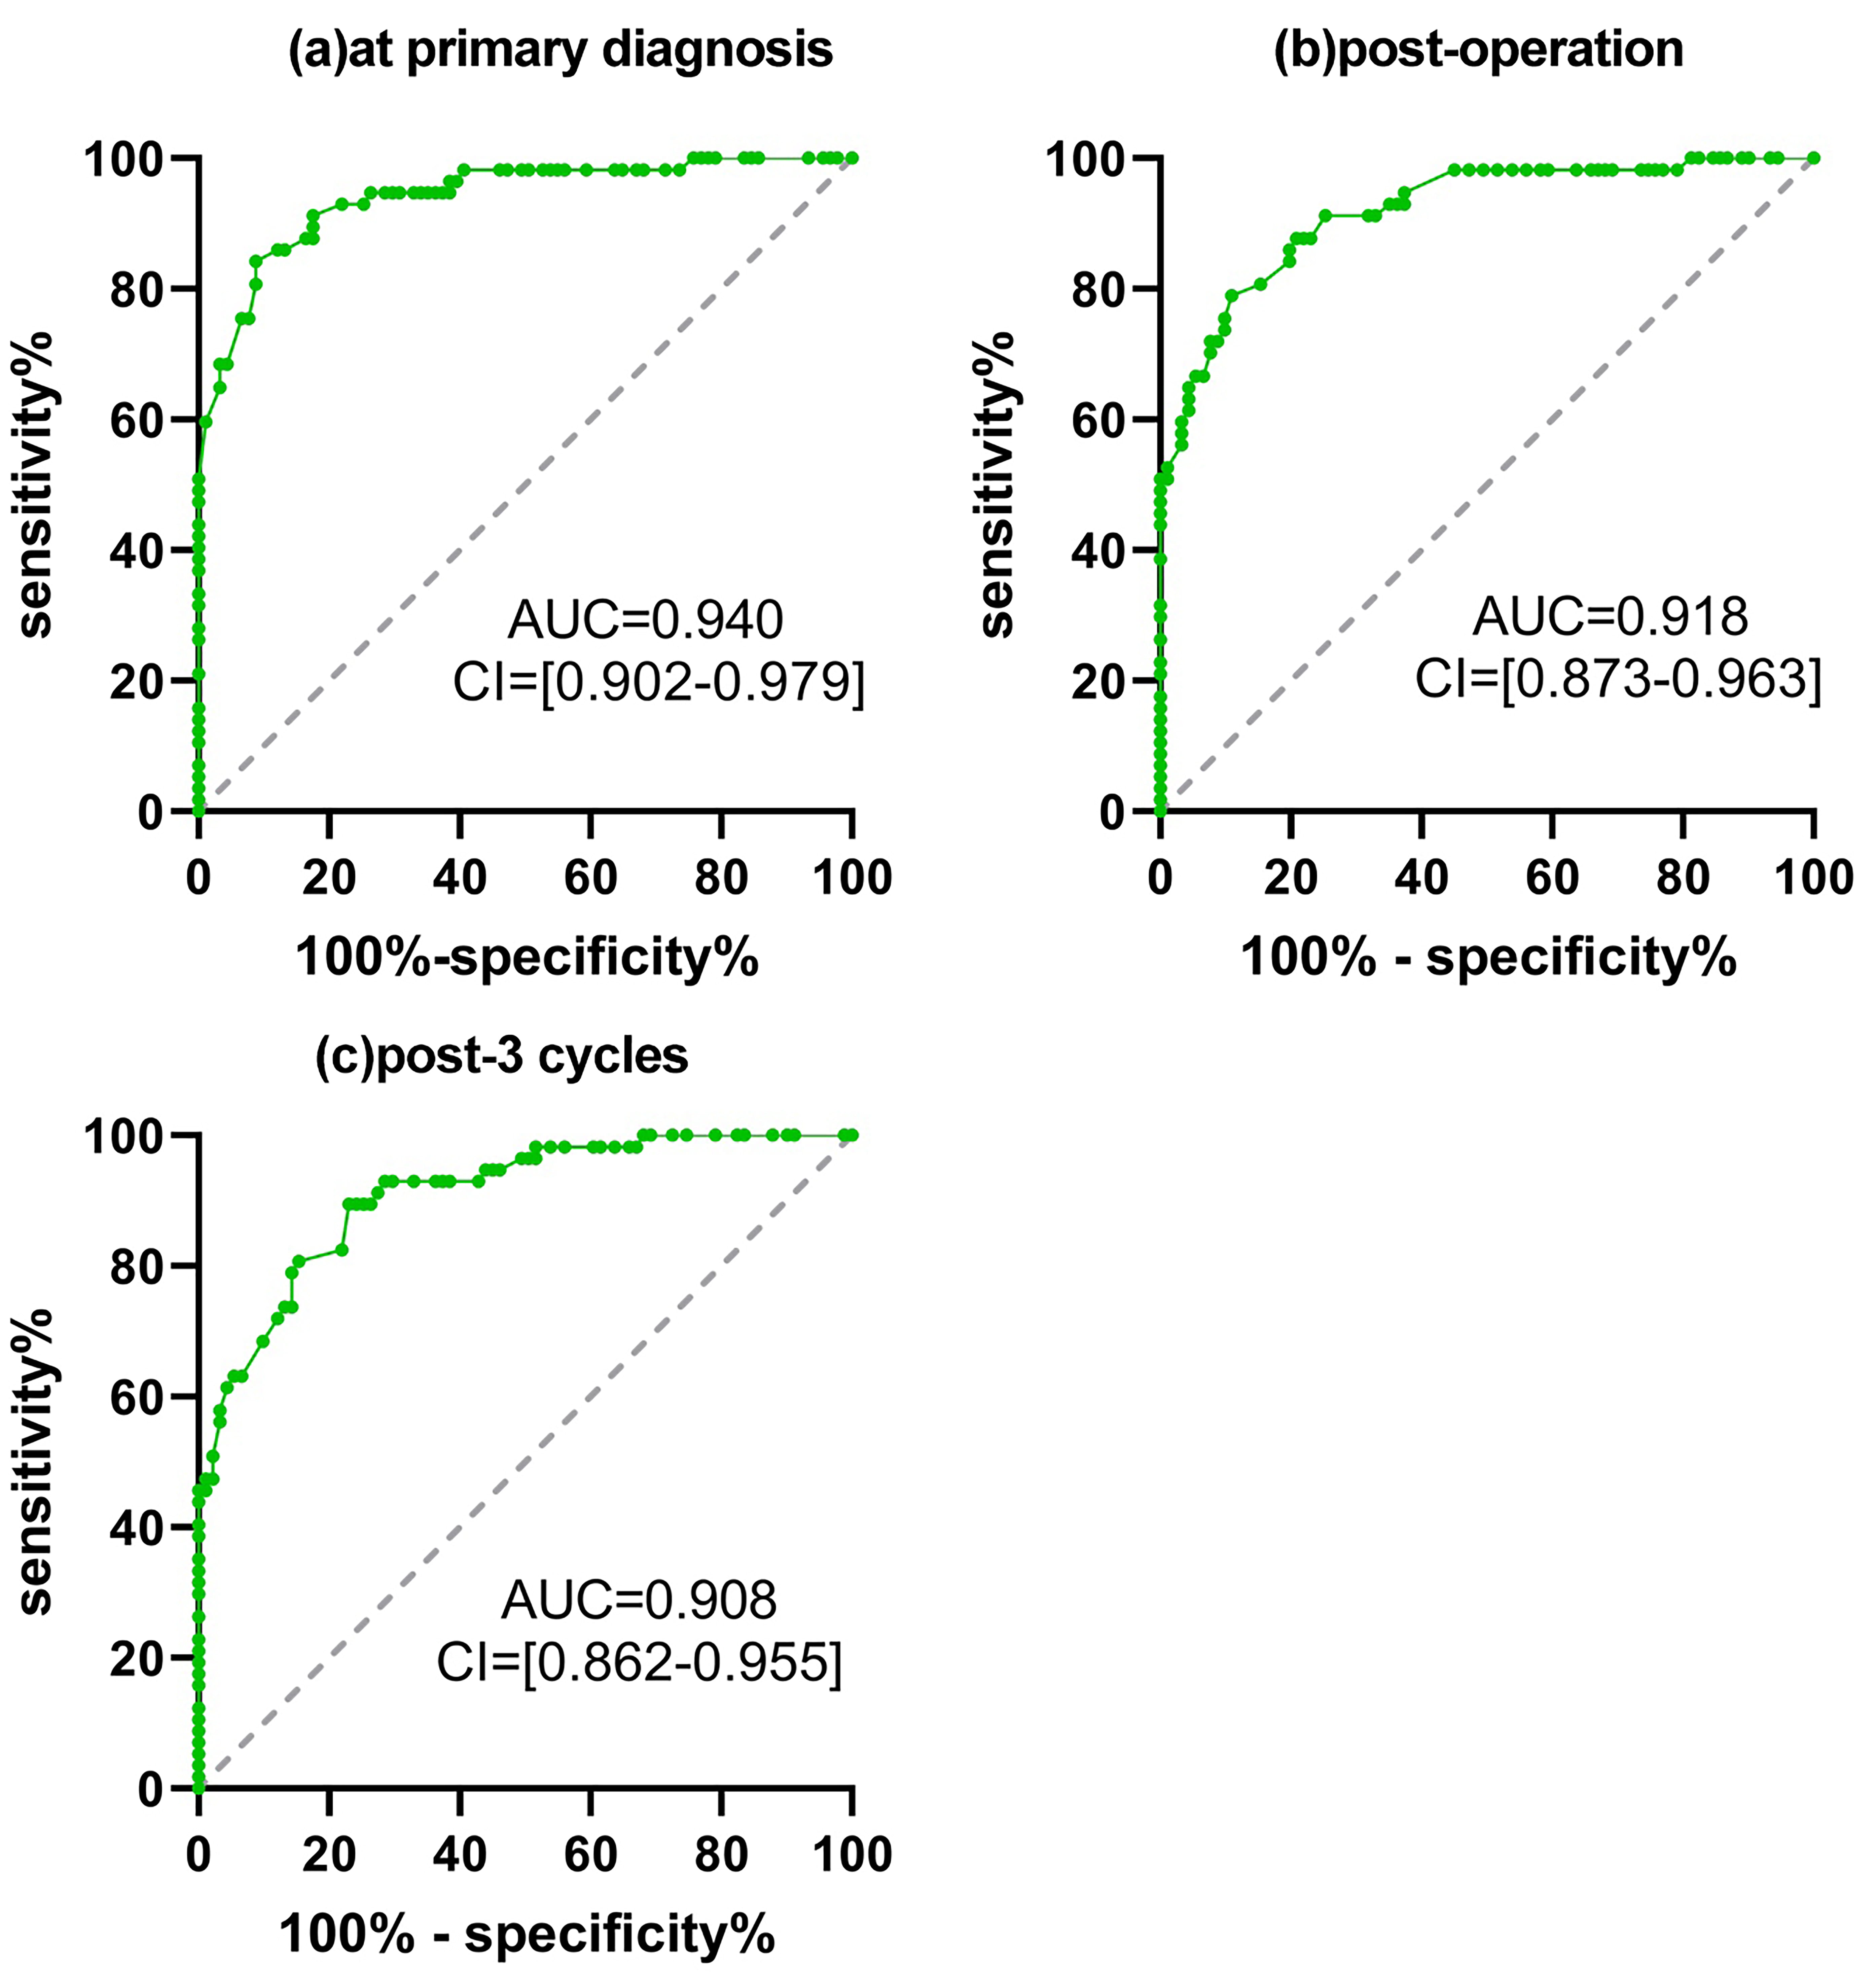 Fig. 3.
Receiver operating characteristic curve (ROC) of CD200 across surgery and adjuvant platinum-based therapy. For the serial threshold of CD200, the true positivity against false positivity was generated between responders and non-responders at primary diagnosis (a), post-operation (b) and post-3 cycles of chemotherapy (c). The area under the curve (AUC) and 95% confidence interval (CI) are indicated.
Stratified by CD200, the median PFS of the high group was 5.1 months, which was
shorter than the low group at primary diagnosis (8.6 months, 95% CI = 2.8–9.7,
p = 0.001, Fig. 4a). Similarly, the median PFS of the high CD200 group
significantly declined compared to the low CD200 group at post-operative and
post-3 cycles ( 4.9 vs. 8.7 months, 95% CI = 2.2–6.1, p
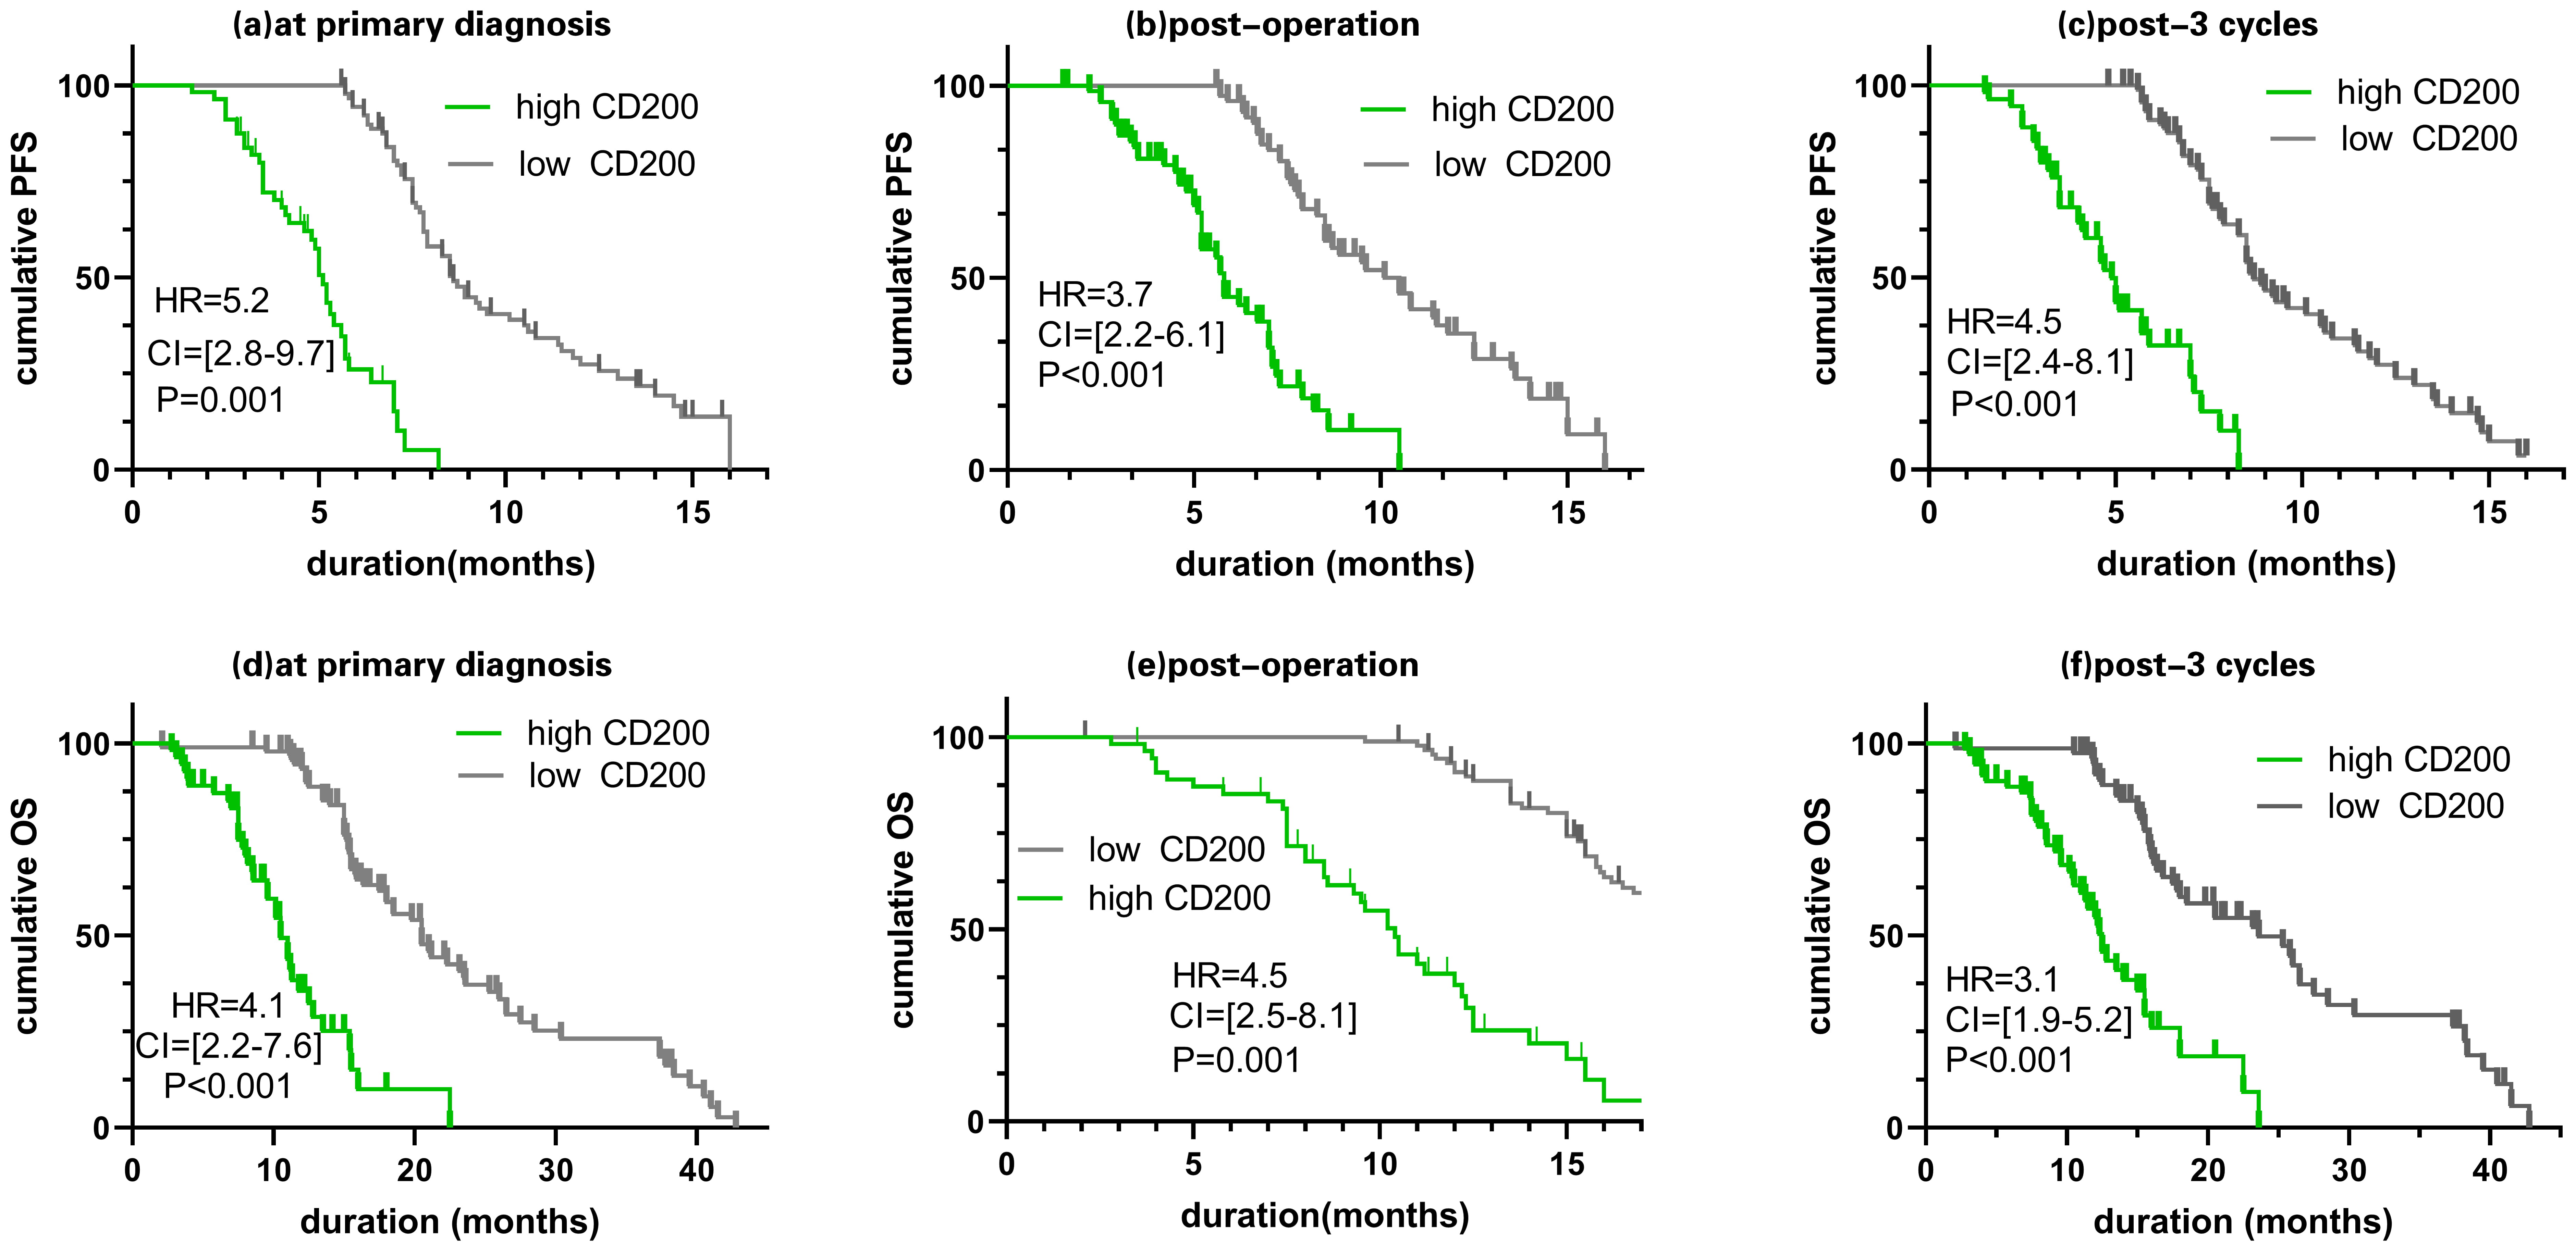 Fig. 4.
Prognostic discrepancy across radical resection and adjuvant chemotherapy based on CD200 levels. Kaplan-Meier comparing progression-free survival (PFS) and overall survival (OS) in individuals with high CD200 level versus low CD200 level at primary diagnosis (a,d), post-operation (b,e) and post-3 cycles (c,f). The cutoff value stratifying CD200 levels into high and low levels was estimated by maximizing the Youden index. p-value, 95% confidence interval (CI) and hazard ratio (HR) are indicated.
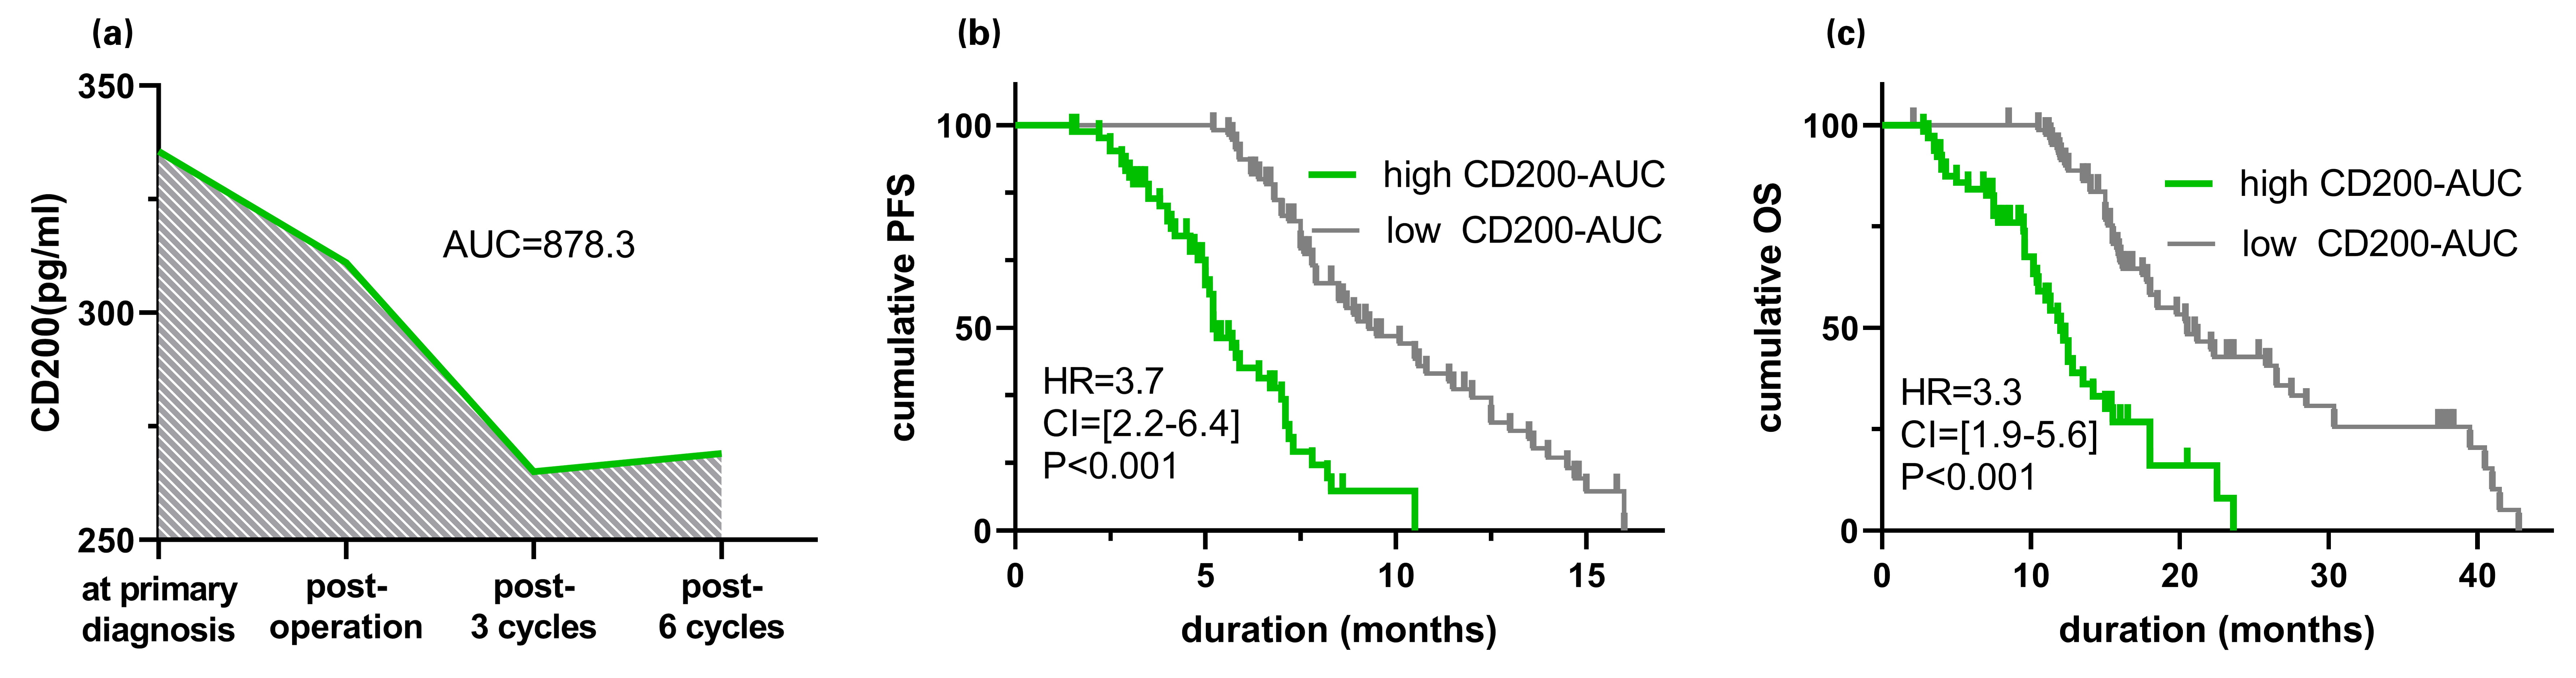 Fig. 5.
Prognostic discrepancy across radical resection and complementary chemotherapy based on CD200-AUCs. CD200 linear dynamics between the primary diagnosis and 6 chemotherapy cycles (a). The cutoff value was determined by maximizing the Youden index for stratifying the studies into low and high CD200-AUC groups. The Kaplan-Meier curve was generated to analyze (b) progress-free survival (PFS) and (c) overall survival (OS). A Log-Rank test was calculated. p-value, 95% confidence interval (CI), and hazard ratio (HR) are indicated. AUC, area under the curve.
| PFS | ||||||
| Univariable COX | Multivariable COX | |||||
| HR | 95% CI | p | HR | 95% CI | p | |
| FIGO (2013) | 2.7 | 2.1–6.6 | 3.5 | 2.4–11.1 | ||
| Bevacizumab administration | 0.3 | 0.2–0.7 | 0.5 | 0.1–0.8 | ||
| Macroscopic residual | 4.2 | 2.3–10.7 | 4.8 | 2.7–13.4 | ||
| BRCA1/2 mutation | 0.4 | 0.3–0.8 | 0.02 | 0.6 | 0.4–0.9 | 0.03 |
| HRD status | 0.4 | 0.1–0.7 | 0.03 | 0.3 | 0.2–0.6 | 0.04 |
| CD200 at primary diagnosis | 2.4 | 2.35–3.70 | 0.02* | 2.8 | 2.08–3.49 | 0.01* |
| CD200 post-operation | 1.8 | 0.7–5.5 | 0.19 | 1.6 | 0.8–4.6 | 0.14 |
| CD200 post-3 cycles | 5.0 | 3.05–7.00 | 0.01* | 6.7 | 4.01–8.02 | 0.01* |
| CD200-AUC | 4.1 | 3.3–13.5 | 0.01* | 4.6 | 3.6–15.7 | 0.01* |
PFS, progression-free survival; FIGO, International Federation of Gynecology and
Obstetrics; HRD, homologous recombination deficiency; HR, hazard ratio.
*, p
| OS | ||||||
| Univariable COX | Multivariable COX | |||||
| HR | 95% CI | p | HR | 95% CI | p | |
| FIGO (2013) | 2.5 | 2.1–8.5 | 0.02 | 2.6 | 1.8–9.6 | |
| Bevacizumab administration | 0.3 | 0.1–0.7 | 0.7 | 0.2–0.9 | 0.02 | |
| Macroscopic residual | 3.3 | 1.7–9.6 | 0.02 | 2.3 | 1.5–10.4 | |
| BRCA1/2 mutation | 0.4 | 0.3–0.9 | 0.04 | 0.8 | 0.7–0.9 | 0.04 |
| HRD status | 0.2 | 0.1–0.4 | 0.03 | 0.6 | 0.5–0.8 | 0.03 |
| CD200 at primary diagnosis | 2.2 | 1.55–3.05 | 0.01* | 3.5 | 2.14–4.99 | 0.04* |
| CD200 post-operation | 1.3 | 0.6–4.0 | 0.22 | 1.5 | 0.62–4.00 | 0.33 |
| CD200 post-3 cycles | 6.1 | 4.45–10.20 | 0.01* | 5.6 | 3.01–7.34 | 0.01* |
| CD200-AUC | 5.5 | 3.9–16.5 | 0.01* | 3.2 | 1.5–6.3 | 0.01* |
OS, overall survival; FIGO, International Federation of Gynecology and
Obstetrics; HRD, homologous recombination deficiency; HR, hazard ratio.
*, p
Contrary to circulating biomarkers, ascites molecule profiles are more likely stable as they are less susceptible to vascular endothelial infiltration or organ metabolism changes. In this context, extracting CD200 from ascites directly reflects the tumor’s biogenesis and could enhance its potential to customize treatment intensity and duration. Using a serial sampling approach, we demonstrated three critical utilities in patients harboring HGSOC: the CD200 is highly expressed in non-responders’ ascites; CD200 accurately predicts response to platinum-based chemotherapeutics after curative intent surgery; increased CD200 correlates with impaired PFS and OS in point or lineage dynamic settings. These encouraging results represent the first data indicating the potential of CD200 as a suitable marker for predicting response or prognosis in solid tumors.
Versatile mechanisms have been established to prevent tumors from being sensitized to antineoplastic drugs, including increased drug efflux, frequent DNA damage repair, and strengthened ability to undergo epithelial-to-mesenchymal transition. Studies have recognized that bioengineered exosomes could facilitate the packing and transportation of anti-cancer treatments out of the tumor microenvironment. This process may contribute to developing acquired resistance to targeted drugs [22]. We found that CD200 mediated by exosomes was highly expressed in the ascites of non-responders, indicating that CD200 is engaged in counteracting the platinum effect in HGSOC patients after primary surgery. CD200 delivered in nanosized cargos might detoxify drugs by inactivating the expression of Mcl-1 and surviving [23]. In Yuh-Seog Jung’s study [24], activating Bmi-1 and SHH in CD200-overexpressing squamous cell carcinomas also imparted a resistance phenotype against chemoradiation. Interestingly, CD200 expression was scarcely observed in ascites without exosomes, possibly because exosomes package predominantly hydrophobic and soluble CD200, thus allowing unique CD200 delivery for intercellular cross-talk. Siva et al. [19] confirmed the membrane-associated CD200 staining by immunohistochemistry in ovarian cancer. However, there has been no serum CD200 analysis in HGSOC. In our study, we proposed that CD200 is minimally present in the serum; we found that serum-based CD200 is not applicable for dynamic detection due to the stable expression. It is notable and puzzling that CD200 is highly enriched in ascites, especially in exosomes, but little in serum. The limited diffusion of CD200 into the circulating system may be attributed to the unique membrane budding and endosomal sorting machinery of exomes [22, 25, 26]. These mechanisms likely restrict the release of CD200 into the bloodstream. The membrane-bundled CD200 is persistently secreted into ascites, which could compete with the endothelium filtration of blood and lymphatic vessels.
With BRCA1/2 gene mutation and HRD status included in the final analysis, we could somewhat weaken the heterogeneous bias, which might be associated with chemosensitivity. In regard to response prediction, the persistently detectable CD200 provided excellent discrimination between responders and non-responders at primary diagnosis, post-operation, and following three cycles of chemotherapy, thus providing a novel surrogate for patients with HGSOC undergoing curative surgery and adjuvant chemotherapy. The strength was superior to that reported in the study by D’Arena et al. [27], where circulating CD200 attenuation appears to mount a response to chemo-immunotherapy in chronic lymphocytic leukaemia using 1281 pg/mL as the cut-off point. The rationale may be attributable to the special sprouting and delivery of cross-talk transvectors, directly transmitting the tumorigenesis and inducing immune deficiency related to multidrug resistance. The CD200-screened patients at high risk of platinum resistance should encounter a shift to administering bevacizumab, liposomal doxorubicin, and gemcitabine, which the Food and Drug Administration (FDA) approves. In addition, a bevacizumab patient should be monitored for adverse events, such as intestinal fistulas, albuminuria, and hypertension.
To establish the validity of this marker, we enrolled a cohort of high-grade, serous and advanced patients to assess their response to platinum-based chemotherapeutics. This approach aimed to shed light on the predictive value of CD200 in this specific patient population. In this study, we optimized the prognosis stratification based on the same cut-off point determined in the ROC curve at longitude settings. Among patients receiving three cycles of chemotherapy after surgery, high CD200 levels could enhance the reduced PFS or OS and act as an independent prognosticator after adjusting for known clinicopathological factors. Despite similar risk factors, prognosis could still vary depending on macroscopical residuals, HRD status and BRAC1/2 gene mutation [28, 29, 30]. Alternatively, we speculate that the poor PFS and OS may be attributed to the dysregulation of the tumor microenvironment and the inactivation of tumor-specific T cells induced by CD200 [31]. Compared to tissue biopsy, the CD200 is less invasive and repeatedly detectable. We then determined the AUC by drawing the dynamic lineage curve, which could be additionally used for prediction. The low CD200-AUC group showed a more prolonged PFS and OS than the high CD200-AUC group (9.3 vs. 5.2 months; 20.5 vs. 12.0 months, respectively). Accordingly, the impact of CD200 accumulation across the treatment course, to our speculation, may be dose-dependent and indicate a second-line regimen or a druggable target. It is worth noting that a second study used tumor stage, optimal debulking, and various serum proteins to predict PFS and identify recurrence in patients with HGSOC [32]. However, our data indicate that even without the clinical-pathological variables, the multivariable Cox proportional regression yields a conclusive result based on liquid-based biomarkers.
While this study presents several advantages as mentioned above, it has certain limitations. First, in FIGO I and II HGSOC patients, the tumor is localized inward of the ovarian membrane, thereby restricting the release of exomes. Moreover, according to clinical practice, illustrating ascites can be challenging, especially in patients with little amount of pelvic ascites. Second, statistical power is generated by assessing the primary endpoint, namely chemotherapeutic response, rather than prognosis, which may attenuate CD200’s ability to detect survival discrepancies. Finally, kinetics and clearance of HE4 and CA125 have been reported by some literature as prognostic factors in HGSOC [33, 34]. Further analysis comparing CD200 with established biomarkers such as CA125 and HE4 in predicting HGSOC should be encouraged.
CD200 mediated by exosomes is up-regulated in non-responders in HGSOC. Dynamic monitoring of CD200 could accurately predict response to chemotherapeutics, especially at primary diagnosis, postoperatively, and following three cycles of chemotherapy. Furthermore, the overexpression of CD200 and a high CD200-AUC indicate poor survival. Noninvasive molecular profiling analysis can potentially guide rational and personalized adjuvant chemotherapy in HGSOC patients following curative intent surgery.
The CD200 mediated by ascites-derived exosome is up-regulated in advanced HGSOC and indicates dismal PFS and OS, representing an innovative biomarker for predicting HGSOC.
Data not included in this published article or raw data of the manuscript are available upon reasonable request.
YJ conceived the idea, performed the procedure and drafted the article. SSL, GJW and XC helped in collecting patient records. YJL organized medical records and interpreted the data. XGZ, YD and HMZ collected and retrieved data. JT helped to design the study and perform the statistical analysis. HXJ supervised the study, reviewed the manuscript and involved in the acquisition and analysis of data. SLZ and AWX coordinated the research and proofread the manuscript. All authors contributed to editorial changes in the manuscript. All authors have participated sufficiently in the work and agreed to be accountable for all aspects of the work. All authors read and approved the final manuscript.
All subjects gave their informed consent for inclusion prior to participating. This study was conducted following the institutional guidelines of the 1964 Helsinki Declaration and its amendments. The study was approved by the Ethics Committee of Nanjing Second Hospital (LS-ky029).
We thank Kaihua Wu for supporting visualization and Minmin Yu for statistics help. We would also like to thank all the obstetrics and gynecology staff at Nanjing Second Hospital, Nanjing University of Chinese Medicine.
This research received no external funding.
The authors declare no conflict of interest.
Publisher’s Note: IMR Press stays neutral with regard to jurisdictional claims in published maps and institutional affiliations.