
Background: The cesarean delivery rate has been increasing all over the
world over the last few years. There is a change in mindset due to the change in
women’s role, let alone the perception stating that cesarean delivery can
decrease the risk of having pelvic floor dysfunction and maintain the sexual
functions. Therefore, women think that cesarean delivery is a good choice for
delivery, even it has no indications. This study aimed at analyzing and providing
quantitative data by comparing the dyspareunia based on FSFI scores between
cesarean section and vaginal delivery. Method: The systematic data
search was done in the Medical Database (PUBMED, Google Scholar,
Cochrane) and the archives of RSUD Dr. Soetomo. The inclusion criteria consisted
of (1) observational study with the following keywords “cesarean
section”, “cesarean delivery”, “vaginal birth”,
“vaginal delivery”, “dyspareunia”, “FSFI”, (2)
all included papers could be accessed completely, and the data that had been
obtained could be analyzed accurately. Result: Twelve observational
studies toward 2144 patients had been analyzed. The dyspareunia score after
3-month of delivery between cesarean section and vaginal delivery had a
Mean Difference (MD) of 0.18 and 95% CI of –0.19 to 0.54
(p-value of 0.35). The dyspareunia score after 6-month of delivery
between cesarean section and vaginal delivery had a Mean Difference (MD)
of 0.43 and 95% CI of –0.28 to 1.14 (p-value of 0.23). Meanwhile, the
dyspareunia score after 12-month of delivery between cesarean section and vaginal
delivery had a Mean Difference (MD) of 0.12 and 95% CI of –0.23 to
0.48 (p-value of 0.50). From those three forest plots, all diamonds were
tangent to the vertical line (no effect) and had a p
In recent years, the number of cesarean bithshas increased worldwide. Approximately 30% of births in 2015 were cesarean births, which were almost three times the number of cesarean births in 1980, which was at 11% [1]. This figure is significantly above the WHO recommendation rate at 15–20% [2]. In the US, for instance, the number of cesarean births in 2015 reached 32% of total births, of which 2.5% were cesarean delivery bymothers’ request [3]. The birth rate in Italy was 33.7%, which makes Italy have the highest cesarean delivery rate in Europe [4].
The delivery process is associated with the incidence of postpartum dyspareunia. Dyspareunia is a genital pain disorder that adversely affects a woman’s quality of life. This disorder occurs with a high prevalence and imposes a significant financial burden on women and the health care system [5]. McDonald’s cohort study [6] stated that women who gave birth at 6 months through cesarean birth had fewer risk factors for dyspareunia than women who gave birth normally with an intact perineum (OR = 0.76). However, in 18-month postpartum, women with elective cesarean section had a greater risk factor for dyspareunia than women who delivered normally with an intact perineum (OR = 1.71) [6]. Mindset about delivery methods has changed due to the changing roles of women. Nowadays, women have greater autonomy rights and are career-oriented, and even some experience late marriages [7]. In addition to the revolutionized mindset, cesarean sectionis perceived to reduce the risk of pelvic floor injuries and maintain good sexual function [8]. Therefore, it is considered a viable option even without medical indications or just bymothers’ request known as Cesarean Section on Maternal Request (CSMR) [4]. However, the research concluded that postpartum dyspareunia could still occur even though a woman underwent cesarean section.
Blomquist found women who experienced forceps delivery and those who gave birth to babies weighing more than 4 kgoften experienced dyspareunia more [9]. Both Blomquist’s and McDonald’s research supports each other [6]. Constrastingly, Fauconnier’s research on 1-year postpartum women stated that childbirth with tools treated episiotomy, and perineal trauma did not increase the risk of postpartum dyspareunia [10]. It goes the same way with Irwanto’s research at Dr. Soetomo District General Hospital in Indonesia, showing no significant difference in the female sexual function index scores in patients with cesarean section and vaginal delivery [11]. This proves that even after vaginal delivery, the sexual function remains good.
Manresa conducted a meta-analysis study on dyspareuniato examine the incidence of perineal pain and dyspareunia after vaginal delivery. The study showed that women who underwent an episiotomy experienced moreincidence of perineal pain and dyspareunia [12]. The second meta-analysis study conducted by Yang compared postpartum pelvic floor function after cesarean section to vaginal delivery. His research concluded that cesarean delivery could preferably maintain the pelvic floor function [13]. Another meta-analysis study by Fan in Chinadiscovered no difference in sexual satisfaction among women after cesarean section and vaginal delivery; another finding showedthat there was a difference in the time to initiate postpartum intercourse after cesarean section and vaginal delivery [14].
The issues aforementioned were further investigated in the current research. Itaimed to comparethe dyspareunia rate according to female sexual function index scoresafter mothers had cesarean delivery and vaginal deliverywith various postpartum periods of 3-month, 6-month, and 12-month. Putting the variety of period could provide conclusive quantitative results through meta-analysis. This study could benefit healthcare providers to provide earlier detection of dyspareunia after mothers have undergone cesarean birth and vaginal delivery. Moreover, it becomes a educational reference for women about various childbirth problems such asdyspareunia.
The meta-analysis study was conducted following the Preferred Reporting Items for Systematic reviews and Meta-analyzes (PRISMA) guide and the Cochrane Handbook for Systematic Reviews of Interventions. Articles under review were searched on some journal databases such as PubMed, Google Scholar, and the Cochrane Central Register of Controlled Trials. Articles selected should be randomized control trials and observational studies comparing dyspareunia ratesafter cesarean section and vaginal delivery according to female sexual function index (FSFI) scores. Journal article search was done using a combination of several terms, namely “Cesarean section”, “Vaginal delivery”, “Dyspareunia”, and “FSFI”. The research was conducted through some stages which were keyword determination/PICO identification, literature search based on PRISMA flowchart, literature analysis, statistical analysis, discussion, and conclusion. PICO identification in this study stood for Population (primiparous women), Intervention (elective cesarean section), Comparison (vaginal delivery, intact perineum, grade I–II perineal rupture, small episiotomy), and Outcome (dyspareunia after 3-month, 6-month, 12-month of postpartum after cesarean section and vaginal delivery). This meta-analysis study only involved case-control and cohort studies that examined dyspareunia ratesafter cesarean sectionand vaginal delivery according to the FSFI scores. The articles included should have examinedprimiparous patients who ever delivered normally with an intact perineum, grade I–II perineal rupture, or small episiotomy, as well as patients who ever undergoneselective caesarean section. Besides, the articles should cover research conducted to patients after 3-month, 6-month, 12-month of postpartum after their labor. All included articles were completely accessible and had data that could be analyzed accurately. However, some exclusion criteria applied tostudies involving multiparous patients, patients with complicated vaginal delivery, grade III, or grade IV perineal ruptureand assistive devices such as vacuum or forceps, patients with emergency cesarean section, and the absence of assessment of dyspareunia using FSFI.
Hypothesis: There are differences in dyspareunia rates after 3-month, 6-month, and 12-month cesarean and vaginal delivery according to female sexual function index scores (FSFI).
The study quality assessment was carried out by the researchers independently. The validity of each study was assessed based on the criteria listed in the Cochrane Handbook for Systematic Reviews of Interventions. Discussion among the researchers was required when differences of opinionemerged. All of the studieswere grouped and assessed according to the quality categories: having a low risk of bias, a medium risk of bias, a high risk of bias. Data extraction was performed to achieve the goals and objectives, as well as to answer the research questions.
The clinical outcome analyzed was dyspareunia according to the FSFI scores in
nominal data presented inMean Difference and Standard Deviation. The statistical
analysis presenteddata extraction, effect size, homogeneity test, homogeneous
fixed effect model or heterogeneous random effect model, summary effect, and
forest plot. The combined statistical analysis and effect size meta-analysis were
analyzed using the Review Manager (RevMan) software version 5.3 (Cochrane Inc.,
London, UK). Then, the combined mean and Standard Deviation (SD) as well as 95%
confidence intervals of the respective literature were calculated before the
results were reported in identical scales. The heterogeneity between studies was
assessed from the values of p and I
From the search on Pubmed, Google Scholar, and the Cochrane Central Register of Controlled Trials, 1051 titles and abstracts were identified. Only one article that met the inclusion criteria was available in the library of Dr. Soetomo General Academic Hospital in Indonesia. Not all of them went through analysis since there were 230 duplicate articles. After that, abstract screening was performed and resulted in 71 articles with the same PICO. The full-text articleswere checked to assess the quality of the study. A total of 4 articles were inaccessible, and 55 articles were unselected as they did not meet the inclusion critera. The excluded articles had questionnaires which did not use FSFI and werenot conducted in series of postpartum period. Moreover, theirdata did not meet the eligibility. Consequently, 12 articles met the inclusion criteria and were proceeded in the meta-analysis. Fig. 1 shows the research flows starting fromm identification, inclusion, and exclusion, literature search, and reasons for exclusion.
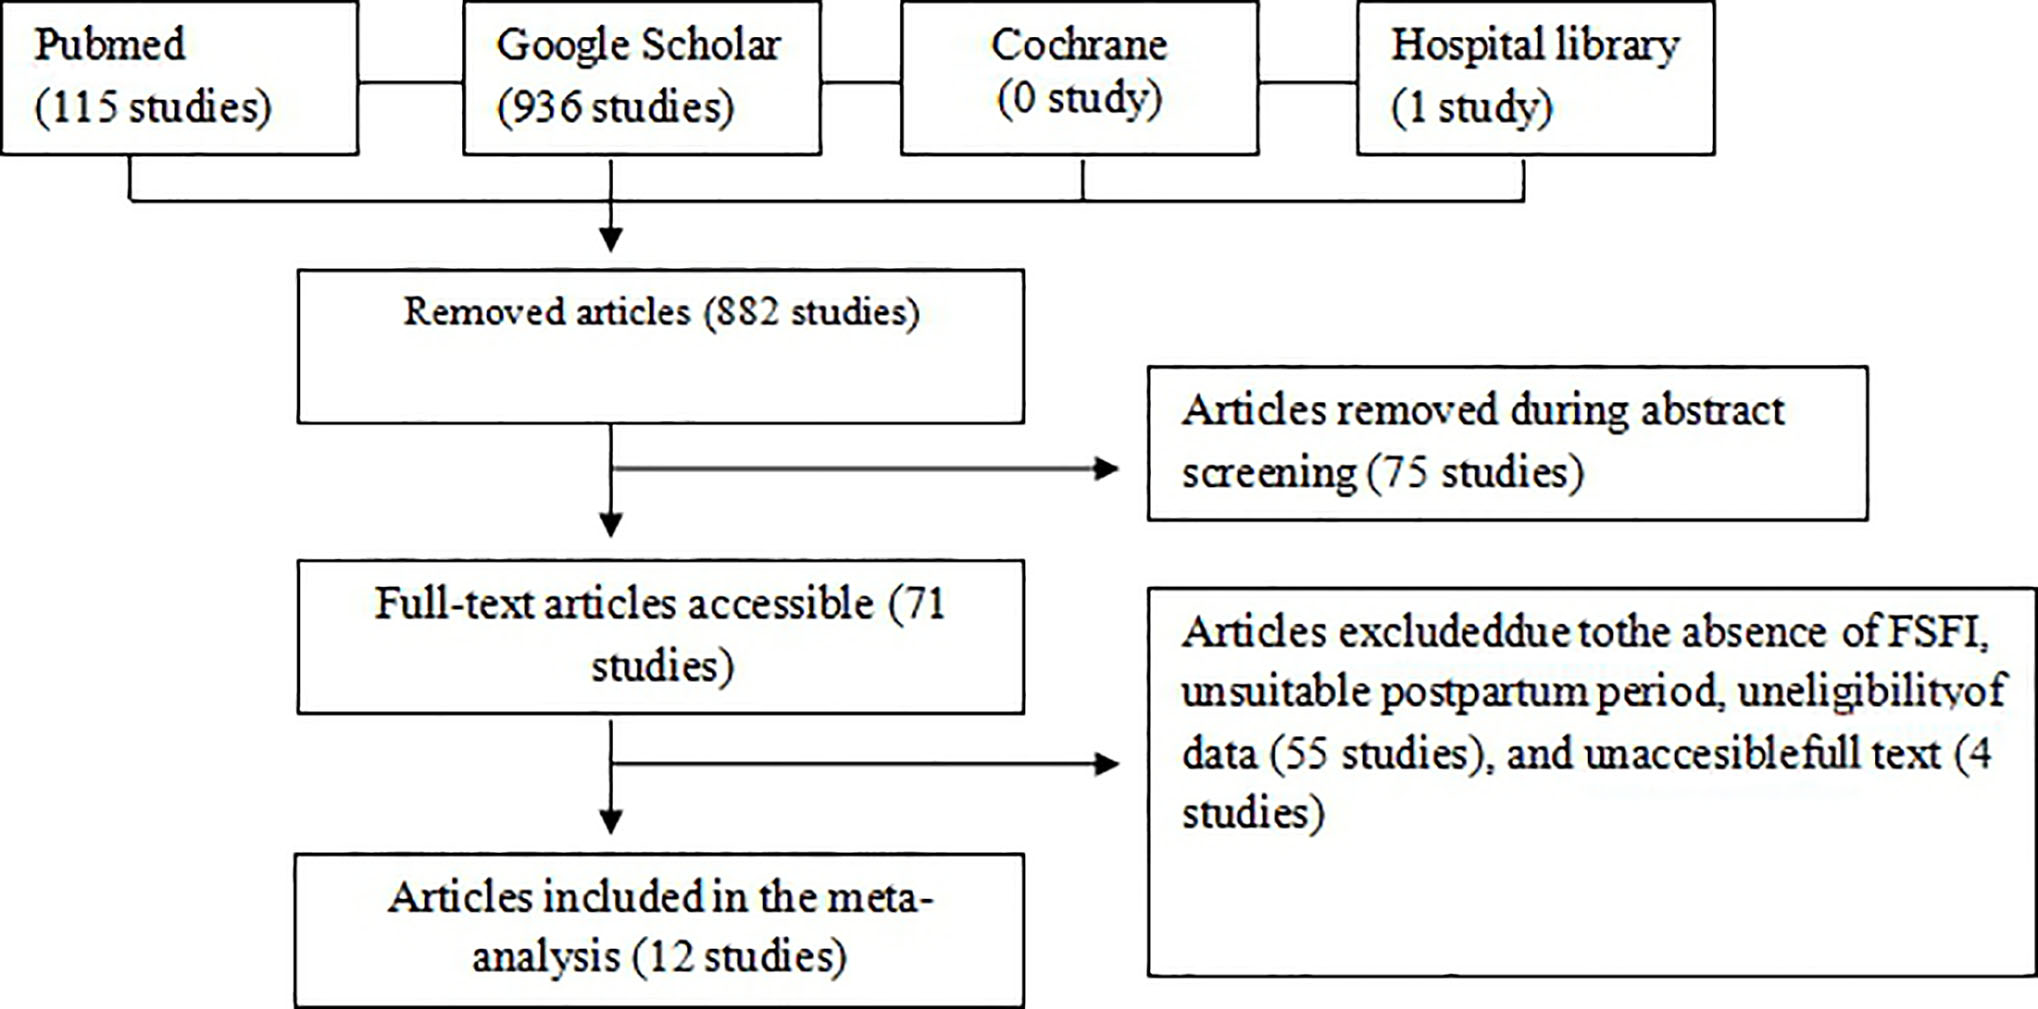 Fig. 1.
Flowchart of the article selection process.
Characteristics of studies involvedare presented in Table 1 (Ref. [11, 15, 16, 17, 18, 19, 20, 21, 22, 23, 24, 25]), which contains the author’s name, year of publication, research location, sample size, study design, intervention, and postpartum period. Articles were published in 2006 to 2019. The smallest sample size was 31 participants, and the largest was 450 participants. Overall, 1029 women were identified to be in the cesarean section group, and 1115 women were categorized asthe vaginal delivery group. The risk of bias in Non-randomized Studies-of Interventions (ROBINS-I) was employed to assess each study quality. The research assessment was different from that for Randomized Controlled Trial studysince it examined seven bias criteria due to confounding, selection of participants, classification of interventions, deviations from intended interventions, missing data, the measurement of outcomes, and the selection of the reported result. The assessment summarized that all the included studies had a high risk of bias. High bias occuredin the confounding domain because most studies had confounderssuch as breastfeeding conditions and a history of dyspareunia prior to deliverythat could cause dyspareunia as well. High bias also occuredduring the selection of participantsas the the participants were grouped after the intervention. Besides, the measurement of outcomes might also be the reason for a high bias since the rater already knew the participantsin the intervention and control groups. Normally, a low bias might appear whenthe selection of participants is carried out blindly.
| Study | Year | Country | Study design | Intervention | Sample size (PA/PV) | Postpartum period |
| Dabiri [15] | 2014 | Iran | Cross-sectional | Episiotomy with elective cesarean section | 150 (69/81) | 3, 6 |
| Lurie [16] | 2013 | Israel | Cohort | Episiotomy with elective cesarean section | 31 (17/14) | 3, 6 |
| Irwanto S [11] | 2016 | Indonesia | Cross-sectional | Mediolateral episiotomy with elective cesarean section | 60 (30/30) | 3 |
| Irwanto Y [17] | 2019 | Indonesia | Cross-sectional | Mediolateral episiotomy with elective cesarean section | 90 (45/45) | 3 |
| Baksu [18] | 2006 | Turki | Cohort | Mediolateral episiotomy with elective cesarean section | 248 (92/132) | 6 |
| Barbara [19] | 2015 | Italia | Cohort | Vaginal delivery (intact perineum, perineal laceration, episiotomy, and elective cesarean section) | 224 (92/132) | 6 |
| Sayed [20] | 2017 | Mesir | Cross-sectional | Vaginal delivery (intact perineum, perineal laceration, episiotomy, and elective cesarean section) | 277 (137/140) | 6 |
| Alesheikh [21] | 2016 | Iran | Cross-sectional | Vaginal delivery (intact perineum, perineal laceration, episiotomy, and elective cesarean section) | 450 (225/225) | 6 |
| Saydam [22] | 2017 | Turki | Cross-sectional | Vaginal delivery (intact perineum, perineal laceration, episiotomy, and cesarean section) | 142 (77/65) | 6, 12 |
| Moghadam [23] | 2019 | Iran | Cohort | Mediolateral episiotomy with elective cesarean section | 107 (58/49) | 6, 12 |
| Eid [24] | 2015 | Mesir | Cohort | Episiotomy with elective cesarean section | 200 (110/90) | 3 |
| Cai [25] | 2013 | China | Case-control | Episiotomy with elective cesarean section | 165 (77/88) | 12 |
Assessment of study quality using the ROBINS-I. This rating is different from the assessment in the Randomized Controlled Trial study. There are 7 criteria for bias in this table, which consist of bias due to confounding, bias due to selection of participants, bias in classification of interventions, bias due to deviations from intended interventions, bias due to missing data, bias in measurement of outcomes, bias in selection of the reported results. From Fig. 2, it can be concluded that in all studies who are included have a high risk of bias. High bias occurs on the confounding domain because most studies found the confounders that can cause dyspareunia as well, such as breastfeeding conditions and history of dyspareunia before delivery. High bias also occurs in the domain selection of participants, because in studies that included, participants were divided after the intervention was carried out. On the domain measurement of outcomes also has a high bias, because the outcome assessor already knows the group of participants, between the intervention and control. It is said to be low risk if blinding is done, so that the outcome assessor do not know each participant’s group.
 Fig. 2.
Bias risk assessment ofincluded studies usingthe ROBINS-I assessment tool.
Five studies involved 531 samples (271 samples in the cesarean delivery group
and 260 samples in the vaginal delivery group) (Fig. 3). The results showed a
I
 Fig. 3.
Forest plot of dyspareunia in 3-month postpartum according to FSFI scores. Notes: SD, standard deviation; IV, inverse variance; CI, confidence interval; df, degrees of freedom.
Eight studies hada total of 1548 samples (790 samples in the cesarean delivery
group and 758 samples in the vaginal delivery group) (Fig. 4). I
 Fig. 4.
Forest plot of dyspareunia in 6-month postpartum according to FSFI scores. Notes: SD, standard deviation; IV, inverse variance; CI, confidence interval; df, degrees of freedom.
Three studies reviewed possessed 353 samples (176 samples in the cesarean
delivery group and 177 samples in the vaginal delivery group) (see Fig. 5).
I
 Fig. 5.
Forest plot of dyspareunia in 3-month postpartum according to FSFI scores. Notes: SD, standard deviation; IV, inverse variance; CI, confidence interval; df, degrees of freedom.
In the forest plot, the dyspareunia score in 6-month postpartum showed high
heterogeneity with 97% I
In each 3-month, 6-month, and 12-month postpartum, there were only 5 studies, 8 studies, and 3 studies. The funnel plot ofdyspareunia in 3-month postpartum showed a fairly symmetrical picture, where there waslittle possibility of publication bias (Fig. 6). While, in 6-month postpartum, it showed an asymmetrical picture, suggesting publication bias (Fig. 7). Similar to the picture in 3-month postpartum, the funnel plot ofdyspareunia in 12-month postpartum was fairly symmetrical (Fig. 8).
 Fig. 6.
Funnel plot of dyspareunia in 3-month postpartumaccording to FSFI score. Notes: SE, standard error; MD, mean difference.
 Fig. 7.
Funnel plot of dyspareunia in 6-month postpartum according to FSFI score. Notes: SE, standard error; MD, mean difference.
 Fig. 8.
Funnel plot of dyspareunia in 12-month postpartum according to FSFI score. Notes: SE, standard error; MD, mean difference.
The forest plot scores for dyspareunia in3-month postpartum highlighted that the
diamond tilted more to the right, proving that the FSFI score was higher in
cesarean section (MD = 0.18; 95% CI = 0.19–0.54; p = 0.35; I
The forest plot of dyspareunia ratesin 12-month of postpartum demonstrated that
the diamond tilted more to the right. It means higher FSFI score in cesarean
section indicated lower dyspareunia. However, there was no statistically
significant difference in dyspareunia rates in 12-month postpartum after cesarean
sectionand vaginal delivery (MD = 0.12; 95% CI = –0.23–0.48; p = 0.5;
I
Regarding the diamond leaning to the right, it was evident that the dyspareunia rate was higher in vaginal delivery than in cesarean section. The meta-analysis by Manresa reported that mothers undergoing vaginal delivery with an intact perineum could still experience dyspareunia, higher especially in women who went through perineal tear or episiotomy during labor [12].
Even in elective cesarean section, there are still complaints of dyspareuniadue to breastfeeding factors, fatigue factors, or stress factors. A study on6-month postpartum concluded that among breastfeeding women (OR = 2.89; 95% CI = 2.33–3.59), women who were exhausted (OR 1.60, 95% CI 1.30–1.98) and were in stressful conditions (OR 1.55, 95% CI 1.18–2.02) had a higher risk of dyspareunia [26]. Besides, women with a surgical wound defect (niche) with adhesions after having caserean section were at risk of dyspareunia. A systematic review study in 2014 revealed that 18% of women with surgical wound defects (niche) complained of dyspareunia [27].
Cesarean sectioncould maintain the function of the woman’s pelvic floor. A meta-analysis comparing cesarean sectionand vaginal delivery reported that pelvic floor muscle strength, vaginal muscle tension, and maximum urinary flow rate after cesarean sectionwere better than vaginal delivery [13]. Although maternal characteristics at birth such as age or Body Mass Index (BMI) increase the risk of pelvic floor dysfunction pregnancy and delivery factors affect the pelvic floor anatomy and function [28].
A cesarean section, despite being performed electively, still carries a high risk of complications. A previous meta-analysis study showed that women who underwentcesarean delivery had a higher risk of death (OR = 3.10) and postpartum infection (OR = 2.83) [29]. Other studies have shown that cesarean delivery poseda higher risk of hysterectomy (OR = 1.30), obstetric shock (OR = 2.54), and anesthetic complications (OR = 2.18) [30]. Obstetric shock includes bleeding shock, pulmonary embolism, amniotic fluid embolism, and sepsis [31, 32].
From the above discussion, distinguished postpartum periods in the research were aimed at reducing the time factor as a confounder. However, there werestill some limitations in this study. First, the results might be influenced by many other confounding variables, such as the absence of data on the type of episiotomy in several studies andtype of abdominal incision in cesarean section, breastfeeding status, and a history of previous dyspareunia. As a result, the data obtained had high heterogeneity. Second, this current study implied a fairly high bias because the selection of the subjects was not done blindly. The future research could use randomized controlled trials design with a blind subject selection to reduce the research bias.
In all 3-month, 6-month, and 12-month of postpartum, the dyspareunia rate was likely lower in cesarean section although the difference was not statistically significant. Further meta-analysis studies need to evaluate other indicators compared between cesarean sectionand vaginal delivery. More studies, especially RCTs, can be included for possible further meta-analyses. It is important to inform pregnant women that vaginal delivery is not a major contributing factorto sexual dysfunction. Importantly, cesarean section should only be undertaken when there are medical indications for both mother and the fetus.
EMK: develop ideas and analysis data, ZMP: collecting and processing data, HP: finishing data and manuscript preparation.
Not applicable.
Authors thank to Universitas Airlangga for supporting the research.
This research received no external funding.
The authors declare no conflict of interest.