


 , X. Zhao 3,*
1 Department of Pharmacy, Affiliated Drum Tower Hospital, Medical School of Nanjing University, No.321 Zhongshan Road, Nanjing, P.R. China
2 Department of Endocrinology, Sir Run Run Hospital, Nanjing Medical University, No.109 Longmian Road, Nanjing, P.R. China
3 The Pharmaceutical college of Inner Mongolia medical university, No.5 XinHua Street, Hohhot, P.R. China
Abstract
Background: Very few studies have assessed the role of a clinical pharmacist in women with gestational diabetes mellitus (GDM). To improve pharmaceutical care, we explored a method to improve the control of blood glucose and perinatal outcomes in females with GDM through the application of a diabetes management system. Methods: A randomized controlled trial was conducted from October 2017 to October 2018 for 200 outpatients with GDM. In the study, a diabetes management system with pharmaceutical care was used for the intervention group. The clinical outcomes of all patients were recorded at the end of delivery. Results: From one sample of 200 patients, 169 finished the research. Compared with the control group, patients in the intervention group manifested greater reductions in fasting plasma glucose (5.22 ± 0.37 vs. 6.05 ± 1.06 mmol/L; P = 0.018), 2 h postprandial plasma glucose (6.66 ± 0.57 vs. 9.69 ± 1.58 mmol/L; P = 0.00), and glycated hemoglobin A1c corrected values (1.02 ± 0.12 vs. 1.16 ± 0.22; P = 0.023). Moreover, the rate of polyhydramnios was significantly lower in the intervention group than in the control group (0% vs. 10.59%; P = 0.003) as well as significantly fewer macrosomia in the intervention group (7.14% vs. 18.82%; P = 0.038). Conclusions: Using a diabetes management system, clinical pharmacists can improve the control of blood glucose and perinatal results in GDM females. With a diabetes management system, the comprehensive management of GDM is a new model for pharmaceutical care in the future.
Keywords
- Clinical pharmacist
- Diabetes management system
- Gestational diabetes mellitus
- Blood glucose control
- Perinatal outcome
Gestational diabetes mellitus (GDM), defined as glucose intolerance with onset or first recognition in pregnancy, has increased in urban China from 1999 to 2008 [1, 2]. GDM is linked with increased risks of maternal and infant morbidity, including preterm birth, macrosomia, and preeclampsia [3]. Additionally, an estimated 35-60% of women with GDM will develop type 2 diabetes mellitus within 10 years [4].
Barquiel et al. showed in an observational retrospective study that an average third-trimester glycated hemoglobin A1c (HbA1c) level ≥ 5% and gestational weight gain greater than the weight gain advocated by the Institute of Medicine are risk-related factors for neonatal complications in women with GDM [5]. Furthermore, a systematic review of 95,750 women demonstrates that preterm delivery in GDM pregnancies is associated with the future onset of type 2 diabetes [6]. Therefore, GDM is of vital importence for the confirmation of risk factors and counter measures to prevent the occurrence of perinatal complications.
Published reports indicate that treatment of GDM to accomplish tight glycemic control reduces serious perinatal morbidities [7, 8]. However, some patients find it difficult to achieve their blood glucose targets. Certain factors could be included, such as health beliefs, understanding less of the importance of great blood glucose control, failing to comply with a suggested regimen of blood glucose testing reached 7 times one day, and the necessity to regulate their insulin dosage [9]. Several studies indicate that a clinical pharmacist can act as a counsellor through a pharmaceutical care program to help patients in dealing their disease [10, 11]. Nevertheless, few studies assessed the impact of intervention by a clinical pharmacist on HbA1c reduction and perinatal outcomes in women with GDM. For a clinical pharmacist to effectively manage GDM, we developed a novel diabetes management system. This system was designed to dynamically show the change of blood glucose and to remind the clinical pharmacist to follow up women with GDM in a timely manner.
This study evaluated the impact of pharmaceutical care intervention provided by a clinical pharmacist on the control of HbA1c levels, blood glucose and perinatal outcomes in GDM through the application of diabetes management system (DMS).
A randomized controlled study of a clinical pharmacist intervention model for women with GDM was performed from October 2017 to October 2018. This study was conducted at an obstetric outpatient clinic. The study protocol was approved and executed according to the requirements of the Ethics Committee (approval number: 2017-017-01).
We included pregnant women if they met the following criteria: 1) they had an abnormal 2-h 75 g oral glucose tolerance test (OGTT) at 24 to 28 weeks of gestation (as defined by the International Association of Diabetes and Pregnancy Study Groups (IADPSG) recommendations); fasting plasma glucose (FBG) ≥ 5.1 mmol/L; and/or 1 h ≥ 10.0 mmol/L and/or 2 h ≥ 8.5 mmol/L); 2) they had a singleton pregnancy; 3) they were 18-40 years old; 4) they were willing to participate in the study and were able to give informed consent. The exclusion criteria were multiple pregnancies, pregestational diabetes, and pregnancies with confounding maternal morbidity factors.
Participants were randomized in a 1 : 1 ratio to the control group or intervention group using a table of random numbers generated by a computer. Patients and the clinical pharmacist had no prior knowledge of the intervention allocation. After randomization, patients and the clinical pharmacist were aware of the distribution of the intervention and control groups.
Participants belong to the control group only received the conventionnal care service supplied by the obstetric outpatient clinic. This included routine visits with the obstetrician until delivery. During these visits, patients underwent measurement of blood pressure, body weight and examination of routine urine and blood biochemistry, as well as measurement of the fetal abdominal circumference using B ultrasound. Additionally, patients were offered guidance on self-monitoring blood glucose (SMBG), administration of insulin and obstetric health education.
Over and above the conventional care, participants in the intervention group got a clinical pharmacist service with DMS application. The pharmacist did a face-to-face preliminary evaluation with the patients. After that, the patient received further consultation at the prescribed time. The patients also received remote contact by phone during the interval between scheduled follow-up visits in the clinic.
During the initial face-to-face consultations, the baseline of the patient was evaluated, including prepregnancy weight and body mass index (BMI), and the corresponding aim of weight gain during pregnancy was developed. Additionally, the clinical pharmacist informed the patient of the control goal for blood glucose and taught the patient how to self-monitor their blood glucose levels and administer insulin using an insulin pen. Daily dietary and glycemic record forms were delivered. The pharmacist provided the patient with individual diet instructions.
The clinical pharmacist also provided comprehensive pharmaceutical instructions to those patients whose blood glucose levels did not meet the control standard after the diet control. The patients were referred to the endocrinological clinic, which provided drug treatment. According to the physician’s prescription, the pharmacist recorded each drug and the dosage adjustment program into the DMS. The pharmacist also followed up with the patient’s blood glucose control and provided feedback to the physician to decide whether adjustments were necessary.
At each referral, the clinical pharmacist recorded patient indicators, such as weight, blood glucose, blood pressure, blood lipids, urine routine, and B-fetus abdominal circumference (AC) into the DMS. The clinical pharmacist communicated with the physician and adjusted the diet and insulin regimens with changes in gestational age, focusing on the correct use of insulin and medication adherence.
The DMS was divided into seven main module functions (see Figure1a), specifically for system login, newly diagnosed information, inspection information, evaluation system, follow-up system, data management and retrieval statistics. The system login is divided into clinical pharmacists, assistants and administrators with three different levels of authority at the login interface. Clinical pharmacists and assistants log in, and basic information and medical information can be entered, but they do not change or export data. The administrator has the right to modify or export data for statistical analysis for scientific research work. The newly diagnosed information, including the basic information of patients, past medical history and newly diagnosed treatment programs (nutrition distribution, exercise recommendations and medication programs), are used with the qualitative drop-down menu input method, and the patient diagnosis by the clinical pharmacists was recorded. The uniformity of data minimizes the sampling bias. The clinical information of the patients was recorded by the clinical pharmacists, including body weight, blood pressure, urine, blood lipids and B ultrasound fetal AC indicators. Patients with self-test blood glucose data were recorded in the disease management system, and the newly diagnosed information is different. A set of test indicator reference values, indicating patients with recent blood glucose control compliance, and in accordance with the inspection and monitoring indicators, was designed to improve the referral treatment program (nutrition distribution, exercise recommendations and medication program). The evaluation system had different questionnaires according to the different types of diabetes patients. The patients were input into the system after the automatic score to assess whether the patients receiving health education (diet, exercise, medication and SMBG) received adequate information to strengthen the education program. The follow-up system was based on the patient’s designated treatment program, and promptly reminded pharmacists to follow up with the patient. The main method for outpatient follow-up was microgroup and telephone communication, and individual patient guidance (medical nutrition education, SMBG and medication). For data management, the patients with weight, blood pressure, and blood glucose changes and medication, mainly insulin, were adjusted. The curve shows the clinical indicators of the patients with trends to provide full output and print functions. The retrieval statistics, mainly for the blood glucose and insulin 2 modules, can be retrieved for each patient’s blood glucose changes and medication details to analyze the individual treatment efficacy and group medication statistics, thereby providing timely guidance to physicians to change the medication strategy.
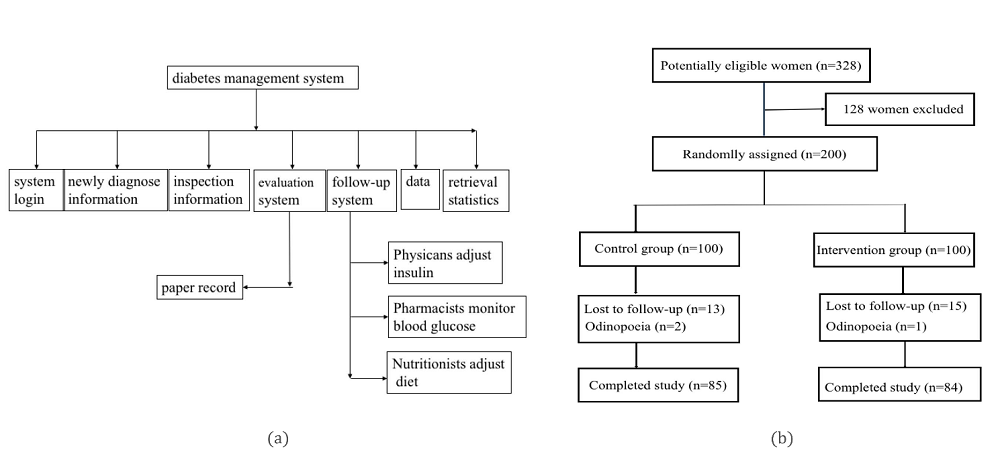 Figure1.
— (a) Diabetes management system. The DMS was divided into seven main module functions, specifically for system login, newly diagnosed information, inspection information, evaluation system, follow-up system, data management and retrieval statistics. (b) Flowchart of study patients. Total up to 200 pregnant women were enlisted and randomized, and 169 (85 in the control group and 84 in the treatment group) finished this research and were covered in the comparative analysis.
The main outcomes of this study were the change from baseline in the A1C level and pregnant outcomes during the intervention period. Pregnancy outcomes were maternaland neonatal outcomes. The former included weight gain during pregnancy, preterm delivery (delivered prior to 37 weeks of gestation), hydramnios, and cesarean section. The latter included macrosomia (defined as birthweight 4000 g, regardless of gestational age), intrauterine fetal death, and congenital malformation.
Secondary outcomes of interest were obstetrical monitoring indices, such as blood pressure, blood lipids, and B-fetus abdominal circumference. The diagnostic criteria for dyslipidemia in adults are as follows: (1) TC ≥ 5.18 mmol/L; (2) TG ≥ 3. 5 mmol/L; (3) LDL - C ≥ 3.37 mmol/L; and (4) HDL - C ≤ 1. 04 mmol / L. If one of the above are meet, then there are abnormal blood lipids during pregnancy [12].
Blood samples were drawn from the medial cubital vein, and all measurements were carried out in the central laboratory of our hospital. The nursing staff measured the blood pressure before each scheduled outpatient visit using an automatic blood pressure monitor (Microlife BP A100, Microlife, Shenzhen, China) and standard clinical practices. The outcome evaluator were blinded and unknowing to which group the patients had been assigned.
Statistical analyses were performed using Statistical Package for Social Sciences (SPSS), Version 18.0 (Chicago, IL, USA). Two-sample comparisons were analyzed by Student’s t-test for normally distributed variables and Mann-Whitney test for nonnormally distributed data. The data were represented by frequencies (percentage) and mean (standard deviation). Additionally, multiple logistic regression models were used to research the risk factors of adverse pregnancy outcomes. For all analyses, a P value < 0.05 was considered statistically significant.
Total up to 200 pregnant women were enlisted and randomized, and 169 (85 in the control group and 84 in the treatment group) finished this research and were covered in the comparative analysis (see Figure 1b). The two groups were well matched for baseline characteristics (P > 0.05 for all comparisons) (Table 1).
| Variable | Control(n = 85) | Intervention (n = 84) | P value |
| Age, yrs | 29.98 ± 3.81 | 30.05 ± 3.49 | 0.883 |
| Gravidity | 1.92 ± 0.98 | 1.83 ± 0.83 | 0.548 |
| Parity | 0.34 ± 0.57 | 0.24 ± 0.43 | 0.185 |
| BMI, kg/m2 | 23.34 ± 4.34 | 23.54 ± 3.95 | 0.752 |
| HbA1c corrected value | 1.01 ± 0.18 | 1.02 ± 0.16 | 0.893 |
| SBP | 121.18 ± 11.98 | 120.33 ± 12.27 | 0.652 |
| DBP | 73.48 ± 10.41 | 74.21 ± 10.64 | 0.652 |
BMI, body mass index; HbA1c, glycosylated hemoglobin; HbA1c corrected value: the ratio of the corresponding patient HbA1c value to the patient control index value, wherein the GDM control index value is HbA1c < 5.5%; SBP, systolic blood pressure; DBP, diastolic blood pressure.
The changes in the primary and secondary clinical outcomes of the study are presented in Table 2-4. The intervention group had significant reductions both in FPG (P = 0.02) and 2h postprandial plasma glucose (PPG) (P = 0.00) levels, whereas only the 2h PPG level was significantly reduced in the control group (P = 0.03). However, there were significant increases in systolic and diastolic blood pressures, both in the intervention group and control group.
| Outcome | Intervention (n = 84) | Control (n = 85) | p value between groups | ||||
| Baseline | Final | p value | Baseline | Final | p value | ||
| FPG (mmol/L) | 6.12 ± 1.04 | 5.22 ± 0.37 | 0.02a | 6.26 ± 1.26 | 6.05 ± 1.06 | 0.241 | 0.018a |
| 2h PPG (mmol/L) | 10.15 ± 1.89 | 6.66 ± 0.57 | 0.00a | 10.34 ± 2.23 | 9.69 ± 1.58 | 0.03a | 0.00a |
| HbA1c corrected | 1.02 ± 0.16 | 1.02 ± 0.12 | 0.932 | 1.01 ± 0.18 | 1.16 ± 0.22 | 0.02a | 0.023a |
| SBP (mmHg) | 120.33 ± 12.27 | 134.21 ± 10.75 | 0.034a | 121.18 ± 11.98 | 135.57 ± 13.89 | 0.036a | 0.674 |
| DBP (mmHg) | 74.21 ± 10.64 | 93.86 ± 10.04 | 0.025a | 73.48 ± 10.41 | 95.67 ± 11.23 | 0.026a | 0.552 |
FPG, fasting plasm glucose; PPG, postprandial plasm glucose; HbA1c corrected value: the ratio of the corresponding patient HbA1c value to the patient control index value, wherein the GDM control index value is HbA1c < 5.5%; SBP, systolic blood pressure; DBP, diastolic blood pressure. a Shows statistical significance.
| Outcome | Intervention (n = 84) | Control (n = 85) | P value |
| TC (mmol/L) | 5.38 ± 1.16 | 5.62 ± 1.42 | 0.023a |
| TG (mmol/L) | 3.30 ± 2.37 | 3.86 ± 2.99 | 0.018a |
| LDL-C (mmol/L) | 2.28 ± 0.71 | 2.45 ± 0.95 | 0.196 |
| HDL-C (mmol/L) | 1.72 ± 0.36 | 1.55 ± 0.44 | 0.01a |
TC, total cholesterol; TG, triglyceride; LDL-C, low density lipoprotein cholesterol; HDL-C, high density lipoprotein cholesterol. a Shows statistical significance.
| Normal | Above tde range | Below tde range | |
| Control(n = 85) | 56 (65.88%) | 28 (32.94%) | 1 (1.18%) |
| Intervention(n = 84) | 76 (90.48%) | 6 (7.14%) | 2 (2.38%) |
| P value | < 0.01a | < 0.01a |
a Shows statistical significance.
Compared with the control group, patients in the intervention group showed greater reductions in FPG (P = 0.018) and 2h PPG (P = 0.00) levels. Triglyceride (TG) (P = 0.018) and cholesterol (TC) (P = 0.023) levels were decreased in the intervention group compared with the control group. However, there were no significant differences in systolic or diastolic blood pressures between the two groups (P > 0.05).
The HbA1c corrected value is the ratio of the corresponding patient HbA1c value to the patient control index value, wherein the GDM control index value is HbA1c < 5.5%. The HbA1c corrected values were not changed in the treatment group (P = 0.932), whereas the values in the control group were significantly increased (P = 0.02). Compared to the control group, the HbA1c corrected values showed a significant decline in the intervention group (P = 0.023). ∆HbA1c which reflect the HbA1c changes after management dramatically decreased in the treatment group compare to the control group (P = 0.00) (see Figure 2).
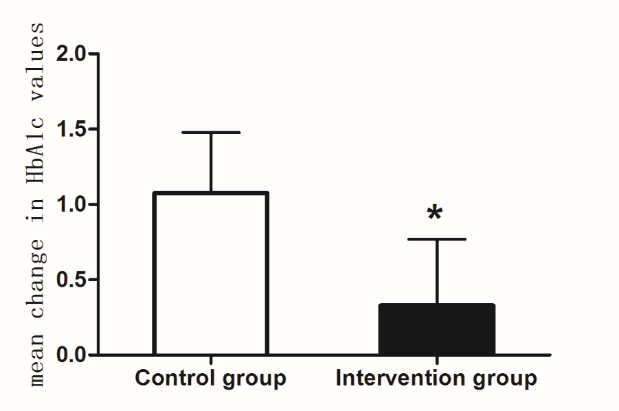 Figure 2.
— Mean change in HbA1c values during study duration. Mean change in HbA1c values were dramatically higher in the control group than in the intervention group. * Shows statistical significance.
The rate of fetal abdominal circumference (AC) in the B ultrasound grew in the normal range and was significantly higher in the intervention group than in the control group (90.48% vs. 65.88%, P < 0.01). By contrast, the rate of fetal AC in B ultrasound grew out of the normal range and was significantly higher in the control group than in the intervention group (32.94% vs. 7.14%, P < 0.01).
Table 5. shows the clinical outcomes among the infants and their mothers in the study. Although gestational weight gain among the two groups was within the weight range of the recommendations for the women’s BMI, the control group had greater gestational weight gain than did the intervention group (P < 0.05). The rate of polyhydramnios was obviously lower in the treatment group than in the control group (P = 0.003). The rate of premature delivery, as well as the rate of cesarean delivery, were similar in the two groups (P > 0.05). There were no significant differences in gestational weeks between the two groups, which were both term deliveries (P > 0.05).
| Outcome | Intervention |
Control |
P value |
| Women | |||
| Gestational weight gain1 | 0.77 ± 0.39 | 0.94 ± 0.48 | 0.015a |
| Gestational weight gain2 | 1.18 ± 0.64 | 1.45 ± 0.87 | 0.021a |
| Premature delivery | 1/84 (1.19%) | 3/85 (3.53%) | 0.076 |
| Gestational age at delivery (weeks) | 38.46 ± 1.77 | 37.83 ± 2.11 | 0.1 |
| Cesarean delivery | 42/84 (50%) | 55/85 (64.7%) | 0.054 |
| Polyhydramnios | 0/84 (0%) | 9/85 (10.59%) | 0.003a |
| Infants | |||
| Fetal malformation | 6/84 (7.14%) | 5/85 (5.88%) | 0.766 |
| Macrosomia | 6/84 (7.14%) | 16/85 (18.82%) | 0.038a |
| Intrauterine fetal death | 0/84 (0%) | 2/85 (2.35%) | 0.497 |
Gestational weight gain 1 is the ratio of the weight gain of each patient during pregnancy to the upper limit of the recommended weight gain of pre-pregnancy BMI. Gestational weight gain 2 is the ratio of the weight gain of each patient during pregnancy to the lower limit of recommended weight gain for pre-pregnancy BMI. a Shows statistical significance.
Significantly fewer infants in the intervention group had macrosomia (defined by a birth weight of 4 kg or greater) (P = 0.038). No intrauterine fetal death occurred in the intervention group, but there were two intrauterine fetal deaths in the control group (0% vs. 2.35%, P = 0.497). There was no significant difference in the rates of fetal malformation between the intervention and control groups (P > 0.05).
This trial provides valuable information regarding the role of clinical pharmacists using DMS for women with GDM. The results suggest that with the application of DMS, clinical pharmacists can improve blood glucose control and perinatal outcomes in pregnancy-associated diabetes.
Compared with the control group, patients in the intervention group showed greater reductions in FPG and 2 h PPG levels, particularly in the 2 h PPG level. HAPO studies indicated a continuously increasing association between the maternal blood glucose levels and adverse perinatal outcomes, including neonatal hypoglycemia, frequency of LGA, cord blood serum C-peptide level above the 90th percentile, and primary cesarean section delivery [13, 14]. Because maternal insulin does not freely access the matrix and placenta, the maternal hyperglycemic state will lead to increased fetal glucose absorption [15]. At the same time, elevated blood glucose will increase maternal insulin resistance and dyslipidemia [16, 17]. Scientific evidence also suggests that the control of blood glucose levels with management strategies can decrease the frequency of congenital anomalies and improve maternal and neonatal outcomes in GDM cases.18 In our study, there was significant decrease in 2 h PPG compared to FPG, indicating that blood glucose management was more efficient for 2h PPG and that control of 2 h PPG was associated with adverse perinatal outcomes [19].
A1C is a crucial and frequently-used indicator for examing glycemic control. In our study, there was no significant difference in the HbA1c corrected value in the intervention group between the first visit and delivery. Blood glucose reached the standard level after administration, indicating that blood glucose management can significantly improve the average blood glucose level. ∆HbA1c values, which reflected the change of HbA1c after management, were dramatically higher in the control group than in the intervention group. The results showed that the average blood glucose level of the intervention group was better than that in the control group, and that blood sugar control was stable and reached the expected goal. At present, the standard of HbA1c control during pregnancy has not been verified. In this study, we used HbA1c ≤ 5.5% of patients with GDM, recommended by most studies [20]. Higher HbA1c at GDM screening suggests developing GDM in subsequent trimesters is more likely to happen [21, 22], or of severe GDM and optimal glycemic control is less likely to achieved [23, 24], thereby placing pregnant women at a higher risk of disadvantageous pregnancy outcomes. In our present study, we found that HbA1c before delivery was associated with adverse perinatal outcomes.
Besides better glycemic control, the intervention group showed great enhancement in reducing TG and TC levels, as well as increasing HDL cholesterol levels. A physiological high-fat state occurs during pregnancy. Increased blood lipids within a certain range can meet the fetus's growth and development needs, and produce energy reserves during pregnancy and lactation. However, if blood lipids rise above a certain level, dyslipidemia may be related to adverse outcomes of pregnant women, including insulin resistance, GDM, preeclampsia and macrosomia [25]. After 21 weeks of gestation, blood lipid levels continue to rise and will remain at a stable level after 31 weeks [26]. Additionally, TG will increase 2-4 times during pregnancy, and TC levels will increase by 25-50% [27]. In our study, although the TC levels in the two groups were higher than those in normal adults, they remained within the normal range during pregnancy. There were differences in HDL-C levels between the two groups, indicating that the intervention group had a balanced diet during pregnancy, and the intake of unsaturated fatty acids was significantly higher than that of the control group. The individual guidance by a clinical pharmacist regarding nutrition achieved certain results.
Blood pressure (BP) is another monitoring indicator during pregnancy. In our study, there were no significant differences in systolic or diastolic blood pressures between the intervention groups and control group. A current meta-analysis indicated that pharmacist interventions had differential effects on BP, from a very large to modest or no effect, and determinants of heterogeneity could not be identified [28].
Polyhydramnios is associated with poor glycemic control throughout pregnancy. Reece EA et al. showed that the incidences of polyhydramnios in PGDM patients and normal pregnant women are 7.3% and 0.7%, respectively [29]. McMahon MG et al., in another study, indicated that the incidence of polyhydramnios in GDM patients is 4.8%, which is 7 times the normal population [30]. In our study, the incidence of polyhydramnios in the intervention group was significantly lower than that in the control group. Moreover, the intervention group had better glycemic control than did the control group, suggesting that excellent glycemic control may reduce the odds of polyhydramnios.
Risk factors previously reported for macrosomia include elevated maternal BMI, diabetes mellitus, multiparity, and gestational age > 40 weeks [31]. In the HAPO study, the frequency of macrosomia was increased in GDM by 50% compared to non-GDM mothers. He XJ et al., in a meta-analysis, indicated that GDM was associated with macrosomia independent of other risk factors [32]. In the intervention group, blood glucose control during pregnancy was better than that of the control group, and the incidence of macrosomia was reduced. Reasonable control of blood glucose during pregnancy can significantly reduce the occurrence of macrosomia [33]. In a retrospective analysis of maternal women with macrosomia, the incidences of macrosomia in PGDM with FPG < 5.8 mmol / L and FPG ≥ 5.8 mmol/L were 9% and 24%, respectively [34]. In terms of decreasing the incidence of macrosomia, controlling PPG reduction is more significant than controlling FPG is. For example, PPG (2-h) < 6.7 mmol/L can significantly reduce the incidence of macrosomia, and reasonable control of PPG will also significantly reduce HbA1c values [35].
This study shows that clinical pharmacists, combined with a chronic disease management system to follow-up and provide guidance for pregnant patients with diabetes, effectively improves the patient's blood glucose control level and perinatal outcomes. The clinical pharmacist can improve the management of pregnant patients with diabetes using the following methods: (1) the clinical pharmacist registers the patient information in the system at the initial diagnosis and conducts health education, including medical nutrition distribution, SMBG, insulin use, and common sense of medication during pregnancy; (2) during the re-examination, the clinical pharmacist provides pharmacy consultations for the patient to solve problems related to blood glucose management at any time, and the patients who use insulin therapy have a targeted explanation of insulin use and their blood sugar control is registered in the system; (3) clinical pharmacists use the chronic disease management system to evaluate the patient's glycemic control, find that they are not followed up in time, and supervise and guide their diet, exercise, drug treatment and blood glucose monitoring. In addition, monitoring obstetric indicators (body weight, blood pressure, urine routine, blood lipid biochemical indicators and B-ultrasound AC) can detect risk factors that cause adverse outcomes (premature weight gain during pregnancy, pre-eclampsia and giant children), to improve maternal and child perinatal outcomes.
There are still some limitations in this study. The first is this study was carried out in a single location by one specific pharmacist, which imposes restrictions on the recapitulation of our findings. Second, the physicians were aware of the clinical pharmacy service, which may affected the care of patients with GDM in control and treatment groups. In addition, humanistic outcomes, such as quality of life and patient satisfaction, were not covered in this study, because of the time available for the pharmaceutical consultation is limited.
In summary, this study shows that a diabetes management system used by a clinical pharmacist is feasible and more effective than the conventional care is for improving the control of blood glucose and avoiding adverse perinatal outcomes in women with GDM. Research in the future need to supervise the benefits in the long run and persistence of the diabetes management system.
This project was supported by the Nanjing Pharmaceutical Association, Changzhou Four Hospital (Grant No.: 2018YX010).
The authors declare no conflict of interest.