


 , Afonso Marques Morais 1, Sara Miguel Almeida 1, Inês Salgado 1, Luís Relvas 3, Celdidy Monteiro 4, Guilherme Queiroz 1,5, Celeste Bento 1,2
1 Centro de Investigação em Antropologia e Saúde (CIAS), Universidade de Coimbra, 3000 Coimbra, Portugal
2 Departmento de Ciências da Vida, Universidade de Coimbra, 3000 Coimbra, Portugal
3 Departmento de Hematologia, Centro Hospitalar e Universitário de Coimbra (CHUC), 3000 Coimbra, Portugal
4 Hospital Dr. Ayres de Menezes, São Tomé, República Democrática de São Tomé e Príncipe
5 Unidade de Saúde Pública, Unidade Local de Saúde da Região de Aveiro, 3810 Aveiro, Portugal
Abstract
While an increase in fetal hemoglobin (HbF) has no consequences in healthy adults, clinical benefits can be promoted in sickle cell disease (SCD) and β-thalassemia patients. Single-nucleotide polymorphisms (SNPs) in three genomic regions: the HBB gene cluster, the BCL11A gene, and the HBS1L-MYB (HMIP) intergenic region, have been associated with HbF regulation. Therefore, the present study aimed to examine the potential association of SNPs in BCL11A (rs11886868 and rs1427407), HMIP (rs66650371 and rs4895441), HBG2 (rs7482144), and BGLT3 (rs7924684) with HbF levels in an adult population sample from São Tomé e Príncipe (Central Africa).
A total of 145 women aged 18 to 49 years were involved in this study, comprising 98 women with the normal hemoglobin (Hb) genotype (HbAA) and 47 with sickle cell trait (HbAS). From the HbAA individuals, we selected a control group of 60 subjects with normal HbF levels, ranging from 0.2% to 1.4% (mean: 0.75%), and a case group of 38 subjects with elevated HbF levels, ranging from 1.8% to 3.7% (mean: 2.35%). In the group of HbAS individuals, the HbF levels ranged from 0.4% to 3.7% (mean: 1.56%). SNP genotyping was conducted using standard molecular methods.
Logistic regression, in the additive model, revealed significant associations with increased levels of HbF for the minor alleles of the two BCL11A SNPs, rs11886868 [C] and rs1427407 [T], in HbAA women (p = 0.00018 and p = 0.00076, respectively). When comparisons of HbF levels were conducted among genotypes in the HbAA women, significant differences were observed for BCL11A SNPs rs11886868 and rs1427407, as well as for the HBG2 rs7482144 and BGLT3 rs7924684 variants. We found no association between HbF levels and the two HMIP variants rs66650371 and rs4895441 in the HbAA women. Among the HbAS women, no statistically significant associations were observed between the six analyzed polymorphisms and HbF levels (p > 0.05).
We successfully replicated the association between the two well-known BCL11A SNPs, rs11886868 and rs1427407, with HbF levels in women with the normal HbAA genotype from São Tomé e Príncipe. Other signals of association with HbF levels were identified for the SNPs HBG2 (rs7482144) and BGLT3 (rs7924684).
Keywords
- HbF regulation
- BCL11A
- HMIP
- HBG2-XmnI
- BGLT3
- São Tomé e Príncipe
Fetal hemoglobin (HbF) is a tetrameric molecule composed of two alpha-globin and
two gamma-globin chains (
In adults of African descent with sickle cell disease (SCD), HbF typically
comprises 4% to 10% of the total hemoglobin levels, although it rarely exceeds
30% [2]. In contrast, African Americans with sickle cell trait (HbAS) have a
mean HbF level of 1.4% [4]. While the increase in HbF levels has no consequences
in healthy adults, it can provide clinical benefits in patients with SCD and
Research has shown that variations in HbF levels in adults are significantly
influenced by genetic factors [5, 8]. One of the most studied variants is the XmnI
restriction site polymorphism located in the promoter region of the HBG2
gene, upstream of the transcription start site (–158C
Additionally, minor alleles of several single nucleotide polymorphisms (SNPs) in
two other quantitative trait loci (QTL), the BCL11A gene on chromosome 2
and the HBS1L-MYB (HMIP) intergenic region on
chromosome 6, are also strongly associated with HbF regulation [5]. Both
genes BCL11A and MYB encode repressors of
Variants in these three QTLs have been reported to contribute up to 50% of HbF variation [11]. The increase of HbF remaining unexplained could be a result of rare alleles or polymorphic variations in other genes coding for protein factors involved in the regulation of HbF production, such as KLF1 that activates expression of the BCL11A gene [12] or other still uncharacterized HbF repressors. Moreover, the impact of these variants can be different from one population to another, depending on how common a risk allele is in a population. For example, in European populations, a strong HbF influence is known for variants at HMIP, which are rare in the Sub-Saharan populations and hence have a low impact on HbF levels in such populations [11].
The high prevalence of SCD in Africa justifies genetic studies linked to HbF regulation in African populations. Although many HbF association studies were implemented in SCD patients of African ancestry [13], a large proportion of the HbF variance remains unexplained. Additional studies in healthy populations could highlight different genetic factors or pathophysiological pathways associated with HbF regulation. Therefore, the present study examines for the first time an adult population sample of the São Tomé e Príncipe archipelago in Central Africa for the potential association with HbF levels of several SNPs in the HBB gene cluster, BCL11A gene, and HMIP intergenic region.
The archipelago of São Tomé e Príncipe is located on the Equator in the Gulf of Guinea (Central Africa). A total of 145 women (18–49 years; mean 33.06) living in São Tomé and Príncipe were involved in this study, 98 having the normal hemoglobin (Hb) genotype (HbAA) and 47 with sickle cell trait (HbAS). This study population is a subsample of that previous analyzed by Queiroz et al. [14] for the prevalence of sickle cell trait and other hemoglobin variants in women of reproductive age from São Tomé e Príncipe. In the group of HbAA women, we selected a control group consisting of 60 subjects who had normal HbF values ranging from 0.2% to 1.4% (mean 0.75%) and a case group of 38 subjects with elevated HbF levels ranging from 1.8% to 3.7% (mean 2.35%). Among the 47 individuals with HbAS, the HbF levels range from 0.4% to 3.7% (mean 1.56%). Table 1 presents the demographic and hematological parameters of the study population. The measurement of HbF and other Hb variants were performed with the Automatic Glycohemoglobin Analyzer point-of-care device Lab001 (ARKRAY Inc., Kyoto, Japan) or, when this was not possible, by high performance liquid chromatography (HPLC) on the VARIANT II™ Hemoglobin Testing System (Bio-Rad Laboratories Inc., Hercules, CA, USA) in the laboratory context, as previously described in Queiroz et al. [14]. The HbAS condition was defined as a proportion of HbS between 20% and 45% and the HbAA condition was defined as a proportion of HbA above 70% showing no other Hb variants of interest [14].
| Parameters | Total | Group 1 | Group 2 |
| (HbF |
(HbF | ||
| Women with HbAA | |||
| Number | 98 | 60 | 38 |
| Age (years): Mean (SD) | 33.00 (8.15) | 33.58 (8.77) | 32.08 (7.07) |
| Age (years): Median (IQR) | 33 (11) | 33.00 (17) | 33 (10) |
| Age (years): Range | 18–49 | 18–49 | 18–45 |
| HbF (%): Mean (SD) | 1.37 (0.88) | 0.75 (0.3) | 2.35 (0.52) |
| HbF (%): Median (IQR) | 1 (1.4) | 0.8 (0.4) | 2.2 (0.83) |
| HbF (%): Range | 0.20–3.7 | 0.2–1.4 | 1.8–3.7 |
| Women with HbAS | |||
| Number | 47 | ||
| Age (years): Mean (SD) | 33.19 (8.11) | ||
| Age (years): Median (IQR) | 33 (11) | ||
| Age (years): Range | 18–49 | ||
| HbF (%): Mean (SD) | 1.56 (0.77) | ||
| HbF (%): Median (IQR) | 1.4 (0.80) | ||
| HbF (%): Range | 0.4–3.7 | ||
Abbreviations: SD, standard deviation; IQR, interquartile range; HbF, fetal hemoglobin; HbAA, normal hemoglobin; HbAS, sickle cell trait.
Blood samples were collected on Guthrie filter paper (blood spots) from each individual and DNA extraction was carried out with the innuPREP Forensic Kit (LOT 021-23) (Innuscreen, GmbH, Berlin, Germany) according to the manufacturer’s instructions.
The SNPs BCL11A rs1427407, HMIP rs4895441, HBG2
rs7482144 (XmnI) and BGLT3 rs7924684 were genotyped throughout the
technique polymerase chain reaction - restriction fragment length polymorphism
(PCR-RFLP). The PCR was performed with the Qiagen Multiplex PCR kit (Qiagen GmBH,
Hilden, Germany) in a 12.5 µL reaction volume containing 10–50 ng
of genomic DNA, 1
Allele frequencies for the different SNPs were calculated by direct counting and the departure from Hardy-Weinberg equilibrium (HWE) was calculated by an exact test. In the HbAA women, the association was tested by logistic regression in additive and dominant models, crude and adjusted for age, splitting participants in two groups: subjects with increased HbF levels vs. subjects with normal HbF levels, using 1.5% HbF as cutoff. Among individuals with HbAS, the association between individual SNPs and levels of HbF was explored by linear regression models after logarithmic transformation of HbF values to normalize the quantitative trait distribution. Haplotype association was tested using a case-control approach in HbAA individuals and by linear regression in HbAS individuals. Haplotype associations were tested using the --hap-assoc command in Plink which estimates haplotype frequencies via the expectation-maximization algorithm. All these tests were performed using the software Plink v1.07 (https://zzz.bwh.harvard.edu/plink/download.shtml) [17].
The normality of the data was evaluated using the Shapiro-Wilk and Kolmogorov-Smirnov tests. To compare HbF levels between genotypes in HbAA women, we employed the non-parametric Kruskal-Wallis test or the Mann-Whitney U test, depending on the number of categorical independent groups involved. Graphical analyses and data normality tests were performed with IBM® SPSS® Statistics, version 27 (IBM-SPSS Statistics, Chicago, IL, USA).
The allelic and genotype frequencies of the six individual SNPs analyzed in the
HbAA women are presented in Table 2. The minor allele frequencies (MAF) were:
0.306 and 0.276 for the BCL11A SNPs rs11886868 [C] and rs1427407 [T],
respectively; 0.036 and 0.046 for the HMIP SNPs rs66650371 [3 bp del]
and rs4895441 [G], respectively; and 0.143 and 0.184 for the HBG2
rs7482144 [T] and BGLT3 rs7924684 [T] SNPs, respectively. All genotype
distributions were in accordance with the HWE (p
| Chr:position | SNP ID | Gene | Alleles | MAF | p-HWE | MAF (11/12/22) | MAF (11/12/22) | OR | OR |
| (hg38) | 1:2 | (n = 98) | HbF |
HbF |
(95% CI) | (95% CI) | |||
| (n = 60) | (n = 38) | p-value (*) | p-value (**) | ||||||
| 2:60493111 | rs11886868 | BCL11A | C:T | 0.306 | 0.093 | 0.192 | 0.487 | 3.53 | 2.76 |
| (0/23/37) | (13/11/14) | (1.82–6.83) | (1.19–6.39) | ||||||
| p = 0.00018 | p = 0.018 | ||||||||
| 2:60490908 | rs1427407 | T:G | 0.276 | 0.023 | 0.175 | 0.434 | 3 | 2.29 | |
| (0/21/39) | (12/9/17) | (1.58–5.69) | (0.99–5.26) | ||||||
| p = 0.00076 | p = 0.05 | ||||||||
| 6:135097495…499 | rs66650371 | HMIP | Del:TAC | 0.036 | 1 | 0.025 | 0.053 | 2.24 | 2.24 |
| (0/3/57) | (0/4/34) | (0.47–10.6) | (0.47–10.6) | ||||||
| p = 0.311 | p = 0.311 | ||||||||
| 6:135105435 | rs4895441 | G:A | 0.046 | 1 | 0.042 | 0.053 | 1.29 | 1.29 | |
| (0/5/55) | (0/4/34) | (0.33–5.16) | (0.33–5.16) | ||||||
| p = 0.715 | p = 0.715 | ||||||||
| 11:5254939 | rs7482144 | HBG2 | T:C | 0.143 | 0.405 | 0.117 | 0.184 | 1.65 | 1.34 |
| (0/14/46) | (3/8/27) | (0.75–3.60) | (0.53–3.36) | ||||||
| p = 0.212 | p = 0.535 | ||||||||
| 11:5245498 | rs7924684 | BGLT3 | T:C | 0.184 | 0.305 | 0.225 | 0.118 | 0.49 | 0.43 |
| (4/19/37) | (1/7/30) | (0.22–1.09) | (0.17–1.09) | ||||||
| p = 0.082 | p = 0.077 |
Abbreviations: Del, allele with TAC deletion; OR, odds ratio; CI, confidence interval; Alleles, 1-minor, 2-major; MAF, minor allele frequency; Genotypes, 11-homozygous for the minor allele, 12-heterozygous, 22-homozygous for the major allele; n, number of samples; p-HWE, p-value for Hardy–Weinberg Equilibrium.
The p-value for association was obtained by binary logistic regression under the additive (*) and dominant (**) models. Significant association p-values are in bold.
The logistic regression, under the additive model, showed that the minor allele
of the two BCL11A polymorphisms rs11886868 [C] and rs1427407 [T] present
a significant association with increased levels of HbF (p = 0.00018 and
p = 0.00076, respectively). The remaining four polymorphisms showed no
significant association (p
Consistent with these results, when comparisons of continuous HbF levels were
made among the three genotypes using the Kruskal-Wallis test, the homozygous
individuals for the minor allele of the two BCL11A SNPs rs11886868 and rs1427407
exhibited significantly higher HbF levels (p
| Chr:posição (hg38) | Gene | SNP ID | Genotypes | Mean | Median | p-value (*) | p-value (**) |
| (n) | (SD) | (IQR) | |||||
| 2:60493111 | BCL11A | rs11886868 | T/T (51) | 1.13 (0.77) | 0.90 (1.30) | 0.000013 | 0.006 |
| T/C (34) | 1.27 (0.75) | 0.90 (1.13) | |||||
| C/C (13) | 2.56 (0.63) | 2.30 (1.20) | |||||
| 2:60490908 | BCL11A | rs1427407 | G/G (56) | 1.18 (0.79) | 0.90 (1.18) | 0.000016 | 0.01 |
| G/T (30) | 1.23 (0.70) | 0.95 (1.05) | |||||
| T/T (12) | 2.62 (0.61) | 2.40 (1.00) | |||||
| 6:135097495 | HMIP | rs66650371 | TAC/TAC (91) | 1.35 (0.88) | 0.90 (1.30) | N/A | 0.336 |
| TAC/Del (7) | 1.64 (0.89) | 1.80 (1.30) | |||||
| 6:135105435 | HMIP | rs4895441 | A/A (89) | 1.34 (0.88) | 0.90 (1.35) | N/A | 0.224 |
| A/G (9) | 1.61 (0.80) | 1.40 (1.50) | |||||
| 11:5254939 | HBG2 | rs7482144 | C/C (73) | 1.30 (0.87) | 1.50 (1.00) | 0.031 | 0.132 |
| C/T (22) | 1.39 (0.80) | 1.05 (1.23) | |||||
| T/T (3) | 2.83 (0.23) | 2.70 (-) | |||||
| 11:5245498 | BGLT3 | rs7924684 | C/C (67) | 1.50 (0.91) | 1.20 (1.40) | 0.099 | 0.032 |
| C/T (26) | 1.09 (0.75) | 0.90 (1.18) | |||||
| T/T (5) | 1.00 (0.60) | 0.90 (1.15) |
Abbreviations: Del, allele with TAC deletion; n, number of samples; N/A, not
applicable; SD, standard deviation; IQR, interquartile range. The
p-values were obtained with the Kruskal-Wallis (*) test or the
Mann-Whitney U (**) test. In the Mann-Whitney U test for SNPs rs11886868,
rs1427407, rs7482144, and rs7924684, heterozygous and homozygous genotypes for
the minor allele were grouped. Significant p-values (
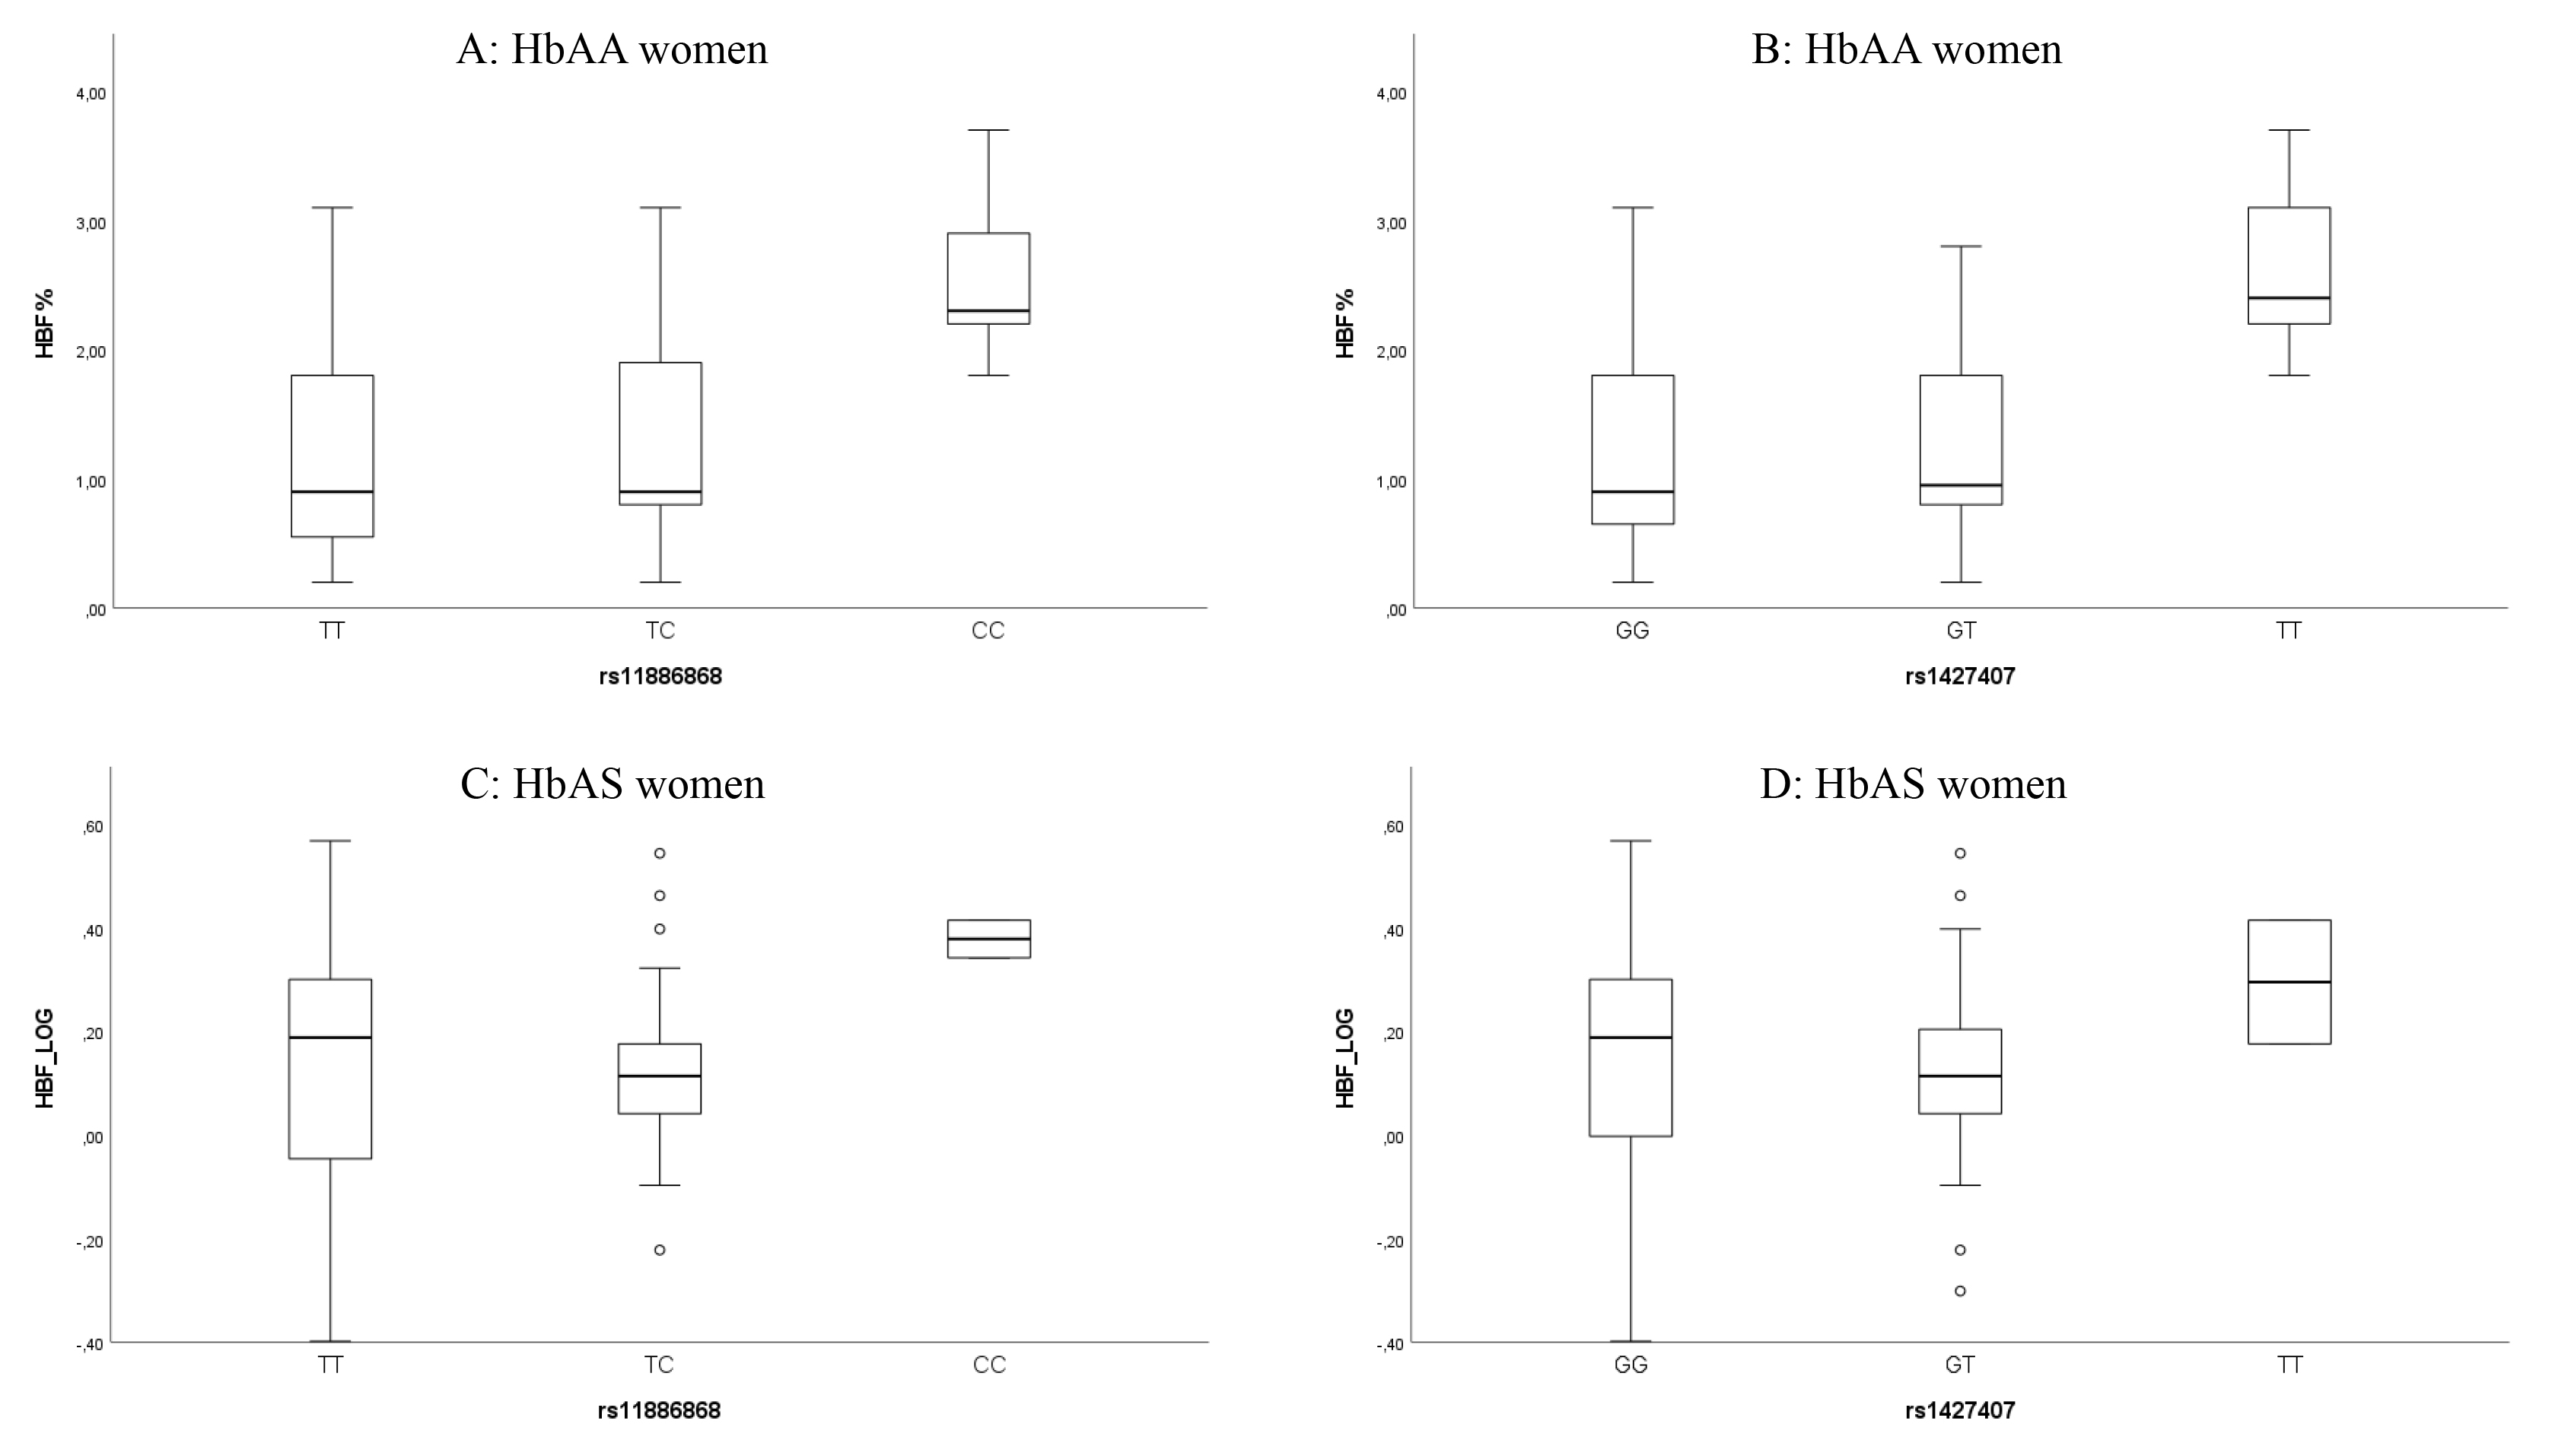 Fig. 1.
Box plots showing the distribution of HbF levels within genotypes of the two BCL11A SNPs rs11886868 and rs1427407 in HbAA women (A,B), and in women with HbAS after logarithmic transformation, base 10 (C,D). Each rectangle represents the data between the 25th and 75th quartiles, and the bar within each rectangle is the median value for HbF.
Of note, for the SNP rs7482144 (XmnI), homozygous individuals for the minor allele [T] present higher HbF levels in comparison with heterozygous and homozygous for the major allele [C] (Supplementary Fig. 1), with significant differences observed in the Kruskal-Wallis test (p = 0.031); however, this significance does not hold for the Mann-Whitney U test comparing homozygous for the major allele vs. heterozygous and homozygous for the minor allele grouped together (Table 3). Otherwise, for the BGLT3 SNP rs7924684, homozygous individuals for the major allele [C] show higher levels of HbF (Supplementary Fig. 2), with a significant difference (p = 0.032) in the Mann-Whitney U test when comparing homozygous for the major allele vs. heterozygous and homozygous for the minor allele grouped together (Table 3).
The haplotype association test showed the BCL11A
rs11886868
The genetic and association data of the six individual SNPs analyzed in women
with HbAS were displayed in Table 4. The MAF for the analyzed polymorphisms were:
0.309 for BCL11A rs11886868 [C] and rs1427407 [T], 0.032 and
0.064 for HMIP rs66650371 [3 bp del] and rs4895441 [G], respectively; and
0.096 and 0.138 for HBG2 rs7482144 (XmnI) [T] and BGLT3 rs7924684 [T], respectively. All genotype distributions were in accordance with
the HWE (p
| Chr:position | SNP ID | Gene | Alleles | Genotypes | MAF | p-HWE | ||
| (hg38) | (1:2) | (11/12/22) | p-value (*) | p-value (**) | ||||
| 2:60493111 | rs11886868 | BCL11A | C:T | 2/25/20 | 0.309 | 0.168 | 0.045 (0.057) | 0.018 (0.066) |
| p = 0.433 | p = 0.789 | |||||||
| 2:60490908 | rs1427407 | T:G | 2/25/20 | 0.309 | 0.168 | 0.009 (0.057) | –0.015 (0.066) | |
| p = 0.879 | p = 0.815 | |||||||
| 6:135097495-135097499 | rs66650371 | HMIP | Del:TAC | 0/3/44 | 0.032 | 1 | 0.003 (0.133) | 0.003 (0.133) |
| p = 0.983 | p = 0.983 | |||||||
| 6:135105435 | rs4895441 | G:A | 0/6/41 | 0.064 | 1 | –0.023 (0.097) | –0.023 (0.097) | |
| p = 0.815 | p = 0.815 | |||||||
| 11:5254939 | rs7482144 | HBG2 | T:C | 0/9/38 | 0.096 | 1 | –0.113 (0.081) | –0.113 (0.081) |
| p = 0.167 | p = 0.167 | |||||||
| 11:5245498 | rs7924684 | BGLT3 | T:C | 0/13/34 | 0.138 | 0.574 | –0.079 (0.072) | –0.079 (0.072) |
| p = 0.278 | p = 0.278 |
Abbreviations: Del, allele with TAC deletion; Chr, Chromosome; MAF, Minor allele
frequency; Alleles, 1-minor, 2-major; Genotypes, 11-homozygous for the minor
allele, 12-heterozygous, 22-homozygous for the major allele; p-HWE,
p-value for Hardy-Weinberg Equilibrium;
Linear regression values were obtained under the additive (*) and dominant (**) models.
Using HbF as a continuous variable, the simple linear regression either in
additive, dominant, or recessive (data not shown) models, showed no statistically
significant associations between the six analyzed polymorphisms and HbF levels
(p
Characterizing genetic variants associated with HbF regulation is a paramount
topic because it has been established that the induction of higher levels of HbF
by genome-editing strategies or pharmacological inducer agents can improve the
clinical and hematological features of severe hemoglobinopathies such as SCD and
In the present study, we replicated in a population sample of HbAA women from
São Tomé e Príncipe the significant associations with HbF levels of
the two well-known BCL11A variants rs11886868 T
SNPs in the intronic BCL11A enhancer were implicated in HbF regulation
by many genome-wide and candidate association studies, addressing mainly SCD and
The HBG2-XmnI polymorphism (–158C
In the association tests for the BGLT3 SNP rs7924684 C
For the two remaining SNPs here analyzed, rs66650371 and rs4895441, located in
the HMIP intergenic region, no significant associations were observed
with HbF levels in the HbAA or HbAS groups. Several SNPs linked to increased HbF
levels have been identified in this genomic region on chromosome 6q23,
particularly within the contexts of
In conclusion, we successfully replicated in HbAA women from São Tomé e
Príncipe (Central Africa), the known associations with HbF variation of the
two BCL11A variants rs11886868 and rs1427407. No evidence of association
was found between levels of HbF and the two HMIP variants rs66650371 and
rs4895441, which can be explained by the lower MAF from these variants in the
study population. For the variants located at the HBB gene cluster, the
BGLT3 SNP rs7924684 C
The authors confirm that the findings of this study are available within the article and its supplementary materials. The data supporting the findings of this study are available from the first author upon reasonable request.
CB, GQ and CM collected samples, performed blood analyses, and interpreted the hematological data. LR performed laboratory blood analysis. AMM, SMA and IS performed molecular and statistical analysis. LM designed the research study, interpreted the molecular and statistical data, wrote, and edited the manuscript. All authors read and approved the final manuscript. All authors contributed to editorial changes in the manuscript. All authors have participated sufficiently in the work and agreed to be accountable for all aspects of the work.
The study was approved by the Ethics Committee of São Tomé e Príncipe, identified as CESIC Case PC022_2022. All participants signed an informed consent form before participating in the study. All data were anonymized with respect to confidentiality and processed according to the ethical principles outlined in the Declaration of Helsinki.
Not applicable.
This work was supported by the Fundação para a Ciência e a Tecnologia (FCT) under the institutional grant UIDB/00283/2020 and by Forum Hematologico (CHUC).
The authors declare no conflict of interest. Given his role as the Editorial Board member, Licínio Manco had no involvement in the peer-review of this article and has no access to information regarding its peer review. Full responsibility for the editorial process for this article was delegated to Gustavo Caetano-Anollés.
Supplementary material associated with this article can be found, in the online version, at https://doi.org/10.31083/FBS38388.
References
Publisher’s Note: IMR Press stays neutral with regard to jurisdictional claims in published maps and institutional affiliations.