


 , Aleksei Zamalutdinov 1, Elena Potokina 1,2,*
1 Project Center for Agro Technologies, Skolkovo Institute of Science and Technology, 121205 Moscow, Russia
2 Institute of Forest and Environmental Management, Saint Petersburg State Forest Technical University, 194021 St. Petersburg, Russia
Abstract
We publish the first available transcriptome assembly of guar (Cyamopsis tetragonoloba (L.) Taub.), a well-known source of guar gum (food additive E 412). At high latitudes, e.g., in Russia, the main challenge for guar cultivation is the long photoperiod during summer, which delays flowering and maturation of guar plants. Meanwhile, identifying of genes affecting the photoperiod sensitivity of guar would have a major impact on the development of marker-assisted breeding of this valuable food crop.
RNA isolated from leaves of early and late flowering guar plants grown under long-day conditions were used to generate de novo transcriptome assembly. A similarity search was conducted using BLASTN 2.2.31+ with default settings to identify homologous sequences of soybean maturity genes E1-E4 in guar transcriptome and genome assembly. Gene prediction tools such as AUGUSTUS and FGENESH+ were used to predict the exon-intron structure of the candidate genes. Functional annotation of the amino acid sequence was performed using InterProScan v. 5.68-100.
The transcriptome assembly contained sequences of 96,447 clustered transcript isoforms in the leaves of guar plants grown under long-day conditions. The transcriptome assembly was annotated using BLAST against the Glycine max genome, and 42,615 guar transcripts (44.2%) were found to be similar to soybean genes. We used the developed transcriptome assembly to discover orthologs of the E1-E4 soybean loci in the guar genome that have the greatest impact on the flowering and maturation of this closely related, short-day legume crop. A high level of identity was detected between peptide sequences encoding by orthologous genes E1 and CtE1 (80%), E2 and CtE2 (93%), E3 and CtE3 (83%), and E4 and CtE4 (91%). The sequences and the intron-exon structure of the genes in soybean and guar were similar, suggesting that the genetic pathways underlying basic flowering mechanisms are conserved between these two legume crops.
The revealed intron-exon structure of the guar genes CtE1-CtE4 creates possibilities for their targeted mutagenesis, e.g., using CRISPR-Cas and developing new guar germplasm with low sensitivity to photoperiod.
Keywords
- guar
- transcriptome assembly
- maturation loci
- orthologs
- exon-intron
Guar (Cyamopsis tetragonoloba (L.) Taub.) is an economically important short-day legume, whose seeds are the main source of guar gum, a compound used as a thickening agent in the food industry and as a fracturing fluid during oil and gas extraction [1]. At high latitudes, e.g., in Russia, the main obstacle to its cultivation is the long photoperiod during summer which delays flowering and maturation of guar plants [2]. Knowledge of the genes involved in guar flowering pathways will facilitate the implementation of genome editing technologies in guar breeding programs to improve yield and adaptability.
Currently, another valuable crop, soybean, serves as a model plant for understanding photoperiodism in short-day legumes [3]. Different allele combinations of genes involved in photoperiod responses have facilitated the adaptation of soybean varieties to the diverse geographic regions and farming systems [4]. In soybean the photoperiod-specific expression of the florigen genes is directed by interaction between light perception and endogenous circadian rhythms. The florigen genes, sequentially, encode mobile signals that move from leaf and shoot apex to induce flowering [5].
At least 11 flowering and maturity loci were identified in soybean (E1-E10, J) [6, 7] that are involved in the molecular mechanisms of flowering of this short-day legume under long days condition. However, the most significant influence on flowering time in soybean is exerted by four maturity genes, designated E1, E2, E3 and E4 [4].
Two florigen orthologs of Arabidopsis FLOWER LOCUS T (FT) identified in soybean, GmFT2a and GmFT5a, collectively regulate flowering time, with GmFT5a, but not GmFT2a, being essential for soybean adaptation to high latitude regions [8]. Induction of GmFT2a and GmFT5a expression, in turn, is under the control of the two photoreceptors encoded by phytochrome A (PHYA) genes E3 and E4; which inhibit expression of these florigens under long-day (LD) conditions. This PHYA-dependent regulation of flowering is mediated by the E1 gene, a repressor of GmFT2a and GmFT5a [6]. The legume-specific E1 gene is considered to be a major locus associated with flowering time and maturity in soybean, and its malfunctioning alleles promote plant flowering under long-day conditions [9].
Besides PhyA genes (E3 and E4), there is another pathway that regulates GmFT expression. Arabidopsis GIGANTEA (GI) ortholog, GmGIa, was identified as a candidate gene for E2 locus that suppresses flowering of soybean under long photoperiod. The recessive nonsense e2 allele of this gene promotes early flowering through the up-regulation of GmFT2a expression, although has no visible effect on the expression of GmFT5a [10].
Various combinations of mutations at E1-E4 loci underlie the diversity of flowering and maturity time in modern soybean varieties, allowing them to adapt to the high latitudes with a long photoperiod. In general, mutations of E1-E4 genes reduce the photoperiod sensitivity and shorten the growth period of soybean cultivars [4]. Thus, the E loci, and especially the E1 gene, are becoming a major target for CRISPR-Cas editing in studies aimed at creating of early flowering germplasm of soybean suitable for high latitudes [7, 11]. Information about flowering genes gained from the well-studied model crop soybean can be used to understand the photoperiodic pathway in guar.
Recently, we have reported the results of comparative transcriptome and metabolome analysis of early- and late-flowering guar genotypes grown under long-day conditions [2]. For that analysis we generated de novo genome-guided Trinity transcriptome assembly employing the draft of guar genome from our previous study [12]. As a result, 102,539 transcripts of the Trinity genome-guided assembly were combined in 96,447 clusters of all revealed isoforms. When the 78,015 longest ones were blasted against the Arabidopsis thaliana genome, only 15% of those 78,015 guar transcripts were successfully annotated.
In the present study we made an effort to annotate these 96,447 guar cluster transcripts using blast against Glycine max genome to identify orthologs of soybean genes in guar genome, e.g., loci responsible for flowering and maturity. We also used a bioinformatics approach employing transcriptome assembly, draft genome [12] and the reference genome of guar (Cte V1.0, GCA_037177725.1) to characterize the E1-E4 guar orthologs, predicting the exon-intron structure of these flowering-related genes as promising targets for CRISPR-Cas editing.
RNA-seq de novo assembly of guar transcripts used in this study was described previously [2]. In short, seeds of three early flowering and two delayed flowering guar lines were grown under natural long photoperiod conditions in a greenhouse (St. Petersburg, 59∘53′03′′90N). For transcriptome analysis, tissues of the third leaf (the vegetative development phase that precedes flowering in guar) were collected from three different plants of each line for RNA isolation. 25 million single end reads from each of 15 cDNA libraries of individual guar plants (9 early flowering and 6 delayed flowering) were used to generate de novo transcriptome assembly that contained 102,539 contigs corresponding to 79,863 unigenes. To improve the accuracy of the unigenes clusterization, all 102,539 transcripts were clustered using CD-HIT (https://sites.google.com/view/cd-hit) [13], resulting in 96,447 clusters of all revealed isoforms. Out of them, only 78,015 longest isoforms were kept for the further analysis of differential expression and only 15% of 78,015 guar transcripts were annotated via Arabidopsis thaliana BLAST. In this work, we performed annotations of 96,447 guar transcripts using Glycine maxgenome assembly.
Similarity search for the entire guar transcriptome was performed locally using BLASTN 2.2.31+ (http://www.ncbi.nlm.nih.gov/BLAST/) [14] and DIAMOND v2.1.9.163 (https://github.com/bbuchfink/diamond) [15] in BLASTX mode with default settings against Glycine max genome gene annotation and protein set (Wm82.a4.v1) respectively [16] downloaded from SoyBase (https://www.soybase.org/) [17]. For further analysis we used only the best hit from each result set.
78,015 guar transcripts abundances in 15 cDNA libraries were estimated earlier
[2] using RSEM V. 1.3.2 (https://deweylab.github.io/RSEM/) [18]. In the present
study we used the transcripts ‘expected count’ from the 12 RSEM output files and
fed them into edgeR v3.24.1 package
(https://bioconductor.org/packages/release/bioc/html/edgeR.html) [19] to call
differentially expressed (DE) genes. Only genes that were expressed (with
Transcripts Per Million [TPM]
In order to identify homologous sequences of soybean maturity genes E1-E4 in guar transcriptome and genome assembly, similarity search was conducted using BLASTN 2.2.31+ with default settings. After the blast, the genomic sequences of every target guar gene were retrieved from the guar reference genome assembly Cte V1.0 (GCA_037177725.1), while the transcripts were retrieved from the transcriptome genome guided assembly (PRJEB78478 project, TSA Sequence Set: HCEE01000000.1). Gene prediction tools such as AUGUSTUS and FGENESH+ were used to predict the exon-intron structure of the candidate genes.
AUGUSTUS v3.3.3 (https://bioinf.uni-greifswald.de/augustus/submission.php) [21] uses an ab initio and transcript-based algorithm, therefore, in the settings the genomic sequence and transcript from every gene were used as input. However, this software has not been trained to predict genes in species as Cyamopsis tetragonoloba or Glycine max, therefore, Arabidopsis thaliana was selected as the default organism.
FGENESH+2.6 (http://www.softberry.com/berry.phtml?topic=fgenes_plus&group=programs&subgroup=gfs) [22, 23] uses a protein-based gene prediction algorithm, here the genomic sequence of guar and the protein sequence of every soybean gene were used as input, additionally soybean was selected as default organism. Each software uses different gene prediction algorithms; therefore, all target genes were analyzed using both methods and consensus gene prediction was used in the following analysis.
The exon-intron structure was visualized using the Gene Structure Display Server (GSDS v. 2.0) (http://gsds.cbi.pku.edu.cn/) from the Center for Bioinformatics at Peking University [24]. The genomic sequence and CDS of each gene were used to generate the exon-intron pattern. Functional annotation of the amino acid sequence was performed using InterProScan v. 5.68-100 (https://www.ebi.ac.uk/interpro/) [25] and the percentage of identity between the amino acid sequences in soybean and guar was determined using BLAST tool in Phytozome [26], considering as target the proteome of Glycine max Wm82.a4.v1.
Molecular Evolutionary Genetics Analysis version 11 (MEGA 11) (https://www.megasoftware.net/) was used to perform amino acid sequence alignment and identify conserved regions between the target gene in guar and its homologous genes from soybean and other species that have been previously characterized and share a high percentage of sequence identity. The sequences used for amino acid alignment and phylogenetic analysis were extracted from National Center for Biotechnology Information (NCBI) (https://www.ncbi.nlm.nih.gov/) [27], Phytozome (https://phytozome-next.jgi.doe.gov/) [26] and Vigna genome browser (https://viggs.dna.affrc.go.jp) [28]. The multiple sequence alignment was performed using ClustalW and the phylogenetic tree was constructed using the neighbor-joining method in MEGA 11 (Bootstrap = 1000).
The accessible transcriptome assembly contig set containing sequences of 96,447 clustered transcript isoforms detected in leaves of guar plants grown under the long day conditions is now available from the European Nucleotide Archive database (Project: PRJEB78478, TSA Sequence Set: HCEE01000000.1) (Supplementary Table 1). Here we present an annotation of the guar transcriptome assembly using blast against the Glycine max genome (Supplementary Table 2). The blastn search identified similarity for 30,575 guar transcripts (31.7%) with 17,297 different soybean targets. Using DIAMOND blastx, we identified similarity for 42,308 transcripts (43.9%) with 21,520 different soybean targets. In total, 42,615 guar transcripts (44.2%) were found to be similar to soybean genes, 30,268 transcripts have search results from both (blastn and blastx) approaches. We analyzed the best hits for these transcripts and found that 68.2% of them were assigned to the same target gene in the soybean genome by both algorithms.
Out of 96,447 clusters of isoforms subjected to BLAST search against Glycine max genome assembly, 78,015 longest isoforms were re-analyzed for
differential expression (DE) to understand how the possible orthologs of soybean
genes are expressed in different guar genotypes under long day conditions. Six
early- and six delayed-flowering plants were considered as two contrast groups
(Early and Delay), and then the GLM (Generalized Linear Model) approach was
applied to make pairwise comparisons between the groups. 53,540 genes that were
not expressed in either experimental condition have been removed, 24,475 filtered
genes were kept for DE analysis (Supplementary Table 3). Out of them,
3679 differentially expressed genes were revealed with FDR
Notably, several guar transcripts considered as isoforms of the same gene were found to be homologous to different soybean genomic sequences but showed the strongest blastx hit to the same protein. For example, the highly down regulated in Early guar plants TRINITY_GG_660_c173_g1_i1 and TRINITY_GG_660_c173_g1_i2 isoforms were homologues to Glyma.02G001000 and Glyma.10G000200 correspondingly, but when DIAMOND blastx search was applied, they both showed the highest similarity to the same protein from DNA2/Nam7 helicase family encoded by Glyma.10G000200. This suggests that, as in the case of soybeans, guar may have undergone a cycle of whole genome duplication, resulting in some genes being represented by several homologs.
Similarity search of soybean flowering loci E1-E4, florigens GmFT2a (E9), GmFT4a (E10), GmFT5a, and locus J conferring the long-juvenile trait, was performed via blastn of the corresponding soybean gene sequences against guar transcriptome assembly (Supplementary Table 1).
For 6 of the 8 soybean flowering genes tested, highly homologous transcripts (80–90% identity) were found expressed in the examined guar plant tissues (Table 1). For the two florigen loci GmFT2a and GmFT4a no transcripts were detected in these cDNA libraries, perhaps, due to the very time-specific expression pattern of these genes. Likewise, a very low level of expression was recorded for E1 and E3, i.e., the highest TPM (transcripts per million) for these genes were estimated to be 2.61 and 3.36, respectively.
| Locus ID | Soybean gene ID | Guar transcript ID | Identities guar/soybean | Blast to Cte V1.0 | TPM Early/Delayed | LogFC/p value |
| E1 | Glyma.06G207800.1 CDS | TRINITY_GG_1915_c0_g1_i1 | 442/552 | LG6/CM074124.1 | 0.99/0.018 | - |
| Length = 705 | Length = 846 | (80%) | Cover 100%, E = 0 | |||
| E2 | Glyma.10G221500.1 CDS | TRINITY_GG_103_c16_g1_i2 | 3206/3531 | LG4/CM074122.1 | ||
| GmGIa | Length = 3534 | Length = 4212 | (91%) | Cover 99%, E = 0 | ||
| TRINITY_GG_103_c16_g1_i1 | 2652/2920 | LG4/CM074122.1 | 107/93 | Ns | ||
| Length = 4481 | (91%) | Cover 99%, E = 0 | ||||
| TRINITY_GG_1024_c50_g1_i1 | 1637/1873 | LG6/CM074124.1 | 34/25 | Ns | ||
| Length = 2151 | (87%) | Cover 100%, E = 0 | ||||
| TRINITY_GG_1024_c47_g1_i1 | 1337/1629 | LG6/CM074124.1 | 148/68 | 0.6357/0.017 | ||
| Length = 1813 | (82%) | Cover 100%, E = 0 | ||||
| E3 | Glyma.19G224200.1 CDS | TRINITY_GG_2514_c5_g1_i1 | 2805/3347 (84%) | LG7/CM074125.1 | 3/2 | - |
| GmPHYA3 | Length = 3393 | Length = 4238 | Cover 100%, E = 0 | |||
| E4 | Glyma.20G090000.1 CDS | TRINITY_GG_2627_c599_g1_i1 | 2843/3386 (84%) | LG3/CM074121.1 | 33/22 | Ns |
| GmPHYA2 | Length = 3372 | Length = 3903 | Cover 99%, E = 0 | |||
| E9 | Glyma.16G150700.1 CDS | No hits | ||||
| GmFT2a | Length = 531 | |||||
| GmFT5a | Glyma.16G044100.1 CDS | TRINITY_GG_209_c451_g1_i2 | 410/473 (87%) | LG7/CM074125.1 | 3/0 | - |
| Length = 519 | Length = 660 | Cover 100%, E = 0 | ||||
| E10 | Glyma.08G363100.1 CDS | No hits | ||||
| GmFT4 | Length = 528 | |||||
| J locus | Glyma.04G050200.12 CDS | TRINITY_GG_388_c70_g1_i2 | 1810/2147 (84%) | LG1/CM074119.1 | ||
| Length = 2145 | Length = 2949 | Cover 99%, E = 0 | ||||
| TRINITY_GG_388_c70_g1_i1 | 876/1059 (83%) | LG1/CM074119.1 | ||||
| Length = 4024 | Cover 99%, E = 0 | |||||
| TRINITY_GG_388_c70_g1_i3 | 876/1059 (83%) | LG1/CM074119.1 | 10/7 | Ns | ||
| Length = 4725 | Cover 99%, E = 0 |
Ns, not significant.
Diurnal expression patterns were reported for the GmFT genes [29] as well as for E1 gene [9]. In the latter case, the level of E1 expression reaches a minimum at midday between two peaks of expression at 3 am and 6 pm. It should be considered that the RNAs for the guar transcriptome assembly were extracted from the terminal leaflet of the third leaves (39 DAE, days after emergence), collected at 9-12 am from plants grown under LD conditions. Besides, relative transcript level of GmFT2a in soybean cv. Jack under LD conditions reached a maximum at 30 DAE, but already at 35 DAE the transcript level decreased to almost zero [30].
The detected guar transcript sequences homologous to soybean genes were successfully aligned to the first available chromosome-level guar reference genome assembly Cte V1.0 (GCA_037177725.1) with 99–100% coverage and E value of 0.
For guar orthologs of four loci E1, E2, E3 and E4 that play important roles in regulating flowering and maturity in soybean, a bioinformatics approach was applied to predict their exon-intron structure (Supplementary Table 4).
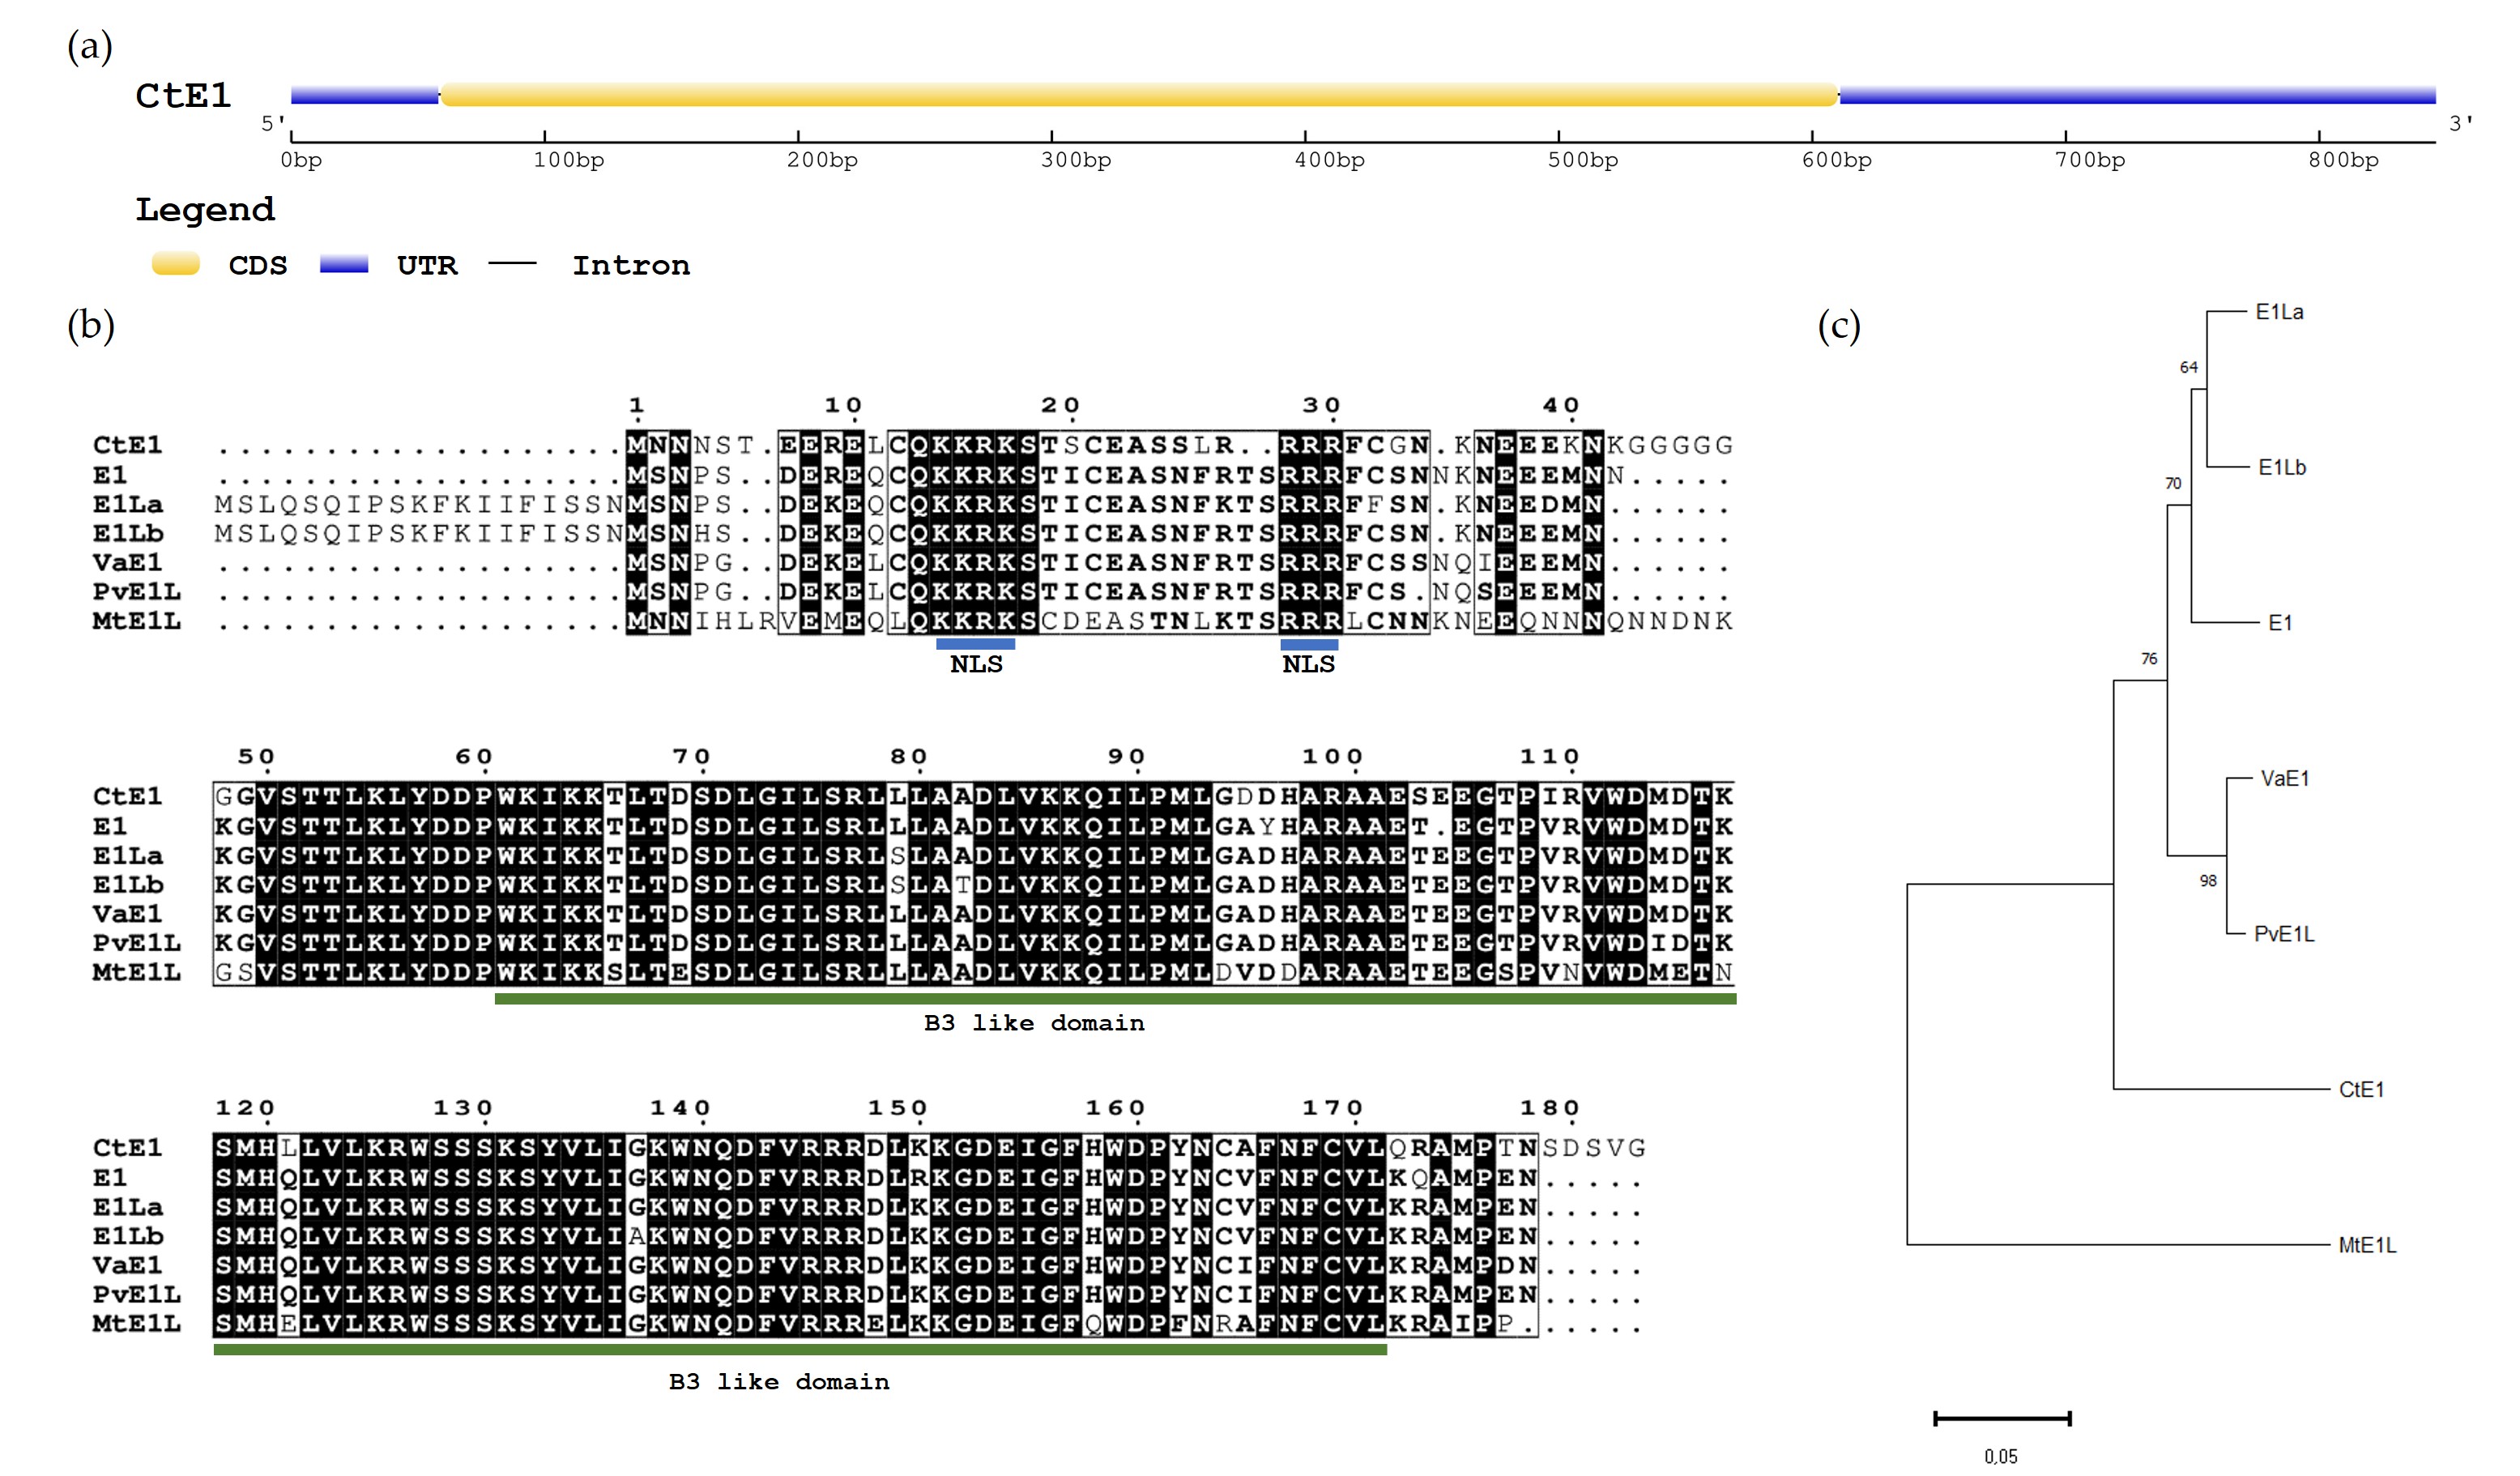
The E1 guar homologue gene, denominated as CtE1, was aligned with the chromosome 6 of the genome assembly Cte V1.0 (GCA_037177725.1). The predicted CDS has 552 bp with no introns (Fig. 1a) and produces a peptide sequence of 183 amino acids. The amino acid (aa) alignment between CtE1 and the E1 family genes, including E1 (Glyma.06G207800.1), E1La (Glyma.04G156400.1), E1Lb (Glyma.04G143300.1) from Glycine max, VaE1 (Vigan.02G276800.01) from Vigna angularis, PvE1L (Phvul.009G204600.1) from Phaseolus vulgaris and MtE1L (Medtr2g058520) from Medicago truncatula (Fig. 1b) showed that most residues were highly conserved, sharing an 80% percentage of identity between CtE1 and E1 according to BLASTP in Phytozome. CtE1, like the other members from E1 family genes [31, 32] contained a putative bipartite nuclear localization signal (NLS) and a DNA-binding B3-like domain. In CtE1 the NLS is located near the N-terminus at 14–30 aa residues and the two basic domains KKRK and RRR are separated by 12 aa residues. The B3-like domain (IPR003340) comprised 111 aa residues and is located at 61–171 aa residues. Phylogenetic analysis of E1 family proteins showed that the seven proteins analyzed can be divided into two main groups, namely Group I and Group II. The group I consists of E1, E1La, E1Lb, VaE1, PvE1L and CtE1 whereas group II consists of MtE1L (Fig. 1c). The two main groups correspond to genes from Indigoferoid/Millettioid and Hologalegina clade.
 Fig. 1.
Characterization of E1 homologous gene in Cyamopsis tetragonoloba (CtE1). (a) Gene structure of CtE1 gene. (b) Amino acid sequence alignment of seven E1 family genes from legumes. The amino acid sequences of E1 family proteins were aligned using ClustalW. Putative bipartite nuclear localization signals (NLS) are underlined in blue and the B3-like domain is underlined in green. (c) Phylogenetic tree of E1 family genes. The phylogenetic tree was constructed using the Neighbor-joining method in MEGA 11 (Bootstrap = 1000).
Four guar transcript variants shared a high percentage of homology with the E2 gene (Glyma.10G221500.1) (Table 1). The longest transcript TRINITY_GG_103_c16_g1 presented two main isoforms i1 and i2, with a length of 4481 and 4212 bp, while the remaining transcripts TRINITY_GG_1024_c50_g1_i1 and TRINITY_GG_1024_c47_g1_i1 had a length of 2151 bp and 1813 bp, respectively. The actual length of the E2 gene CDS from Glycine max is 3534 bp, therefore the longest transcript was used to generate the gene prediction. The predicted gene CtE2 has a length of 3516 bp with 14 exons and produces a peptide sequence of 1171 amino acids.
This transcript sequence was blasted to the chromosome 4 of the guar genome assembly Cte V1.0 (GCA_037177725.1). The CDS coincided with the isoform 2 from the transcript sequence TRINITY_GG_103_c16_g1, denominated CtE2 i2. The isoform 1 (CtE2 i1) is suspected to be an intron retaining isoform (IRI), which contains a “non-excised” intron between exon 11 and 12. This retention causes the presence of a premature stop codon that may lead to the translation of a truncated protein of 975 aa residues. Fig. 2a shows the exon-intron structure of both isoforms CtE1 i1 and CtE2 i2.
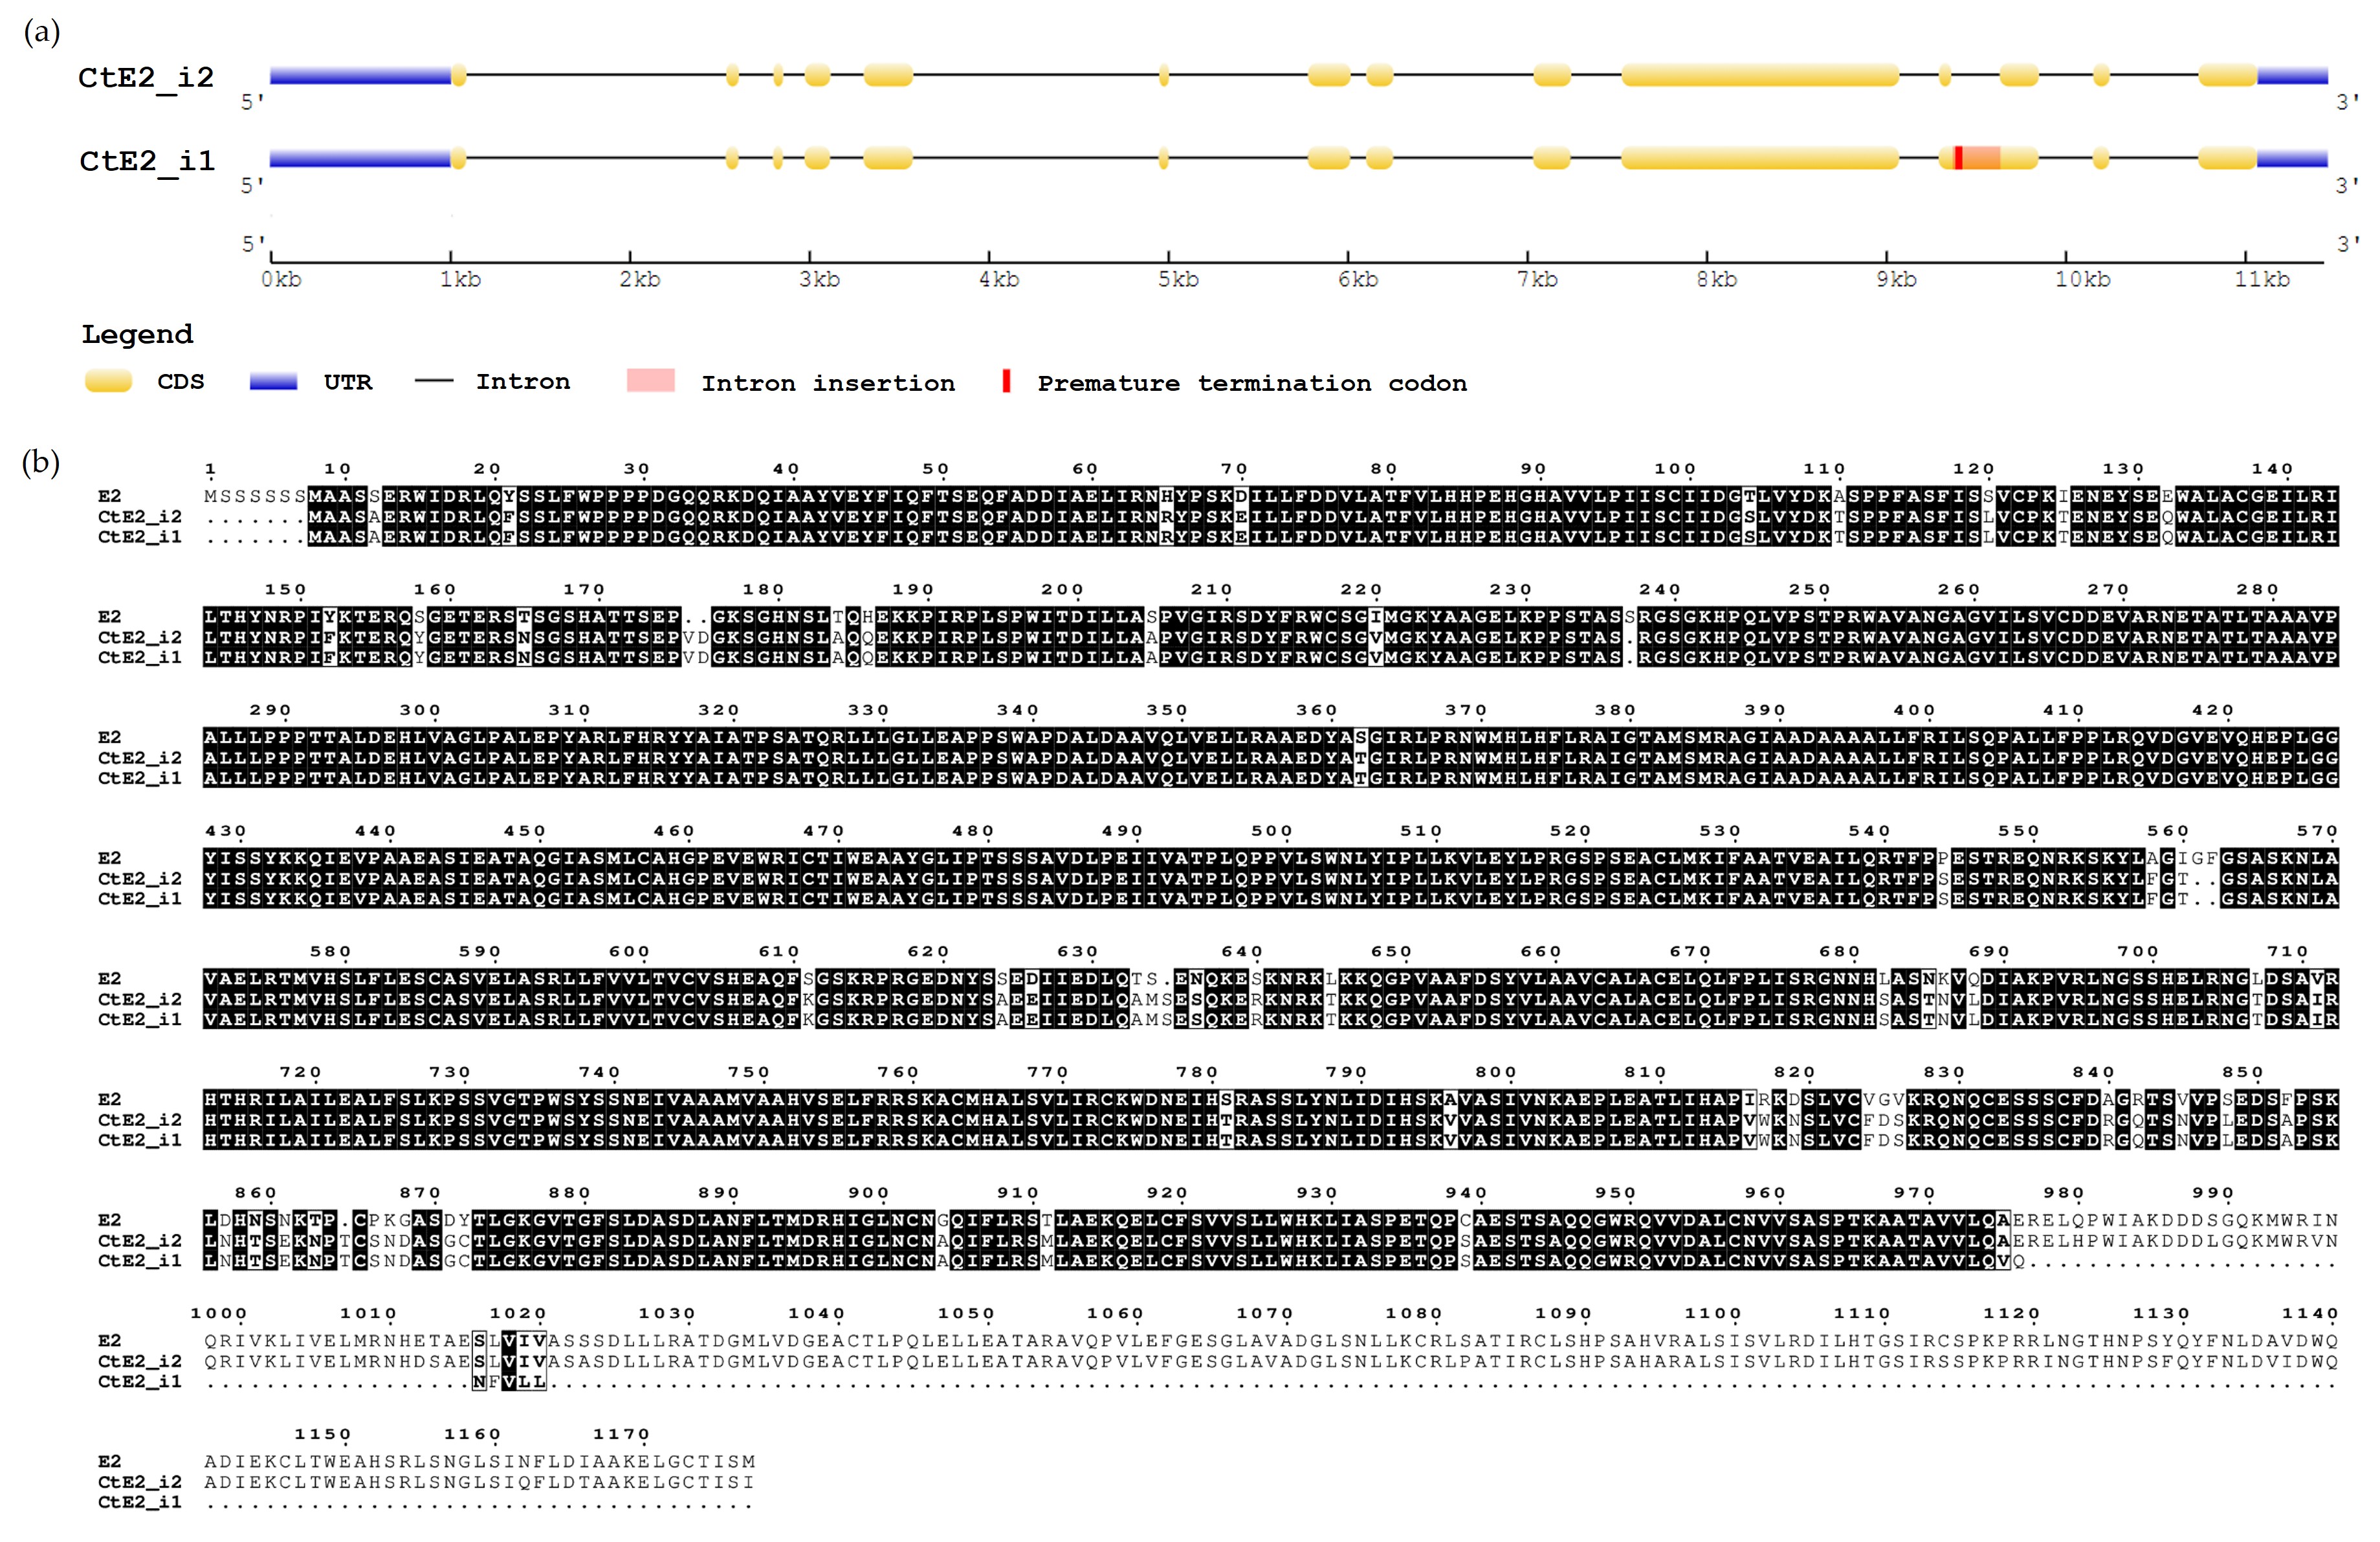 Fig. 2.
Characterization of E2 homologous gene in Cyamopsis tetragonoloba (CtE2). (a) Gene structure of CtE2 gene isoforms, CtE2 i1 and CtE2 i2. (b) Amino acid sequence alignment between E2 gene from Glycine max and CtE2 gene isoform 1 and 2.
The amino acid alignment between CtE2 and the E2 gene (Fig. 2b) showed a high level of amino acid conservation, sharing 93% percentage of identity between CtE2 i2 and E2 gene. The functional annotation of CtE2 with InterProScan fully matched with the GIGANTEA protein (IPR026211). In the case of the transcript sequences TRINITY_GG_1024_c50_g1_i1 (2151 bp) and TRINITY_GG_1024_c47_g1_i1 (1813 bp), they could be duplicated genes, as in both cases InterProScan showed a full match with the GIGANTEA protein.
The genes E3 (CtE3) and E4 (CtE4) in guar, identified by their transcript IDs TRINITY_GG_2514_c5_g1_i1 and TRINITY_GG_2627_c599_g1_i1, respectively, were determined to be located on chromosomes 7 and 3 using blast analysis.
The genomic sequence of CtE3 spanned a region of 7480 bp with a CDS of 3393 bp, is divided in four exons (Fig. 3a). The CDS of CtE3 codes for a peptide sequence of 1130 aa residues and shares an 83% percentage of identity with the E3 protein (Glyma.19G224200.1). According to InterProScan, CtE3, like its E3 homologue, is a member of the Phytochrome protein family (IPR001294) and poses six domains: PAS_2 (IPR013654) located from the aa residues 70 to 186, GAF_1 (IPR003018, 219–414 aa) between the aa residues 219–414, PHY (IPR013515, 417–591 aa), PAS domain S-box protein or sensory box (IPR000014, 629–747 aa), PAS (IPR013767, 755–878 aa) and Histidine-kinase or HIS_KIN domain (IPR005467, 907–1126 aa) (Fig. 3b).
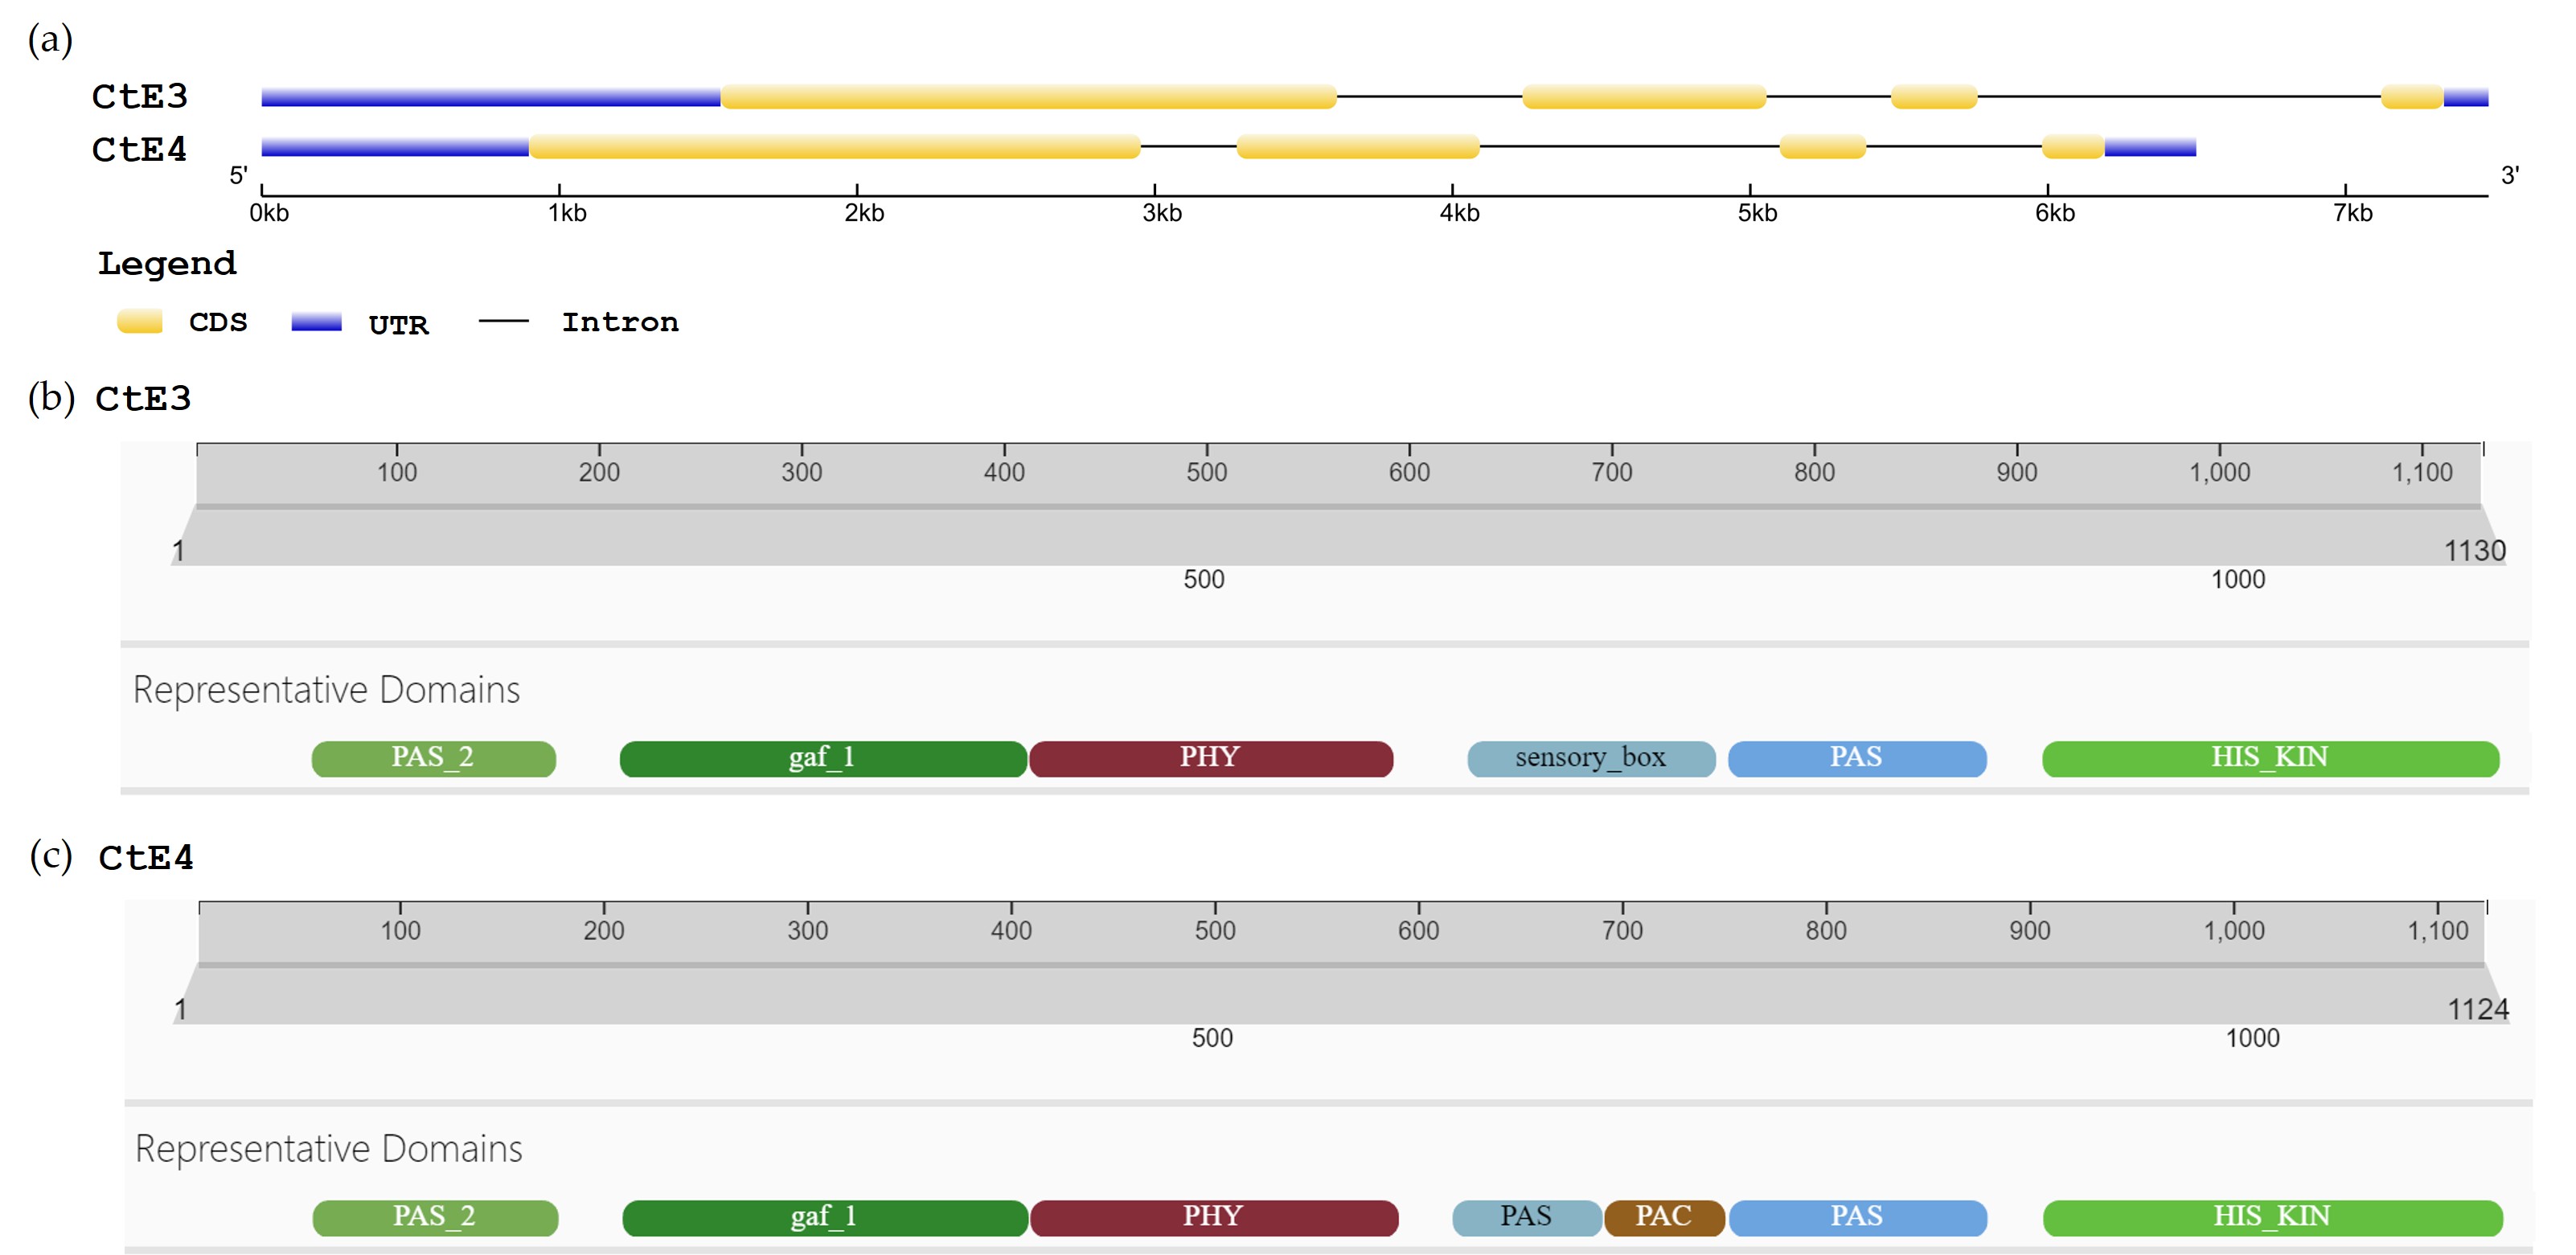 Fig. 3.
Gene structure of E3 and E4 homologous genes in Cyamopsis tetragonoloba. (a) Intron-Exon structure of CtE3 and CtE4. (b) Representative domains of CtE3: PAS_2 (IPR013654, 70–186 aa), GAF_1 (IPR003018, 219–414 aa), PHY (IPR013515, 417–591 aa), PAS domain S-box protein or sensory box (IPR000014, 629–747 aa), PAS (IPR013767, 755–878 aa) and Histidine-kinase or HIS_KIN domain (IPR005467, 907–1126 aa). (c) Representative domains of CtE4: PAS_2 (IPR013654, 69–185 aa), GAF 1 (IPR003018, 218–411 aa), PHY (IPR013515, 414–589), PAS domain (IPR000014, 617–687 aa), PAC (IPR000700, 690–746 aa), PAS (IPR013767, 750–872 aa) and HIS_KIN domain (IPR005467, 901–1120 aa).
The CDS of CtE4 has 3375 bp and, like its CtE3 homologue, it also contains four exons. The peptide sequence contains 1124 amino acids and shares 91% percentage of identity with E4 (Glyma.20G090000.1). CtE4 is also member of the Phytochrome protein family (IPR001294) and poses seven domains: PAS_2 (IPR013654, 69–185 aa), GAF_1 (IPR003018, 218–411 aa), PHY (IPR013515, 414–589 aa), PAS domain (IPR000014, 617–687 aa), PAC (IPR000700, 690–746 aa), PAS (IPR013767, 750–872 aa) and HIS_KIN domain (IPR005467, 901–1120 aa) (Fig. 3c).
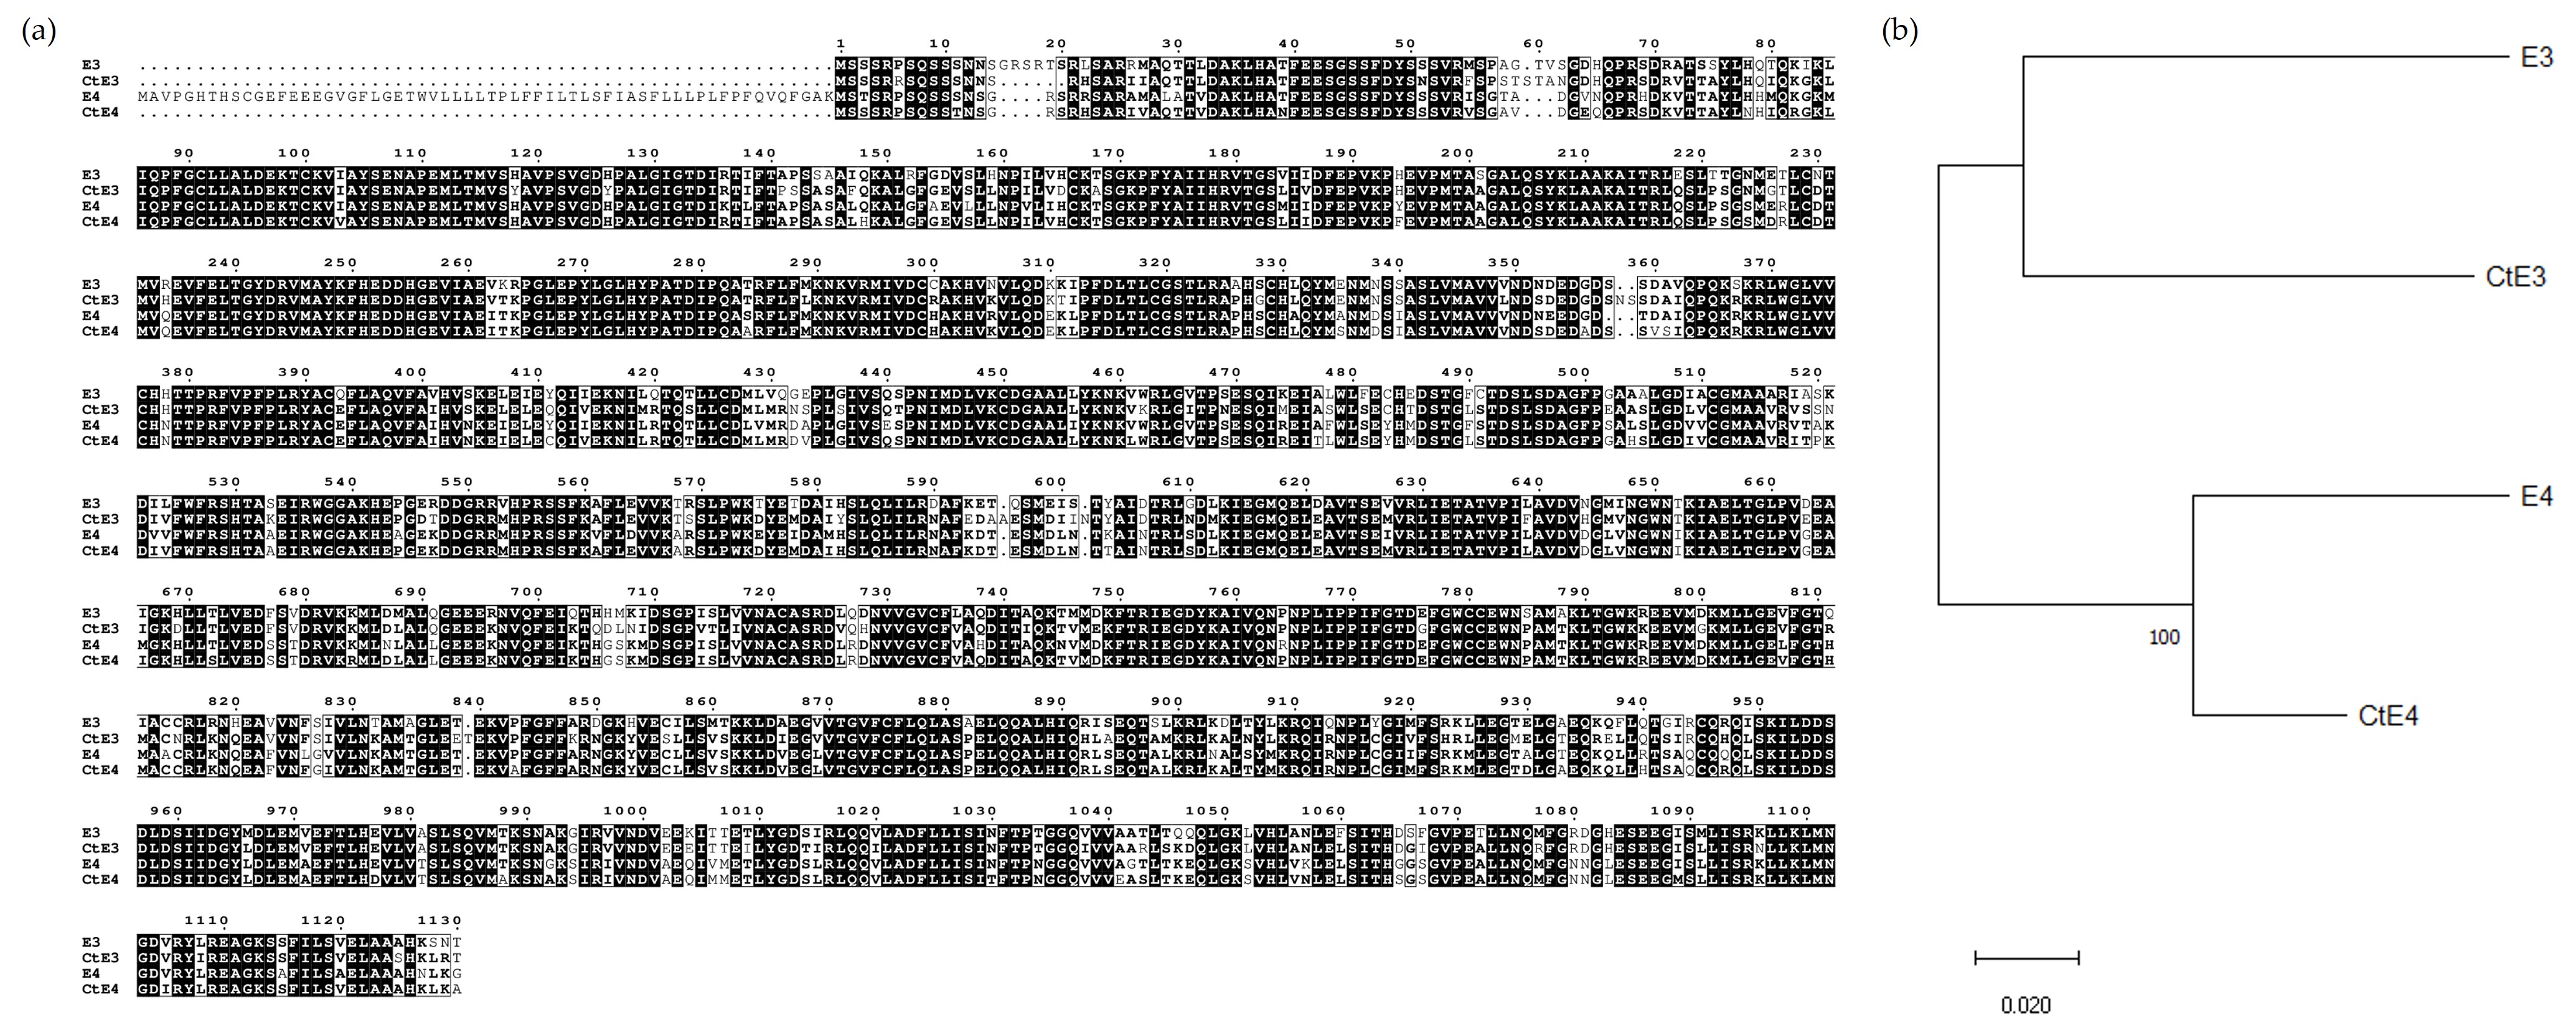
The CtE3 and CtE4 genes shared a high level of amino acid conservation between each other and with soybean homologs E3 and E4 (Fig. 4a), therefore a phylogenetic tree was used to cluster the sequences with their respective homologs from soybean (Fig. 4b).
 Fig. 4.
Amino acid sequence alignment and Phylogenetic tree of CtE3 and CtE4. (a) Amino acid alignment between E3, E4, CtE3 and CtE4. (b) Phylogenetic tree of PhyA family genes. The phylogenetic tree was constructed using the Neighbor-joining method in MEGA 11 (Bootstrap = 1000).
In the present study, we provide the first accessible version of guar transcriptome assembly containing sequences of 96,447 clustered transcript isoforms detected in leaves of guar plants grown under the long day conditions. To date, several RNAseq studies have been reported for guar [33, 34, 35, 36, 37], however, no accessed Transcriptome Shotgun Assembly (TSA) was available for Cyamopsis tetragonoloba in the European Nucleotide Archive (https://www.ebi.ac.uk/ena) (27 July 2024). The developed sequenced resource will complement the recently published C. tetragonoloba reference genome assembly (CteV1.0) [38] and contribute to guar breeding programs via an application of biotechnological methods, e.g., CRISPR-Cas genome editing. As was shown with the example of several genes (Table 1), the detected transcripts perfectly match the sequence of the reference CteV1.0 guar genome. Thus, for most of the expressed genes, their physical position on the guar chromosomes can now be easily determined.
44.2% of transcripts from the TSA showed similarity to Glycine max genes, while only 15% of transcripts were successfully annotated earlier via blast against the Arabidopsis thaliana genome [2]. Although the majority of Arabidopsis flowering genes are represented in legume sequence databases, several gene families including MADS-box, CONSTANS, and FLOWERING LOCUS T families have been reported to have undergone significant changes in their composition [39]. As an example, compared with their roles in Arabidopsis, photoreceptors GmPHYA3 (E3) and GmPHYA2 (E4) have conserved and novel functions in soybean [40]. In contrast, many flowering gene orthologs in different legume genera and even tribes demonstrate a high level of synteny and are located in the conserved map positions, e.g., Pisum (Tribe: Vicieae) and Medicago (Tribe: Trifolieae) [39]. Considering that both Glycine max and Cyamopsis tetragonoloba belong to the same Indigoferoid/Millettioid clade of legumes, the high similarity of their genomes was expected and estimated as the highest (41.91%), followed by Phaseolus vulgaris, Cicer arietinum and Medicago truncatula [33].
We used the developed transcriptome assembly to discover in the guar genome orthologs of four soybean E loci that have the greatest impact on flowering and maturation of varieties of the short-day legume crop. A high level of identity was detected between peptide sequences encoding by orthologous genes E1 and CtE1 (80%), E2 and CtE2 (93%), E3 and CtE3 (83%), E4 and CtE4 (91%). Not only the sequences but also the intron-exon structure of the genes in soybean and guar were found to be similar, suggesting that the genetic pathways underlying basic flowering mechanisms are conserved between these two legume crops.
E1 has the largest effect on flowering in soybean, encoding a transcription factor that acts as a floral repressor. It was reported that E1 homologues in other legumes differ in their functions in flowering, e.g., in Phaseolus vulgaris (Indigoferoid/Millettioid clade) it inhibits flowering (similar to E1), but in Medicago truncatula (Hologalegina clade) it does not affect flowering [6, 31]. Zhang et al. [31] also reported that the ectopic expression of PvE1L, an E1 homolog from common bean (Phaseolus vulgaris), delayed the onset of flowering in soybean. By contrast, the ectopic expression of MtE1L, an E1 homolog from Medicago truncatula, did not affect the flowering of soybean. Thus, functional diversification of legume E1 family genes in the regulation of flowering may be associated with lineage specification and genomic duplication [31].
No different expression of E1 gene was reported for guar plants grown under short- and long day conditions, although two more B3 transcription factors were reported to be up-regulated in guar under LD, suggesting that they repressed flowering [41]. Since two rounds of whole genome duplication events are hypothesized for soybean, paralogues are described for E loci in soybean genome. Two paralogs of E1 gene, namely E1La (Glyma.04G156400.1) and E1Lb (Glyma.04G143300.1) were found in soybean to control the onset of flowering [9]. No similar sequences for both of the genes were detected in our guar transcriptome assembly. However, their absence could also be due to untimely sampling of plant tissue, coinciding with a very low level of expression of this circadian clock gene.
E2 has been identified as an orthologue of the Arabidopsis
GIGANTEA (GI) gene [10]. For the E2 locus, three GIhomologs (GmGI1, GmGI2, and GmGI3) were discovered in
the soybean genome, located on chromosomes 20, 9 and 10 respectively. Among them
GmGI3, described earlier as E2 locus (Glyma10g36600.1) [10], is
considered to be a more ancestral gene than GmGI1 (Glyma20g30980.1) and
GmGI2 (Glyma09g07240.1) [42]. In that study alternative splicing was
also reported for the 11th exon of GmGI1, resulting in two different
versions—the longer GmGI1a and the shorter GmGI1
E3 (GmPHYA3) and E4 (GmPHYA2) repress soybean flowering by responding to high and low red:far-red ratios in the light spectrum under LDs [44, 45]. The PHYA genes provide light perception and, therefore, stand in the initial point of the molecular network regulating flowering in soybean under LD conditions. Consequently, dysfunctional recessive alleles for the E3 and E4 loci are the most common mechanism underlying reduced photoperiod sensitivity in soybean [6]. Thus, the predicted intron-exon structure of their homologues in the guar genome offers clues for their targeted mutagenesis, e.g., using CRISPR-Cas method.
Although guar is an emerging economically important legume with a wide range of industrial applications [46], the productivity of this high-valued industrial crop is poor due to unsatisfactory availability of early maturing and high-yielding varieties [47]. The possibilities of marker-assisted selection of guar are still limited. Priti et al. [48] first developed a linkage map using microsatellite markers to genotype F3–F4 segregating populations from an interspecific cross between C. tetragonoloba cv HG563 and C. serrata. In this interspecific cross, C. serrata was highly resistant to bacterial leaf blight (BLB), and HG563 was a cultivar with high gum content. The linkage map was employed in order to identify quantitative trait loci (QTLs) for BLB resistance and gum content. Additionally, a genome-wide association study (GWAS) was conducted for guar, resulting in the discovery of six single nucleotide polymorphisms (SNPs) linked to the variation of an important agronomic trait—the percentage of pods matured to the harvest date under long light day conditions [49]. With very limited reports about linkage mapping and identification of quantitative trait loci associated with agrobiological traits in guar, the reverse genetics approach may facilitate marker-assisted breeding of guar.
Recent advances in generating mutants of E1-E4 genes using CRISPR-Cas technology have shown great potential to improve the performance of soybean varieties under different growing conditions [7, 40, 50]. Homozygous E1 mutants developed with CRISPR-Cas have shown significantly reduced onset of flowering time (by 20 days) under LD conditions [7]. CRISPR-Cas-induced e2 single mutant showed an early flowering phenotype, along with a distinctly increased yield performance relative to wild type in long photoperiod [50]. A core set of phytochrome mutants (including GmPHYA2/E4 and GmPHYA3/E3), with early-flowering phenotypes were obtained with CRISPR-Cas to characterize their functional mechanisms in regulating flowering of soybean under LD conditions [40]. Considering the established high level of homology between the E1-E4 genes of soybean and guar, one can expect to obtain similar CRISPR-Cas-engineered guar mutants with a shortened flowering onset, which will allow it to be cultivated in high latitudes.
In summary, our study provides the first accessible version of guar transcriptome assembly containing sequences of 96,447 clustered transcript isoforms detected in leaves of guar plants grown under the long day conditions. The developed transcriptome assembly was annotated against the Glycine max genome and used as a tool to identify and characterize in the guar genome orthologs of the E1-E4 soybean maturity genes. A high level of identity was detected between peptide sequences encoding by orthologous genes E1 and CtE1 (80%), E2 and CtE2 (93%), E3 and CtE3 (83%), E4 and CtE4 (91%). Moreover, not only the sequences but also the intron-exon structure of the genes in soybean and guar were found to be similar, suggesting that the genetic pathways underlying basic flowering mechanisms are conserved between these two legume crops. Consequently, the predicted intron-exon structure of the CtE1-CtE4 guar genes may offer clues for their targeted mutagenesis, e.g., using CRISPR-Cas method.
The datasets used and/or analyzed during the current study are available from the corresponding author on reasonable request. Guar transcriptome assembly contig set is available from the European Nucleotide Archive database (Project: PRJEB78478, TSA Sequence Set: HCEE01000000.1).
Conceptualization, EP and LCD; methodology, LCD and AZ; software, LCD and AZ; validation, LCD and AZ; formal analysis, EP; investigation, LCD and AZ; data curation, AZ; writing—original draft preparation, LCD, AZ and EP. All authors have read and agreed to the published version of the manuscript. All authors have participated sufficiently in the work and agreed to be accountable for all aspects of the work.
Not applicable.
We are grateful to Elizaveta Grigoreva for her efforts in assembling the guar transcriptome and providing the RSEM output files for differential expression analysis.
The research was funded by the Russian Science Foundation (project no. 24-26-00073).
The authors declare no conflicts of interest.
Supplementary Table 1: Guar transcriptome assembly contig set containing sequences of 96,447 clustered transcript isoforms detected in leaves of guar plants grown under the long day conditions; Supplementary Table 2: Annotation of the guar transcriptome assembly using blastn and blastx against the Glycine max genome. Supplementary Table 3: Evaluation of gene expression differences between early and late flowering guar plants. Supplementary Table 4: Exon-intron structure predictions of guar CtE1-CtE4 genes homologues to soybean E1-E4 maturity loci.
Supplementary material associated with this article can be found, in the online version, at https://doi.org/10.31083/FBS26548.
References
Publisher’s Note: IMR Press stays neutral with regard to jurisdictional claims in published maps and institutional affiliations.