


 , Alexander Schwarz 2,†, Rimma Kamentseva 1, Marianna Kharchenko 1, Elena Kornilova 1,3
1 Laboratory of Intracellular Membranes Dynamics, Institute of Cytology of the Russian Academy of Sciences, 194064 Saint Petersburg, Russia
2 Laboratory of Molecular Mechanisms of Neural Interactions, Sechenov Institute of Evolutionary Physiology and Biochemistry of the Russian Academy of Sciences, 194223 Saint Petersburg, Russia
3 Faculty of Biology, Saint Petersburg State University, 199034 Saint Petersburg, Russia
†These authors contributed equally.
Abstract
Real-time reverse transcription quantitative polymerase chain reaction (RT-qPCR) is a powerful tool for analysing target gene expression in biological samples. To achieve reliable results by RT-qPCR, the most stable reference genes must be selected for proper data normalisation, particularly when comparing cells of different types. We aimed to choose the least variable candidate reference genes among eight housekeeping genes tested within a set of human cancer cell lines (HeLa, MCF-7, SK-UT-1B, A549, A431, SK-BR-3), as well as four lines of normal, non-malignant mesenchymal stromal cells (MSCs) of different origins.
The reference gene stability was evaluated using four algorithms (BestKeeper, NormFinder, geNorm and the comparative ΔCt method) and ranked with the RefFinder web-based tool.
We found increased variability in the housekeeping genes’ expression in the cancer cell lines compared to that in normal MSCs. POP4 and GAPDH were identified as the most suitable reference genes in cancer cells, while 18S and B2M were the most suitable in MSCs. POP4 and EIF2B1 were shown to be the least variable genes when analysing normal and cancer cell lines together. Epidermal growth factor receptor (EGFR) mRNA relative expression was normalised by the three most stable or three least stable reference genes to demonstrate the reliability of reference genes validation.
We analysed and selected stable reference genes for RT-qPCR analysis in the wide panel of cancer cell lines and MSCs. The study provides a reliable tool for future research concerning the expression of genes involved in various intracellular signalling pathways and emphasises the need for careful selection of suitable references before analysing target gene expression.
Keywords
- reference gene stability
- RT-qPCR
- human cancer cell lines
- human mesenchymal stromal cell lines
Real-time reverse transcription quantitative polymerase chain reaction (RT-qPCR) is a widely used method to measure relative gene expression for biological and medical research, as well as for clinical purposes, such as diagnostics, disease detection and monitoring [1]. To achieve a high level of data reliability and avoid inconsistency in data presentation and interpretation, the Minimum Information for Publication of Quantitative Real-Time PCR Experiments (MIQE) guidelines were developed and published [2]. In RT-qPCR assay the target gene expression should be normalized to the reference gene expression, and the reference gene expression must remain stable across all conditions tested. As housekeeping gene encoded products are involved in maintaining essential cellular functions, these genes are expressed in the majority of cells and tissues and are usually used as reference genes [3]. However, even housekeeping gene expression may dramatically differ depending on tissue type, experimental conditions and treatments. Thus, candidate reference gene stability must be examined for each experimental model to select the most stable genes as suitable references [4]. This selection is particularly important if the study aims to compare the expression levels of target genes in different cell types.
Several mathematical algorithms have been developed to evaluate reference gene
stability, and the most frequently used are BestKeeper [5], NormFinder [6],
geNorm [7] and the comparative Delta Ct (
When investigating various aspects of signalling and the vesicular transport of transmembrane receptors, researchers have typically used both stable immortalised cancer cell lines and primary cultures, such as mesenchymal stromal cells (MSCs), the latter being model cells with intact regulation of the studied processes [10, 11, 12]. In this study, on the basis of the aforementioned algorithms, we aimed to choose the most stable references among eight commonly used housekeeping genes (GAPDH, POP4, 18S, YWHAZ, HPRT, RPL13A, B2M, and EIF2B1) for a set of human normal, non-malignant cells and pathological cancer cell lines. We sequentially evaluated reference gene stability in the following:
(1) Normal and cancer cell lines.
(2) Cancer cell lines only.
(3) Normal mesenchymal cell lines only.
We found significant differences in housekeeping gene expression between these three groups, as well as less pronounced variability in gene expression within normal mesenchymal cell lines. Reference gene stability analysis identified POP4 and EIF2B1 as the most stable genes within the tested cell panel, while the POP4/GAPDH and 18S/B2M gene pairs appeared to be most suitable as references for cancer cell lines only and normal mesenchymal cell lines only, respectively. We also validated our choice of reference genes for the set of human cell lines by analysing the relative expression of epidermal growth factor receptor (EGFR)—the main component of the EGFR-signalling network, which is commonly dysregulated in cancers and governs cancer progression. Our results are useful for guiding the selection of suitable candidate reference genes for RT-qPCR in further comparative studies of cancer and normal cells.
In this study, we used six human cancer cell lines and four human cell lines derived from mesenchymal stromal tissues. All cell lines (except for the human breast adenocarcinoma cell line SK-BR-3) were obtained from the “Vertebrate cell culture collection (Saint-Petersburg, Russia)”, supported by a grant from the Ministry of Science and Higher Education of the Russian Federation (Agreement #075-15-2021-683, Institute of Cytology of the Russian Academy of Sciences (INC RAS)). The SK-BR-3 cells were the generous gift of Dr A. Daks (St. Petersburg, Russia).
We used two lines of endometrial mesenchymal stromal cells (enMSCs, line 2804 and AMO) that were previously obtained and characterized [13, 14]. The human umbilical cord MSCs (MSCWJ-1) and human dental pulp MSCs (MSC-DP) were obtained from the “Vertebrate cell culture collection”. All non-malignant cell lines used were characterized by the positive surface expression of established MSCs markers CD44, CD73, CD90, CD105, HLA-ABC and lack of CD34, CD45, HLA-DR antigens. MSCs were also validated by Short Tandem Repeat (STR) profiling. MSCs multipotency was verified by their ability to differentiate into several mesodermal lineages (adipocytes, osteocytes, chondrocytes). All cell lines tested negative for mycoplasma. The MSCs were maintained in DMEM/F12 medium with phenol red (Cat No. 31330-038, Gibco, Paisley, UK), supplemented with 10% fetal bovine serum (Cat No. S181S, Biowest, Nuaillé, France), GlutaMAX™ (Cat No. 35050061, Gibko, Paisley, UK) and antibiotic/antimycotic solution (Cat No. AAS-B, Capricorn, Düsseldorf, Germany); and were used up to the seventeenth passage.
In our analysis, we used the following cancer cell lines: the human cervix carcinoma HeLa cell line, human breast adenocarcinoma MCF-7 cell line, human uterine leiomyosarcoma SK-UT-1B cell line, human lung carcinoma A549 cell line, human epidermoid carcinoma A431 cell line and human breast adenocarcinoma SK-BR-3 cell line. All cancer cell lines were validated by STR profiling and tested negative for mycoplasma. The MCF-7 and SK-BR-3 cells were cultured in the same complete medium as the MSCs (described above). The HeLa, SK-UT-1B, A549, and A431 cells were cultured in DMEM medium containing a glucose concentration of 4.5 g/L and phenol red (Cat No. 11965092, Gibco, Billings, MT, USA) and supplemented with 10% fetal bovine serum (Cat No. S181S, Biowest, Nuaillé, France), GlutaMAX™ (Cat No. 35050061, Gibko, Paisley, UK) and antibiotic/antimycotic solution (Cat No. AAS-B, Capricorn, Düsseldorf, Germany). All cell lines were maintained at 37 °C in an atmosphere of 5% CO2.
For RNA extraction, the cells were grown in culture flasks to 60–70%
confluence. Then, the cells from each flask were processed as individual
biological samples. We analysed two to four biological samples of each cell line.
The total RNA was extracted from these cells using an RNA solo kit (Cat No.
BC034S, Evrogen, Moscow, Russia). Briefly, the cells were detached from the flask
surface using 0.25% trypsin-EDTA solution (Cat No. 25200056, Gibco Paisley, UK)
and counted using a Luna II cell counter (Logos Biosystems, Anyang-si, Korea).
Following centrifugation, the cell pellets were resuspended at a ratio of 7
Complementary DNA (cDNA) was synthesised from 800 ng of total RNA in a 20 µL final volume using an MMLV RT kit (Cat No. SK021, Evrogen, Moscow, Russia) according to the manufacturer’s instructions. Reverse transcription was performed using equal concentrations (10 µM) of oligo(dT) and random decamer primers and 100 units of MMLV reverse transcriptase. The mixture was incubated at 40 °C for 45 min for reverse transcription and then at 70 °C for 10 min for enzyme inactivation. cDNA was stored at –80 °C and diluted 10-fold in RNAse-free water before performing the qPCR.
To establish putative reference genes for the wide variety of cancer and normal cell lines analysed in this study, we selected eight housekeeping genes most frequently used in cell studies and that were previously shown to be stable in different cell models [15, 16]. These candidate housekeeping genes are involved in different cell functions. Primers specific to these housekeeping genes were designed with the help of the primer design tool Primer-BLAST (https://www.ncbi.nlm.nih.gov/tools/primer-blast/) or were obtained from previous publications [17, 18, 19, 20, 21, 22, 23] and subsequently checked using Primer-BLAST. The housekeeping genes, RefSeq accession numbers, encoded proteins/RNAs, specific primer sequences, exon location, product lengths, references to publications and qPCR efficiencies are summarised in Supplementary Table 1. Oligonucleotides were obtained from Evrogen, Moscow, Russia.
qPCR was performed using 5
The amplification included several steps. The hot-start step was performed at 95 °C for 3 min; then, 39 cycles of denaturation (95 °C for 5 s) and subsequent annealing/elongation (62 °C for 10 s) were conducted, followed by fluorescence plate reading. At the end of the amplifications, a melt curve analysis was performed at 65–95 °C.
We analysed the obtained qPCR curves using Bio-Rad CFX Maestro 2.3 software (Version 5.3.022.1030, BioRad Laboratories, Inc., Hercules, CA, USA). Cqs were defined by the software’s incorporated regression mode. The regression mode applies a multivariable, nonlinear regression model to individual fluorescent traces and then uses this model to determine the most suitable cycle of quantification (Cq) value.
Next, we evaluated the efficiency of each pair of primers. We added an equal volume of each sample to the common mix and made a 2–4-fold series of sample mix dilutions. qPCR with these sample series was performed, and the obtained Cq values, which were dependent on sample concentrations, were analysed to determine primer efficiency. The obtained efficiency of each primer pair and the R2 value are listed in Supplementary Table 1. The R2 value reflects the goodness-of-fit of the measured standard Cqs with the generated standard curve, which is linear in the logarithmic concentration scale (Log10 of concentration vs. Cq).
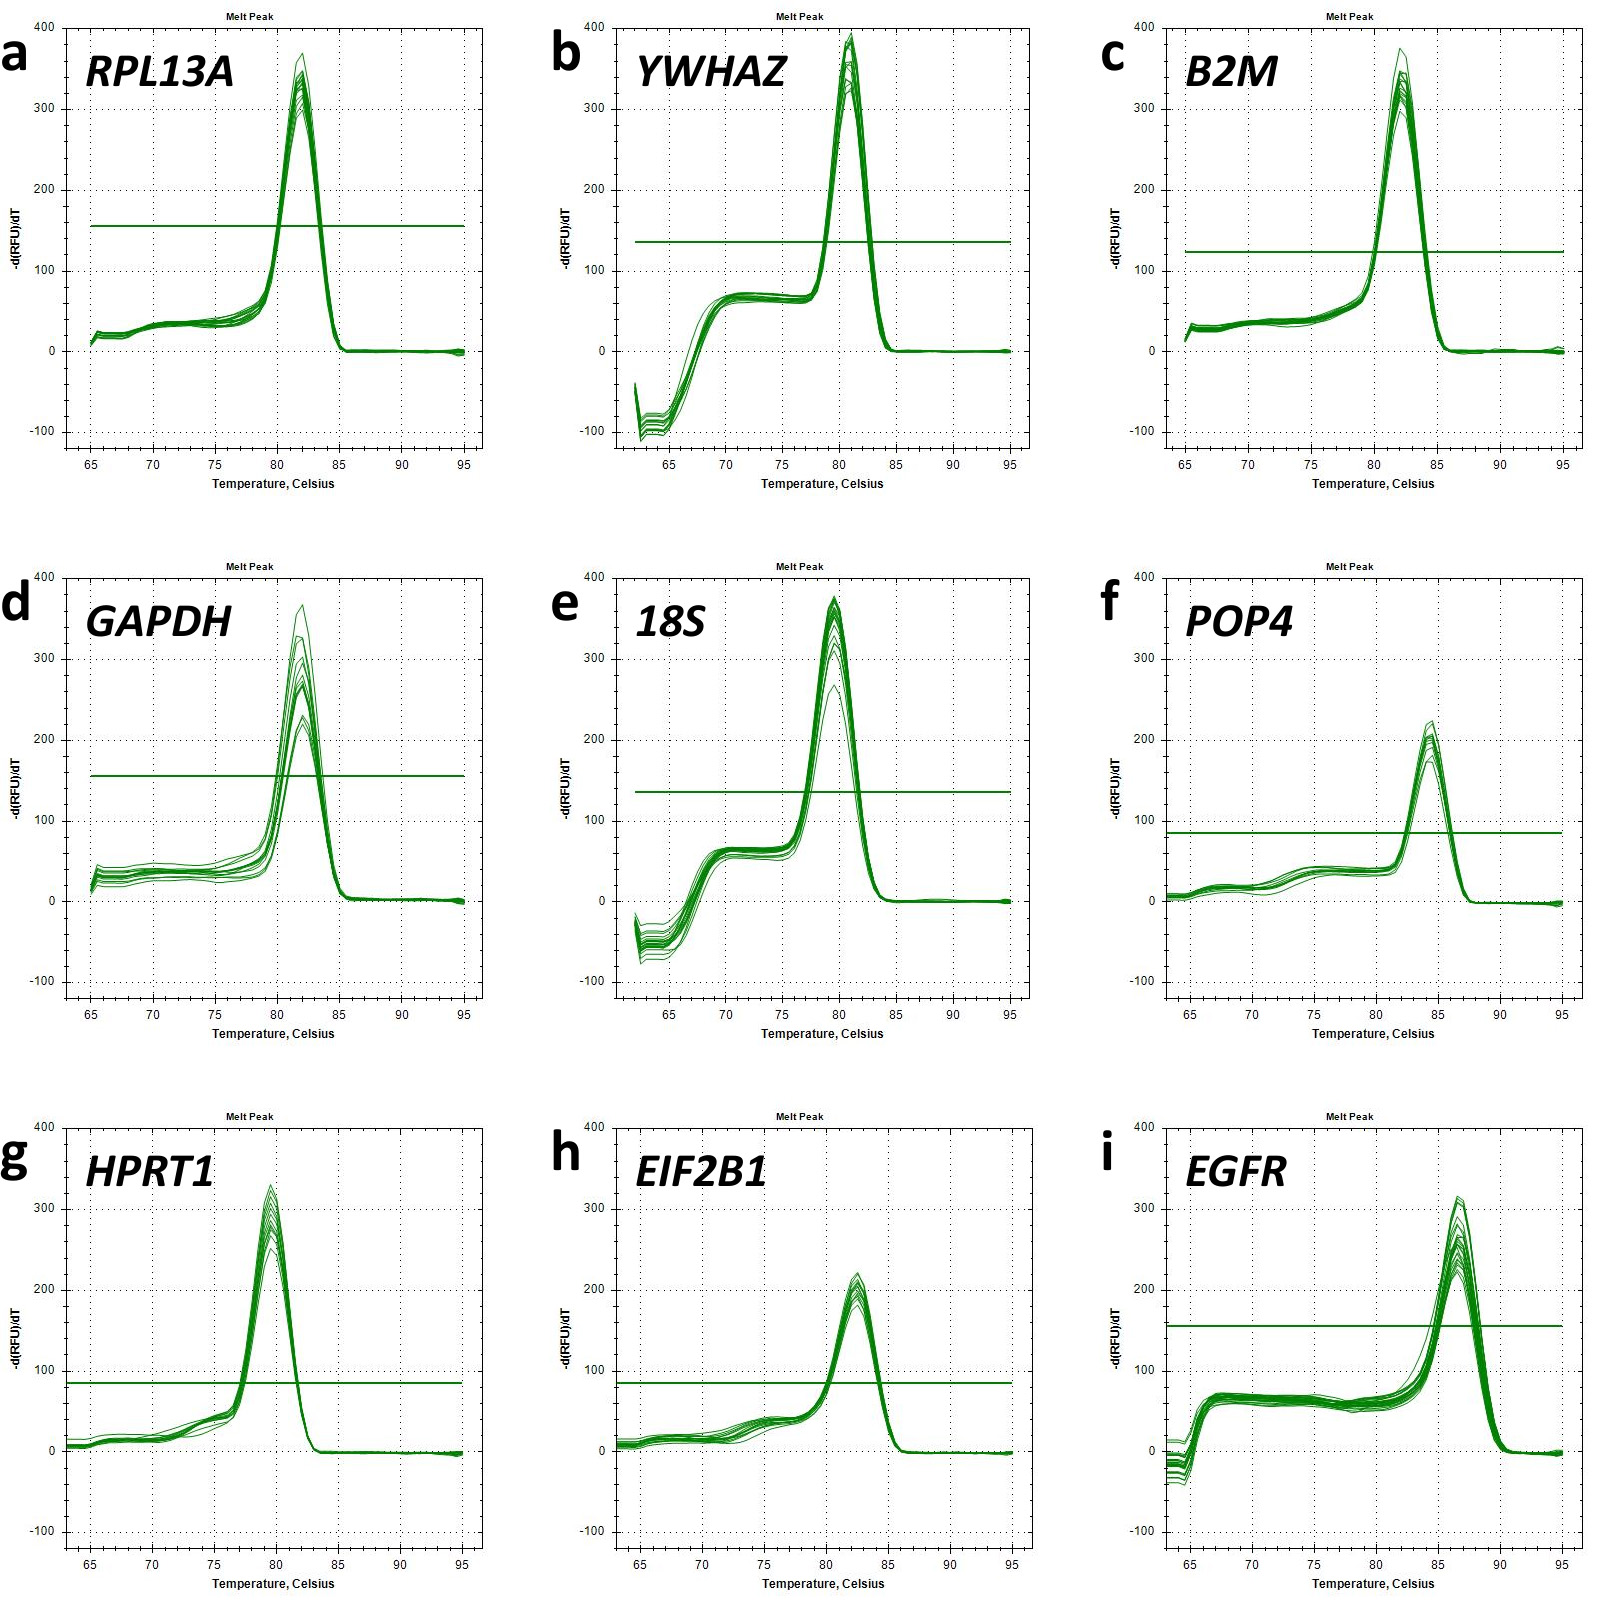
The melt curves of each primer pair were also analysed to ensure the specificity of the fluorescent signal (Fig. 1). A single peak presented at all melt curves reflected the specificity of the primers used.
 Fig. 1.
Melt curve analysis. Graphs of relative fluorescence intensity dependence as a function of temperature demonstrate the detection of single polymerase chain reaction (PCR) products for each target gene analysed. Horizontal lines represent threshold values of minor fluorescence intensity fluctuations. Melt curve for (a) RPL13A; (b) YWHAZ; (c) B2M; (d) GAPDH; (e) 18S; (f) POP4; (g) HPRT1; (h) EIF2B1; (i) EGFR.
We evaluated the reference gene stability by comparing Cq data between samples
using the RefFinder online tool
(https://www.ciidirsinaloa.com.mx/RefFinder-master/). Reference gene stability
was calculated using the comparative
The relative EGFR mRNA expression in cancer and mesenchymal stromal cell lines was calculated by the 2-ΔΔCt Method [24] against the three most optimal or the least stable reference genes according to the RefFinder ranking. The average expression in HeLa cells was used as a control sample for normalisation.
We performed statistical processing of the data in GraphPad Prism 9 (GraphPad
Software, San Diego, CA, USA). The Brown-Forsythe test was used to assess the
equality of variances. As no significant differences were found in group
variances and more than two experimental groups were analysed, mean comparisons
were conducted using one-way ANOVA with Dunnett’s post-hoc test for multiple
pairwise comparison of different cell lines with HeLa cells. Differences were
considered significant at p
We analysed the stability of eight housekeeping genes in a wide variety of human cell lines, which can be subdivided into two main subgroups:
(1) Human malignant cells (cervix carcinoma HeLa cell line, breast adenocarcinoma MCF-7, uterine leiomyosarcoma SK-UT-1B, lung carcinoma cell line A549, epidermoid carcinoma A431, breast adenocarcinoma cell line SK-BR-3).
(2) Human non-malignant (normal) mesenchymal cells: endometrial mesenchymal stromal cells (enMSCs, line 2804 and AMO), human umbilical cord MSCs (MSCWJ-1) and human dental pulp MSCs (MSC-DP).
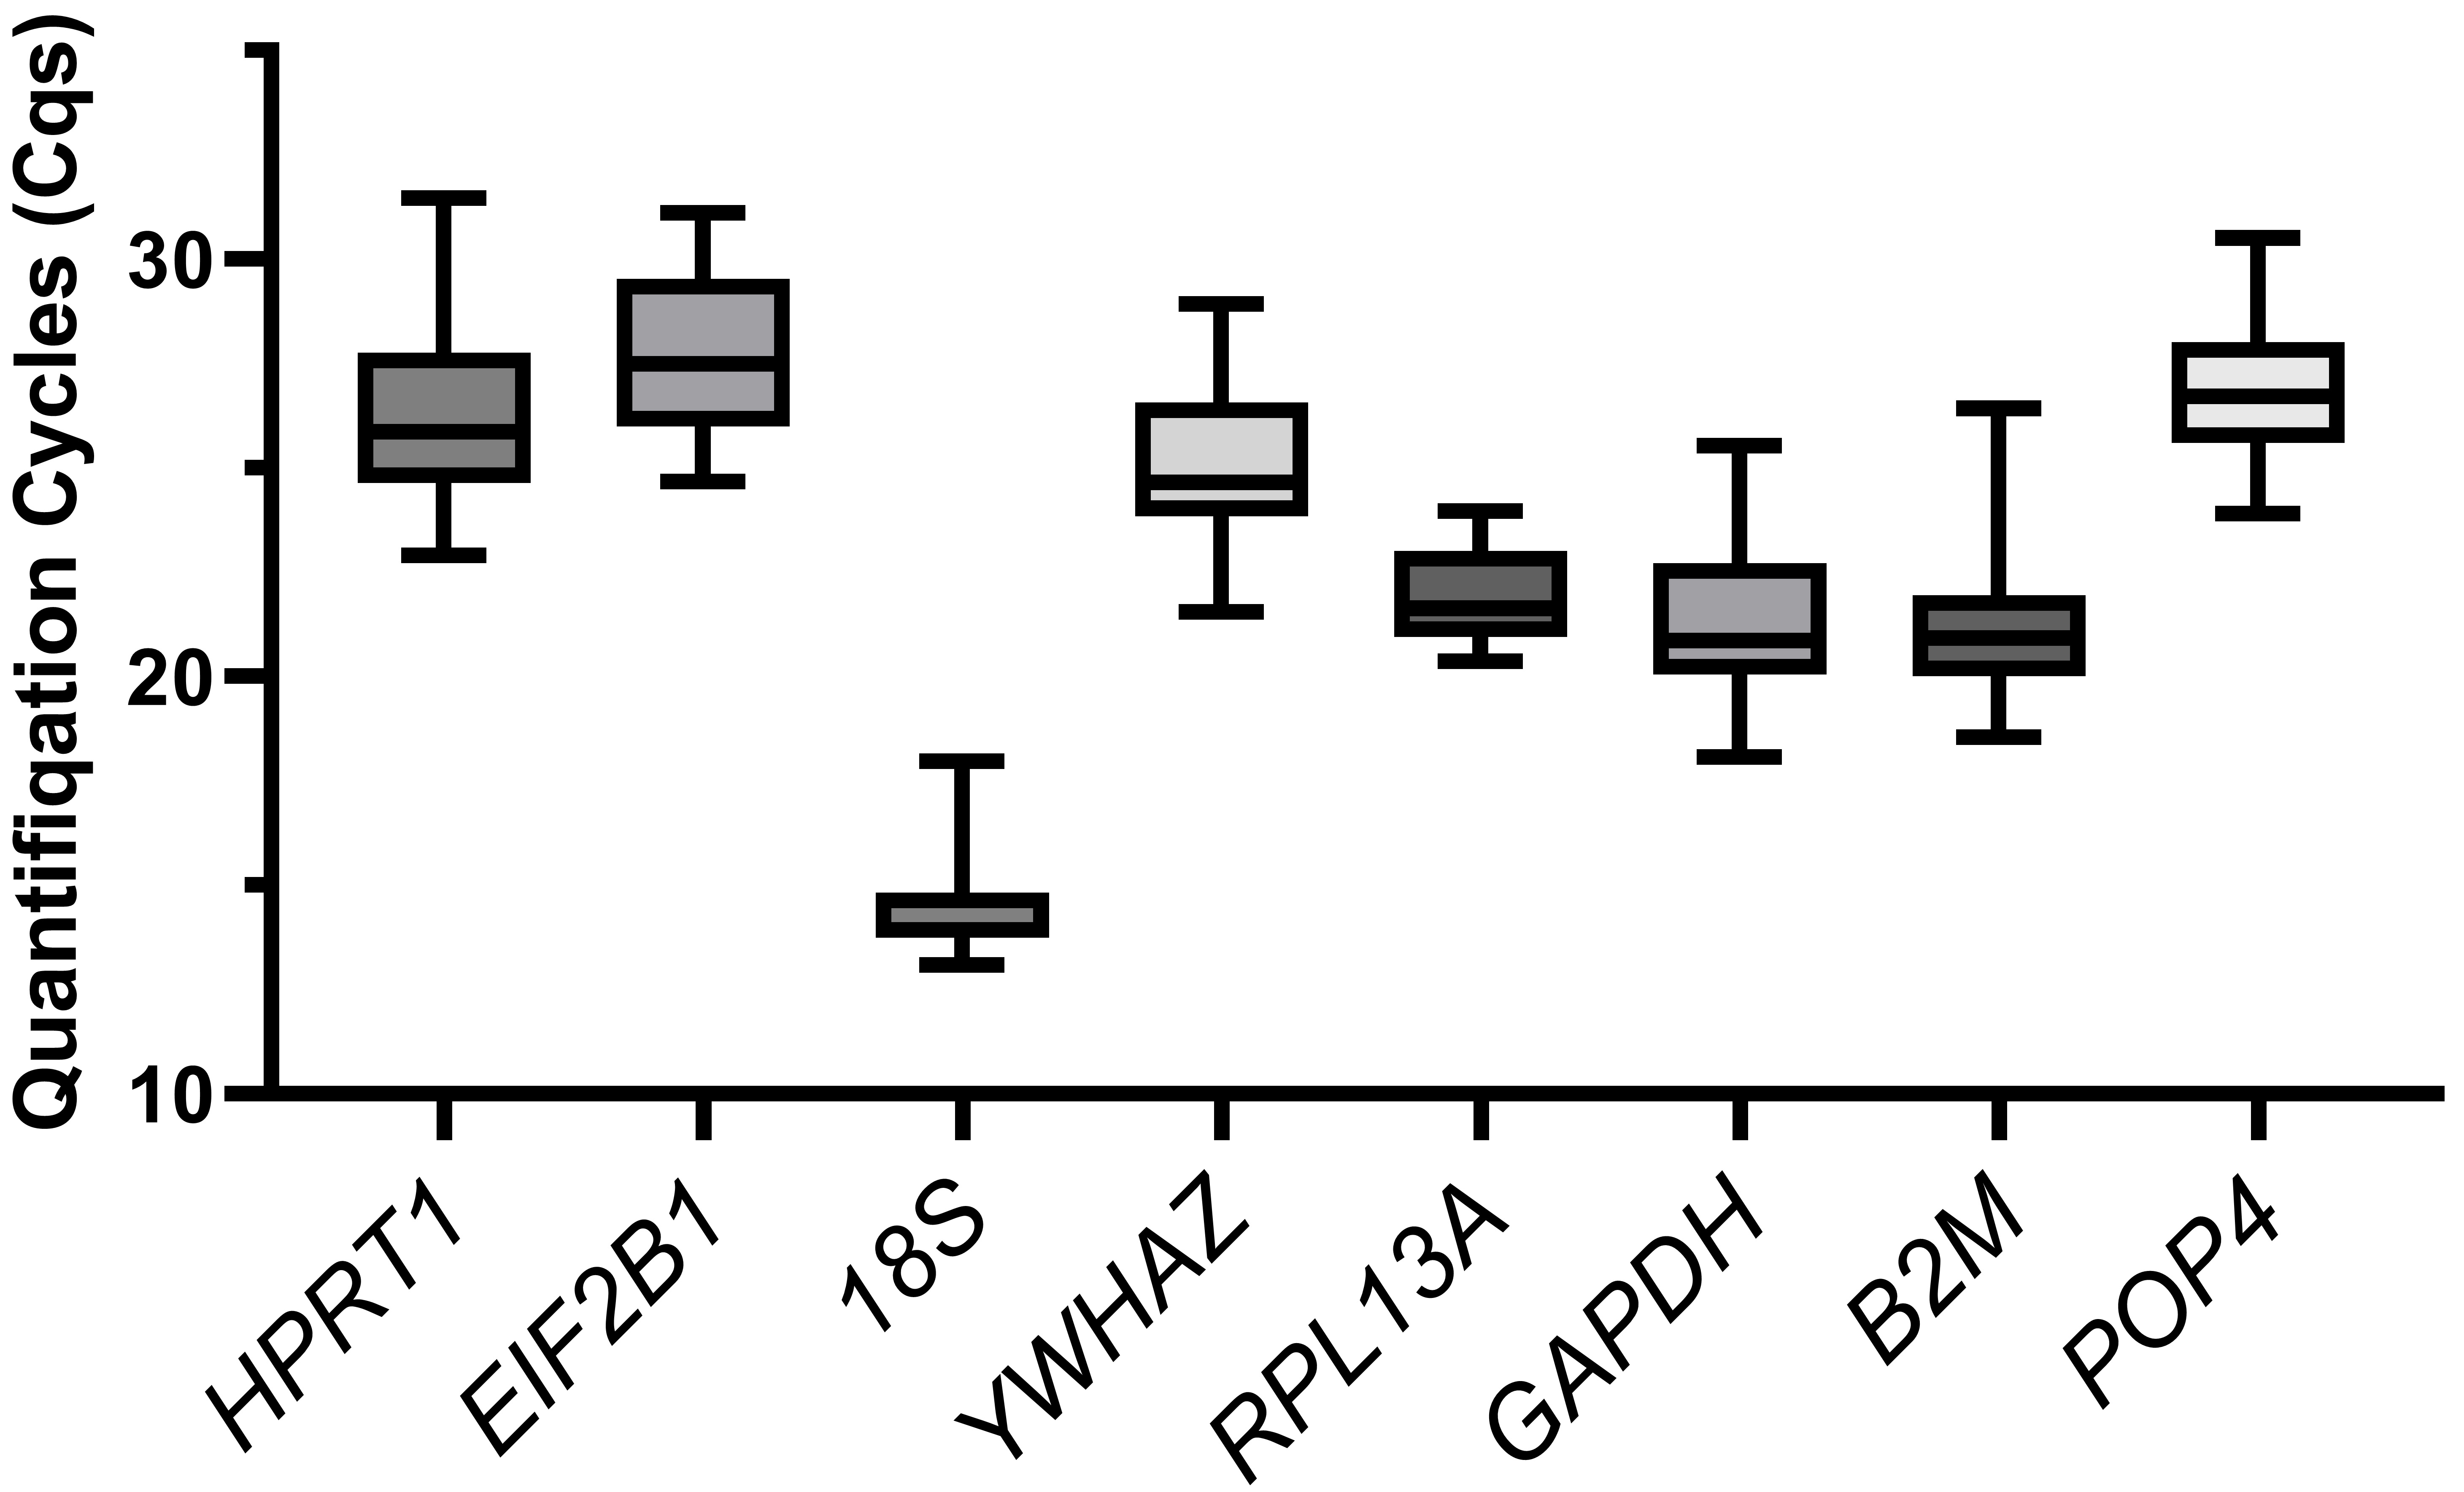
We compared the distribution of the Cq values of the reference genes for all the cells tested (Fig. 2). The 18S gene showed the highest expression (Cq = 13.1–18.0, median of 14.6), while EIF2B1 had the lowest expression (Cq = 24.7–31.1, median of 27.5). The Cq values (median meanings) of other housekeeping genes ranged from 21 to 26.
 Fig. 2.
The boxplot of quantification cycle values. Variation in quantification cycles (Cq) observed in all cDNA samples tested for all examined candidate reference genes. The data are presented as median (central line) with interquartile range (box), and Min-Max range (whiskers).
We first evaluated the stability of the candidate reference genes in the entire
panel of cell lines. The reference gene stability for the panel was obtained
using four algorithms (the comparative
 Fig. 3.
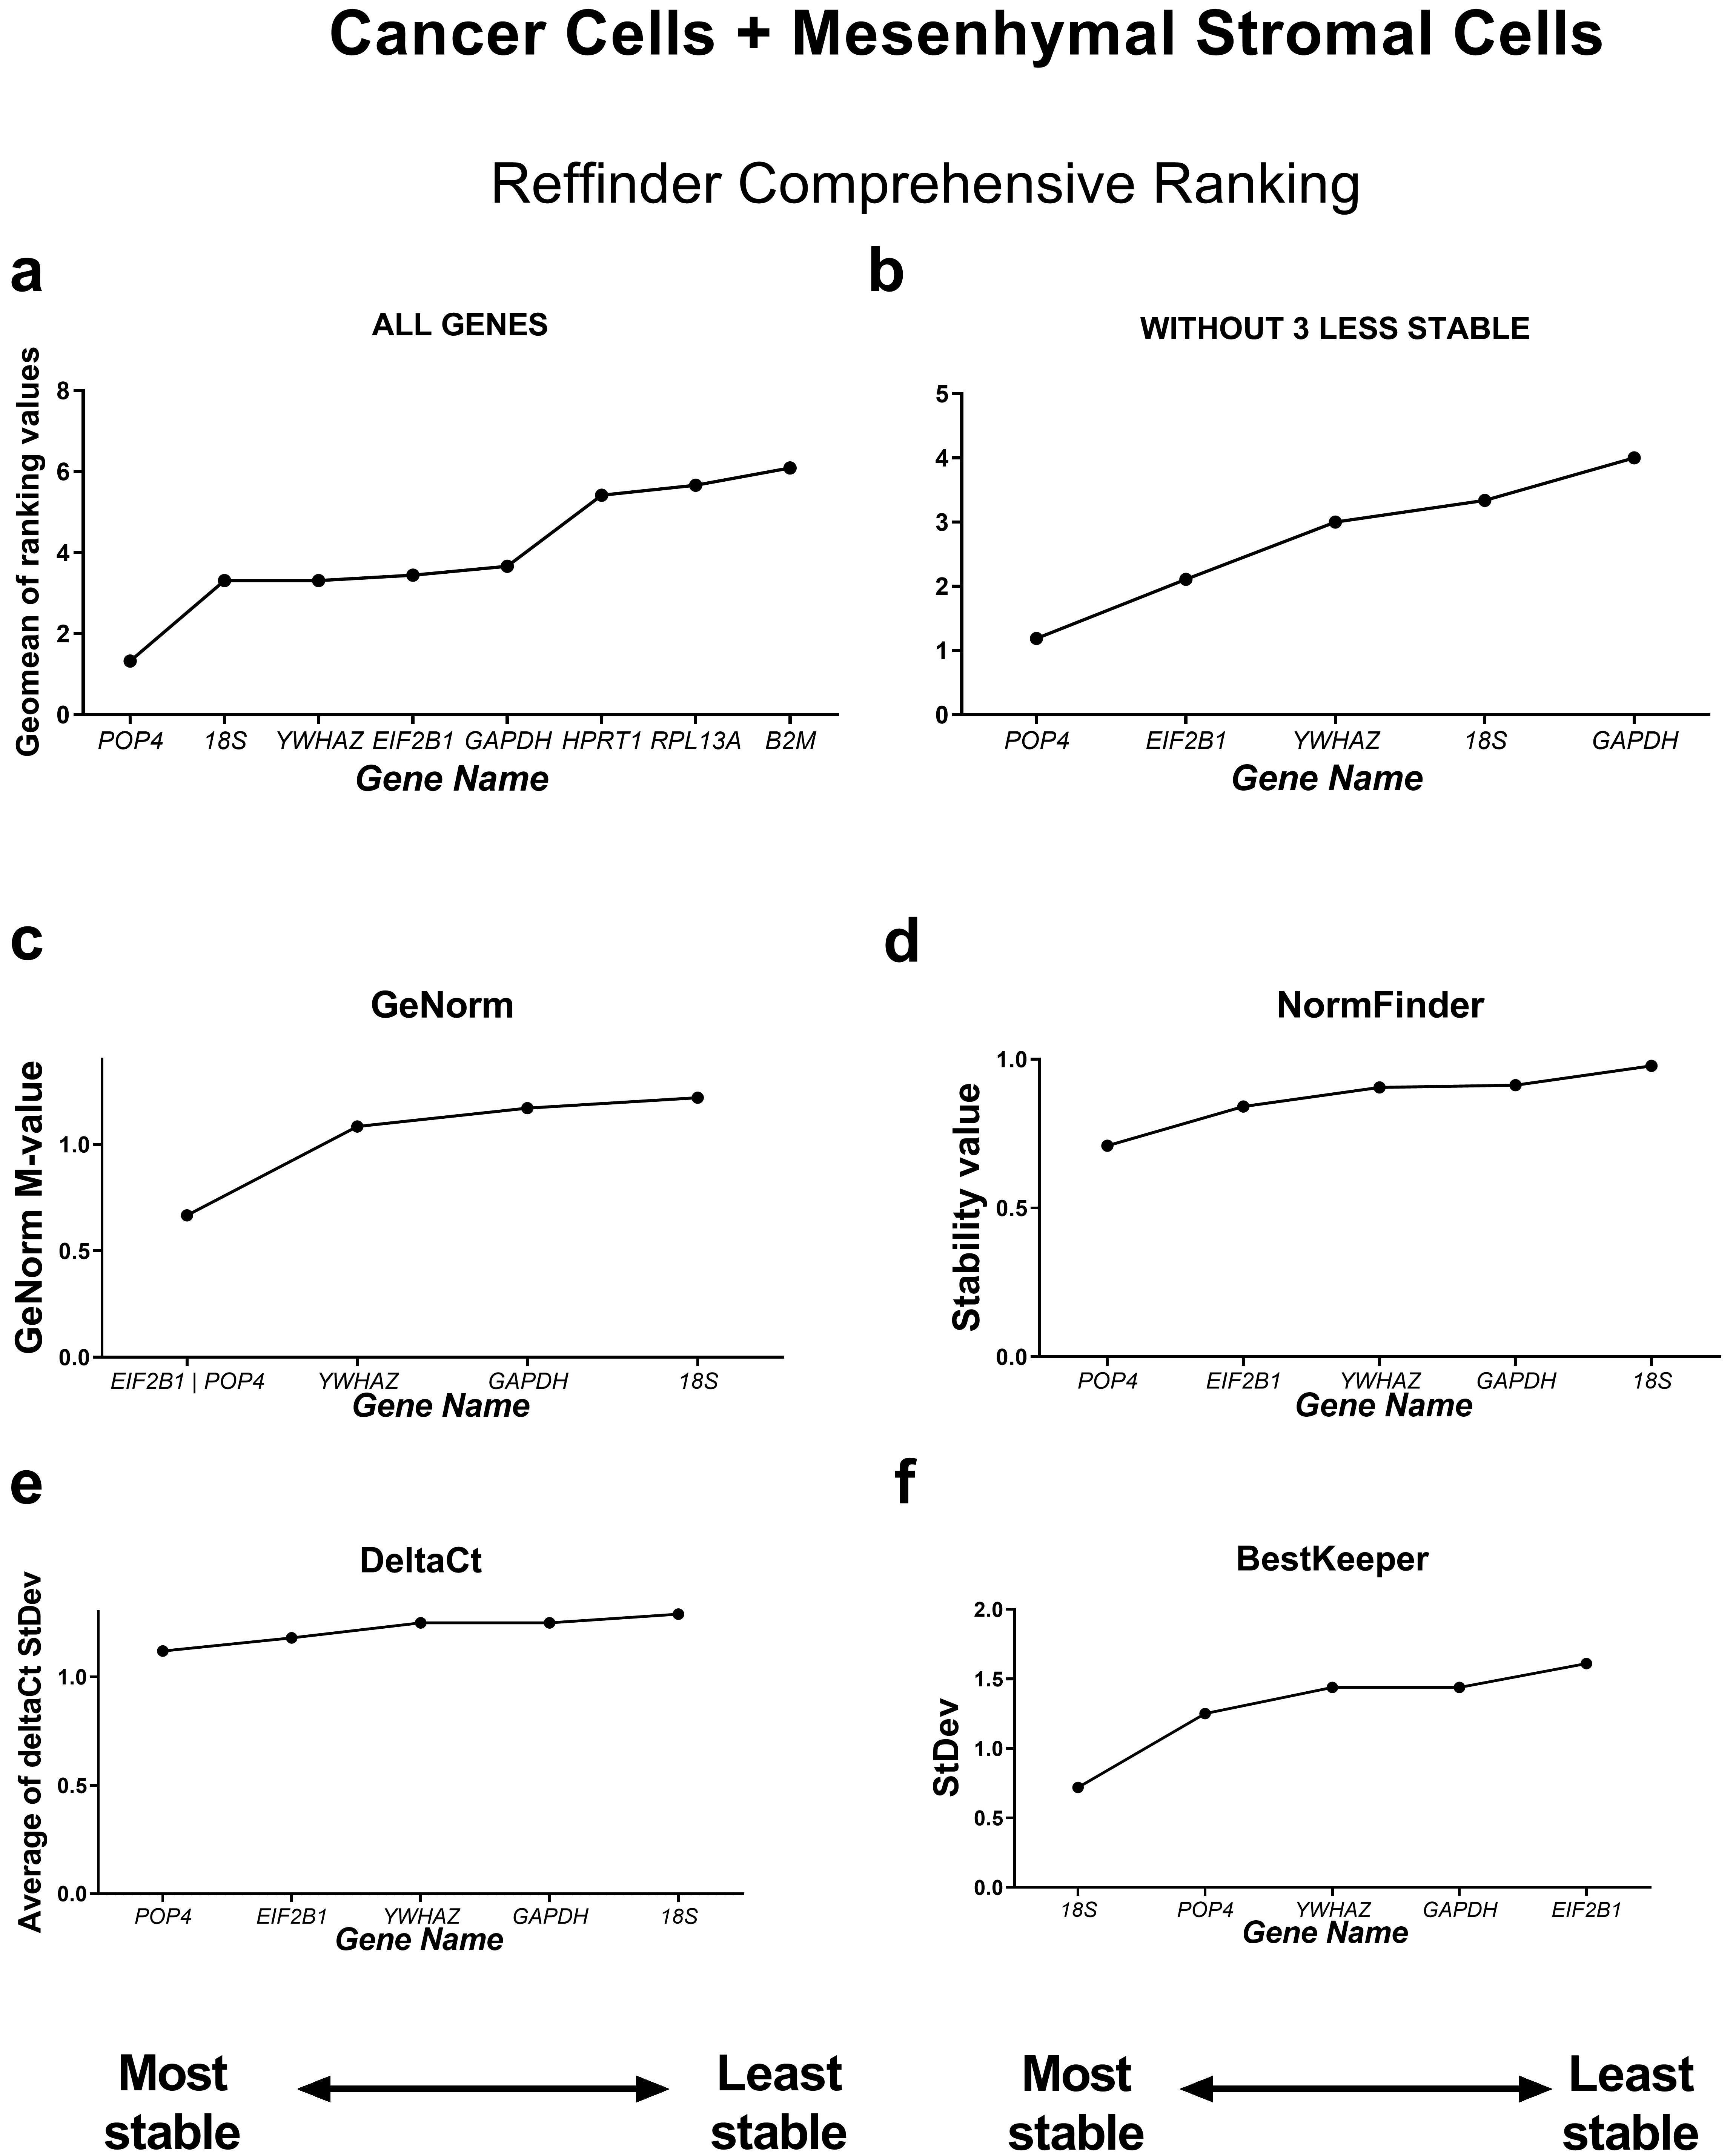
Reference gene expression stability in all ten cell lines tested
(cancer and mesenchymal stromal cell culture samples). Reference gene expression
was analysed in biological samples obtained from human cancer (HeLa, MCF-7,
SK-UT-1B, A549, A431, SK-BR-3) or mesenchymal stromal cell lines (two lines of
endometrial mesenchymal stromal cells (MSCs), human umbilical cord MSCs and human
dental pulp MSCs). Reference gene expression stability was evaluated using four
algorithms (the comparative
According to the RefFinder comprehensive stability ranking, POP4, 18S and YWHAZ were the three most stable housekeeping genes in this model, while the three least stable genes were HPRT, RPL13A and B2M.
Based on this ranking, we excluded the least stable reference genes to avoid
possible bias in calculations from unstably expressed genes. The most stable
reference genes as determined by RefFinder were POP4 and EIF2B1
(Fig. 3). The five most successful candidate reference genes were individually
analysed in detail by each of the four algorithms. According to geNorm, all five
genes tested had stability values lower than the cutoff value of M = 1.5,
indicating that they were not unreliable [7]. The lowest M value was 0.667 for
EIF2B1 and pOP4, so these genes can be interpreted by geNorm as
the most stable ones. According to the BestKeeper algorithm, only the 18S gene
had an StDev value less than 1 (0.723) and thus could be considered stable [5].
Both the NormFinder and
Next, we analysed the stability of housekeeping genes in the subgroups of cancer and normal mesenchymal cell cultures separately.
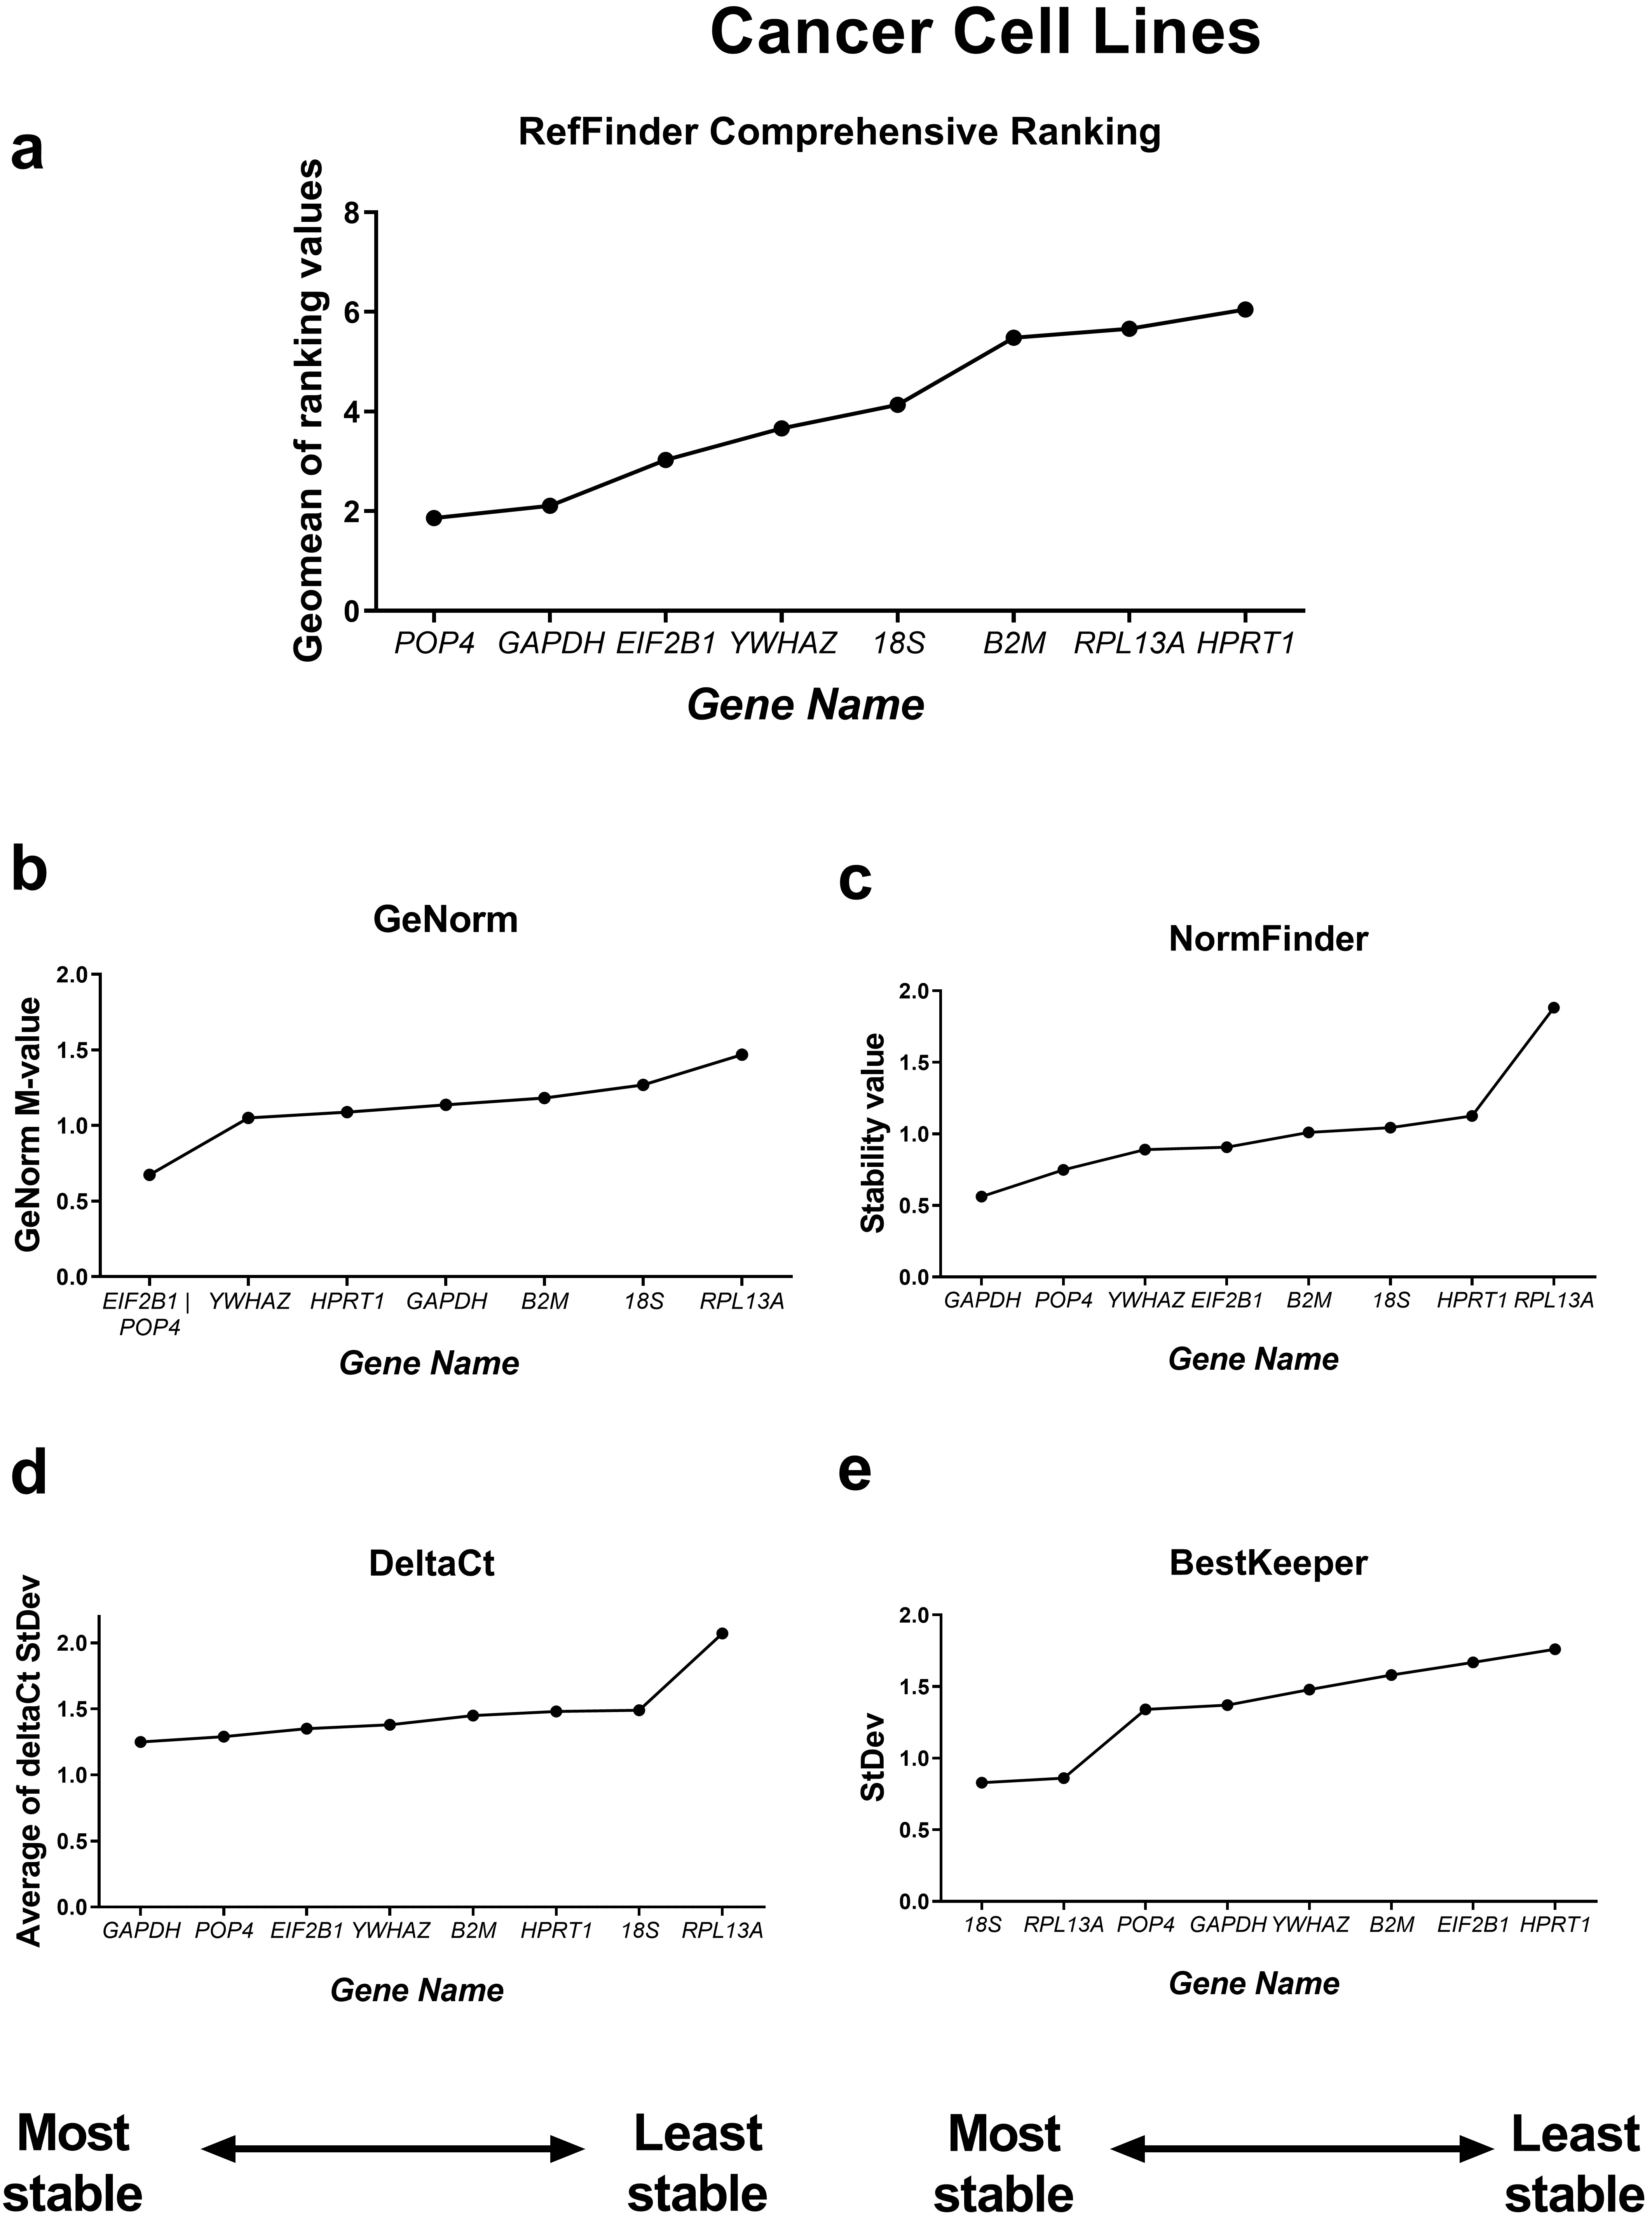
First, we compared the RefFinder comprehensive ranking results for these two subgroups (Figs. 4,5). In the cancer cell lines, POP4, GAPDH and EIF2B1 were the most stable genes, and B2M, RPL13A and HPRT1 were the least stable. This differed from the ranking of housekeeping genes in the subgroup of mesenchymal stromal cell cultures (MSCs), where none of the POP4, GAPDH or EIF2B1 genes were among the most stable ones. Moreover, GAPDH in MSCs had the highest ranking value. In MSCs, RefFinder indicated that 18S, B2M and RPL13A were the most stable genes (Fig. 5), while GAPDH, HPRT1 and YWHAZ were identified as the most variable genes.
 Fig. 4.
Reference gene expression stability within the cancer cell
culture samples. Reference gene expression was analysed in biological samples
obtained from human cancer (HeLa, MCF-7, SK-UT-1B, A549, A431, SK-BR-3) cell
lines. The RefFinder comprehensive final gene stability ranking (a) was
calculated based on the reference gene expression stability indexes evaluated by
four algorithms: geNorm (b), NormFinder (c), the comparative
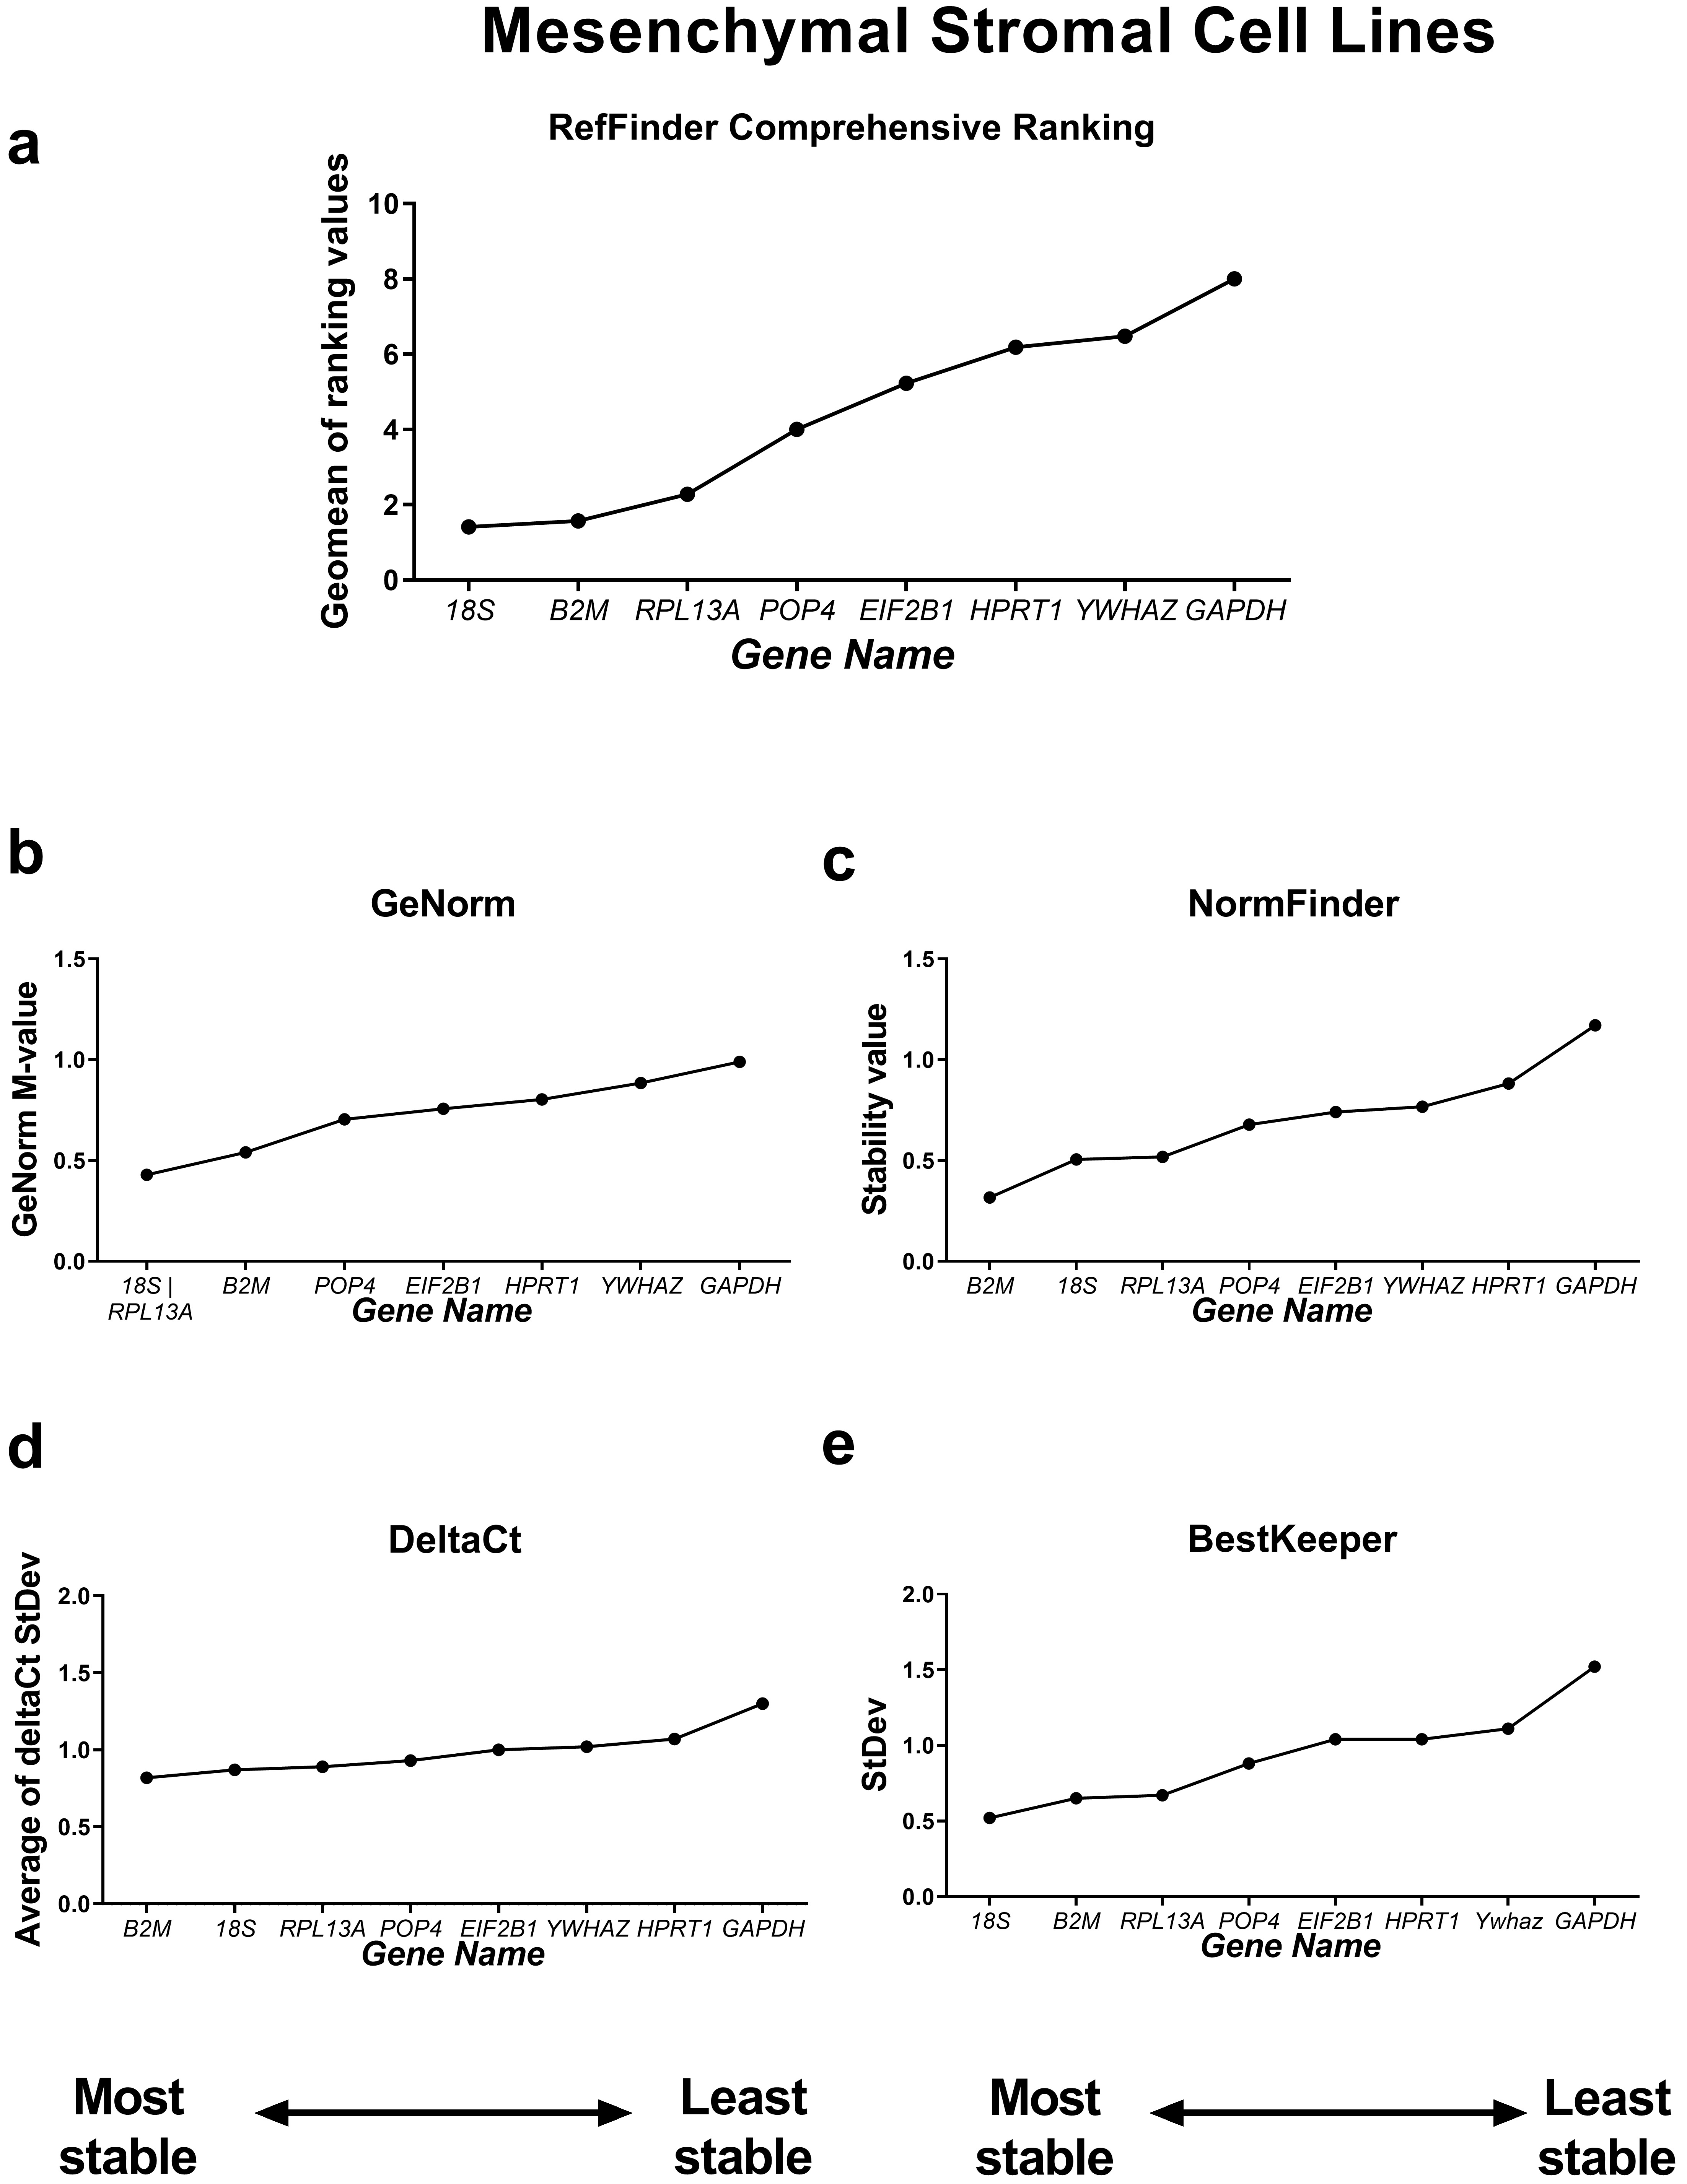 Fig. 5.
Reference gene expression stability within mesenchymal stromal
cell lines. Reference gene expression was analysed in biological samples
obtained from human mesenchymal stromal cell line cultures (two lines of
endometrial MSCs, human umbilical cord MSCs and human dental pulp MSCs). The
RefFinder comprehensive final gene stability ranking (a) was calculated based on
the reference gene expression stability indexes evaluated by four algorithms:
geNorm (b), NormFinder (c), the comparative
The geNorm M value varied from 0.674 for EIF2B1 and POP4 to
1.469 for RPL13A in the cancer cells (Fig. 4) and from 0.429 for
18S and RPL13A to 0.989 for GAPDH in MSCs (Fig. 5).
Thus, the M values in both subgroups were lower than the cutoff stability value M
= 1.5, and these values were much lower for MSCs. According to BestKeeper,
18S and RPL13A (Fig. 4) in cancer cells and 18S,
B2M, RPL13A and POP4 in MSCs had StDev values
Both the NormFinder and
The NormFinder and
Finally, to demonstrate that the results concerning the target gene expression can differ depending on the reference genes chosen, we conducted an analysis of the expression of epidermal growth factor receptor (EGFR), a transmembrane protein involved in the regulation of cell survival, growth, proliferation and differentiation. As the dysregulation of EGFR expression and signalling is closely linked to cancer progression [25], investigations of EGFR-mediated signal transduction and intracellular transport peculiarities in cancer versus normal (non-malignant) cells are of considerable interest to many researchers.
First, the expression data were normalised by the geometric average of the three most stable reference genes selected according to RefFinder ranking (POP4, EIF2B1, YWHAZ). We found that EGFR mRNA was decreased in the MCF-7 and SK-UT-1B cell lines and increased in the A431 line compared to HeLa (Fig. 6A). We did not detect any differences in EGFR mRNA levels between HeLa and the other cell lines tested. However, when the results were normalised by the three least stable genes identified (HPRT1, RPL13A, B2M), the aforementioned changes were not detected. In this case, we did find a false increase in EGFR mRNA content in SK-BR-3 cells compared to HeLa cells (Fig. 6B). Thus, inaccurate normalisation leads to significant misinterpretations of EGFR expression data.
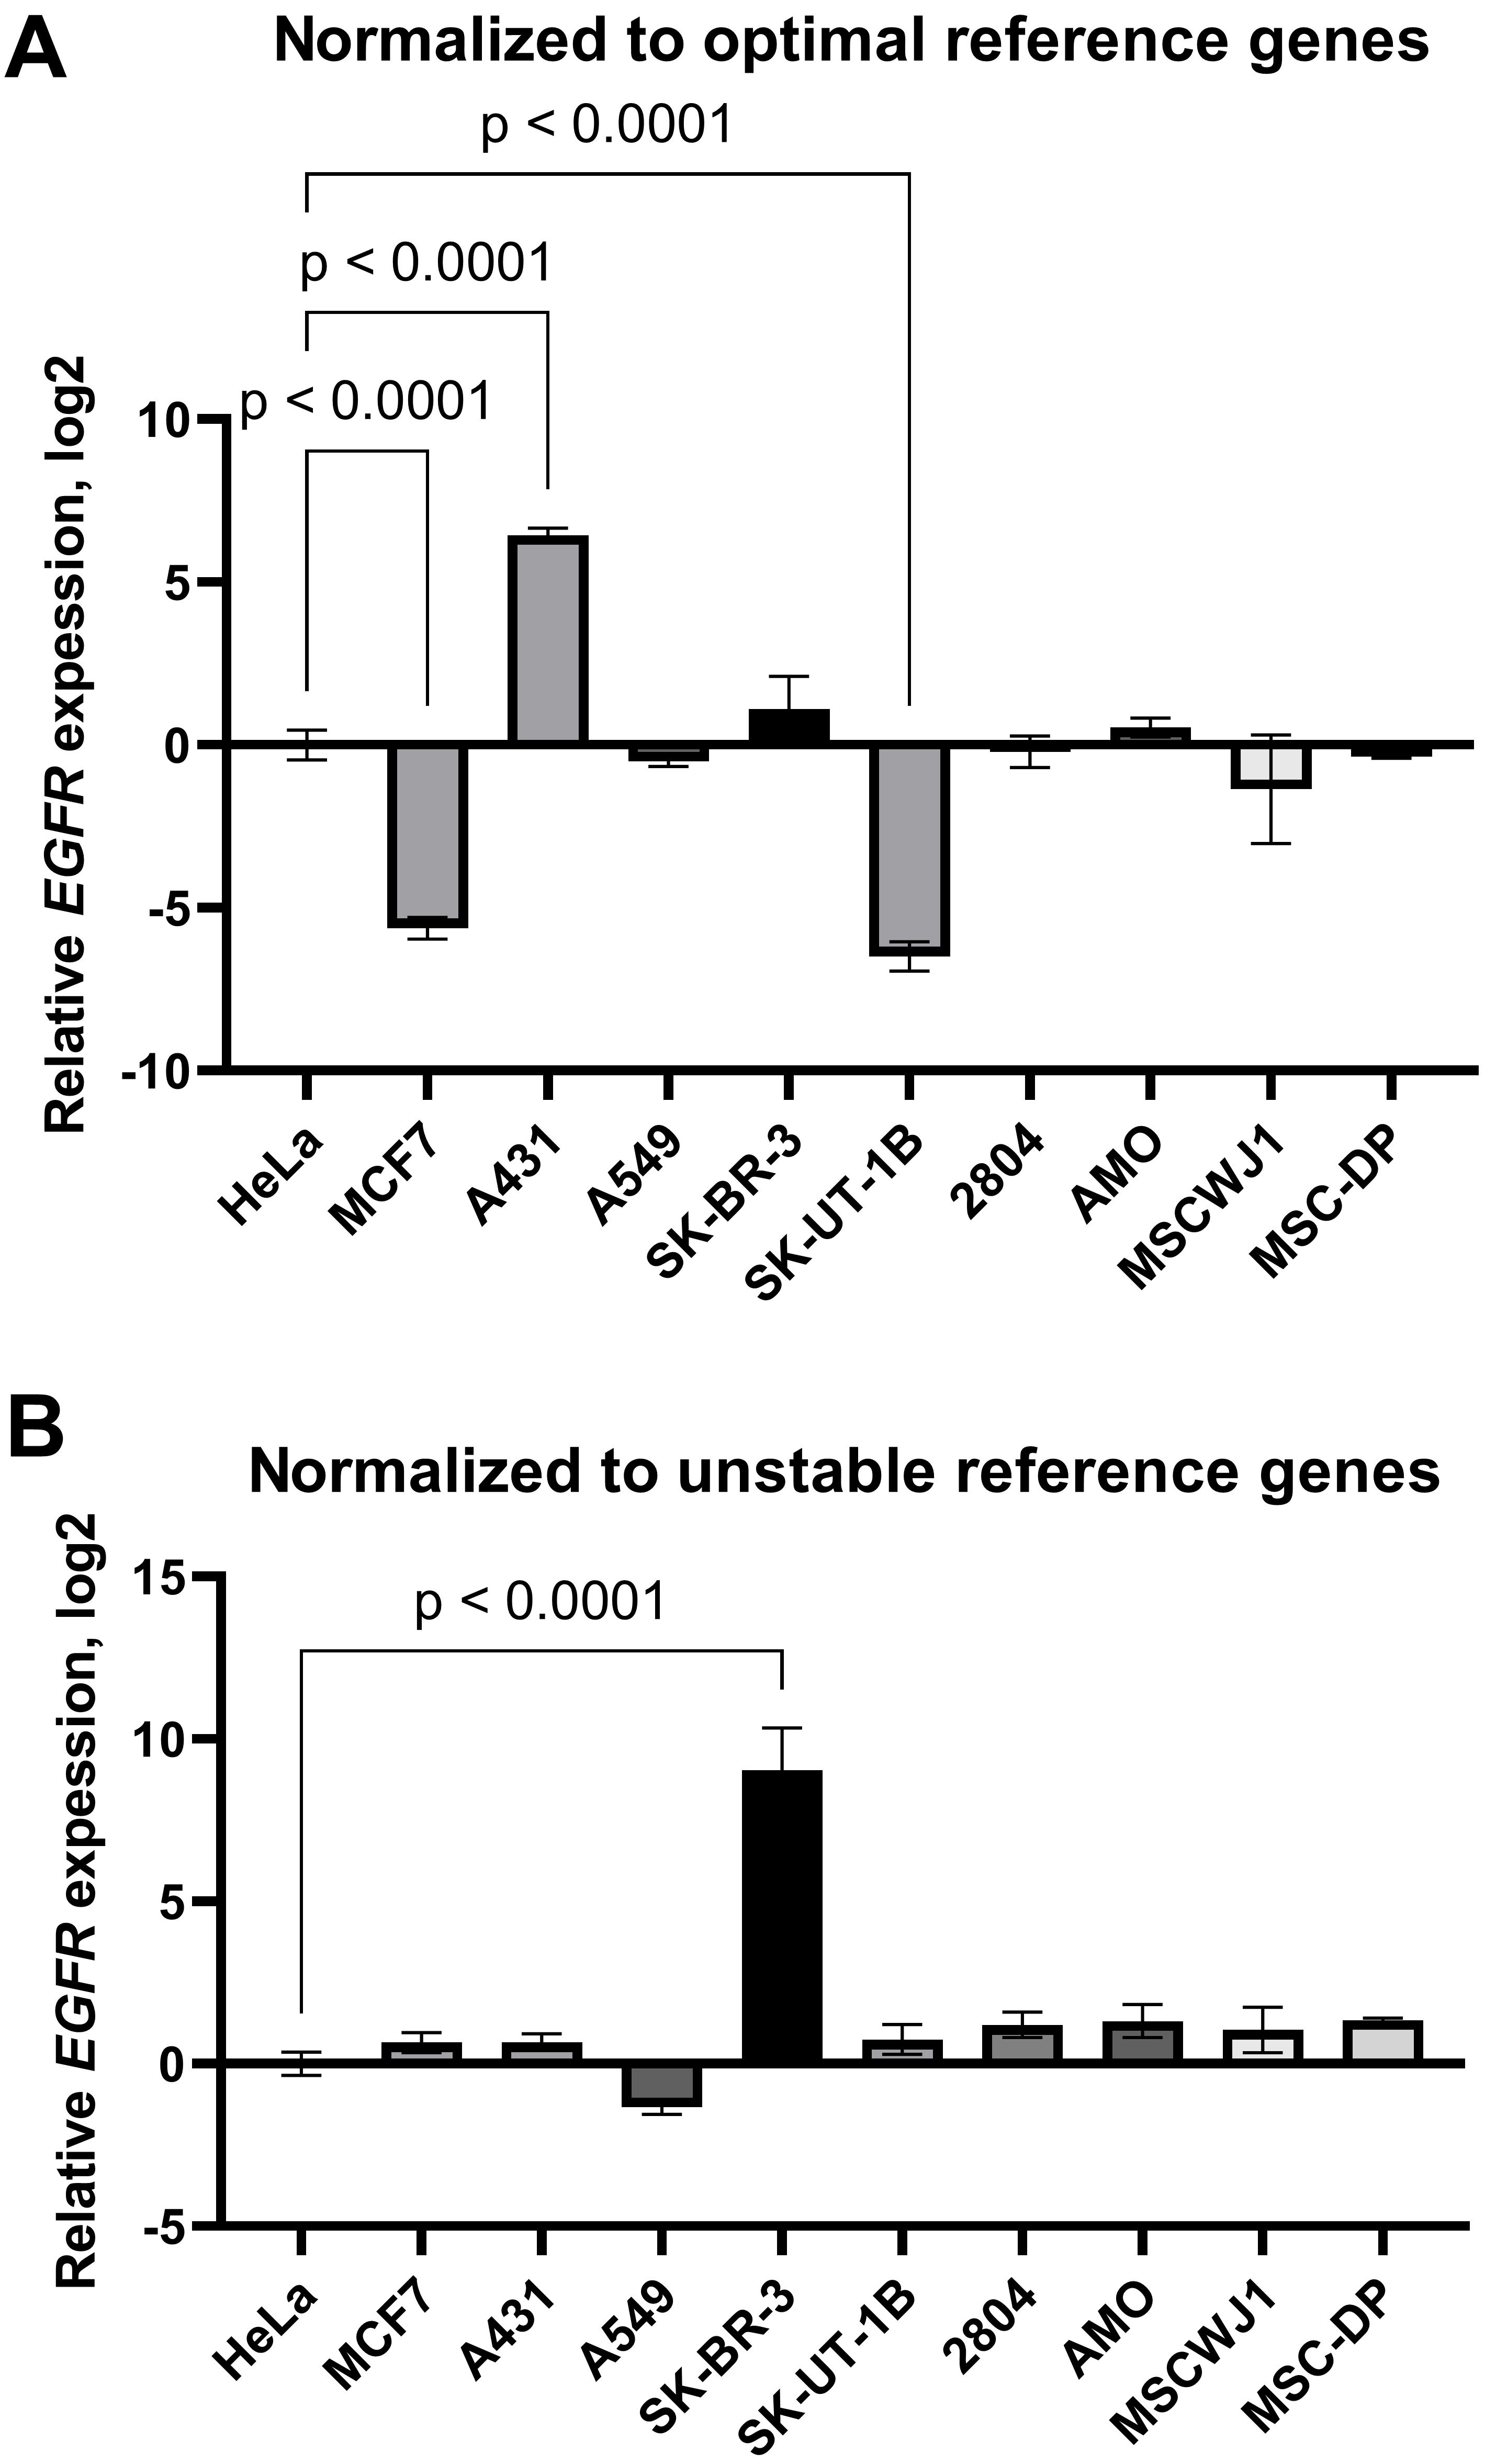 Fig. 6.
The epidermal growth factor receptor mRNA expression in cancer
and mesenchymal stromal cell lines: effects of normalisation strategy on the
reverse transcription-quantitative real-time polymerase chain reaction (RT-qPCR)
results. mRNA expression data were normalised by (A) the three optimal
(YWHAZ, POP4, EIF2B1) reference genes and (B) the
three least stable (B2M, RPL13A, HPRT1). Data are
presented as mean
In this study, we performed an RT-qPCR analysis of the expression stability of eight candidate reference genes from the variety of cancer and normal cell lines frequently used in cell studies. We selected the most widely used human cancer cell lines (HeLa, MCF-7, SK-UT-1B, A549, A431 and SK-BR-3) as well as several primary mesenchymal cell lines as the model of normal cells (two lines of human endometrial MSCs, one line of human umbilical cord MSCs [MSCWJ-1] and one line of dental pulp MSCs [MSC-DP]). We deliberately avoided the use of in vitro immortalised cell lines as a model of normal cells in our study, as the gene expression profile of such cells may significantly differ from that of primary cells of the same origin [26].
Our results provide technical information about the reference gene expression stability, and we don’t aim to distinguish the mechanisms affecting variability in gene expression in the experiments. The observed changes between the cell line panels could have originated from the changes in transcriptional and posttranscriptional regulation at the subcellular level, as well as from the differences in cell subtype composition within the samples. However, in this section we attempt to compare our data with those from previous research to discuss possible factors affecting observed differences in the reference gene expression stability.
RefFinder identified the POP4 gene as the most stable in the group of cancer cells and in the entire panel of cells. The POP4 gene (processing of precursor 4, ribonuclease P/MRP subunit) encodes RPP29, a protein subunit of the two complexes: the endoribonuclease for the mitochondrial RNA processing complex involved in mitochondrial RNA editing and the ribonuclease P complex. In the latter complex, RPP29 acts as the central protein that interacts with other proteins of the complex and with the RNA included in the ribonuclease P (RNase P) complex [27]. Ribonuclease P is an ancient enzyme found in all kingdoms of life that is involved in the maturation of the 5′ end of transfer RNA (tRNA) [28]. RNase P and its components are well known to have non-canonical functions in regulating chromatin assembly and DNA damage responses, and they process basic biomolecules, such as pre-tRNA and other RNA substrates [29]. Thus, stable expression of the POP4 gene is likely critical to normal and especially malignant cells, at least in vitro, due to its multiple physiological functions in RNA processing and genome regulation.
According to our data, the EIF2B1 gene was also among the most stable
housekeeping genes in a wide panel of cell lines of different origins. This gene
encodes one of the subunits of eukaryotic translation initiation factor 2B
(eIF2B). eIF2B is the guanine nucleotide exchange factor for the eIF2 complex.
eIF2 delivers an initiator, methionyl-tRNA, to the ribosome to promote
translation initiation, and eIF2B regulates the activity of eIF2 by exchanging
GDP for GTP on the
Different cellular investigations have often identified the EIF2B1 and POP4 genes as the most stable. EIF2B1 and POP4 were revealed to be one of the most stable genes among the 24 candidate genes tested in total RNA samples isolated from surgically removed tumor and non-malignant tissues of 10 patients with pancreatic carcinoma [32]. EIF2B1 and POP4 were also found to be the most stable of the 32 housekeeping genes when mesenchymal stem cells derived from the menstrual blood of women with endometriosis were compared with those of healthy women [16]. However, in cancerous and non-malignant tissues of the human uterine cervix, POP4 and EIF2B1 are among the most variable genes [33]. According to our data concerning only MSCs of different origins (including endometrium-derived stromal cells), POP4 and EIF2B1 show average stability (the fourth and fifth places according to the RefFinder stability ranking, respectively).
The most stable candidate reference genes for MSCs were 18S rRNA and B2M (Fig. 5). 18S ribosomal RNA, which is encoded by the RNA18SN5 gene, is the structural component of the eukaryotic ribosomal small subunit and is involved in the catalysis of protein synthesis at ribosomes [34]. The 18S ribosomal RNA gene is highly conserved among eukaryotes due to its function and is often considered to be stable [35, 36, 37]. However, 18S is an unsuitable reference in experiments where only mRNA is isolated from cells or only oligo(dT) primers are used during reverse transcription. This is because rRNA contains no poly(A) tail [38]. In our experiments, we used both oligo(dT) and random primers during cDNA synthesis, so we suggest that 18S rRNA is a suitable reference gene for MSCs.
The B2M was also found to be of low variability in MSCs (Fig. 5). In
contrast, our data concerning cancer cells only and cancer cells+MSCs revealed
the high variability of B2M between samples (Figs. 3,4) [39].
B2M encodes
We found the most variable gene for MSCs to be GAPDH (Fig. 5), while in cancer cell lines, GAPDH demonstrated high stability (Fig. 4). GAPDH is one of the most popular and widely used reference genes. The primary but not the only role of GAPDH in a cell is the enzymatic conversion of glyceraldehyde-3-phosphate to 1,3-biphosphoglycerate in the glycolysis cascade, a step required for glucose metabolism [45]. Barber et al. [46] conducted a comprehensive study concerning GAPDH stability in 72 human non-malignant tissues. They found that the expression of GAPDH was highly variable between tissues, which is consistent with our data. According to Barber et al. [46], the expression of GAPDH differed by a maximum of 15-fold between the highest and lowest expression in skeletal muscle and breast tissue types, respectively. However, in some tissues, such as the nervous system, no significant variation was observed [46].
In cancer cell lines, the most unsuitable gene for normalisation was HPRT1 (Fig. 4). The HPRT1 gene encodes hypoxanthine phosphoribosyltransferase 1, the enzyme involved in the synthesis of both guanine and inosine in a salvage pathway [47]. The unsuitability of HPRT1 as a normalisation control in cancer studies has been demonstrated. HPRT1 was found to be highly variable in cancer cells and malignant tissues originating from patients with lung, colon, prostate and pancreatic cancer at both the mRNA and protein levels [48]. However, in some experimental models, HPRT1 may be chosen as a suitable reference [49].
We did not find any relation between the expression level (observed Cqs, Fig. 2) and the reference gene stability rankings. For example, 18S was the most stable, and GAPDH was the least stable in the MSCs, although both of them were highly expressed. In the cancer cell lines, POP4 and GAPDH are stably expressed, but POP4 is one of the lowest-expressed genes. Thus, the expression level should not be considered when selecting reference genes for RT-qPCR.
If we compare housekeeping gene stability values obtained by all four algorithms in cancer versus non-malignant mesenchymal cells, the values are significantly higher in the cancer cell group. The differences in gene expression in cancer cells are difficult to predict, as in some cases, gene expression can be noticeably different even in the same type of cancer due to differences in the amount of transcripts of certain genes [4]. In contrast, the housekeeping gene expression of MSCs from different tissues was highly homogeneous (Fig. 5).
To visualise the effect of the normalisation strategy on the RT-qPCR results, we normalised the relative expression of the EGFR gene by the three most-stable or three least-stable reference genes in the entire panel of cell lines (Fig. 6). Using optimal normalisation strategy, we found that EGFR mRNA was increased in A431 and decreased in the MCF-7 and SK-UT1-B cell lines compared to HeLa. However, in the case of normalisation to three unstable reference genes (HPRT1, RPL13A, B2M), no differences between these cell lines in the EGFR mRNA content were detected. Instead, a false elevated EGFR gene expression was found in the SK-BR-3 cell line, cells that are known to express a low level of EGFR [50].
Our data are in accordance with previous published data on EGFR protein expression in these cell lines [51, 52]. Epidermal growth factor receptor, encoded by the EGFR gene, is one of the key growth factor receptors, involved in the control of cell growth, maintenance, proliferation and migration. EGFR disturbances, such as mutations and EGFR overexpression, are often observed in cancer cells and appear to be one of the reasons for cancer progression. One of the well-known examples of cancer cell lines with overexpressed EGFR is the human epidermoid carcinoma cell line A431. A431 cells are characterized by the amplification (up to 110 times) of the EGFR gene, elevated mRNA and protein level. EGFR protein levels have been found to be 2–100 times elevated above that present in normal fibroblasts [53]. Our data reflected these alterations and large differences in EGFR expression within cancer cell panel. Moreover, our data are in accordance with previously obtained results concerning EGFR protein content in MSCs, which is similar within different MSCs and comparable to EGFR levels in HeLa cells [52]. Thus, using geometric averaging of the expression data for several reference genes without checking the stability of the wide panel of candidate genes could lead to a misinterpretation of RT-qPCR results.
It should be noticed that our data are limited to analysed cell lines, as reference gene expression might differ in another cell types or experimental conditions. According to different estimations, about 3000–7000 genes have been defined as housekeeping genes (i.e., those that are ubiquitously expressed in all tissue/cell types; involved in maintenance of basal cellular functions) [54]. At present, it is obvious that no universal reference genes exist for RT-qPCR analysis. However, the accumulated information from many studies, including this one, may narrow the list of potential candidate genes and ease the choice of suitable reference genes for certain experimental tasks, conditions and biological materials (cells/tissues) used. Nevertheless, the reference gene stability should be validated for each experimental model.
Our results emphasise that different reference genes should be used in RT-qPCR studies depending on the cell types. We showed that the POP4 and EIF2B1 genes are the most suitable among housekeeping genes tested for the entire panel of cells, while POP4 and GAPDH could be the reference genes of the best choice for cancer cells, and 18S and B2M for non-malignant MSCs. We showed that housekeeping gene expression in MSCs is more homogeneous than in cancer cell lines. Additionally, we validated our choice of reference genes by comparing EGFR gene expression normalised to the three most-stable (POP4, EIF2B1, YWHAZ) versus the three most-variable (HPRT1, RPL13A, B2M) housekeeping genes according to RefFinder ranking. The results of the present study could be helpful for the design of the experiments using the aforementioned cell lines. However, it should also be noted that even when the same cell lines are analysed under new experimental conditions, such as treatment with different pharmacological agents, hypoxia, oxidative stress, epigenetic modifications, etc., the optimal reference genes should be independently verified. Our research aims to facilitate the selection of a subset of suitable reference genes for RT-qPCR analysis from the wide panel of cell lines frequently used as pathological or normal models in various fundamental studies.
MSC, mesenchymal stromal cells; RT-qPCR, real-time reverse transcription quantitative polymerase chain reaction; EGFR, epidermal growth factor receptor.
All data reported in this paper will be shared by the Vera Kosheverova upon reasonable request.
VK and AS designed the research study. VK, AS and RK performed the research. VK, AS, EK and MK analyzed the data. VK wrote the first draft of manuscript. EK reviewed and edited the first draft of the manuscript. EK managed the research project and acquired funding. All authors contributed to editorial changes in the manuscript. All authors read and approved the final manuscript. All authors have participated sufficiently in the work to take public responsibility for appropriate portions of the content and agreed to be accountable for all aspects of the work in ensuring that questions related to its accuracy or integrity.
Not applicable.
We are grateful to the shared research facility “Vertebrate cell culture collection” for providing the cell lines.
This research was funded by the Russian Science Foundation grant #23–14–00335.
The authors declare no conflict of interest.
Supplementary material associated with this article can be found, in the online version, at https://doi.org/10.31083/j.fbs1604026.
References
Publisher’s Note: IMR Press stays neutral with regard to jurisdictional claims in published maps and institutional affiliations.