


 , Questan Ali Ameen 4, Ahmed Sami Shaker 5, Rana Mohammed Al-Obaidi 6, Darren K. Griffin 2,3
1 L. K. Ernst Federal Research Centre for Animal Husbandry, Dubrovitsy, 142132 Podolsk, Moscow Oblast, Russia
2 School of Biosciences, University of Kent, CT2 7NJ Canterbury, Kent, UK
3 Animal Genomics and Bioresource Research Unit (AGB Research Unit), Faculty of Science, Kasetsart University, 10900 Chatuchak, Bangkok, Thailand
4 Department of Animal Science, College of Agricultural Engineering Sciences, University of Sulaimani, 46001 Sulaymaniyah, Iraq
5 Medical Laboratory Technology, Al-Qalam University College, 820102 Kirkuk, Iraq
6 Department of Basic Sciences, College of Dentistry, University of Sulaimani, 46001 Sulaymaniyah, Iraq
Abstract
The Japanese quail (Coturnix japonica) is a small migratory bird whose main habitats are located in East Asia, Russia, China, Japan, Korea, and India. The Japanese quail was first introduced into the Iraqi research sector in the early 1980s. This investigation aimed to identify the genetic divergence between the available genetic lines of the Japanese quail in Iraq as a first step to conducting further conservation and breeding, benefiting from studying the genetic diversity related to productivity, adaptation, and immune susceptibility.
In this study, we harnessed the random amplified polymorphic DNA (RAPD)-polymerase chain reaction (PCR) protocol to investigate the genetic structure, diversity, and differentiation of seven distinct genetic lines of these birds with white, brown, wild grey, and yellow plumage guided by 20 molecular genetic markers.
Our findings showed a relatively high polymorphism level of these 20 markers, which was adequate for describing genetic variation within and between the quail lines under study. Overall, the pairs of the White male and Brown male, Brown female and Grey male, and Grey female and Grey male lines were the most genetically distant. Conversely, the White male and Grey male lines were the most similar.
The genetic differences established between these lines can enable us to suggest recommendations for further conservation genetics and breeding of this species. In particular, we propose that choosing animals (lines) with the greatest genetic distances, i.e., the least genetic similarities, can help preserve the highest genetic variability within the population. This proposed approach mirrors many contemporary conservation strategies, and information derived directly from this study can potentially be used to improve breeder selection regimes for additional conservation initiatives ex situ.
Keywords
- Japanese quail
- Coturnix japonica
- conservation genetics
- breeding
- lines
- molecular genetic markers
- RAPD-PCR
- genetic diversity
The Japanese quail (Coturnix japonica Temminck & Schlegel 1848) is a small migratory galliform bird, wild populations of which are primarily found in East Asia and Russia but also can be located in China, Japan, Korea, and India [1, 2, 3]. While resident populations may spend the winter in Japan, most migrate south to places such as Vietnam, Cambodia, Laos, and southern China [4]. Furthermore, the Japanese quail habitat covers much of Africa, including Tanzania, Malawi, Kenya, Namibia, Madagascar, and the Nile River Valley region stretching from Kenya to Egypt [3]. The breeding locations are mostly concentrated in East and Central Asia [1, 2], specifically in Manchuria, southeastern Siberia, northern Japan, and the Korean Peninsula. Moreover, the Japanese quail has also been noted to breed in Turkey and other parts of Europe [3]. The bird is called by different names, such as “quail” in English-speaking nations, “marai” in Iraq, or “ferry” in Syria, depending on the geographic region. Japanese quail birds are characterized by their small body size, not exceeding 20 cm3 [5]. The body weight of mature ad libitum-fed males ranged from 190 to 250 g and that of females from 225 to 300 g [6]. These quails are adaptable to different environmental conditions and have high variability in shape and phenotypic traits such as plumage color and performance (egg production and meat yield) [7, 8, 9]. Both sexes are tailless, with wild females distinguished by light and tan feathers with black dots in the throat and upper chest areas, whereas males are grey with a brown neck area [10]. The current conservation status of Japanese quail in the wild is classified as “Near Threatened” [11].
Coturnix japonica was first domesticated in Japan in the 12th century [12] primarily because of the males’ ability to emit a beautiful call [13]. Intensive production of this species did not begin in Japan until the 1920s, when the first egg breeds were developed through selection. From Japan, they were successfully introduced into America, Europe, and the Middle East in the 1930s, 1940s, and 1950s, when specific lines were bred for egg and meat production [12, 14, 15]. Subsequently, the modern commercial Japanese quail is characterized by several economically important traits, including rapid growth [16, 17]. Additionally, commercial Japanese quail exhibits a high egg-laying rate [12, 18]; these birds can lay up to 350 eggs annually. Given that these eggs weigh 10–12 g, these remarkable animals produce around 20 times their body weight yearly [19]. Japanese quails have lower feed and space requirements than other domestic birds [20], and all these traits combine to promote a prolific dual-purpose domestic bird in terms of both egg and meat production [12, 21, 22]. Being a photoperiodic avian species, Coturnix japonica is also an excellent model for studies on reproductive physiology, particularly for studying the mechanisms through which egg formation and laying occur [23, 24, 25].
In the early 1980s, Japanese quails were introduced into the research sector of Iraq, with four major genetic varieties predominating and classified based on their feather color, i.e., white, brown (Fig. 1A,B), wild grey (Fig. 1C,D, Ref. [26]) , and yellow. These quails are subject to conservation and multilateral investigations. Numerous studies have addressed the productive traits of these lines to characterize the qualitative and quantitative characteristics associated with eggs [27, 28, 29, 30, 31], growth, and carcasses [32, 33]. In addition, the gene pool lines of these quails have been used as a model for poultry nutritional research [34, 35, 36, 37] and for immunological selection [37, 38].
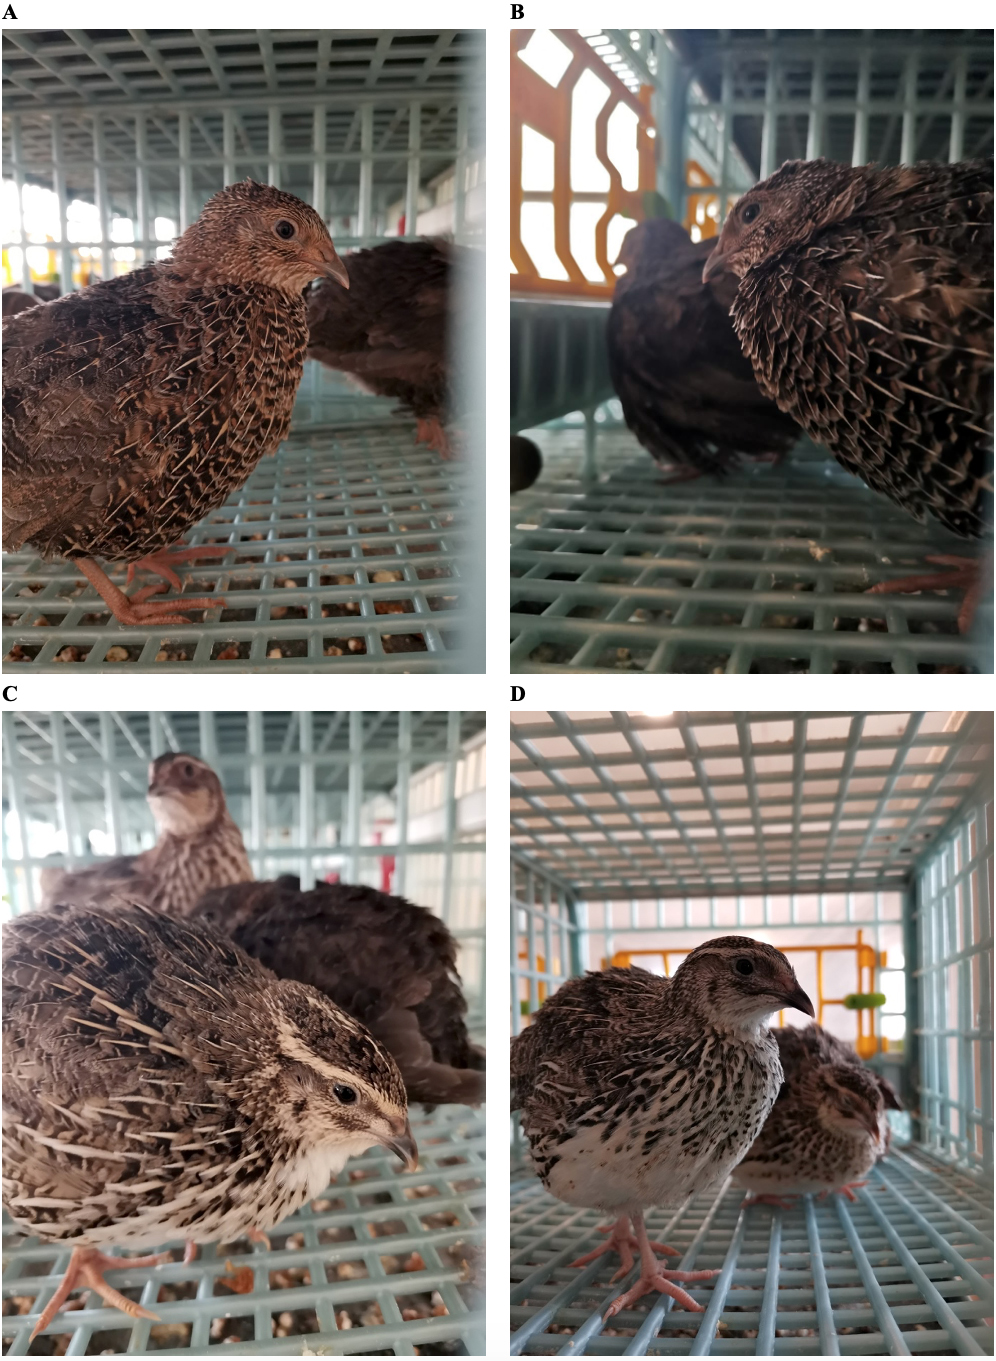 Fig. 1.
Japanese quail genetic lines of two studied feather color varieties. Brown: (A) male (paternal) and (B) female (maternal) lines. Grey: (C) male (paternal) and (D) female (maternal) lines. The Grey male and female lines have the wild-type plumage color and pattern, while the Brown male and female lines represents the extended brown mutant allele at the E (extension) locus controlled by the MC1R gene [26]. Image source: authors’ photographs.
Molecular genetic markers are widely used in conservation genetics [39, 40, 41, 42, 43, 44]. In particular, the random amplified polymorphic DNA (RAPD)-polymerase chain reaction (PCR) analysis method is broadly implemented for molecular characterization of species and populations, biodiversity evaluation, genotoxic, and other related studies (e.g., [45, 46]). For example, using multilocus and dominant RAPD markers, Romanov and Weigend [47] assessed the genetic diversity of several German and Ukrainian chicken populations, while Dehghanzadeh et al. [48] evaluated genetic variability and distances among five Iranian native chicken populations. Abdulrazaq and Ameen [49] investigated genetic relationships between local guinea fowl, Japanese quail, and chicken populations using the RAPD-PCR technique. This method was also instrumental in defining genetic variation among other local quails [50], phenotypic quail groups of different feather colors [51], selected Japanese quail lines [52], and those improved for meat and egg production traits [53].
This study aimed to explore the genetic structure, diversity, and differentiation of seven Iraqi quail genetic lines with white, brown, wild grey, and yellow feather colors using a set of 20 molecular genetic markers based on the RAPD-PCR protocol. These lines are intended to further produce highly productive interline crosses, with their genetic characterization paramount in developing effective germplasm conservation and breeding strategies.
This experiment was conducted at the Poultry Breeding Unit of the Teaching and Research Farm of the Animal Science Department, College of Agricultural Engineering Sciences, University of Sulaimani, Iraq. Seven genetic lines of Japanese quail, both paternal (male) and maternal (female), were used as follows: white male (WM), white female (WF), brown male (BM; Fig. 1A), brown female (BF; Fig. 1B), grey male (GM; Fig. 1C), grey female (GF; Fig. 1D), and yellow female (YF). These lines have been bred as closed populations for ten generations and are planned for use in interline crossing. The healthy birds were kept in large commercial cages, which allowed for free movement, and had ad libitum access to feed and water (Fig. 1). All conditions for quail comfort environment, maintenance, and feeding were observed in accordance with the generally accepted standards for quail rearing [54, 55, 56].
Blood samples from wing veins were collected from each genetic line. Five males and five females from each line were sampled, with no euthanasia or anesthesia methods used because this conventional blood sampling procedure in birds do not require any euthanasia or anesthesia. Collected blood samples were stored at –20 °C. Genomic DNA extraction from these samples was conducted using a Zymo Research kit (Orange, CA, USA). Samples for each sex of each genetic line were pooled separately into a single sample. These samples were pooled because we deduced that since each line has been bred for more than 10 generations as closed populations, the individuals within one line were genetically very close. Therefore, creating one pooled sample was not predicted to affect the results and compromise the estimation and interpretation of the observed genetic diversity.
The protocol of the RAPD-PCR procedure was as follows: 5 µL of de-ionized water was added to a PCR tube and then supplemented with 8 µL master mix, 2 µL RAPD primer, and 5 µL of extracted DNA (with the final concentration of 35 ng/µL). Amplification was carried out in a thermal cycler using the following conditions: initial denaturation at 94 °C for 9 min, followed by 35 cycles, including denaturation at 94 °C for 1 min; annealing, according to the primer’s annealing temperature (Table 1), for 1 min; extension at 72 °C for 2 min); final extension at 72 °C for 9 min. For random amplification of DNA fragments, 20 RAPD primers (OPA-01 to OPA-20; Operon Technologies, Alameda, CA, USA; Table 1) were selected based on our preliminary studies [49, 50]; these primers were tested, validated, and used in subsequent genetic diversity analyses.
| Primer ID | Primer nucleotide sequence | Tm (°C) | (G+C)% | PIC | Band number | Band percentage | Size of fragment (bp) |
| OPA-01 | CAGGCCCTTC | 41 | 70 | 0.290936 | 15 | 6 | 100–1000 |
| OPA-02 | TGCCGAGCTG | 38 | 70 | 0.375510 | 6 | 2.4 | 100–1000 |
| OPA-03 | AGTCAGCCAC | 41 | 60 | 0.155844 | 20 | 8 | 160–1300 |
| OPA-04 | AATCGGGCTG | 34 | 60 | 0.418367 | 23 | 9.2 | 600–1200 |
| OPA-05 | AGGGGTCTTG | 41 | 60 | 0.277551 | 19 | 7.6 | 500–3000 |
| OPA-06 | GGTCCCTGAC | 41 | 70 | 0.340936 | 12 | 4.8 | 200–1300 |
| OPA-07 | GAAACGGGTG | 30 | 60 | 0.299320 | 5 | 2 | 400–2500 |
| OPA-08 | GTGACGTAGG | 36.9 | 60 | 0.103401 | 7 | 2.8 | 300–1000 |
| OPA-09 | GGGTAACGCC | 41 | 70 | 0.341950 | 13 | 5.2 | 500–2000 |
| OPA-10 | GTGATCGCAG | 36.9 | 60 | 0.341950 | 13 | 5.2 | 400–600 |
| OPA-11 | CAATCGCCGT | 58.6 | 60 | 0.336143 | 30 | 12 | 780–2100 |
| OPA-12 | TCGGCGATAG | 32 | 60 | 0.400000 | 9 | 3.6 | 450–2800 |
| OPA-13 | CAGCACCCAC | 36 | 70 | 0.340936 | 5 | 2 | 500–1400 |
| OPA-14 | TTCGAGCCAG | 34 | 60 | failed | |||
| OPA-15 | TTCGAGCCAG | 34 | 60 | failed | |||
| OPA-16 | AGCCAGCGAA | 32 | 60 | 0.308390 | 16 | 6.4 | 300–1700 |
| OPA-17 | GACCGCTTGT | 30 | 60 | failed | |||
| OPA-18 | AGGTGACCGT | 36.9 | 60 | 0.371882 | 27 | 10.8 | 130–1500 |
| OPA-19 | CAAACGTCGG | 32 | 60 | 0.097959 | 6 | 2.4 | 550–2300 |
| OPA-20 | GTTGCGATCC | 32 | 60 | 0.383673 | 24 | 9.6 | 400–1600 |
| Total | 250 | ||||||
| Average |
0.304985 |
14.7 | |||||
Tm (°C), primer melting (annealing) temperature; (G+C)%, guanine–cytosine content percentage; RAPD, random amplified polymorphic DNA; PIC, polymorphic information content.
Post amplification, electrophoresis was performed using a 1.5% agarose gel for PCR product visualization. The visualized electrophoresis results were imported into GenAlEx 6.5 (The Australian National University, Acton, Australia) [57, 58] for subsequent band calling and fragment analysis.
Using the GenAlEx 6.5 software package [57, 58], the following genetic variation indicators were subsequently computed or detected: polymorphic information content (PIC) [59], observed number of alleles (Na; calculated as presence or absence of a band), effective number of alleles (Ne) [60], Nei’s gene diversity [61], or heterozygosity (H), and Shannon’s information index (I) [62]. The genetic distance and identity matrices for the seven genetic lines of quails were computed according to Nei [63, 64], respectively, and an Unweighted Pair-Cluster Method using Arithmetic Averages (UPGMA) dendrogram was constructed to infer the genetic differentiation between the lines.
After twenty primers were randomly screened for DNA polymorphism validation,
seventeen were used for further RAPD-PCR analysis, producing different fragment
patterns with various bands. Three markers (OPA-14, OPA-15, and OPA-17) failed to
amplify and showed no band results for these genetic lines. A total of 250 RAPD
bands were detected based on all RAPD pattern analyses of the seven Japanese
quail genetic lines examined. Table 1 shows the number and percentage of
polymorphic bands presented. The count of bands amplified using these primers
varied from a minimum of 5 (OPA-07) to a maximum of 30 (OPA-11), while the
average band number was 14.7
Regarding polymorphic information content (PIC), its range across the 17 markers
was from 0.097959 to 0.418367, with the average PIC value equal to 0.304985
As shown in Table 2, the average number of alleles (Na) was 2.00 because every anonymous RAPD locus was considered for two states of a band, i.e., its presence or absence. However, the effective number of alleles (Ne) ranged between 1.6897 and 1.9600. The highest Ne value estimated for each of the 12 markers (OPA-1, OPA-2, OPA-3, OPA-4, OPA-6, OPA-7, OPA-9, OPA-10, OPA-11, OPA-13, OPA-16, and OPA-19) was 1.9600. The heterozygosity (H) was lowest for five markers (OPA-05, OPA-08, OPA-12, OPA-18, OPA-20) and equaled 0.4082. The Shannon information index (I) reflected a similar pattern of highest and lowest values across the 17 genetic markers, with the minimum value being 0.5983 and the maximum value being 0.6829.
| Marker locus | Sample size | Na | Ne | H | I |
|---|---|---|---|---|---|
| OPA-01 | 70 | 2.0000 | 1.9600 | 0.4898 | 0.6829 |
| OPA-02 | 70 | 2.0000 | 1.9600 | 0.4898 | 0.6829 |
| OPA-03 | 70 | 2.0000 | 1.9600 | 0.4898 | 0.6829 |
| OPA-04 | 70 | 2.0000 | 1.9600 | 0.4898 | 0.6829 |
| OPA-05 | 70 | 2.0000 | 1.6897 | 0.4082 | 0.5983 |
| OPA-06 | 70 | 2.0000 | 1.9600 | 0.4898 | 0.6829 |
| OPA-07 | 70 | 2.0000 | 1.9600 | 0.4898 | 0.6829 |
| OPA-08 | 70 | 2.0000 | 1.6897 | 0.4082 | 0.5983 |
| OPA-09 | 70 | 2.0000 | 1.9600 | 0.4898 | 0.6829 |
| OPA-10 | 70 | 2.0000 | 1.9600 | 0.4898 | 0.6829 |
| OPA-11 | 70 | 2.0000 | 1.9600 | 0.4898 | 0.6829 |
| OPA-12 | 70 | 2.0000 | 1.6897 | 0.4082 | 0.5983 |
| OPA-13 | 70 | 2.0000 | 1.9600 | 0.4898 | 0.6829 |
| OPA-16 | 70 | 2.0000 | 1.9600 | 0.4898 | 0.6829 |
| OPA-18 | 70 | 2.0000 | 1.6897 | 0.4082 | 0.5983 |
| OPA-19 | 70 | 2.0000 | 1.9600 | 0.4898 | 0.6829 |
| OPA-20 | 70 | 2.0000 | 1.6897 | 0.4082 | 0.5983 |
| Mean |
70 |
2.0000 |
1.8805 |
0.4658 |
0.6580 |
The genetic distance matrix computed according to Nei [63] is presented in Table 3. The genetic distance matrix shows that the longest genetic distance (1.447) was observed between the BM and WM, BF and GM, and GM and GF lines, while the shortest one (0.194) was found between the GM and WM lines.
| Line | WM | WF | BM | BF | GM | GF | YF |
| WM | 0 | ||||||
| WF | 0.435 | 0 | |||||
| BM | 1.447 | 1.042 | 0 | ||||
| BF | 1.224 | 0.636 | 0.531 | 0 | |||
| GM | 0.194 | 0.348 | 0.887 | 1.447 | 0 | ||
| GF | 1.224 | 1.224 | 0.531 | 0.636 | 1.447 | 0 | |
| YF | 0.887 | 0.636 | 1.042 | 0.435 | 1.042 | 0.636 | 0 |
Lines tested: WM, White male; WF, White female; BM, Brown male; BF, Brown female; GM, Grey male; GF, Grey female; YF, Yellow female.
The pairwise matrix of Nei’s genetic identity [64] is presented in Table 4. Moderate to high levels of genetic identity were estimated. The highest identity estimation (0.824) was found between the WM and GM lines, while the lowest (0.235) was between the WM and BM, BF and GM, and GM and GF lines. This between-line similarity pattern agreed with the calculated pairwise genetic distance values, given that, in principle, genetic distance is largely an inverted (by numeric value) indicator of genetic identity (similarity).
| Line | WM | WF | BM | BF | GM | GF | YF |
| WM | 0 | ||||||
| WF | 0.647 | 0 | |||||
| BM | 0.235 | 0.353 | 0 | ||||
| BF | 0.294 | 0.529 | 0.588 | 0 | |||
| GM | 0.824 | 0.706 | 0.412 | 0.235 | 0 | ||
| GF | 0.294 | 0.294 | 0.588 | 0.529 | 0.235 | 0 | |
| YF | 0.412 | 0.529 | 0.353 | 0.647 | 0.353 | 0.529 | 0 |
Lines tested: WM, White male; WF, White female; BM, Brown male; BF, Brown female; GM, Grey male; GF, Grey female; YF, Yellow female.
The UPGMA dendrogram in Fig. 2 was generated based on the RAPD-PCR analysis using the seven genetic lines of Japanese quail to restore the between-line genetic relationships and visualize the respective line differentiation. The first large dendrogram cluster consisted of the WM, GM, and WF lines, and the second major cluster included the BM, GF, BF, and YF lines.
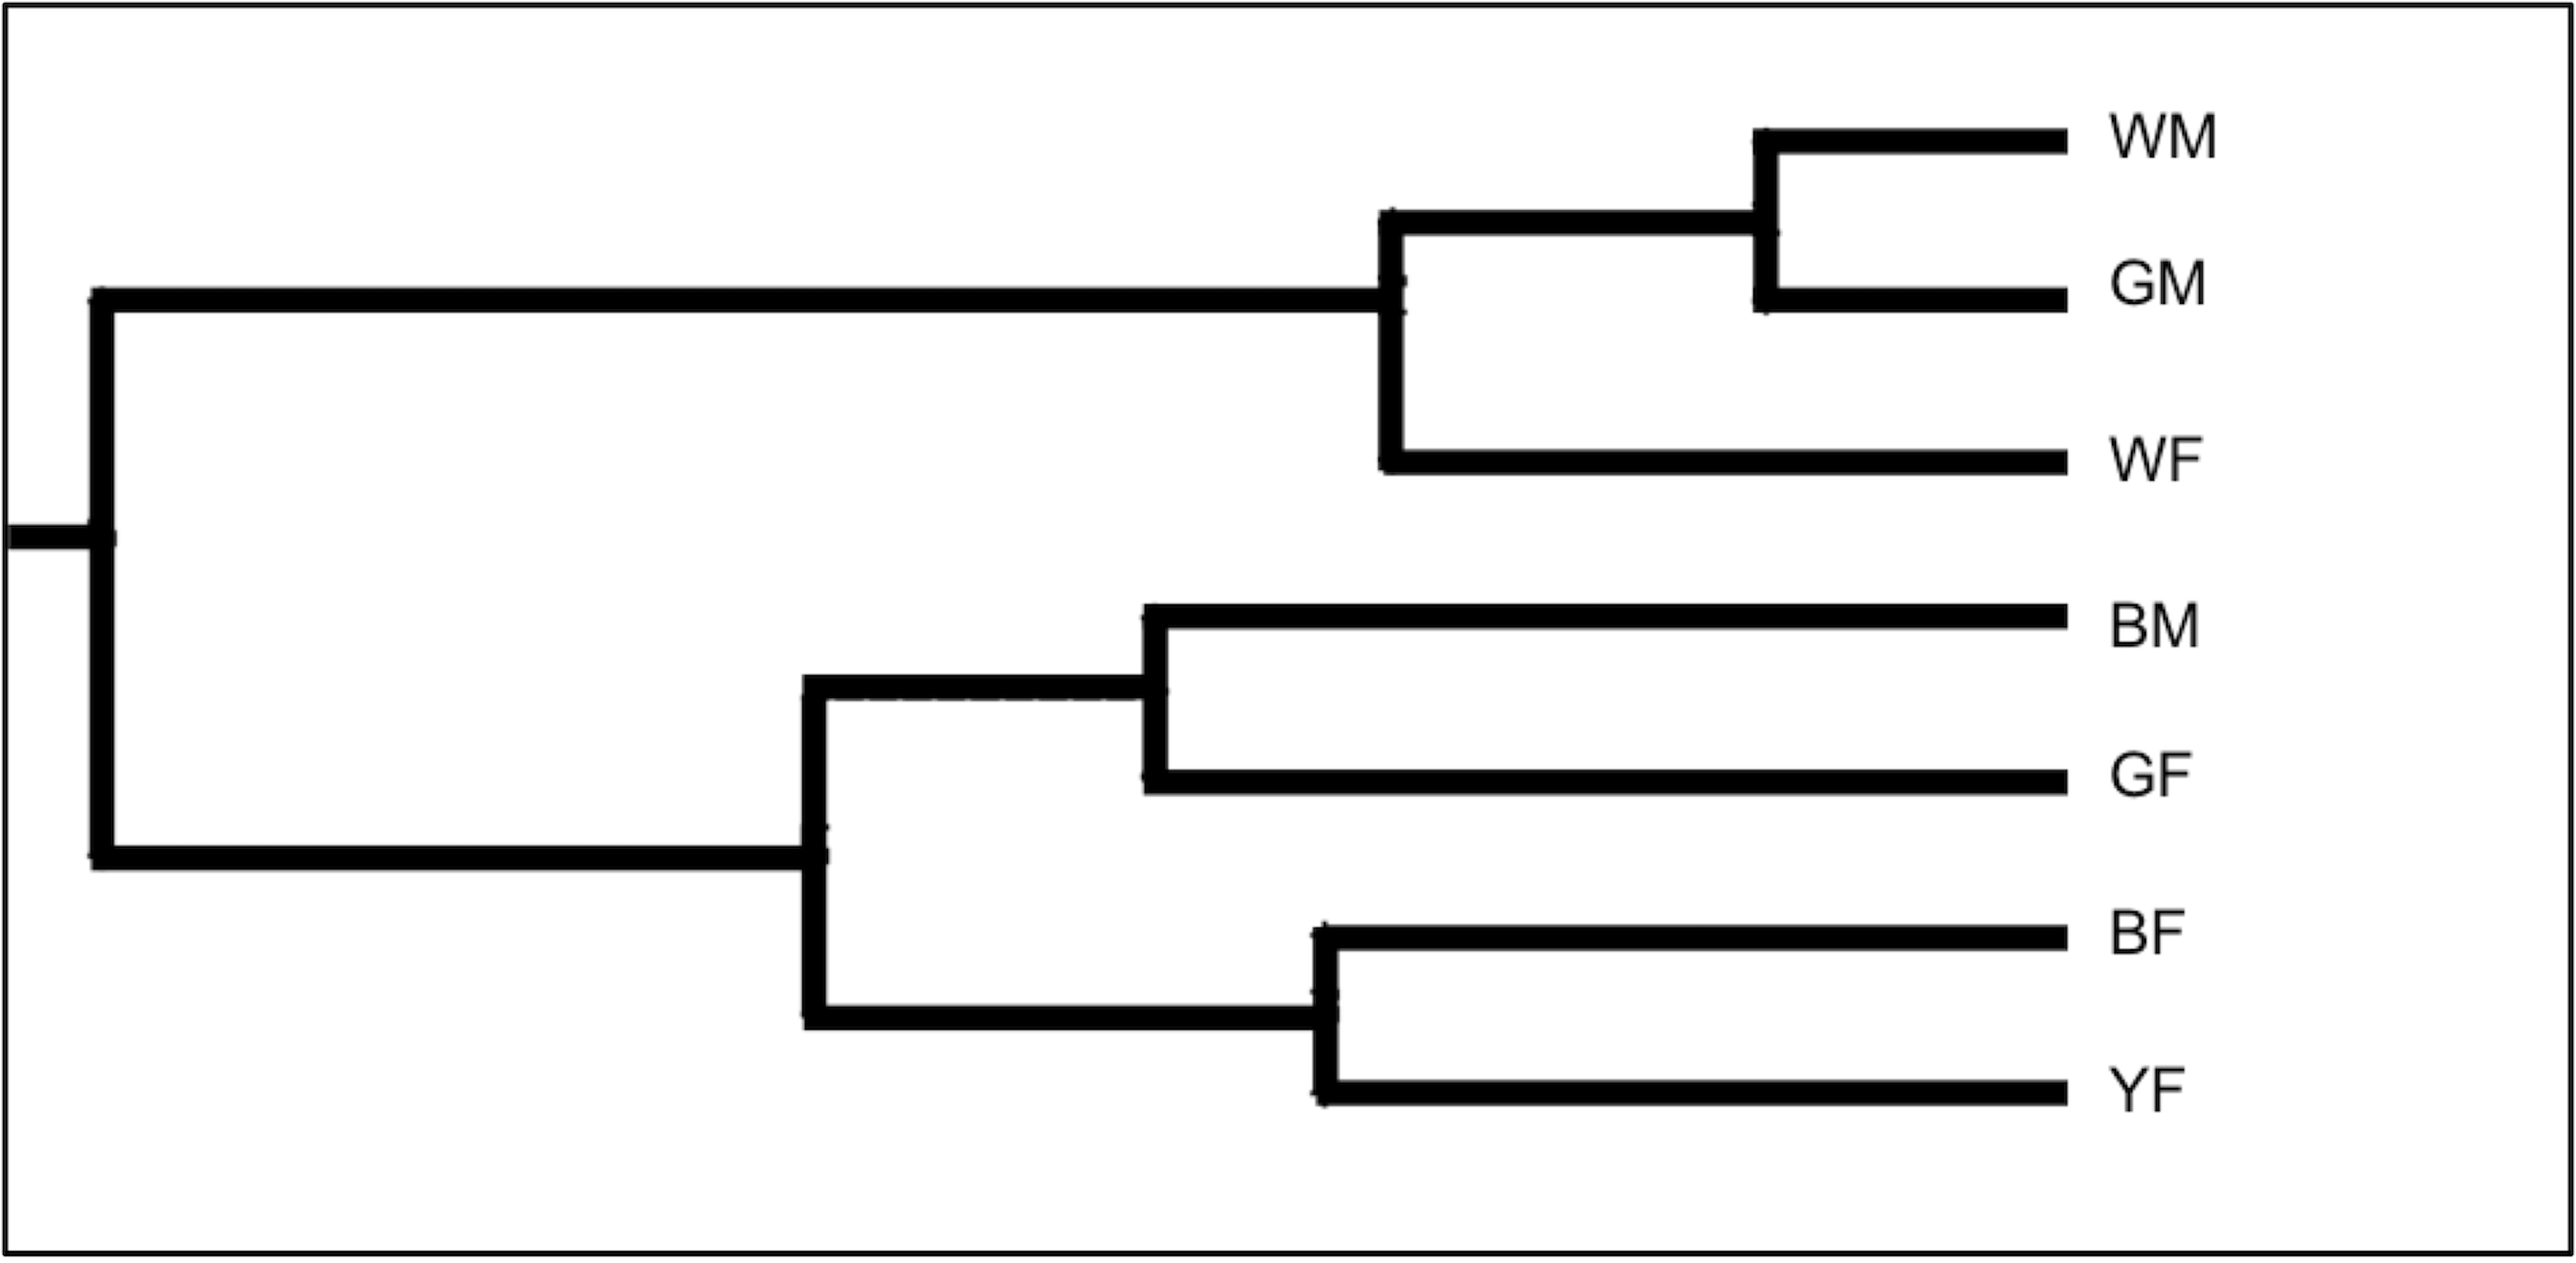 Fig. 2.
The Unweighted Pair-Cluster Method using Arithmetic Averages (UPGMA) dendrogram derived from the genetic relationship analysis among the seven lines of Japanese quail based on the RAPD primers. Lines tested: WM, White male; GM, Grey male; WF, White female; BM, Brown male; GF, Grey female; BF, Brown female; YF, Yellow female.
Conservation and breeding of different plumage color lines of quail are pivotal for further progress in quail production [65, 66]. A good strategy to increase quail marketing potential and consumer interest is to provide value-added meat, eggs, or live birds representing distinct color lines in their plumage [67, 68]. The color of the plumage or the related genetic variation might significantly impact the quality of the quail’s meat and eggs [65, 66]. In particular, Al-Kafajy et al. [65], when comparing three quail lines of different plumage colors, established that the brown line demonstrated significantly higher values for body weight, albumen height, shell thickness, and carcass dressing traits than other lines. Moreover, the white line had significantly higher egg numbers, shell and yolk weights, and carcass characteristics (heart, thigh, breast, and back weights). When examining egg traits in three color lines, Petek et al. [66] revealed that the black line had significantly greater egg weight, strength, and shell thickness, whereas the white line had significantly lower egg length, higher shape index, and lighter yolk. Similar observations were made by Shaker et al. [69] for genetic groups of Kurdish local chickens, suggesting that the plumage color can affect the egg weight and other egg characteristics. Shaker and co-authors concluded that the statistically significant differences in egg weight and traits such as egg length, breadth, and shape index across the genetic groups might be attributed to their genetic makeup, which requires further characterization of these groups using molecular markers [69].
The current study aimed to explore genetic diversity among seven genetic lines of Japanese quail that were originally classified according to the specific color of their plumage. For this purpose, we employed the commonly used polymorphic molecular genetic markers based on the conventional RAPD-PCR primers. Our data demonstrated a rather high polymorphism level related to these markers that was sufficient to characterize the genetic variation within and between the studied quail lines. For instance, considering the established PIC values, one should note that this is a measure implemented in genetic investigations to assess marker quality that has values ranging from 0 (monomorphic) to 1 (very informative) [70]. Furthermore, PIC is crucial for choosing markers for genetic research since it assesses a marker’s informativeness and capacity to identify polymorphisms and forecasts the likelihood that the marker’s heterozygous genotype will be passed on to the progeny [70, 71, 72]. PIC values below 0.25 are not advised, while those between 0.25 and 0.50 are implied to be moderately informative and rather useful [70]. In this study, most used RAPD markers (14 primers) had PIC values above 0.28, and only three had lower values (below 0.16). This suggests that this set of markers was reasonably informative and reflected an adequate overall polymorphism estimate and a more or less true status of genetic diversity among the quail lines studied. Similar conclusions regarding these polymorphic markers and the genetic diversity of the lines can be drawn from the values obtained for Ne, H, and I. Similar to many previous biodiversity conservation studies (e.g., [73]), if, for example, the Shannon diversity values were consistently lower, this would indicate a decline in local bird diversity when abundances were considered. Obviously, this was not the case in our study.
As determined by other RAPD studies (see review [47]), this molecular marker type has some possible limitations, including inconsistent repeatability of strong bands, challenges in evaluating weak bands, and lower reproducibility of results. To overcome these potential restrictions, it is recommended to use precisely regulated PCR settings and DNA template quality as we did in the present study. Nonetheless, RAPD markers are still very quick and inexpensive molecular tools that can characterize genetic variation within and between breeds at an initial level [47].
Over recent years, several studies have been conducted in the region to determine the genetic diversity and classification of these Iraqi quail lines. Al-Neemy et al. [51] studied the genetic diversity of three genetic lines (white, black, and brown) using nine RAPD markers. The relationship between these genetic lines was similar to that observed in our study. Lajan and Al-Barzinji [74] examined three genetic lines (wild grey, white, and brown) and, using RFLP-PCR markers at three genetic loci, showed that the studied gene sites contained several alleles with different nucleotide compositions. However, both the previous studies and our current study could have been more concordant with regard to the revealed genetic differentiation in the analyzed quail lines. This lack of concordance may be due to how these lines were selected for phenotypic traits and what their genetic makeup determinants were, thus causing an output that differed in the genetic characterization of the Japanese quail in other studies. Ahmed and Al-Barzinji [50], in an experiment using 20 RAPD markers and the genetic lines of Japanese quail of three different colors (desert, brown, and white), also found that the number of fragments obtained was 310, with their size ranging from 250 to 2800 bp. The established average Nei’s gene diversity between the lines was 0.1026, and the highest genetic distance (27.614) was identified for the BF line relative to both the WF and Desert female lines. Our study demonstrated a higher mean value of H (0.4658), whereas the greatest genetic distances were found between the following three line pairs: BM–WM, BF–GM, and GM–GF (Table 3). It should be acknowledged that it is difficult to make direct, plausible comparisons of results across studies, given that they used different sets of genetic lines and markers.
Overall, our findings showed that, when employing molecular markers using the RAPD-PCR procedure, it was feasible to successfully assess the genetic diversity within the local genetic quail lines and the genetic relationship among the lines. This information will be important for further conservation and breeding of these lines. However, to avoid potential drawbacks of using the RAPD-PCR protocol, more sophisticated genetic markers such as microsatellites and single nucleotide polymorphisms (SNPs) [75, 76, 77, 78, 79, 80] will need to be harnessed in future studies. Regarding the conservation strategies inferred from these genetic studies, we believe that selecting animals with the least genetic similarity, i.e., with the greatest genetic distances, can help conserve the maximum variability within a total population. Moreover, this selection approach can even optimize the choice of breeders for further conservation programs ex situ [81]. According to the dendrogram analysis (Fig. 2) based on the pairwise comparison (Table 3), we established the greatest genetic distances between the line pairs BM–WM, BF–GM, and GM–GF that reflect the pronounced evolutionary relationships between these lines due to genetic divergence in the course of their breeding. Regarding the connection between genetic findings and practical breeding applications, more genetic improvement can result from advances in molecular genetics than phenotypic information alone. This is because markers connected to genes of interest could provide advantages over utilizing information at the DNA level. The application of genetic markers to identify genes or genomic areas that regulate traits of interest—known as quantitative trait loci (QTLs)—is also made possible by developments in molecular genetics. Furthermore, marker-assisted selection (MAS) could use the identified QTLs to promote genetic advancement [82, 83].
The future growth and competitiveness of commercial quail breeding mostly depend on genetic research, conservation, and utilization of lines and crosses with high productivity and adequate variability [84, 85, 86, 87]. Therefore, it is hardly practicable to carry out efficient selection work intended to locate and identify desirable quail genotypes without conservation measures. Future research on the conserved gene pool genetic resources of quail should use cutting-edge, whole-genome techniques that employ SNP markers [88, 89, 90]. This will contribute to understanding key physiological and molecular genetic processes involved in developing and expressing selectively significant traits in quail.
A well-known member of the Coturnix genus, Coturnix japonica, is commercially exploited worldwide for its nutritional meat and eggs [91]. Apart from the original Coturnix line, small flocks of mutant or crossbred birds with plumage color variants are being raised for various purposes [92, 93]. Here, using the RAPD-PCR markers, we examined seven genetic lines of different feather colors with respect to their genetic diversity indicators (PIC, Na, Ne, H, and I). This study also revealed the genetic distances between the seven quail lines of distinct colors. Our findings suggest that these lines possess sufficient genetic variety to promote genetic advancements that can bring these lineages closer together. Breeders can utilize these results to improve their understanding of the genetic variability in the local quails, providing critical information for developing the mating strategies of quails when crossing these quail lines.
From the current genetic research, we believe that the best conservation strategy would involve selecting animals (lines) with the greatest genetic distances from one another, i.e., the least genetic similarity, to preserve the highest amount of variability within an entire population. Further ex situ conservation programs may also benefit by selecting breeders more effectively.
Collectively, the obtained results will form the basis for developing more detailed strategies for preserving and using the genetic and breeding resources of Japanese quail [94]. Further development of MAS and genomic selection in quails looks promising. In general, the information presented in this study will be in demand in quail conservation and breeding projects to improve existing and create new promising lines and crosses of quails with specified economically important traits.
The datasets used and/or analyzed during the current study are available from the corresponding author on reasonable request.
MNR: Conceptualization, Formal Analysis, Project administration, Software, Validation, Visualization, Writing – original draft, Writing – review & editing. QAA: Conceptualization, Project administration, Funding acquisition, Methodology, Visualization, Writing – original draft, Writing – review & editing. ASS: Data curation, Funding acquisition, Resources, Writing – original draft, Writing – review & editing. RMAO: Formal Analysis, Investigation, Funding acquisition, Writing – review & editing. DKG: Validation, Supervision, Writing – review & editing. All authors have participated sufficiently in the work to take public responsibility for appropriate portions of the content and agreed to be accountable for all aspects of the work in ensuring that questions related to its accuracy or integrity. All authors read and approved the final manuscript.
Ethics standards were considered in all steps of performing procedures and animal handling as approved by the Iraq Ethical Approval No. um.VET.2021.5. This general ethics approval, issued in 2021, serves as a comprehensive guideline for research conducted across various colleges in Iraq. This approval is applicable as a broad framework for maintaining ethical standards in research. Additionally, the Ethic Committee of College of Agricultural Engineering Sciences, University of Sulaimani, issued the scientific research approval No. 6 on 14/1/2023 that states that “the Committee has approved and accepted to proceed with this research.” This approval was provided as a specific commitment to the ethical principles established in Iraq and adopted within the College. This adoption aligns with the rules outlined in the general ethics approval and ensures compliance with the specific requirements and circumstances within the University of Sulaimani.
Not applicable.
The research work conducted by Michael N. Romanov was supported by the Russian Science Foundation (Grant No. 24-16-00294, https://rscf.ru/prjcard_int?24-16-00294).
The authors declare no conflict of interest.
References
Publisher’s Note: IMR Press stays neutral with regard to jurisdictional claims in published maps and institutional affiliations.