


 , Maxim Ivenkov 1, Rostislav Gromov 1, Olga Bushueva 1,2,*
1 Laboratory of Genomic Research, Research Institute for Genetic and Molecular Epidemiology, Kursk State Medical University, 305041 Kursk, Russia
2 Department of Biology, Medical Genetics and Ecology, Kursk State Medical University, 305041 Kursk, Russia
Abstract
Disruptions in proteostasis are recognized as key drivers in cerebro- and cardiovascular disease progression. Heat shock proteins (HSPs), essential for maintaining protein stability and cellular homeostasis, are pivotal in neuroperotection. Consequently, deepening the understanding the role of HSPs in ischemic stroke (IS) risk is crucial for identifying novel therapeutic targets and advancing neuroprotective strategies.
Our objective was to examine the potential correlation between single nucleotide polymorphisms (SNPs) in genes that encode members of the Heat shock protein 90 (HSP90), small heat shock proteins (HSPB), and heat shock factors (HSF) families, and the risk and clinical characteristics of IS.
953 IS patients and 1265 controls from Central Russia were genotyped for nine SNPs in genes encoding HSP90AA1, HSFs, and HSPBs using the MassArray-4 system and probe-based polymerase chain reaction (PCR).
In smokers, SNP rs1133026 HSPB8 increased the risk of IS (risk allele A, odds ratio (OR) = 1.43, 95% Confidence Interval (CI) 1.02–2.02, p = 0.035), and rs556439 HSF2 increased the brain infarct size (risk allele A, p = 0.02). In non-smokers, SNPs rs4279640 HSF1 (protective allele T, OR = 0.58, 95% CI 0.37–0.92, p = 0.02) and rs4264324 HSP90AA1 (protective allele C, OR = 0.11, 95% CI 0.01–0.78, p = 0.001) lowered the risk of recurrent stroke; SNP rs7303637 HSPB8 increased the age of onset of IS (protective allele T, p = 0.04). In patients with body mass index (BMI) ≥25, SNPs rs556439 HSF2 (risk allele A, OR = 1.33, 95% CI 1.04–1.69, p = 0.02) and rs549302 HSF2 (risk allele G, OR = 1.34, 95% CI 1.02–1.75, p = 0.03) were linked to a higher risk of IS.
The primary molecular mechanisms through which the studied SNPs contribute to IS pathogenesis were found to be the regulation of cell death, inflammatory and oxidative stress responses.
Keywords
- stroke
- HSP90AA1
- HSF1
- HSF2
- HSPB8
- HSBP1
Ischemic stroke (IS) remains a significant global health threat, ranking among the leading causes of disability and mortality worldwide [1]. IS occurs when cerebral vessels are blocked by atherosclerotic plaques or thrombi, leading to a severe reduction in blood flow [2]. This blockage deprives brain cells of essential oxygen and nutrients, plunging them into a critical state marked by hypoxia, oxidative stress, and excitotoxicity, inducing proteotoxicity [3]. In this vulnerable state, heat shock proteins (HSPs) and proteins with chaperone-like activity serve as the cell’s first line of defense, aiding in survival by encouraging the assembly of emerging proteins and inhibiting the aggregation of damaged proteins [4, 5, 6, 7]. However, while HSPs offer neuroprotective benefits during ischemia [8, 9, 10], they may also contribute to the onset and progression of cardiovascular diseases [11, 12, 13]. Research suggests that HSPs are induced within atherosclerotic lesions [14] and they are significantly involved in progression of atherosclerosis [15].
From functional point of view, HSPs form a complex intertwined machinery that operates protein synthesis and prevent protein aggregation [16]. This network comprises various HSP members that interact and cross-react with one another [17].
Firstly, stress induces the expression of HSPs through heat shock factor (HSF) signaling, that activates transcription [18]; additionally, denatured cell proteins interact with HSP70 and HSP90 releasing them from their complex with HSF1 [19]. Secondly, the small heat shock proteins (HSPBs) play a crucial role by binding improperly folded proteins and facilitating their transfer to ATP-dependent chaperones or protein degradation systems such as proteasomes or autophagosomes [20, 21]. Then HSPs, like HSP90, support the folding or unfolding of massive proteins or macromolecular protein complexes in their structure [22].
The molecular functions of HSP machinery members suggest their involvement in IS pathogenesis, however the worldwide research is focused primarily on exploring HSP70 family proteins [23, 24, 25]. In contrast, the roles of HSP90, heat shock factors (HSFs), and small heat shock proteins (HSPB) in the mechanisms of IS have received less attention and remain underexplored. HSF1 and HSF2 are multi-domain transcription factors [26]. HSF1, typically inactive in normal cells, is activated during stress, initiating the heat shock response [27]. HSF2 influences HSF1-mediated regulation of other HSP genes [28]. HSF1 dissociates from HSP90, undergoes trimerization, and enters the nucleus to induce the expression of antioxidant proteins and chaperones [29], including HSP90AA1 [30]. HSP90AA1 is highly conserved chaperone protein essential for the transport and stabilization of numerous proteins, including transcription factors (TFs), kinases, and signaling regulators [31]. Heat shock factor binding protein 1 (HSBP1) has been identified as a negative regulator of HSF1 [32]. Activated HSBP1 plays a role in disaggregation, altering the properties of unfolded polypeptide co-aggregates to facilitate their extraction and refolding [33]. HSPB8, a member of small HSP family, regulates cell death and is involved in autophagy [34, 35].
Given the intricate interplay of these lesser-studied HSP members in IS risk, our research sought to determine whether single nucleotide polymorphisms (SNPs) in HSPB, HSF, and HSP90 were related to the IS risk. We also assessed their intergenic and gene-environment interactions, and analyzed their potential impact on clinical parameters of IS patients. Additionally, we conducted a comprehensive bioinformatics analysis to uncover the underlying mechanisms of IS-associated SNPs.
The materials and methods employed in our study are briefly outlined in Fig. 1.
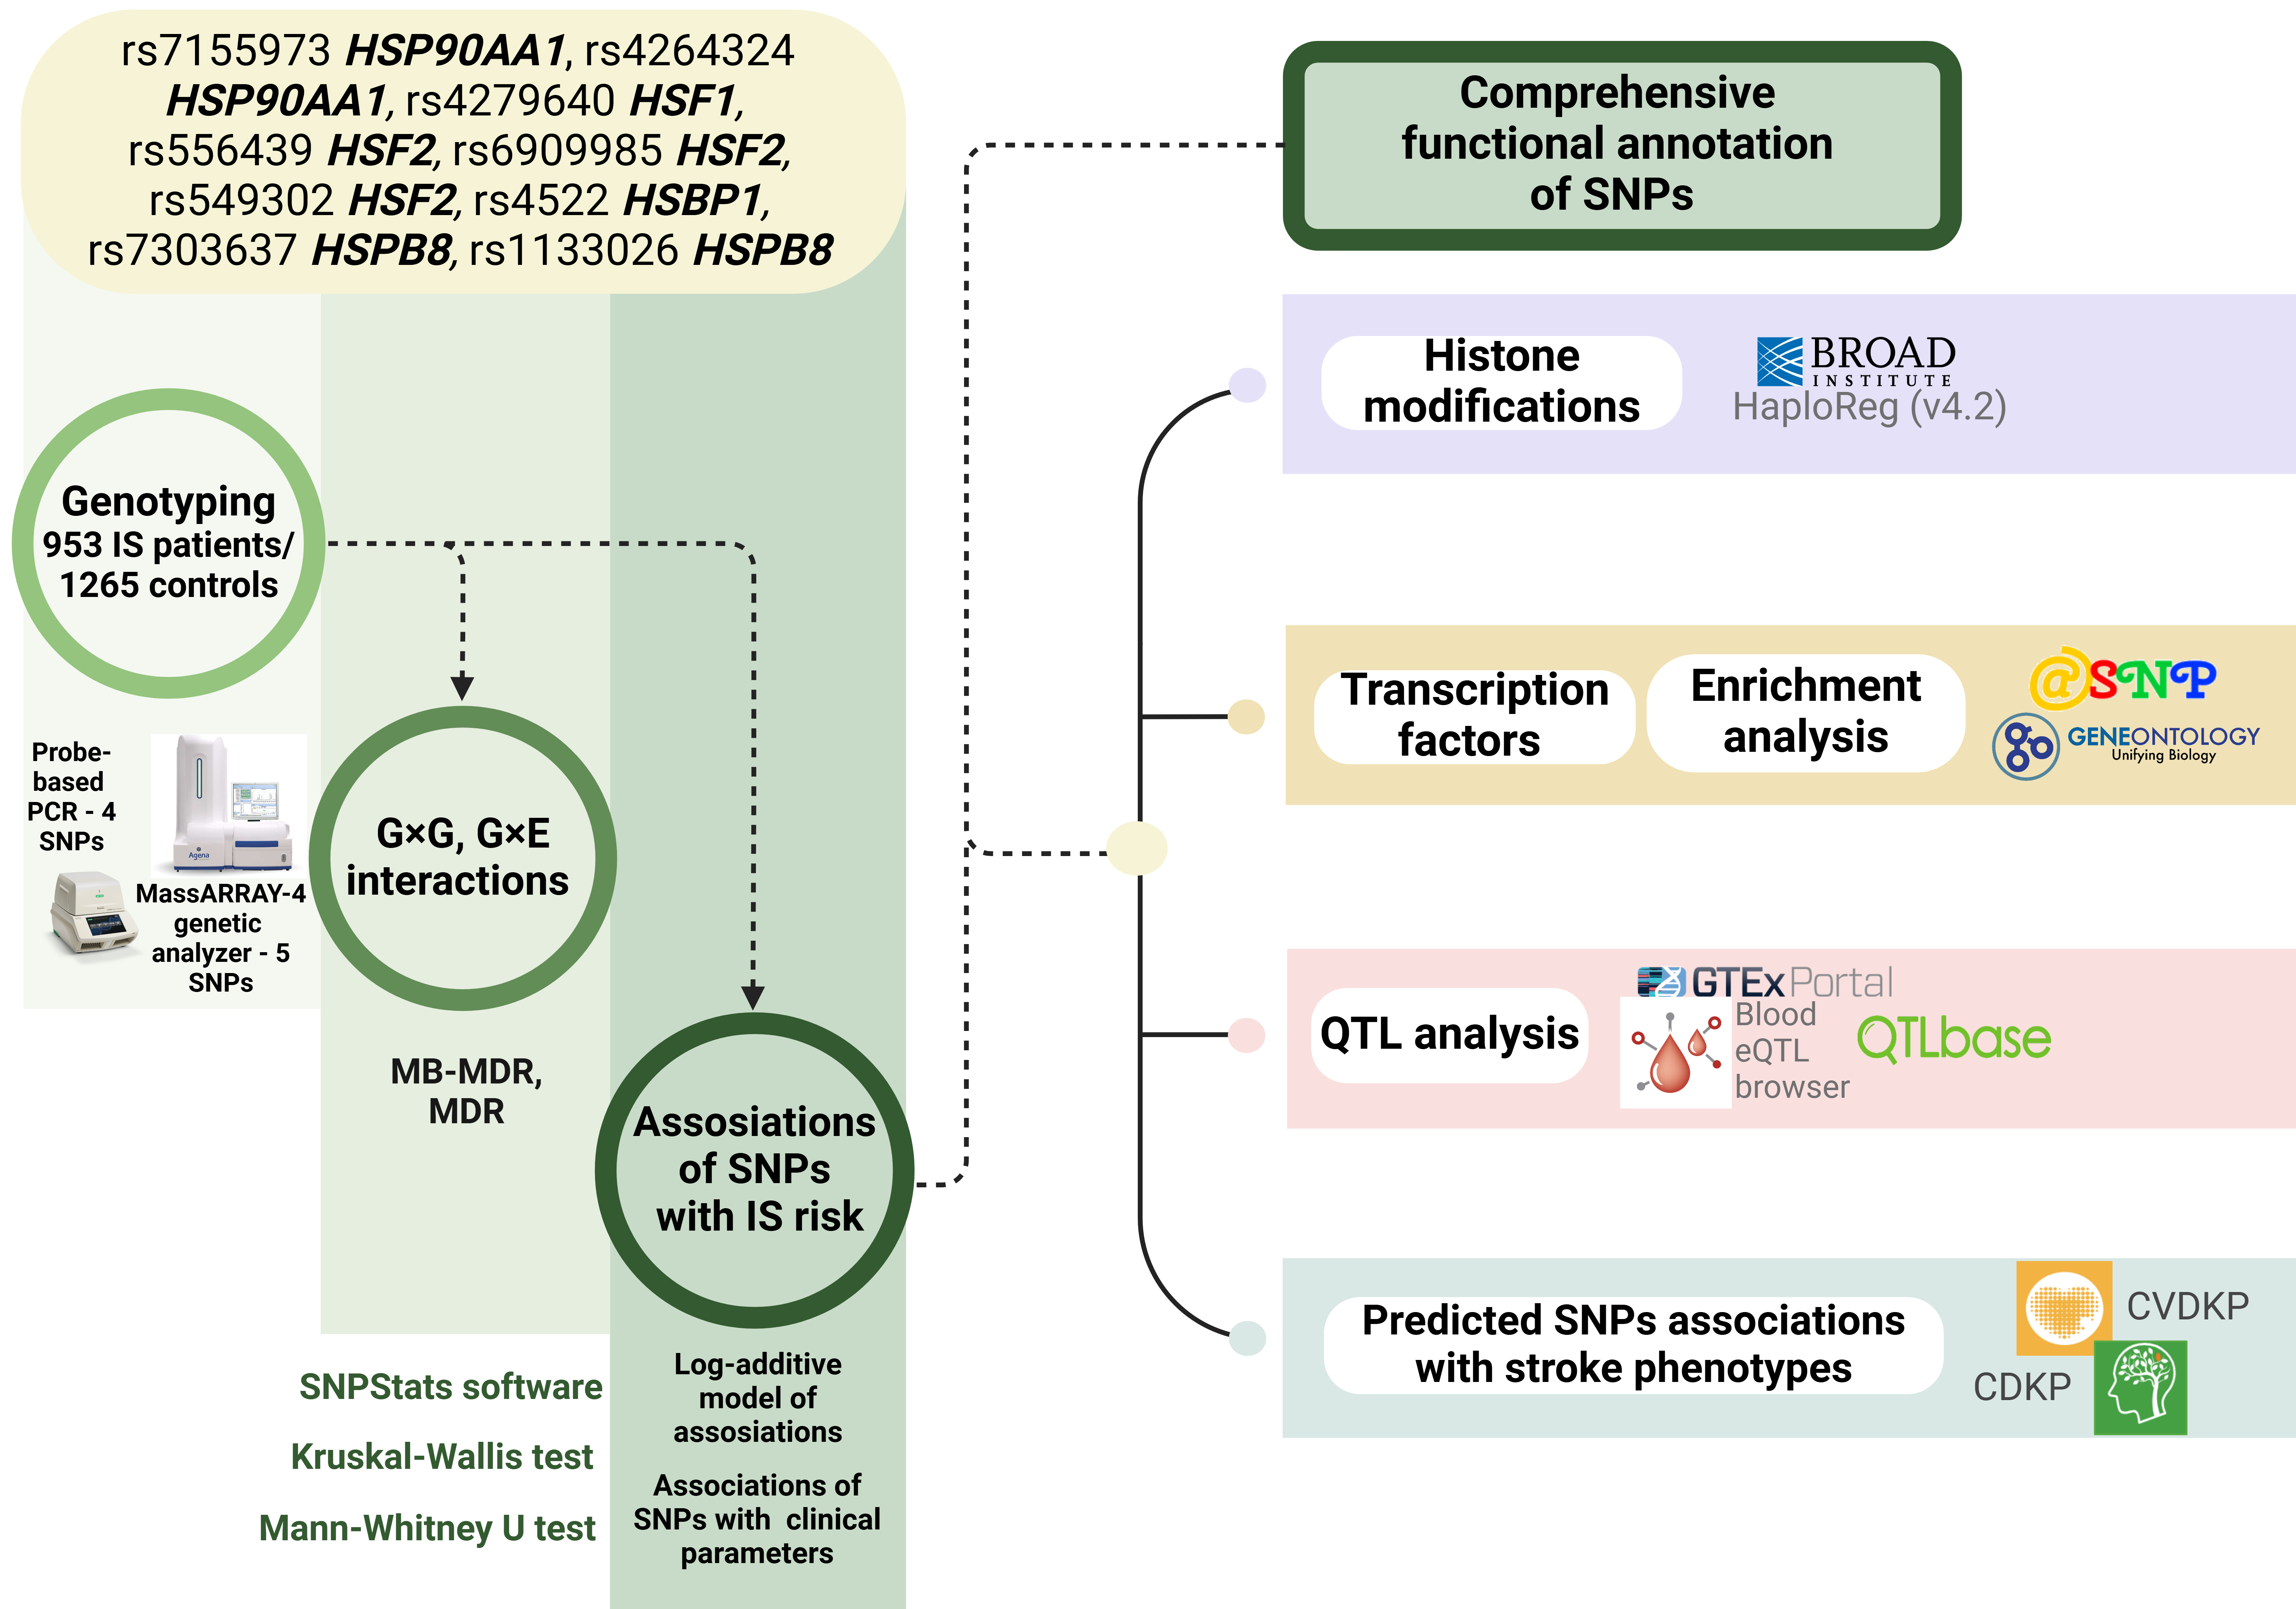 Fig. 1.
The basic outline of the study. G×G, genotype combinations; G×E, genotype-environment combinations; SNPs, single nucleotide polymorphisms; QTL, quantitative trait loci; MB-MDR, model based multifactor dimensionality reduction; IS, Ischemic stroke. Created in BioRender.com.
A total of 2218 unrelated individuals of Russian descent (953 ischemic stroke patients and 1265 healthy controls) from Central Russia were included in the study. The study protocol received approval from the Ethical Review Committee of Kursk State Medical University, and all patients or their families/legal guardians gave written informed consent before enrollment. The inclusion criteria required participants to self-report Russian ancestry and be born in Central Russia. Table 1 summarizes the general characteristics of patients and controls.
| General characteristics | IS (n = 953) | Control (n = 1265) | p-value | |
| Age, Ме [Q1; Q3] | 63 [55; 70] | 58 [53; 66] | ||
| Gender | Males, N (%) | 523 (77.4%) | 583 (73%) | |
| Females, N (%) | 430 (22.6%) | 682 (27%) | ||
| Smoking | Yes, N (%) | 462 (48.5%) | 379 (30%) | |
| No, N (%) | 469 (49.2%) | 875 (69%) | ||
| ND, N (%) | 22 (2.3%) | 11 (1%) | ||
| Hypodynamia | Yes, N (%) | 364 (38.2%) | No data | |
| No, N (%) | 554 (58.1%) | |||
| ND, N (%) | 35 (3.7%) | |||
| Low intake of fruits and vegetables | Yes, N (%) | 487 (51.1%) | No data | |
| No, N (%) | 431 (45.2%) | |||
| ND, N (%) | 35 (3.7%) | |||
| Body mass index (BMI), Ме [Q1; Q3] | 23 [22; 26] (n = 609) | No data | ||
| History of cerebrovascular disorders in the family | Yes, N (%) | 321 (33.7%) | ||
| No, N (%) | 583 (61.2%) | |||
| ND, N (%) | 49 (5.1%) | |||
| Age at stroke, Ме [Q1; Q3] | 61 [54; 70] (n = 925) | - | ||
| Total number of strokes | 1, N (%) | 824 (88.1%) | - | |
| 2, N (%) | 97 (10.4%) | - | ||
| 3, N (%) | 14 (1.5%) | - | ||
| Brain infarct size, mm2, Ме [Q1; Q3] | 104.00 [30; 468] (n = 904) | - | ||
| Total cholesterol, mmol/L, Ме [Q1; Q3] | 5.2 [4.4; 5.9] (n = 625) | No data | ||
| Triglycerides, mmol/L, Ме [Q1; Q3] | 1.3 [1.1; 1.8] (n = 618) | No data | ||
| Prothrombin time (PT), seconds, Ме [Q1; Q3] | 10.79 [10.14; 11.70] (n = 901) | No data | ||
| International normalized ratio (INR), Ме [Q1; Q3] | 1 [0.94; 1.09] (n = 614) | No data | ||
| Activated partial thromboplastin time (APTT), seconds, Ме [Q1; Q3] | 32.7 [29; 37] (n = 617) | No data | ||
| Prothrombin index (PTI), Ме [Q1; Q3] | 83 [78; 90] (n = 908) | No data | ||
ND, no data; Me, median; Q1, first quartile; Q3, third quartile; differences that are statistically significant are indicated in bold.
Enrolment took place in Kursk Emergency Medicine Hospital, as well as Kursk Regional Clinical Hospital. The diagnosis of ischemic stroke in each patient was confirmed by tomography. The criteria for exclusion of patients from the studies have been described previously [36, 37], including conditions that could trigger IS, traumas, and hemorrhage (traumatic brain injury, hepatic or renal failure, autoimmune, oncological, or other conditions). Every patient with IS had a medical history of hypertension and was taking antihypertensive drugs. During routine medical examinations at governmental institutions and in industrial settings, controls were chosen from Kursk hospitals. They were chosen at the same time and from the same group of people as the IS patients. Healthy volunteers in the control group had normal blood pressure, did not take antihypertensive medication and did not exhibit any clinical signs of major disorders such as cardiovascular or cerebrovascular.
Excessive weight and smoking were considered as environmental risk factors. Both
excessive weight (Body mass index (BMI)
The control group consisted of healthy volunteers without obvious signs of serious diseases, including cardiovascular or cerebrovascular diseases [42, 43].
Routine phenol/chloroform extraction was used to extract genomic DNA. A NanoDrop spectrophotometer (Thermo Fisher Scientific, Waltham, MA, USA) was used to measure the concentration, purity, and quality of the DNA.
The selection of SNPs was based on the following criteria: the SNP must have a minor allele frequency of at least 0.05 in the European population, and be distinguished by a high regulatory potential. SNPs were excluded if we faced challenges in designing allele-specific TaqMan probes owing to methodological issues, including a low cytosine and guanine (CG) content in the DNA region flanking an SNP, the presence of GC clamps, runs of identical nucleotides and difficulties with optimising primer annealing conditions.
Genotyping of SNPs rs7155973 HSP90AA1, rs556439 HSF2, rs6909985 HSF2, and rs4279640 HSF1 was done using taqman based real time PCR. For this purpose, primers and allele-specific probes were designed in the Laboratory of Genomic Research at the Research Institute for Genetic and Molecular Epidemiology of Kursk State Medical University (Kursk, Russia) (primer and probe sequences, annealing temperature, MgCl2 concentration for each SNP are listed in Supplementary Table 1). Supplementary Figs. 1–4 show plots with allelic discrimination.
The MassARRAY-4 genetic analyser (Agena Bioscience, San Diego, CA, USA) was used to genotype rs4264324 HSP90AA1, rs4522 HSBP1, rs7303637 HSPB8, rs1133026 HSPB8, and rs549302 HSF2. The methodology of the genotyping was described in details in our previous study [44]. Primers’ sequences are in Supplementary Table 2.
To ensure quality control, 10% of the DNA samples underwent two genotypings while being blinded to the case-control status. A full 99% of the data were in agreement.
The genetic study power was calculated using the online resource
http://csg.sph.umich.edu/abecasis/gas_power_calculator/ (accessed on May 20,
2022). Based on a sample size of 1265 controls and 953 cases, the analysis for
the relationship between SNPs and IS risk was intended to identify a genotype
relative risk range of 1.18–1.43, with 80% statistical power and a 5% type I
error (
The STATISTICA program (v13.3, Santa Clara, CA, USA) was used to perform the statistical analysis.
The Mann-Whitney test was employed to compare two separate groups since the quantitative characteristics were deviated from the normal distribution. The Pearson’s chi-squared test was used to assess categorical variables.
Using a log-additive model with adjustement for covariates, the SNPStats software was utilised to examine the relationships between genotypes and IS risk [45].
The genotype combinations (G
The next analysis includes the most resilient models according to Wald
statistics and significance levels. Calculations were performed using the MB-MDR program for the R software
environment (version 3.6.3, R Foundation for Statistical Computing, Vienna,
Austria). The R software environment’s MB-MDR application (version 3.6.3) was
used to carry out the calculations.The MDR approach, which was implemented in the
MDR program (v3.0.2), was used to further analyse the most relevant G
The following resources were used for functional annotation of SNPs:
• Genotype-Tissue Expression (GTEx) Portal (http://www.gtexportal.org/; accessed on July 20, 2024) was used to facilitated the analysis of expression quantitative trait loci (eQTLs) associated with SNPs in peripheral blood, vessels and brain [46].
• eQTLGen (https://www.eqtlgen.org/; accessed on July 20, 2024) was employed to examine the relationship between HSP SNPs and eQTLs specifically in peripheral blood [47].
• QTLbase (http://www.mulinlab.org/qtlbase/index.html; accessed on July 20, 2024) was utilized to investigate methylation quantitative trait loci (mQTLs) in the brain, whole blood, and blood vessels [48].
• HaploReg (v4.2) (https://pubs.broadinstitute.org/mammals/haploreg/haploreg.php; accessed on July 20, 2024) analyzed the association of HSP SNPs with histone modifications, including acetylation of lysine residues at positions 27 and 9 of the histone H3 protein (H3K27ac and H3K9ac), mono-methylation at position 4 (H3K4me1), and tri-methylation at position 4 (H3K4me3), which mark promoters and enhancers. It also helped identify SNP positioning within DNase hypersensitive regions [49].
• atSNP Function Prediction (http://atsnp.biostat.wisc.edu/search; accessed on July 20, 2024) was used to evaluate how HSP SNPs impact DNA’s ability to bind to transcription factors (TFs) according to reference or SNP alleles [50].
• The contribution of TFs linked to reference or SNP alleles in over-represented biological processes connected to the the cause of cardiovascular disease (CVD) has been investigated through Gene Ontology (http://geneontology.org/; accessed on July 20, 2024) [51]. Biological functions controlled by TFs associated with HSPs SNPs were used as functional groups.
• The Human Genetics Amplifier (HuGeAMP) (https://cd.hugeamp.org/; accessed on July 20, 2023) with focus on Cerebrovascular and Cardiovascular Diseases was used to explore the associations of HSP SNPs with cardio- and cerebrovascular diseases and cardiovascular disease risk factors, drawing from data collected by major research consortia [52].
All studied SNPs in the control group showed genotype frequencies that were in
agreement with the Hardy-Weinberg equilibrium (p
Although we did not find any associations in the overall group
(Supplementary Table 3), further analysis in patient subgroups based on
smoking/BMI (Supplementary Table 4) found that rs1133026 HSPB8 increases the risk of IS in smokers (risk allele A, p = 0.035), while
in overweight patients (BMI
| Genetic variant | Effect allele | Other allele | N | OR [95% CI] | p | N | OR [95% CI] | p |
| Smokers | Non-smokers | |||||||
| rs1133026 HSPB8 | A | G | 540 | 1.43 [1.02–2.02] | 0.035 | 890 | 0.94 [0.72–1.22] | 0.63 |
| BMI |
BMI | |||||||
| rs556439 HSF2 | A | G | 1355 | 1.33 [1.04–1.69] | 0.02 | 1579 | 0.98 [0.81–1.18] | 0.84 |
| rs549302 HSF2 | G | A | 914 | 1.34 [1.02–1.75] | 0.03 | 1145 | 0.93 [0.77–1.12] | 0.44 |
In the smoking/non-smoking groups, adjustments were made for gender and age; in the groups stratified by BMI, adjustments were made for gender, age, and smoking; differences that are statistically significant are indicated in bold. OR, odds ratio; CI, Confidence Interval; HSPs, heat shock proteins; IS, ischemic stroke; BMI, body mass index.
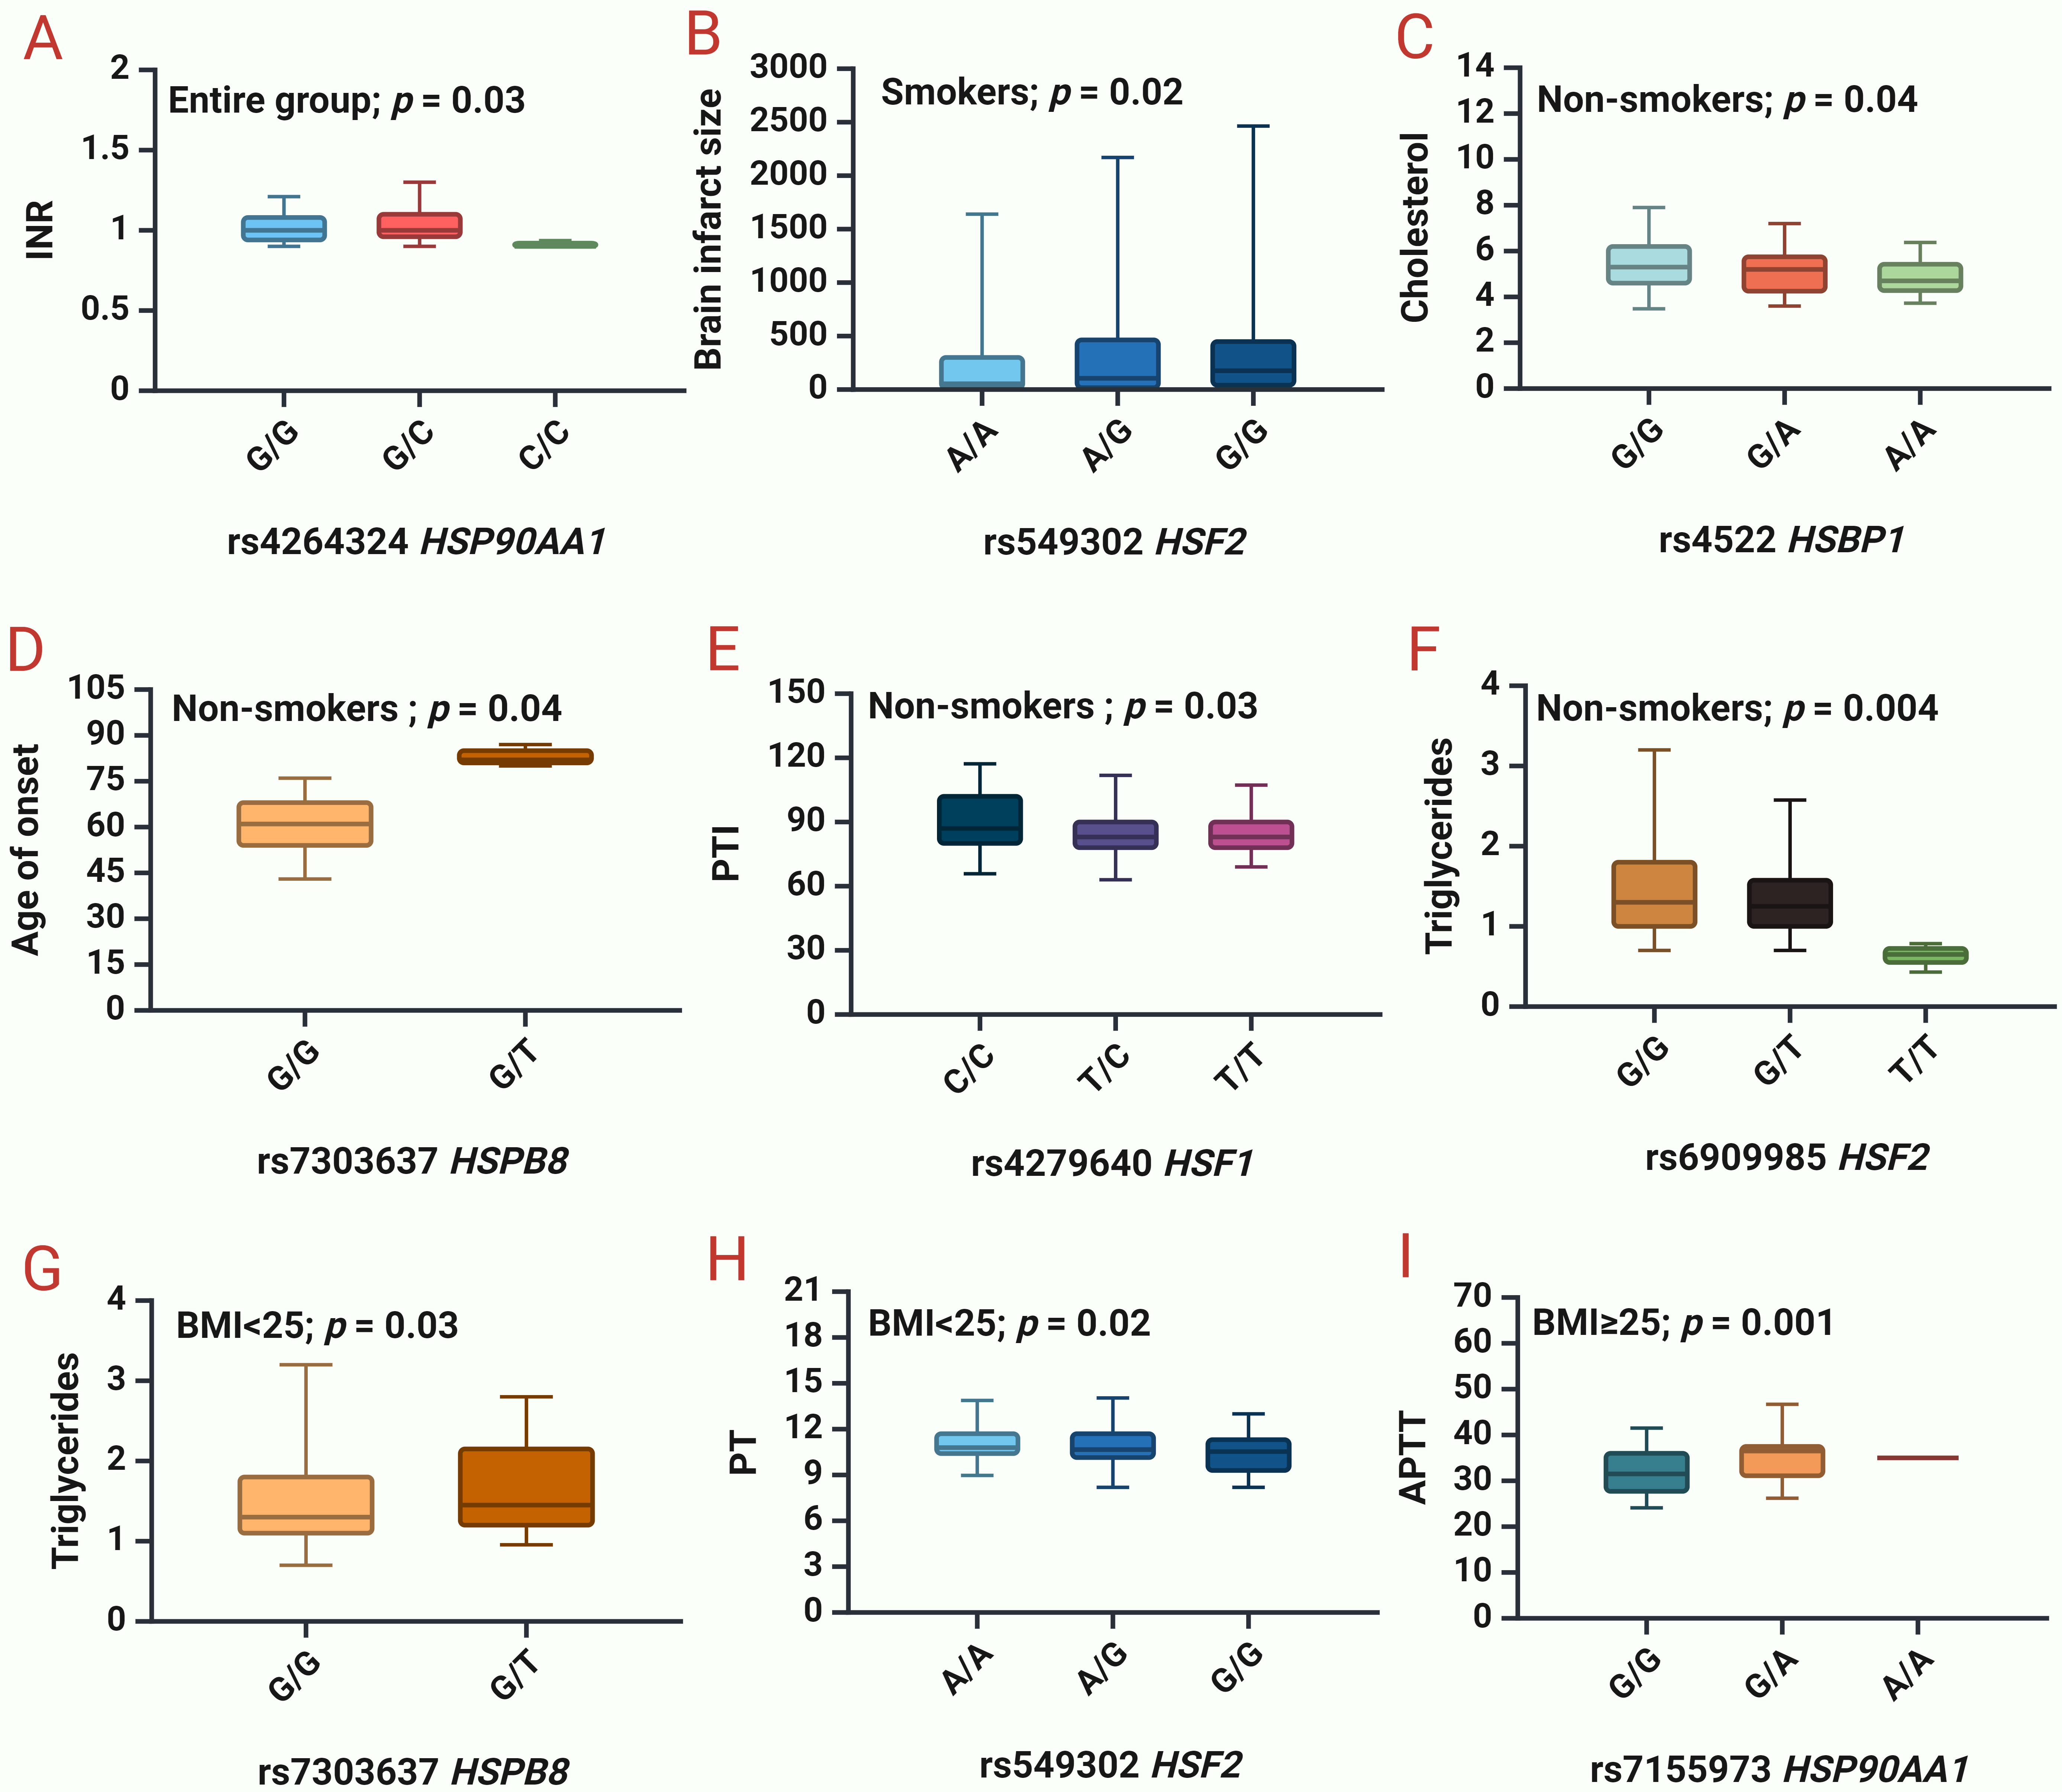
The next step was to analyze the impact of SNPs on clinical and biochemical parameters (Supplementary Table 5, Fig. 2).
 Fig. 2.
Associations between studied HSPs and clinical and biochemical
parameters of IS patients. (A) INR
for rs4264324 HSP90AA1 in the entire group. (B) Brain infarct size for
rs549302 HSF2 in smokers. (C) Cholesterol levels for rs4522 HSBP1 in
non-smokers. (D) Age of IS onset for rs7303637 HSPB8 in non-smokers. (E) PTI for
rs4279640 HSF1 in non-smokers. (F) Triglycerides levels for rs6909985
HSF2 in non-smokers. (G) Triglycerides levels for rs7303637
HSPB8 in patients with BMI
We found that rs4264324 HSP90AA1 lowers INR (p = 0.03) in the entire group of patients (Fig. 2A).
Given the established associations of SNPs with risk factors—BMI and smoking—we also analyzed the clinical parameters in the different subgroups divided on presence/absence of the risk factor.
In smokers, rs556439 HSF2 increases the brain infarct size (p = 0.02) (Fig. 2B). In non-smokers, rs4522 HSBP1 lowers cholesterol levels (p = 0.04) (Fig. 2C), rs7303637 HSPB8 increases the age of onset of IS (p = 0.04) (Fig. 2D), rs4279640 HSF1 lowers PTI (p = 0.03) (Fig. 2E), rs6909985 HSF2 lowers the triglyceride levels (p = 0.004) (Fig. 2F).
In patients with normal BMI (
Moreover, we found that SNPs rs4279640 HSF1 (protective allele T, p = 0.02) and rs4264324 HSP90AA1 (protective allele C, p = 0.001) lower the risk of recurrent strokes in non-smokers (Table 3).
| Genetic variant | Effect allele | Other allele | N | OR [95% CI] | p | N | OR [95% CI] | p |
| Smokers | Non-smokers | |||||||
| rs4279640 HSF1 | T | C | 427 | 0.67 [0.41–1.08] | 0.096 | 429 | 0.58 [0.37–0.92] | 0.02 |
| rs4264324 HSP90AA1 | C | G | 385 | 1.73 [0.76–3.92] | 0.21 | 358 | 0.11 [0.01–0.78] | 0.001 |
Differences that are statistically significant are indicated in bold.
The three most significant one three-locus and four-locus models and
G
| Gene-gene interaction models | NH | beta H | WH | NL | beta L | WL | Wmax | pperm |
| The best three-locus models of intergenic interactions (for G | ||||||||
| rs4522 HSBP1 |
2 | 0.22782 | 6.925 | 3 | –0.1359 | 16.01 | 16.01 | 0.033 |
| The best four-locus models of gene-gene interactions (for G | ||||||||
| rs4522 HSBP1 |
2 | 0.2744 | 9.351 | 6 | –0.1986 | 35.08 | 35.08 | 0.008 |
| rs4522 HSBP1 |
5 | 0.1397 | 18.636 | 5 | –0.2847 | 28.02 | 28.02 | 0.003 |
| rs4522 HSBP1 |
5 | 0.1723 | 16.308 | 4 | –0.2054 | 24.71 | 24.71 | 0.033 |
Note: NH is the number of interacting high-risk genotypes,
beta H—regression coefficient for high-risk interactions identified at the 2nd stage of analysis,
WH—Wald statistics for high-risk interactions,
NL—number of interacting low-risk genotypes,
beta L—regression coefficient for low-risk interactions identified at the 2nd stage of analysis,
WL—Wald statistics for low-risk interactions,
pperm—permutational significance levels for models (all models are adjusted for gender, age, smoking);
Loci included in 2 or more best G
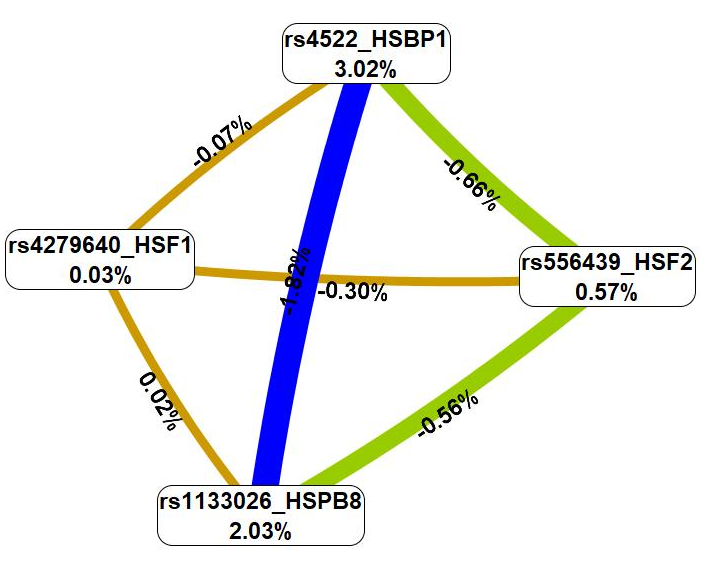
Then, the analysis of the interaction mechanisms of these genetic variants was carried out employing the MDR technique (Fig. 3).
 Fig. 3.
A graph showing the nature and intensity of the most essential
G
First, the MDR procedure demonstrated that genetic variations included in the
best G
Seven most significant models of gene-environment interactions linked to IS were
found using the MB-MDR method: three three-level, three four-level, and one
two-level model (Table 5). Overall, smoking was included in interaction with four
SNPs (rs4522 HSBP1, rs7303637 HSPB8, rs7155973
HSP90AA1, and rs4264324 HSP90AA1) in the best G
| Gene-gene interaction models | NH | beta H | WH | NL | beta L | WL | Wmax | pperm |
| The best two-factor models of gene-smoking interactions (for G | ||||||||
| SMOKE |
3 | 0.2602 | 110.0 | 3 | –0.2602 | 110.0 | 110.0 | |
| The best three-order models of gene- interactions (for G | ||||||||
| SMOKE |
5 | 0.2667 | 113.8 | 4 | –0.2448 | 98.21 | 113.8 | |
| SMOKE |
6 | 0.2624 | 110.5 | 5 | –0.2507 | 103.14 | 110.5 | |
| SMOKE |
9 | 0.2610 | 110.4 | 7 | –0.2241 | 84.36 | 110.4 | |
| The best four-factor models of gene- interactions (for G | ||||||||
| SMOKE |
7 | 0.2697 | 114.0 | 4 | –0.2297 | 87.32 | 114.0 | |
| SMOKE |
8 | 0.2666 | 112.1 | 6 | –0.2341 | 89.96 | 112.1 | |
| SMOKE |
7 | 0.2658 | 111.1 | 4 | –0.2308 | 88.69 | 111.1 | |
Note: NH is the number of high-risk interactions,
beta H—regression coefficient for high-risk interactions identified at the 2nd stage of analysis,
WH—Wald statistics for high-risk interactions,
NL—number of interacting low-risk interactions,
beta L—regression coefficient for low-risk interactions identified at the 2nd stage of analysis,
WL—Wald statistics for low-risk interactions,
pperm—permutational significance levels for models (all models are adjusted for gender, age);
Loci included in 2 or more best G
Next, we used the MDR method to examine the relationship between smoking and these genetic variations (Fig. 4).
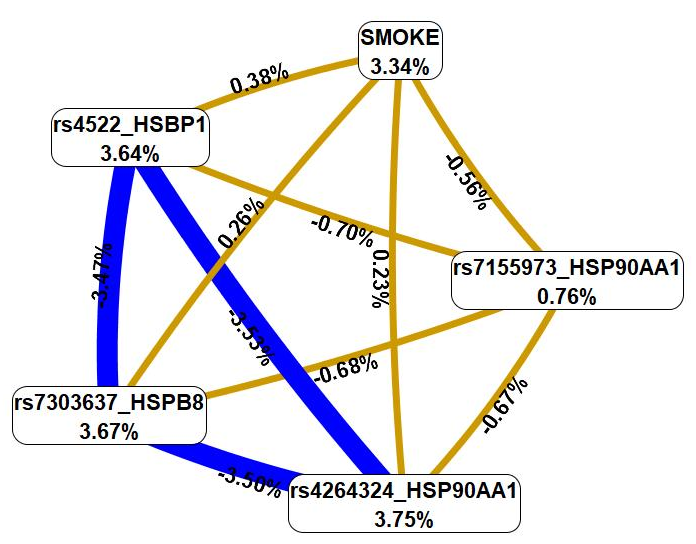 Fig. 4.
The graph that shows the structure and power of the most
significant G
First, MDR revealed that smoking was characterized by a mono-effect of 3.34%,
comparable with the mono-effects of most SNPs involved in the most significant
G
According to data from eQTL Gen browser (Table 6), studied SNPs have the following cis-eQTL effects in blood: SNPs rs4264324 and rs7155973 HSP90AA1 result in a decrease in expression of HSP90AA1 in blood, while also rs4264324 increase expression of DYNC1H1, and rs7155973 increases expression of CINP simultaneously decreases expression of ANKRD9; SNPs rs556439 and rs549302 HSF2 decrease the expression of HSF2 and increase the expression of PKIB; Interestingly, these two SNPs have opposite effect on SERINC1 expression: rs549302 lowers its levels in blood, while rs556439—elevates. Moreover, rs549302 increase expression of SMPDL3A; SNP rs4522 HSBP1 results in a decrease of expression levels of HSBP1.
| SNP | Effect allele | Gene expressed | Z-score | p-value |
| rs4264324 HSP90AA1 (G/C) | C | HSP90AA1 | 3.02 | |
| DYNC1H1 | 7.63 | |||
| rs7155973 HSP90AA1 (G/A) | A | HSP90AA1 | 5.9778 | |
| CINP | 2.4354 | |||
| ANKRD9 | 3.0489 | |||
| rs4279640 HSF1 (T/C) | ND | |||
| rs556439 HSF2 (G/A) | A | HSF2 | 3.2717 | |
| SERINC1 | 8.0938 | |||
| PKIB | 8.8673 | |||
| rs549302 HSF2 (A/G) | G | HSF2 | 3.2717 | |
| PKIB | 1.2444 | |||
| SERINC1 | 2.7191 | |||
| SMPDL3A | 3.0296 | |||
| rs4522 HSBP1 (G/A) | A | HSBP1 | 0 | |
| rs1133026 HSPB8 (G/A) | ND | |||
| rs1133026 HSPB8 (G/A) | ND | |||
Note: ND, No data;
According to GTEx Portal data, SNPs rs4264324 and rs715597 in HSP90AA1 are associated with a decreased expression of ZNF839 in brain tissue (Table 7). Additionally, SNP rs4279640 in HSF1 increases the expression of DGAT1 in peripheral blood, while decreasing the expression of BOP1 and SCX in arteries and MROH1 in brain tissue (Table 7). Moreover, rs4279640 in HSF1 exhibits cis-eQTL effects on HSF1 and CPSF1 in both blood and arteries, leading to reduced expression levels of these genes (Table 7).
| SNP | Gene expressed | p-Value | Effect (Normalized effect size (NES)) | Tissue |
| rs4264324 HSP90AA1 (G/C) | ZNF839 | 1.8 |
Brain - Cerebellar Hemisphere | |
| ZNF839 | 6.6 |
Brain - Cerebellum | ||
| rs7155973 HSP90AA1 (G/A) | ZNF839 | 3.1 |
Brain - Cerebellum | |
| ZNF839 | 7.6 |
Brain - Cortex | ||
| rs4279640 HSF1 (T/C) | SCX | 2.3 |
Artery - Aorta | |
| BOP1 | 1.7 |
Artery - Aorta | ||
| HSF1 | 7.1 |
Artery - Aorta | ||
| CPSF1 | 6.4 |
Artery - Aorta | ||
| SCX | 2.2 |
Artery - Coronary | ||
| SCX | 4.8 |
Artery - Tibial | ||
| BOP1 | 1.2 |
Artery - Tibial | ||
| CPSF1 | 5.6 |
Artery - Tibial | ||
| MROH1 | 1.9 |
Brain - Cerebellar Hemisphere | ||
| MROH1 | 1.0 |
Brain - Cerebellum | ||
| DGAT1 | 2.1 |
Whole Blood | ||
| HSF1 | 2.7 |
Whole Blood | ||
| CPSF1 | 3.8 |
Whole Blood | ||
| rs556439 HSF2 (G/A) | RP3-425C14.4 | 6.8 |
Artery - Aorta | |
| HSF2 | 1.3 |
Artery - Aorta | ||
| HSF2 | 7.8 |
Artery - Coronary | ||
| RP3-425C14.4 | 1.5 |
Artery - Coronary | ||
| RP3-425C14.4 | 1.0 |
Artery - Tibial | ||
| HSF2 | 6.7 |
Artery - Tibial | ||
| RP3-425C14.4 | 6.3 |
Brain - Amygdala | ||
| RP3-425C14.4 | 1.1 |
Brain - Caudate (basal ganglia) | ||
| RP3-425C14.4 | 2.2 |
Brain - Cerebellar Hemisphere | ||
| RP3-425C14.4 | 9.3 |
Brain - Cerebellum | ||
| RP3-425C14.4 | 6.2 |
Brain - Cortex | ||
| RP3-425C14.4 | 2.6 |
Brain - Frontal Cortex (BA9) | ||
| RP3-425C14.4 | 8.1 |
Brain - Hypothalamus | ||
| RP3-425C14.4 | 2.5 |
Brain - Nucleus accumbens (basal ganglia) | ||
| RP3-425C14.4 | 1.5 |
Brain - Putamen (basal ganglia) | ||
| HSF2 | 3.1 |
Whole Blood | ||
| RP3-425C14.4 | 5.5 |
Whole Blood | ||
| SERINC1 | 2.3 |
Whole Blood | ||
| rs549302 HSF2 (A/G) | HSF2 | 1.6 |
Artery - Aorta | |
| RP3-425C14.4 | 9.3 |
Artery - Aorta | ||
| HSF2 | 1.8 |
Artery - Coronary | ||
| HSF2 | 8.1 |
Artery - Tibial | ||
| RP3-425C14.4 | 1.3 |
Artery - Tibial | ||
| RP3-425C14.4 | 3.4 |
Brain - Amygdala | ||
| RP3-425C14.4 | 1.1 |
Brain - Caudate (basal ganglia) | ||
| RP3-425C14.4 | 8.8 |
Brain - Cerebellar Hemisphere | ||
| RP3-425C14.4 | 9.6 |
Brain - Cortex | ||
| RP3-425C14.4 | 9.0 |
Brain - Frontal Cortex (BA9) | ||
| RP3-425C14.4 | 2.9 |
Brain - Nucleus accumbens (basal ganglia) | ||
| HSF2 | 1.0 |
Whole Blood | ||
| RP3-425C14.4 | 1.4 |
Whole Blood | ||
| rs4522 HSBP1 (G/A) | RP11-483P21.2 | 3.8 |
Artery - Aorta | |
| rs7303637 HSPB8 (G/T) | HSPB8 | 1.2 |
Artery - Aorta | |
| HSPB8 | 9.1 |
Brain - Cortex | ||
| rs1133026 HSPB8 (G/A) | ND | |||
Note: effect alleles are marked in bold; ND, No data,
SNPs Allele G of rs556439 and allele A rs549302 HSF2 increase expression of HSF2 in arteries and in whole blood, decrease expression of RP3-425C14.4 in blood, brain tissues, and arteries. Additionally, rs556439 lowers expression of SERINC1 in whole blood (Table 7).
SNP rs4522 HSBP1, via it cis-eQTL effects in aorta, increases expression of RP11-483P21.2 (Table 7). Lastly, SNP rs7303637 HSPB8 results in a decrease of HSPB8’s expression levels in aorta and in brain cortex (Table 7).
Analysis of SNPs established their cis-mQTL-mediated effects in the brain-prefrontal cortex: allele A rs4522 HSBP1 increases methylation of cg08394248 and decreases of cg00900105, while allele A rs7155973 HSP90AA1 increases methylation of cg23289024, cg13797425 and cg14893857 (Table 8).
| Trait | Effect allele | Tissue | Effect Size (beta) | False discovery rate (FDR) |
| rs7155973 HSP90AA1 | ||||
| cg23289024 (chr14:103485093) | A | Brain-Prefrontal Cortex | 0.009723 | 1.4 |
| cg13797425 (chr14:103485224) | A | Brain-Prefrontal Cortex | 0.007583 | 2.4 |
| cg14893857 (chr14:103485216) | A | Brain-Prefrontal Cortex | 0.007763 | 1.8 |
| rs4522 HSBP1 | ||||
| cg08394248 (chr16:85290608) | A | Brain-Prefrontal Cortex | 0.011546 | 0.0023 |
| cg00900105 (chr16:85285230) | A | Brain-Prefrontal Cortex | –0.0033 | 0.0066 |
Allele G rs4264324 HSP90AA1 is associated with 41 transcription factors (TFs), jointly involved in five biological processes: energy homeostasis (GO:2001171), signaling pathways (Gene Ontology (GO):0060395, GO:0043401), homeostasis of neuronal cells (GO:0022008, GO:0097150), while allele C rs4264324 HSP90AA1 is linked to 32 TFs, participating in neuronal cells’ regulation (GO:0060253, GO:0048714, GO:0030182) (Supplementary Table 8).
Allele G rs7155973 HSP90AA1 determines the affinity for 34 TFs, involved in signaling pathways (GO:0002155, GO:0097720, GO:0033143, GO:0060070) and regulation of apoptotic process (GO:0042981; FDR = 0.0349) (Supplementary Table 7). Allele A rs7155973 HSP90AA1 is linked to 39 TFs, associated with regulation of immune cells and cytokines (GO:0032754, GO:0032736, GO:2001185, GO:0032753, GO:0043370, GO:0001818, GO:0034097), homeostasis of neuronal cells (GO:0045665, GO:0045666, GO:0048666), epigenetic regulation (GO:0140588, GO:0006338) (Supplementary Table 9).
Allele C rs4279640 HSF1 creates DNA binding sites for 86 TFs, participating in regulation of immune cells and cytokines (GO:0071354, GO:0032651), apoptosis (GO:0043065), signaling transduction (GO:0038061, GO:0007249), positive regulation of leukocyte adhesion to vascular endothelial cell (GO:1904996), response to nicotine (GO:0071316), fat cell proliferation (GO:0070345) (Supplementary Table 10). While allele T rs4279640 HSF1 generates sites for 20 TFs, associated with regulation of monocyte differentiation (GO:0045655) (Supplementary Table 10).
Allele G rs556439 HSF2 identifies affinity for 82 TFs, that are jointly involved in 14 GOs: regulation of immune responses (GO:0071347, GO:0032655), apoptosis (GO:0034393), vasculogenesis (GO:0001570, GO:0035886), signaling pathway (GO:0032873, GO:0030509, GO:0046425, GO:0007249, GO:0038061, GO:0043401), fat cell differentiation (GO:0045444), neuron differentiation (GO:0021953), cellular metabolism (GO:0031669) (Supplementary Table 11).
Allele A rs549302 HSF2 is associated with 13 TFs, participating in positive regulation of lipid transport (GO:0032370) (Supplementary Table 12). Meanwhile allele G rs549302 HSF2 creates DNA binding sites for 66 TFs, involved in 23 biological processes: cell signaling (GO:0035729, GO:1904294, GO:0070498, GO:0007219, GO:0030509, GO:0072331), angiogenesis (GO:0060842, GO:2001212, GO:0051151, GO:0045765), cellular response to laminar fluid shear stress (GO:0071499), fatty acid homeostasis (GO:0055089), stress responses (GO:0030968, GO:0070301, GO:0002931, GO:0001666), apoptosis (GO:0043066), neurogenesis (GO:0021780, GO:0030182), regulation of cytokine production (GO:0001819) (Supplementary Table 12).
Allele A rs4522 HSBP1 is linked to 29 TFs, all together involved in cell fate commitment and differentiation (GO:0060018, GO:0048715, GO:0048663, GO:0045444, GO:0045598, GO:2000177), apoptosis (GO:0043066), lipid metabolism (GO:0045833, GO:0019217), hippo signaling (GO:0035329) (Supplementary Table 11). Allele G rs4522 HSBP1 determines the affinity of 61 TFs, participating in vasculature development (GO:0001944), development of the nervous system (GO:0030182, GO:0007417) (Supplementary Table 13).
Allele G rs7303637 HSPB8 increases the affinity for 48 TFs, jointly involved in apoptosis (GO:1902041), cytokine regulation (GO:0032466, GO:0071345), cell signaling (GO:0072331, GO:0007219), artery morphogenesis and vessel cell differentiation (GO:1904238, GO:0043536, GO:0045765, GO:0048844) (Supplementary Table 14).
Allele A rs1133026 HSPB8 determines the affinity for 70 TFs, involved in apoptosis of smooth muscle cells (GO:1905461), neuronal cell differentiation and generation (GO:0048699, GO:0045665), fat cell differentiation (GO:0045444), pathway signaling mediated by hormones (GO:0043401), artery morphogenesis (GO:0048844), regulation of angiogenesis (GO:0045765), hypoxia response (GO:0071456) (Supplementary Table 15).
With help of data from HaploReg (v4.2), it can be noted that from the studied SNPs rs7155973 HSP90AA1, rs4522 HSBP1, and rs7303637 HSPB8 display high regulatory potential, as they are marked with three-four histone tags in most brain tissues and in blood (Supplementary Table 16).
Specifically, SNP rs7155973 HSP90AA1 is associated with H3K4me1 and H3K4me3 in blood and brain. H3K9ac, which marks promoters in blood and all brain tissues other than the hippocampus middle, and H3K27ac, which marks enhancers in blood and all brain tissues, further amplifies the effect of these histone tags (Supplementary Table 16).
SNP rs4522 HSBP1 is associated with H3K4me1 in peripheral blood and in some brain tissues, as well as to H3K4me3 but only in several brain tissues (Supplementary Table 16). H3K27ac, which marks enhancers in blood and certain brain tissues, amplifies the action of these histone tags even more. Interestingly, this SNP is also found in blood DNA areas that are hypersensitive to DNase-1 (in blood) (Supplementary Table 16).
SNP rs7303637 HSPB8 is positioned nearby wherein DNA binds to H3K4me1 marking enhancers in brain anterior caudate, brain cingulate gyrus, as well as H3K4me3 in different parts of the brain (anterior caudate, cingulate gyrus, hippocampus middle, angular gyrus, dorsolateral prefrontal cortex) (Supplementary Table 16). H3K9ac, which marks promoters in all brain tissues with the exception of the hippocampus middle and brain anterior caudate, and H3K27ac, which marks enhancers in all brain tissues, increase the significance of this histone mark (Supplementary Table 16).
rs4279640 HSF1 is located in DNA regions binding to H3K4me1 in blood cells, hippocampus middle, and dorsolateral prefrontal cortex (Supplementary Table 16).
SNPs rs556439 and rs549302 HSF2 are only located in DNA regions binding to H3K4me1 in blood cells, while rs1133026 HSPB8 is only located in DNA regions binding to H3K4me1 in brain dorsolateral prefrontal cortex (Supplementary Table 16).
Lastly, SNP rs4264324 HSP90AA1 is only located in DNA regions binding to H3K27ac in brain substantia nigra, cingulate gyrus, and angular gyrus (Supplementary Table 16).
Data from the Cerebrovascular Knowledge Portal indicated that the studied SNPs are associated with lipid profile (altering cholesterol levels), cerebrovascular diseases (hypertension, stroke, cardio-aortic embolism, atrial fibrillation). The full list of phenotypes, related to IS, are presented in Table 9.
| № | SNP | Phenotype | p-value | Beta (OR) | Sample Size |
| 1. | rs4264324 HSP90AA1 (G/C) | 2Total cholesterol | 3.97 |
Beta▲0.0075 | 2,543,670 |
| 2. | 2LDL cholesterol | 0.0001 | Beta▲0.0059 | 3,044,750 | |
| 3. | 2Non-HDL cholesterol | 0.0006 | Beta▲0.0084 | 1,100,470 | |
| 4. | 1Hypertension | 0.005 | OR▼0.9905 | 208,132 | |
| 5. | 2HDL cholesterol | 0.01 | Beta▲0.0043 | 2,426,280 | |
| 6. | 1Diastolic blood pressure | 0.01 | Beta▼–0.0065 | 1,838,630 | |
| 7. | 1Atrial fibrillation | 0.02 | OR▼0.9769 | 545,988 | |
| 8. | 2Serum ApoB | 0.03 | Beta▲0.0064 | 436,068 | |
| 9. | rs7155973 HSP90AA1 (G/A) | 2Total cholesterol | 0.00001 | Beta▲0.0082 | 2,422,300 |
| 10. | 2Non-HDL cholesterol | 0.001 | Beta▲0.0097 | 1,129,280 | |
| 11. | 2Triglycerides | 0.027 | Beta▲0.0035 | 2,642,380 | |
| 12. | 2LDL cholesterol | 0.0002 | Beta▲0.0078 | 2,918,780 | |
| 14. | 2HDL cholesterol | 0.047 | Beta▲0.0042 | 2,706,720 | |
| 15. | 2Serum ApoA | 0.02 | Beta▲0.0084 | 398,828 | |
| 17. | rs4279640 HSF1 (T/C) | 1Large artery stroke | 0.002 | OR▼0.9181 | 36,651 |
| 18. | 2HDL cholesterol | 0.0002 | Beta▲0.0035 | 2,486,730 | |
| 19. | 2Triglyceride-to-HDL ratio | 0.002 | Beta▼–0.0094 | 418,488 | |
| 20. | 1TOAST cardio-aortic embolism | 0.02 | OR▲1.0583 | 121,638 | |
| 21. | rs556439 HSF2 (G/A) | 2HDL cholesterol | 9.82 |
Beta▲0.0063 | 3,000,210 |
| 22. | 2Serum ApoA | 8.61 |
Beta▲0.0090 | 398,828 | |
| 23. | 1Hypertension | 0.00002 | OR▼0.9887 | 603,329 | |
| 24. | 2Non-HDL cholesterol | 0.0001 | Beta▼–0.0065 | 1,082,500 | |
| 25. | 2LDL cholesterol | 0.0001 | Beta▼–0.0041 | 3,218,260 | |
| 26. | 2Atrial fibrillation | 0.0001 | OR▼0.9763 | 545,988 | |
| 27. | 2Dyslipidemia | 0.01 | OR▼0.9652 | 56,375 | |
| 28. | 1Systolic blood pressure | 0.01 | Beta▼–0.0037 | 1,884,560 | |
| 29. | rs549302 HSF2 (A/G) | 2HDL cholesterol | 3.07 |
Beta▲0.0053 | 2,648,800 |
| 30. | 2Serum ApoA | 1.94 |
Beta▲0.0088 | 398,828 | |
| 31. | 2Atrial fibrillation | 0.0002 | OR▼0.9788 | 545,988 | |
| 32. | 1Small vessel stroke | 0.018 | OR▼0.9673 | 53,991 | |
| 33. | rs4522 HSBP1 (G/A) | 2Atrial fibrillation or flutter | 0.004 | OR▲1.0309 | 130,776 |
| 34. | 2Serum ApoA | 0.009 | Beta▲0.0049 | 398,828 | |
| 35. | 1Cardioembolic stroke | 0.01 | OR▼0.9619 | 50,728 | |
| 36. | 1Early onset ischemic stroke | 0.03 | OR▼0.9667 | 65,102 | |
| 37. | rs7303637 HSPB8 (G/T) | ND | |||
| 38. | rs1133026 HSPB8 (G/A) | 2LDL cholesterol | 0.003 | Beta▼–0.0038 | 3,223,900 |
| 39. | 2Serum ApoB | 0.016 | Beta▼–0.0054 | 436,068 | |
| 40. | 2Dyslipidemia | 0.02 | OR▲1.0367 | 56,375 | |
| 41. | 2Triglycerides | 0.025 | Beta▼–0.0021 | 2,964,850 | |
| 42. | 2Total cholesterol | 0.03 | Beta▼–0.0026 | 2,767,090 | |
Effect alleles are indicated in bold in the following data sources; ▼, indicates a decrease in the effect; ▲, indicates an increase in the effect. 1—Cerebrovascular Disease Knowledge Portal; 2—Cardiovascular Disease Knowledge Portal.
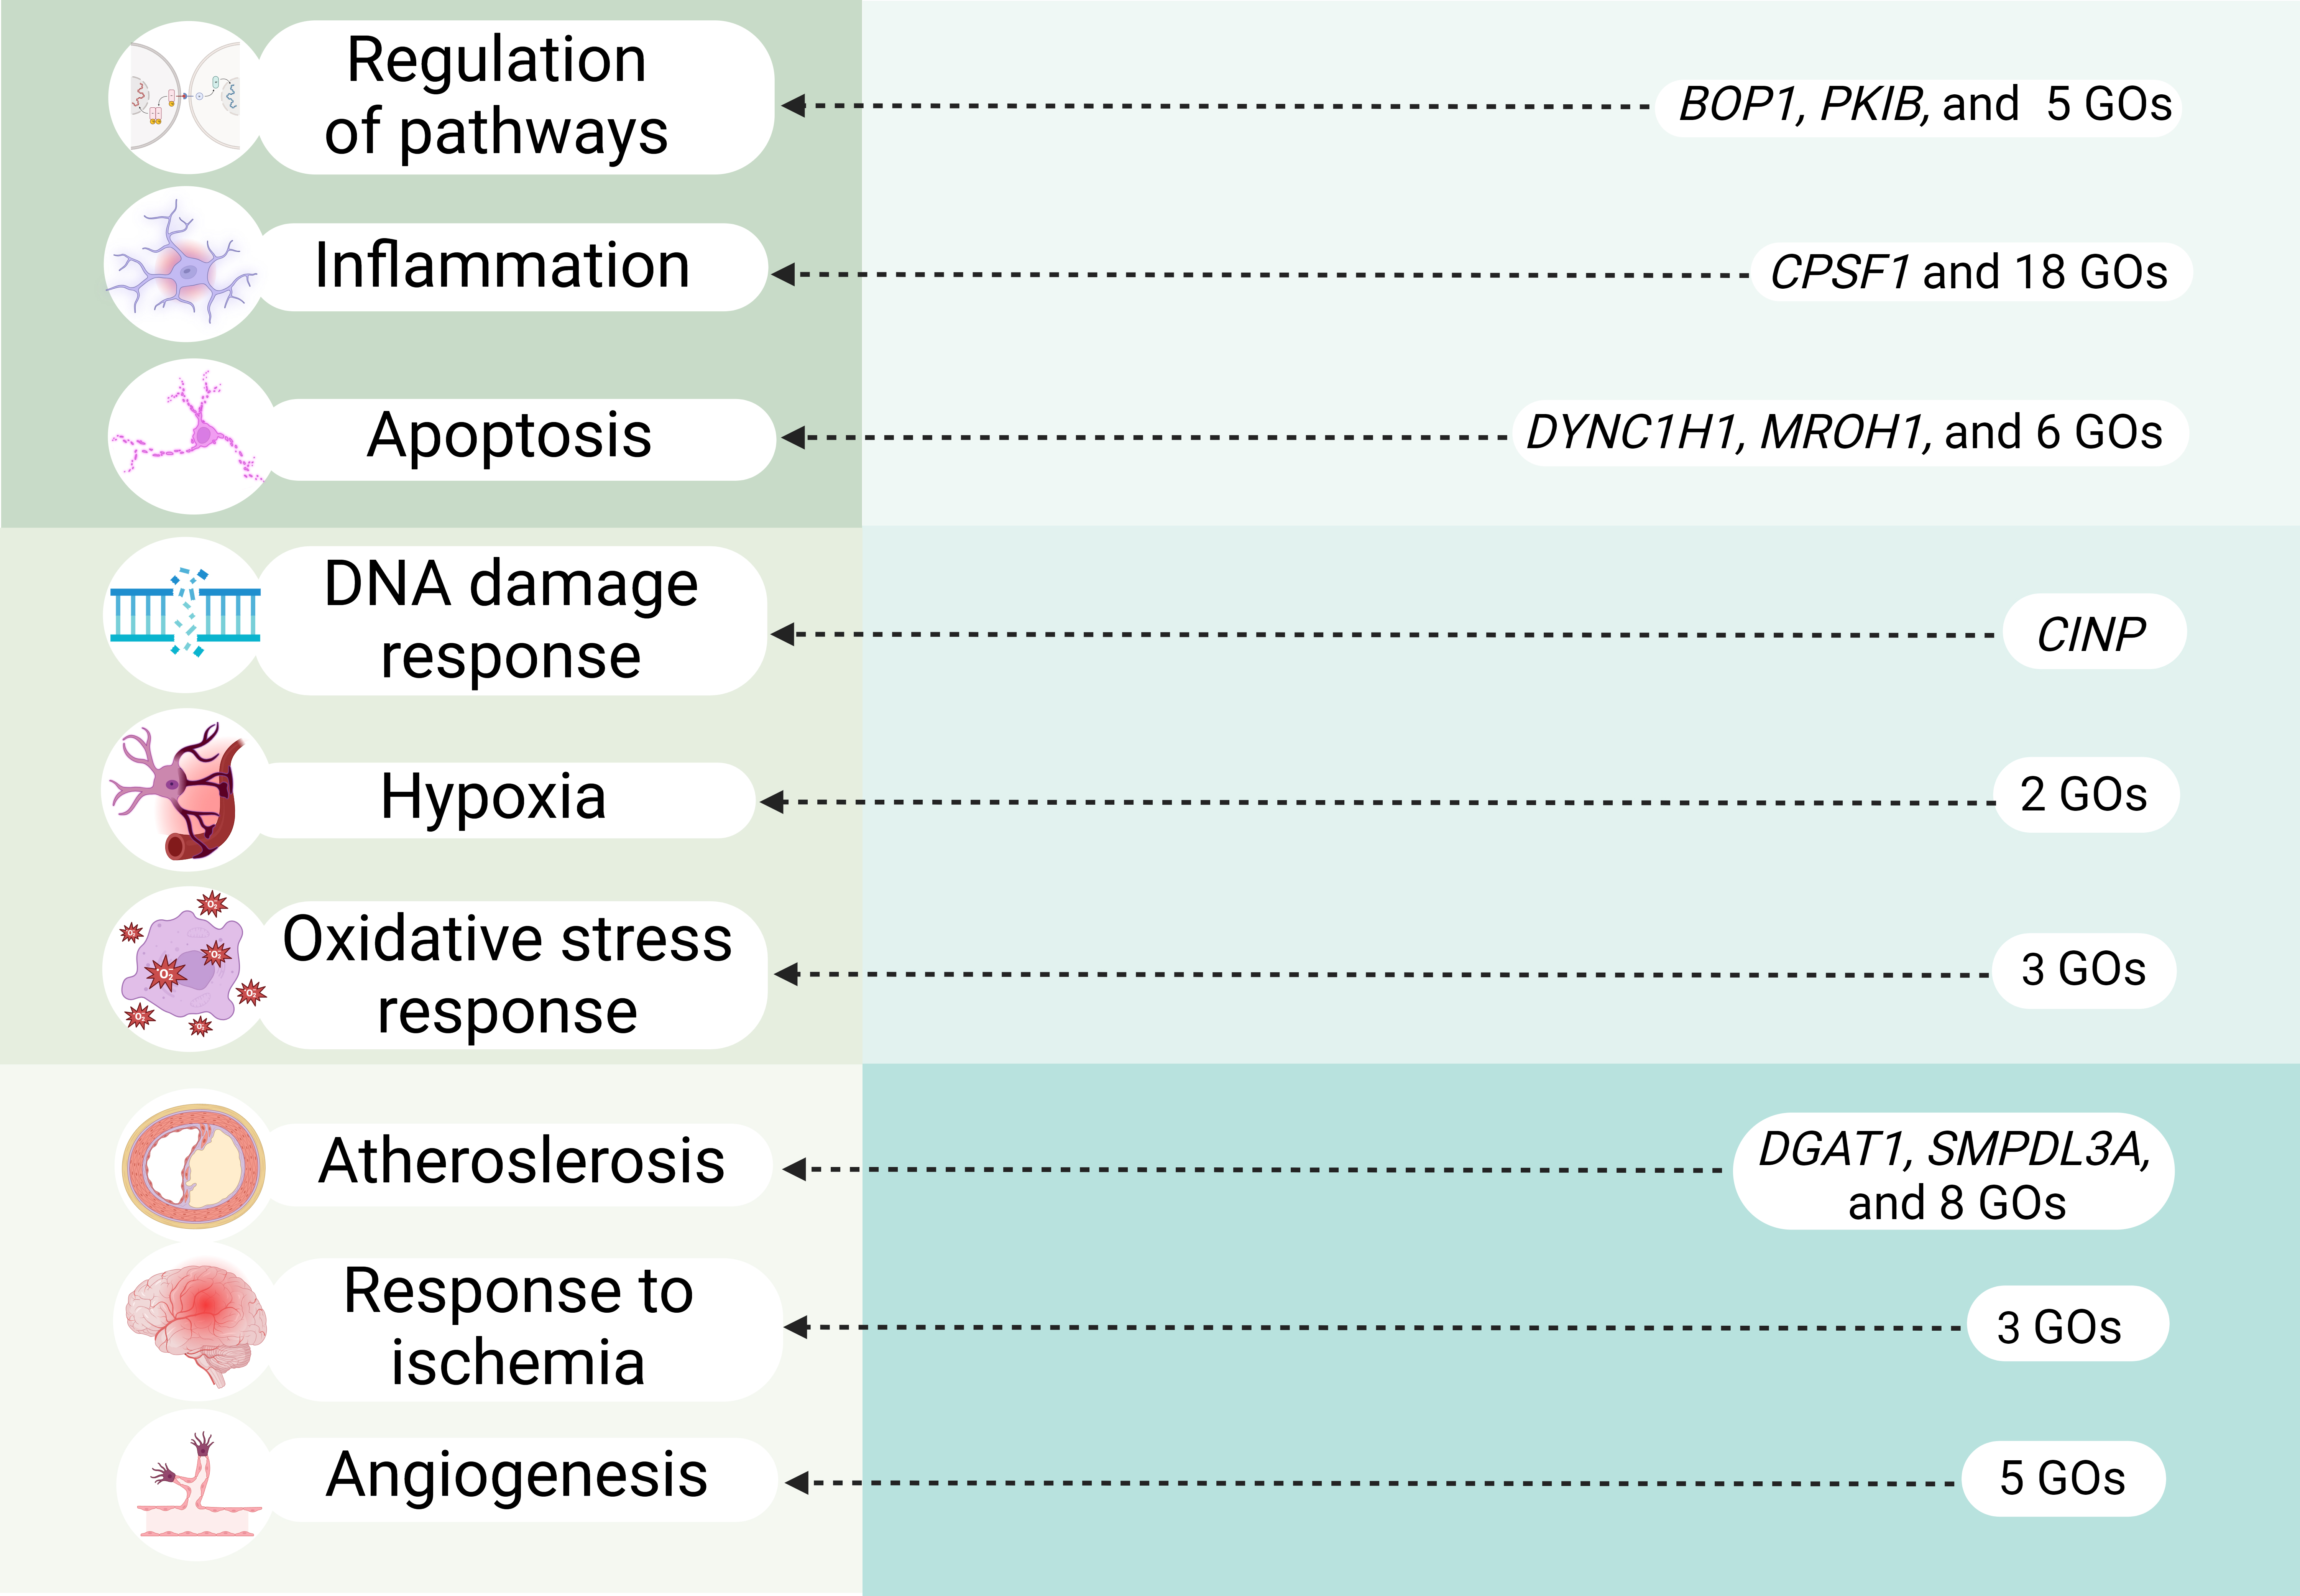
In our study we performed comprehensive analysis of HSP90, HSF and HSPB SNPs to establish their role in IS risk. Notably, our research is pioneering in its examination of associations between HSPs and clinical parameters of IS patients as well as of intergenic and gene-environment interactions involving these HSPs SNPs. Moreover, through functional annotation using a variety of bioinformatic resources, we explored the potential connections between these SNPs and the molecular mechanisms underlying IS (Fig. 5).
 Fig. 5.
Overview of key molecular mechanisms linked to IS-significant HSPs SNPs (cis-eQTL effects and transcription factors–associated overrepresented biological processes). GOs, Gene Ontologies. Created in BioRender.com.
Heat shock protein 90-alpha (HSP90AA1), a highly conserved essential molecular chaperon, highly expressed in brain, blood and arteries (GTEx Portal Data https://gtexportal.org/home/gene/HSP90AA1; accessed on July 20, 2024). Previous studies have shown that HSP90 is overexpressed in animal model of cerebral ischemia [53, 54] and in atherosclerotic plaques [55, 56]. Moreover, Hsp90 plays a vital role in ischemic preconditioning [57, 58] and postconditioning [59], as well as HSP90 regulates the activation of eNOS [60, 61].
We identified significant associations between HSP90AA1 SNPs and IS risk. Specifically, the allele C rs4264324 HSP90AA1 was found to reduce the INR and the risk of multiple strokes in non-smokers, while allele A rs7155973 HSP90AA1 increased APTT in overweight patients and demonstrated additive effects in combination with other SNPs and smoking in gene-environment interactions models.
Bioinformatics analysis showed that the cis-eQTL effects of HSP90AA1 SNPs are notable in relation to IS molecular mechanisms. Both studied SNPs decreased the expression levels of HSP90AA1 in blood via their cis-eQTL effects. rs4264324 HSP90AA1 was associated with increased the expression of DYNC1H1, a gene with crucial functions in cells, especially in neurons [62, 63] and primarily involved in retrograde axonal transport in neurons [64]. Defects in retrograde axonal transport lead to neurodegeneration and neuronal cell death [65]. Moreover, DYNC1H1 was linked to several neurological diseases [66, 67, 68]. SNP rs7155973 HSP90AA1 alters expression of CINP, identified as a cell-cycle checkpoint protein responsible for DNA damage response [69], a crucial pathway that determine sell survival, brain damage and recovery from stroke [70].
Moreover, allele A rs7155973 HSP90AA1 was characterized by mQTL effects in the brain’s prefrontal cortex, increasing methylation of three CpG sites, thereby further reducing HSP90AA1 expression.
The biological processes linked to transcription factors associated with HSP90AA1 SNPs also highlighted pathways relevant to IS, such as SMAD protein signal transduction (important for cerebral protection in ischemia/reperfusion injury [71]), calcineurin-mediated signaling (triggers apoptotic signaling [72]), canonical Wnt signaling pathway (maintains blood-brain barrier integrity during IS [73]), positive regulation of interleukin -4, -5, -13 production, regulation of CD8+ and CD4+, alpha-beta T cell activation, negative regulation of cytokine production (all these processes can be characterized as anti-inflammatory and neuroprotective [74]), response to hypoxia, regulation of apoptotic process. Interestingly, chromatin remodeling and chromatin looping were associated with TFs binding to rs7155973 HSP90AA1. Simultaneously, our data from HaploReg showed a high regulatory influence of this SNP on histones in blood and in brain tissues.
Stress-inducible expression of HSPs is primarily regulated by the activation of heat shock transcription factors, with HSF1 being the most prominent [29]. HSF1 activation has been observed in the brain following ischemic events [75], where it plays a protective role by reducing infarct size and apoptotic cell death after cerebral artery occlusion [76]. Additionally, HSF1 has been shown to enhance vascular endothelial function [77], and its reduced expression leads to increased cell death in the brain under hypoxia and reperfusion conditions without prior heat shock [78].
While HSF2 has traditionally not been considered stress-related [79], recent findings indicate that it plays a more significant role in stress conditions than previously thought. HSF2 interacts with HSF1 by forming heterocomplexes, thereby influencing the binding of HSF1 to heat shock elements [80]. Moreover, emerging research has revealed that HSF1 is crucial for inducing the expression of its paralog HSF2 during proteasome inhibition [81].
HSBP1, is especially significant for its neuroprotective properties; it has been shown that the transfer of HSPB1 in astrocytes and primary neuronal cells offers protection against apoptosis induced by oxidative stress, both in vitro and in vivo [82]. HSBP1 has also been extensively studied in the context of atherosclerosis. Patients with atherosclerosis often exhibit low levels of HSBP1 [83, 84, 85], while chronic overexpression of HSBP1 has been found to be atheroprotective [86]; HSBP1 exerts an indirect effect on the generation of inflammatory cytokines, likely by reducing the transformation of macrophages into foam cells, which is a key process in the development of atherosclerosis [87]. In the context of HSF SNPs, we found that the allele A rs556439 HSF2 increased the risk of IS in overweight, the T allele of rs4279640 HSF1 lowered the prothrombin index and reduced the risk of multiple strokes in non-smokers. Additionally, this SNP was characterized by the smallest mono-effect in gene-gene interaction models. The allele G rs549302 HSF2 increased the risk of IS in overweight, and lowered prothrombin time in patients with normal BMI, and increased the brain infarct size in smokers, and the allele A rs4522 HSBP1 lowered cholesterol levels in non-smokers.
The cis-eQTL effects of rs4279640 HSF1 highlighted its influence on the expression of genes like BOP1, CPSF1, MROH1, DGAT1 (Fig. 5). For instance, BOP1 regulates the MAPK pathway [88], which in turn activates inflammatory processes in cerebral ischemia [89, 90] and promotes the expression of apoptotic proteins enhancing neuronal cell death during cerebral infarction [91]; moreover MAPK pathway may be a key player in atherosclerosis [92, 93, 94], one of the major predictors of stroke [95]. Additionally, BOP1 is increased in the coronary arteries of patients with atherosclerosis leading to abnormal proliferation of vascular smooth muscle cells and atherosclerosis [96, 97, 98].
CPSF1 regulates alternative splicing of interleukin 7 receptor (IL7R) exon [99]. Interestingly, IL7R was upregulated in the peripheral blood of smoking IS-patients [100]. This up-regulation can contribute to worsened inflammation and atherosclerosis [101, 102, 103, 104] and explain one of the mechanisms contributing to the discovered association between rs4279640 HSF1 and lowered risk of multiple strokes in non-smokers. Recently MROH1 was discovered as a lysosome-fission factor, loss of which affects the acidity and proteolytic activity of lysosomes [105]. The downregulation of MROH1 can hypothetically disrupt proper functionality of lysosomes affecting neuronal survival in ischemia. DGAT1 is a key enzyme in the mammalian triglyceride synthesis pathway and was found to have atherogenic properties [106].
Moreover, SNPs rs556439 and rs549302 HSF2 significantly decreased expression of HSF2 and increased expression of PKIB (protein kinase A inhibitor), that directly binds to PKA’s (Protein kinase A) catalytic subunits. This heightened inhibition of PKA can potentially disrupt cAMP/PKA signaling, leading to destabilization of the endothelial barrier in response to oxidative stress and worsening atherosclerosis [107] (Fig. 5). Additionally, rs549302 HSF2 increased expression of SMPDL3A, cholesterol-regulated gene, expression of which is elevated in the atherosclerotic lesions in vivo and may be a specific feature of macrophage foam cells [108] (Fig. 5).
Observed eQTL and mQTL effects (increased methylation of one CpG site in brain prefrontal cortex) of SNP rs4522 HSBP1 result in a decreased expression of the gene itself.
The analysis of biological processes associated with TFs of HSFs’ SNPs broadens the list of mechanisms these SNPs contribute to the IS development: SNP rs4279640 HSF1 participates in cellular response to nicotine, positive regulation of leukocyte adhesion to vascular endothelial cell, cellular response to interleukin-6, regulation of interleukin-1 beta production, non-canonical and canonical NF-kappaB signal transduction, positive regulation of apoptotic process; SNP rs556439 HSF2 is involved in regulation of interleukin-12 production, cellular response to interleukin-1, negative regulation of stress-activated MAPK cascade, BMP signaling pathway, regulation of receptor signaling pathway via JAK-STAT, non-canonical and canonical NF-kappaB signal transduction, vascular associated smooth muscle cell differentiation, vasculogenesis, positive regulation of smooth muscle cell apoptotic process; SNP rs549302 HSF2 participates in cellular response to laminar fluid shear stress, arterial endothelial cell differentiation, positive regulation of ERAD pathway, BMP signaling pathway, interleukin-1-mediated signaling pathway, endoplasmic reticulum unfolded protein response, cellular response to hydrogen peroxide, response to hypoxia, positive regulation of cytokine production, negative regulation of apoptotic process. These listed processes are crucial in immune regulation and inflammatory responses (regulation of interleukins and cytokines production, NF-kappaB, MAPK, JAK-STAT signaling). Notably, interleukin-1 beta was previously linked to the development of arterial hypertension [109], a major risk factor for IS. Moreover, listed GOs can be associated with atherosclerosis development (regulation of leukocyte adhesion to vascular endothelial cell, laminar fluid shear stress [110, 111]), regulate apoptosis, response to hypoxia and ER stress. Biological processes associated with TFs of rs4522 HSBP1 allows us to determine the molecular effects predisposing to regulation of cholesterol levels (e.g., regulation of fatty acid metabolic process, negative regulation of lipid metabolic process) and the pathogenesis of IS like hippo signaling, negative regulation of apoptotic process, negative regulation of oligodendrocyte differentiation, neuron fate commitment (Fig. 5).
Small HSPs have different chaperone activities and are induced in stress conditions [112, 113, 114]. Among them, HSPB8 (HSP22) is particularly noted for its roles in regulating cell death [34]. HSPB8 is able to form stable complexes with the Bcl2-associated athanogene 3 (BAG3), which is thought to be the obligate partner of HSPB8 [35, 115]. HSPB8 expression is upregulated following cerebral ischemia/reperfusion injury, and its downregulation is associated with increased apoptosis [116]. BAG3 is believed to activate autophagy and inhibit apoptosis to prevent cerebral ischemia/reperfusion and hypoxia/reoxygenation injury [117].
We discovered that the allele A rs1133026 HSPB8 increased the risk of IS in smokers, the allele T rs7303637 HSPB8 increased the age of onset of IS, additionally in patients with normal BMI the allele T rs7303637 HSPB8 increased the triglyceride levels. Moreover, the most pronounced mono-effects and the maximum effects of intergenic interactions were observed with rs4522 HSPB1 and rs1133026 HSPB8.
The cis-eQTL effects of rs7303637 HSPB8 resulted in decreased expression of HSPB8. Additionally, SNP rs7303637 HSPB8 is linked to the development of atherosclerosis (e.g., pericyte cell differentiation [118], positive regulation of endothelial cell migration), apoptosis (e.g., regulation of extrinsic apoptotic signaling via death domain receptors, p53-mediated signal transduction), inflammation (e.g., negative regulation of cytokinesis, response to cytokine stimulus), and angiogenesis regulation (as established by the enrichment analysis of TFs). Furthermore, rs1133026 HSPB8 participates through TFs in the positive regulation of vascular smooth muscle cell apoptosis, angiogenesis regulation, neuron generation, negative regulation of neuron differentiation, and cellular response to hypoxia (Fig. 5).
In summary, our study offers novel insights into the genetic factors influencing IS risk, emphasizing the complex roles of HSP90, HSF, and HSPB SNPs in IS pathogenesis. We explored their intergenic and gene-environment interactions, established their influence on clinical characteristics of IS patients, performed comprehensive bioinformatic analysis to uncover potential molecular mechanisms contributing to IS risk. The associations identified in this study underscore the complex interplay between genetic variants, environmental factors, and IS risk.
Our study has several limitations. First, we lacked data on risk factors, such as alcohol consumption and high-fat diet, which limited our ability to include these as covariates in the association analysis, potentially overlooking their impact on IS risk. Second, although we performed a bioinformatic analysis of SNPs’ influence on gene expression, experimental validation would provide a more comprehensive understanding of gene roles in cerebrovascular events. Third, we did not conduct functional validation of risk SNPs in stroke-affected tissues or cell models, preventing us from confirming direct mechanistic links between SNPs and gene expression or activity. Finally, our study did not incorporate a longitudinal approach, which restricted our ability to evaluate how the identified risk SNPs might influence stroke susceptibility over time, as opposed to a single time-point assessment.
All data reported in this paper will also be shared by the corresponding author upon reasonable request.
OB designed the research study. MI and RG performed the research. KK and OB analyzed the data. KK and OB wrote the manuscript. All authors contributed to editorial changes in the manuscript. All authors read and approved the final manuscript. All authors have participated sufficiently in the work and agreed to be accountable for all aspects of the work.
The study was conducted according to the guidelines of the Declaration of Helsinki, and was approved by the Ethical Review Committee of Kursk State Medical University, Russia (Protocol No. 12 from 7.12.2015). All the patients or their families/legal guardians gave written informed consent before the enrollment in this study.
Not applicable.
This research was funded by Russian Science Foundation (№ 22-15-00288, https://rscf.ru/en/project/22-15-00288/).
The authors declare no conflict of interest.
Supplementary material associated with this article can be found, in the online version, at https://doi.org/10.31083/j.fbs1604019.
References
Publisher’s Note: IMR Press stays neutral with regard to jurisdictional claims in published maps and institutional affiliations.