


1 Department of Biochemistry, Faculty of Medical Science, Naresuan University, 65000 Phitsanulok, Thailand
2 Department of Anatomy, Faculty of Medicine, Chiang Mai University, 50200 Chiang Mai, Thailand
3 Department of Anatomy, Faculty of Medical Science, Naresuan University, 65000 Phitsanulok, Thailand
4 Department of Biochemistry, Faculty of Science, Mahidol University, 10400 Bangkok, Thailand
5 Department of Biochemistry, Faculty of Medicine, Khon Kaen University, 4002 Khon Kaen, Thailand
Abstract
Cholangiocarcinoma (CCA) is a malignancy of the bile duct epithelium that is commonly found in the Thai population. CCA has poor prognosis and a low survival rate due to the lack of early diagnosis methods and the limited effectiveness of current treatments. A number of oncogenic spliced-transcripts resulting from mRNA splicing errors have been reported in CCA, and aberrant mRNA splicing is suspected to be a key driver of this cancer type. The hyperphosphorylation of serine/arginine rich-splicing factors (SRSFs) by serine/arginine protein kinases (SRPKs) causes them to translocate to the nucleus where they facilitate gene splicing errors that generate cancer-related mRNA/protein isoforms.
The correlation between SRPK expression and the survival of CCA patients was analyzed using data from The Cancer Genome Atlas (TCGA) dataset. The effect of SRPK inhibitors (SRPIN340 and SPHINX31) on two CCA cell lines (KKU-213A and TFK-1) was also investigated. The induction of cell death was studied by Calcein-AM/PI staining, AnnexinV/7AAD staining, immunofluorescence (IF), and Western blotting (WB). The phosphorylation and nuclear translocation of SRSFs was tracked by WB and IF, and the repair of splicing errors was examined by Reverse Transcription-Polymerase Chain Reaction (RT-PCR).
High levels of SRPK1 and SRPK2 transcripts, and in particular SRPK1, correlated with shorter survival in CCA patients. SRPIN340 and SPHINX31 increased the number of dead and apoptotic cells in a dose-dependent manner. CCA also showed diffuse expression of cytoplasmic cytochrome C and upregulation of cleaved caspase-3. Moreover, SRSFs showed low levels of phosphorylation, resulting in the accumulation of cytoplasmic SRSF1. To link these phenotypes with aberrant gene splicing, the apoptosis-associated genes Bridging Integrator 1 (BIN1), Myeloid cell leukemia factor 1 (MCL-1) and B-cell lymphoma 2 (BCL2) were selected for further investigation. Treatment with SRPIN340 and SPHINX31 decreased anti-apoptotic BIN1+12A and increased pro-apoptotic MCL-1S and BCL-xS.
The SRPK inhibitors SRPIN340 and SPHINX31 can suppress the phosphorylation of SRSFs and their nuclear translocation, thereby producing BIN1, MCL-1 and BCL2 isoforms that favor apoptosis and facilitate CCA cell death.
Keywords
- alternative splicing
- apoptosis
- cholangiocarcinoma
- SRPK
- SRSF
Cholangiocarcinoma (CCA) is a severe type of cancer that arises from the uncontrolled growth of bile duct epithelium. CCA can be classified according to its anatomical origin into intrahepatic (iCCA) and extrahepatic (eCCA) types [1]. An increasing incidence of CCA has been reported globally, especially in the north and northeast regions of Thailand [2]. The main etiological factor is the consumption of undercooked freshwater fish contaminated with the infective stage of liver fluke, Opisthorchis viverrini (OV). The excretory/secretory products of OV contain important growth factors and growth stimuli. Other risk factors for CCA are exogenous carcinogens that generate cellular DNA damage, and repeated treatment with anti-parasitic drugs [3, 4]. Depending on the stage at diagnosis, CCA treatment strategies can include surgical resection, locoregional therapies, chemotherapy, and radiation therapy. Chemotherapy in combination with radiation has been shown to improve survival. The combination of Cisplatin and Gemcitabine is currently the first-line treatment for CCA [1]. However, most CCA patients are asymptomatic in the early stages of disease, thereby allowing tumor progression and metastasis to other organs. Consequently, the mortality rate for CCA patients has shown no significant improvement.
Aberrant alternative mRNA splicing in cancer cells results in the production of oncogenic isoforms of important genes and may be another hallmark of cancer [5]. The aberrant mRNA transcripts and their translatable proteins have unique properties that promote cell growth, differentiation and other cancer cell characteristics [6]. Several important oncogenic spliced genes have been reported in CCA. Cluster of differentiation 44 (CD44) produces CD44v6, which is related to tumor cell proliferation, and CD44v8-10, which is related to chemo-resistance. Wnt-Inducible Secreted Protein 1 (WISP1) produces WISP1v, which is related to migration-invasion ability, while Anterior Gradient-2 (AGR2) produces AGH2vH which is related to metastasis, epithelial-mesenchymal transition, and cell survival under stress [7, 8]. Another example of dysregulated mRNA splicing is the switching from a wild-type transcript with pro-apoptotic function in normal cells into oncogenic transcripts with survival functions in cancer cells. Bridging Integrator 1 (BIN1) is a tumor suppressor gene that functions by interacting with and inhibiting cellular myelocytomatosis oncogene (c-MYC). The inclusion of exon 12A of BIN1 generates a protein isoform that can no longer bind Myc, thus eliminating the tumor-suppressive function of BIN1 in melanoma, prostate and non-small cell lung cancer [9, 10, 11]. Myeloid cell leukemia factor 1 (MCL-1) is a member of the B-cell lymphoma 2 (BCL-2) family and splices into two opposite isoforms. The short isoform (MCL-1S) exhibits pro-apoptotic activity, whereas the long isoform (MCL-1L) functions as an anti-apoptotic factor in basal cell carcinoma, breast cancer and leukemia [12, 13, 14]. BCL-2L1 is a member of the BCL-2 family and generates two isoforms. BCL-xL prevents apoptosis, while BCL-xS promotes apoptosis in lung cancer, melanoma and breast cancer [15, 16, 17].
Serine/arginine-rich splicing factors (SRSFs) in the SR protein family serve as key molecules in the splicing machinery. The 12 SRSF members, SRSF1 to SRSF12, have different binding targets on pre-mature mRNA sequences [18]. The activation of SRSFs occurs after phosphorylation of serine/arginine-rich domains by serine-arginine protein kinases (SRPKs). The phosphorylated SRSFs then translocate from the cytoplasm to the nucleus to splice their specific pre-mature mRNA [19]. Dysregulation of SRSFs and SRPKs can lead to abnormal protein synthesis due to overexpression or functional alteration, thus revealing the oncogenic properties of the synthesized protein isoforms. A previous study on extra-nodal NK/T-cell lymphoma cells found that two SRPK inhibitors (SPHINX31 and SRPIN340) and siRNA can induce lymphoma cell death by increasing apoptosis, as shown by higher levels of Poly-Adenosine diphosphate ribose polymerase (PARP) and caspase-3 cleavage products [20]. Moreover, treatment with SRPIN340 decreased the phosphorylated forms of SRSF4, SRSF6, SRSF5, and SRSF2 in the HL60 and Jurkat human leukemic cell lines [21]. A similar result was also found after treatment of SPEC-2 endometrial cancer cells with SPHINX31. SRPK1 treatment reduced the level of phosphorylated SRSFs, which subsequently downregulated the survivin protein and increased PARP cleavage to enable SPEC-2 cell apoptosis [22]. The effect of SRPK inhibitors on specific SRSFs has previously been reported in a CCA cell line [23]. Treatment of HuCCA-1 cells with SPHINX31 decreased the phosphorylation and nuclear localization of SRSF1, which is the predominant SRSF in CCA.
The aim of this study was therefore to investigate the effects of two SRPK inhibitors (SRPIN340 and SPHINX31) on two CCA cell lines: KKU-213A, representing OV-associated iCCA, and TFK-1, representing non-OV associated eCCA. We evaluated the induction of cell death and apoptosis by these SRPK inhibitors. The effects of SRPK inhibitors on SRSF phosphorylation and on the nuclear translocation of SRSF1 protein were also investigated. Finally, splice gene variants for the apopotosis-related genes BIN1, MCL-1 and BCL2 were investigated as downstream targets of isoform switching, wherein the pro-apoptotic isoforms promote CCA cell apoptosis.
The KKU-213A cell line was established from a 58-year-old male diagnosed with iCCA at the Srinagarind Hospital, Khon Kaen University, Thailand, which the patients’ informed consent and the research protocol (HE621403) was formerly approved by the Ethics Committee for Human Research of Khon Kaen University [24]. KKU-213A is a highly invasive cell line and is OV-associated. TFK-1 was purchased from the cell bank of the RIKEN BioResource Research Center (BRC). This cell line was derived from a 63-year-old male with eCCA [25]. KKU-213A was cultured in Gibco™ Dulbecco’s Modified Eagle Medium (DMEM) (Thermo Scientific, Waltham, MA, USA), while TFK-1 was cultured in Gibco™ Roswell Park Memorial Institute (RPMI) 1640 Medium (Thermo Scientific, Waltham, MA, USA). All media contained 10% (v/v) Gibco™ fetal bovine serum (FBS, Thermo Scientific, Waltham, MA, USA), 100 Unit/mL penicillin and 100 µg/mL streptomycin. Cells were cultured in a humidified incubator (Thermo Scientific, Waltham, MA, USA) at 37 °C with a 5% CO2 atmosphere. The authenticity of the cell lines was validated using Short Tandem Repeat (STR) DNA profiling. All cell lines were free of mycoplasma and were periodically tested using the Mycoalert assay (Lonza, Rockland, ME, USA).
The two SRPK inhibitors, SRPIN340 and SPHINX31, were purchased from Cayman chemical (Cayman Chemical Company, Ann Arbor, MI, USA). Both were dissolved in dimethyl sulfoxide (DMSO) (Merck KGaA, Darmstadt, Germany) and stored at 4 °C. Cells were treated with various concentration of SRPK inhibitors (10 and 20 µM) for 18 h, with 0.5% (v/v) DMSO used as the vehicle control (0 µM of SRPK inhibitors).
The on-web analytic tool Gene Expression Profiling Interactive Analysis (GEPIA) based on The Cancer Genome Atlas (TCGA) and the Genotype-Tissue Expression (GTEx) datasets (http://gepia.cancer-pku.cn/) was used for survival analysis of SRPK1 and SRPK2 expression in CCA. Cholangiocarcinoma is abbreviated as CHOL in GEPIA, while liver hepatocellular carcinoma is abbreviated as LIHC. The number of CHOL samples in the dataset is 36 tumor tissues and 9 normal tissues, while the number of LIHC samples is 369 tumor tissues and 160 normal tissues. Box-plot analysis was used to illustrate differences in SRPK1 and SRPK2 expression (transcripts per million, TPM) between tumor (T) and normal (N) tissues. The relationship between SRPK1 or SRPK2 expression and the overall survival of CHOL patients was also analysed.
Cells were cultured in 96-well plates (1.6
Cells were cultured in a 24-well plate (1
Cells were cultured (5
For the extraction of whole cell lysate proteins, total cells from each treatment group were lysed in radio-immunoprecipitation (RIPA) buffer (Thermo scientific, Waltham, MA, USA) containing phosphatase inhibitor (Merck KGaA, Darmstadt, Germany) and protease inhibitor (Thermo scientific, Waltham, MA, USA). For protein fractionation, cells were lysed in Buffer A (10 mM HEPES KOH pH 7.9, 1.5 mM MgCl2, 10 mM KCl, 0.1% NP-40, 0.5 mM DTT) and centrifuged at 5000 rpm for 1 min at 4 °C to collect cytoplasmic proteins in the supernatant. The pellets were subsequently extracted with Buffer B (50 mM HEPES KOH pH 7.9, 10% glycerol, 420 mM NaCl, 5 mM MgCl2, 10 mM KCl, 0.1 mM EDTA, 1 mM DTT), sonicated, and then centrifuged at 15,000 rpm for 15 min, at 4 °C to collect nuclear proteins in the supernatant [26]. The Bradford assay was used to measure the protein concentration of extracted or fractionated samples. Bradford solution (Bio-Rad laboratories, Hercules, CA, USA) (200 µL) was mixed with 1 µL of protein sample (10-fold dilution), or with increasing concentrations (0, 0.1, 0.2, 0.3, 0.4, and 0.5 mg/mL) of bovine serum albumin (BSA; Capricorn scientific, Ebsdorfergrund, Germany) used as a standard. Absorbance was measured at 595 nm to calculate the protein concentration.
Equal amounts of protein from each treatment group were separated using SDS-PAGE (5% stacking gel and 12–15% separating gel), transferred to PVDF membrane (Bio-Rad laboratories, Hercules, CA, USA), and blocked using 5% BSA (Capricorn scientific, Ebsdorfergrund, Germany). The PVDF membranes were incubated overnight at 4 °C with the following primary antibodies: 1:1000 rabbit anti-human cleaved caspase-3 (Cell signaling Technology, Danvers, MA, USA), 1:10,000 rabbit anti-human GAPDH (Merck KGaA, Darmstadt, Germany), 1:1000 mouse anti-phosphoepitope SR protein (Merck KGaA, Darmstadt, Germany), 1:1000 rabbit anti-human beta-actin (Cell signaling Technology, Danvers, MA, USA), 1:10,000 mouse anti-human SRSF1 (Thermo scientific, Waltham, MA, USA), or 1:1000 rabbit anti-human Lamin B1 (Cell signaling Technology, Danvers, MA, USA). They were subsequently probed with HRP-conjugated goat anti-mouse IgG (Merck KGaA, Darmstadt, Germany), or HRP-conjugated goat anti-rabbit IgG (Merck KGaA, Darmstadt, Germany) for 1 h. Protein bands were detected using the enhanced chemiluminescence (ECL) detection system (Bio-Rad laboratories, USA) and imaged by ImageQuantTM LAS 500 (GE Healthcare Life Science, Amersham, UK). The immobilon® ECL ultra-western HRP substrate (Merck KGaA, Darmstadt, Germany) was used to enhance the signal strength of nuclear fractionated proteins samples. The signal intensity of each band was quantified using Image J software (Version 1.54, National Institutes of Health (NIH)’s Center for Information Technology, Bethesda, MD, USA) and the PVDF membranes were imaged using the Amersham ImageQuant™ 800 biomolecular imager (Cytiva, Amersham, UK). Lastly, the signal intensity of each band was quantified by ImageJ software and normalized to GAPDH, beta-actin or Lamin B1 protein expression.
RNA samples were isolated from harvested cells in each treatment group using the
E.Z.N.A.® Total RNA Kit 1 (Omega Bio-Tek, Inc., Norcross, GA,
USA). The RNA concentration was measured by NanoDrop 2000 (Thermo scientific
Wilmington, DE, USA) and 1 µg was used to synthesize complementary DNA
(cDNA) with the iScript™ Reverse Transcription Supermix (Bio-Rad
Laboratories, Hercules, CA, USA) according to the manufacturer’s instructions.
Quantitative PCR was performed to determine the mRNA expression level of target
genes. Reaction mixtures (20 µL) were prepared using 200 ng cDNA,
0.4 µM of each of the forward and reverse primers, and 1X MyTaqTM HS
Red Mix (Bioline Reagents Limited, London, UK). Sequences for the PCR primers of
each target gene are shown in Table 1. Thermocycling conditions consisted of 5
min pre-denaturation at 95 °C, 40 cycles of 95 °C for 30 sec,
62 °C for 30 sec and 72 °C for 30 sec for cycling
amplification, and 72 °C for 5 min for final extension. PCR
amplification products were mixed with 6
| Primer name | Sequence (5 |
bases | product size (bp) |
| BIN1_All | Forward: TGA TGT GGT GCT GGT GAT CC | 20 | 311 |
| Reverse: GAC CTA ATC TTT GGG AGA ACG CC | 23 | ||
| BIN+12A | Forward: GGC CCA GCC CAG AAA GAA AAG TA | 23 | 214 |
| Reverse: GCC TTT CCG GAG CTG AGA TGG G | 22 | ||
| MCL-1L | Forward: GGA CAC AAA GCC AAT GGG CAG GT | 23 | 426 |
| MCL-1S | Reverse: GCA AAA GCC AGC AGC ACA TTC CTG A | 25 | 178 |
| BCL-xL | Forward: AGT AAA GCA AGC GCT GAG GGA G | 22 | 439 |
| BCL-xS | Reverse: ACT GAA GAG TGA GCC CAG CAG A | 22 | 250 |
| Beta-actin | Forward: AGT CGG TTG GAG CGA GCA TC | 20 | 295 |
| Reverse: GGG CAC GAA GGC TCA TCA TT | 20 |
BIN1, Bridging Integrator 1; MCL-1, Myeloid cell leukemia factor 1; BCL, B-cell lymphoma.
Data were presented as the mean
Intrahepatic CCA is a malignant epithelial neoplasm characterized by biliary differentiation within the liver. The anatomical origins of intrahepatic CCA overlap with those of liver cancer, thus limiting the application of differential screening by ultrasound and Computed Tomographic scan. Furthermore, the cancer registry database of the National Cancer Institute of Thailand reports that combined liver and bile duct cancer is the most common cancer type in the Thai population. The expression level (TPM counts) of SRPK1 and SRPK2 in tumor (T) and normal adjacent (N) tissues from the TCGA databases were compared using the GEPIA on-line web tool. In CHOL, both SRPK1 and SRPK2 expression were significantly higher in T compared to N tissue (Fig. 1A). In LIHC, the average expression of both SRPK1 and SRPK2 was higher in T compared to N tissues, but the difference was not statistically significant (Fig. 1B). The correlation of gene expression with the overall survival of CHOL patients was also analyzed. High SRPK1 expression was associated with shorter overall survival (50% survival after 10–15 months vs. 40 months for low expression), with a hazard ratio for death of 2.3 (Fig. 1C). High SRPK2 expression was not significantly related to overall survival (Fig. 1D).
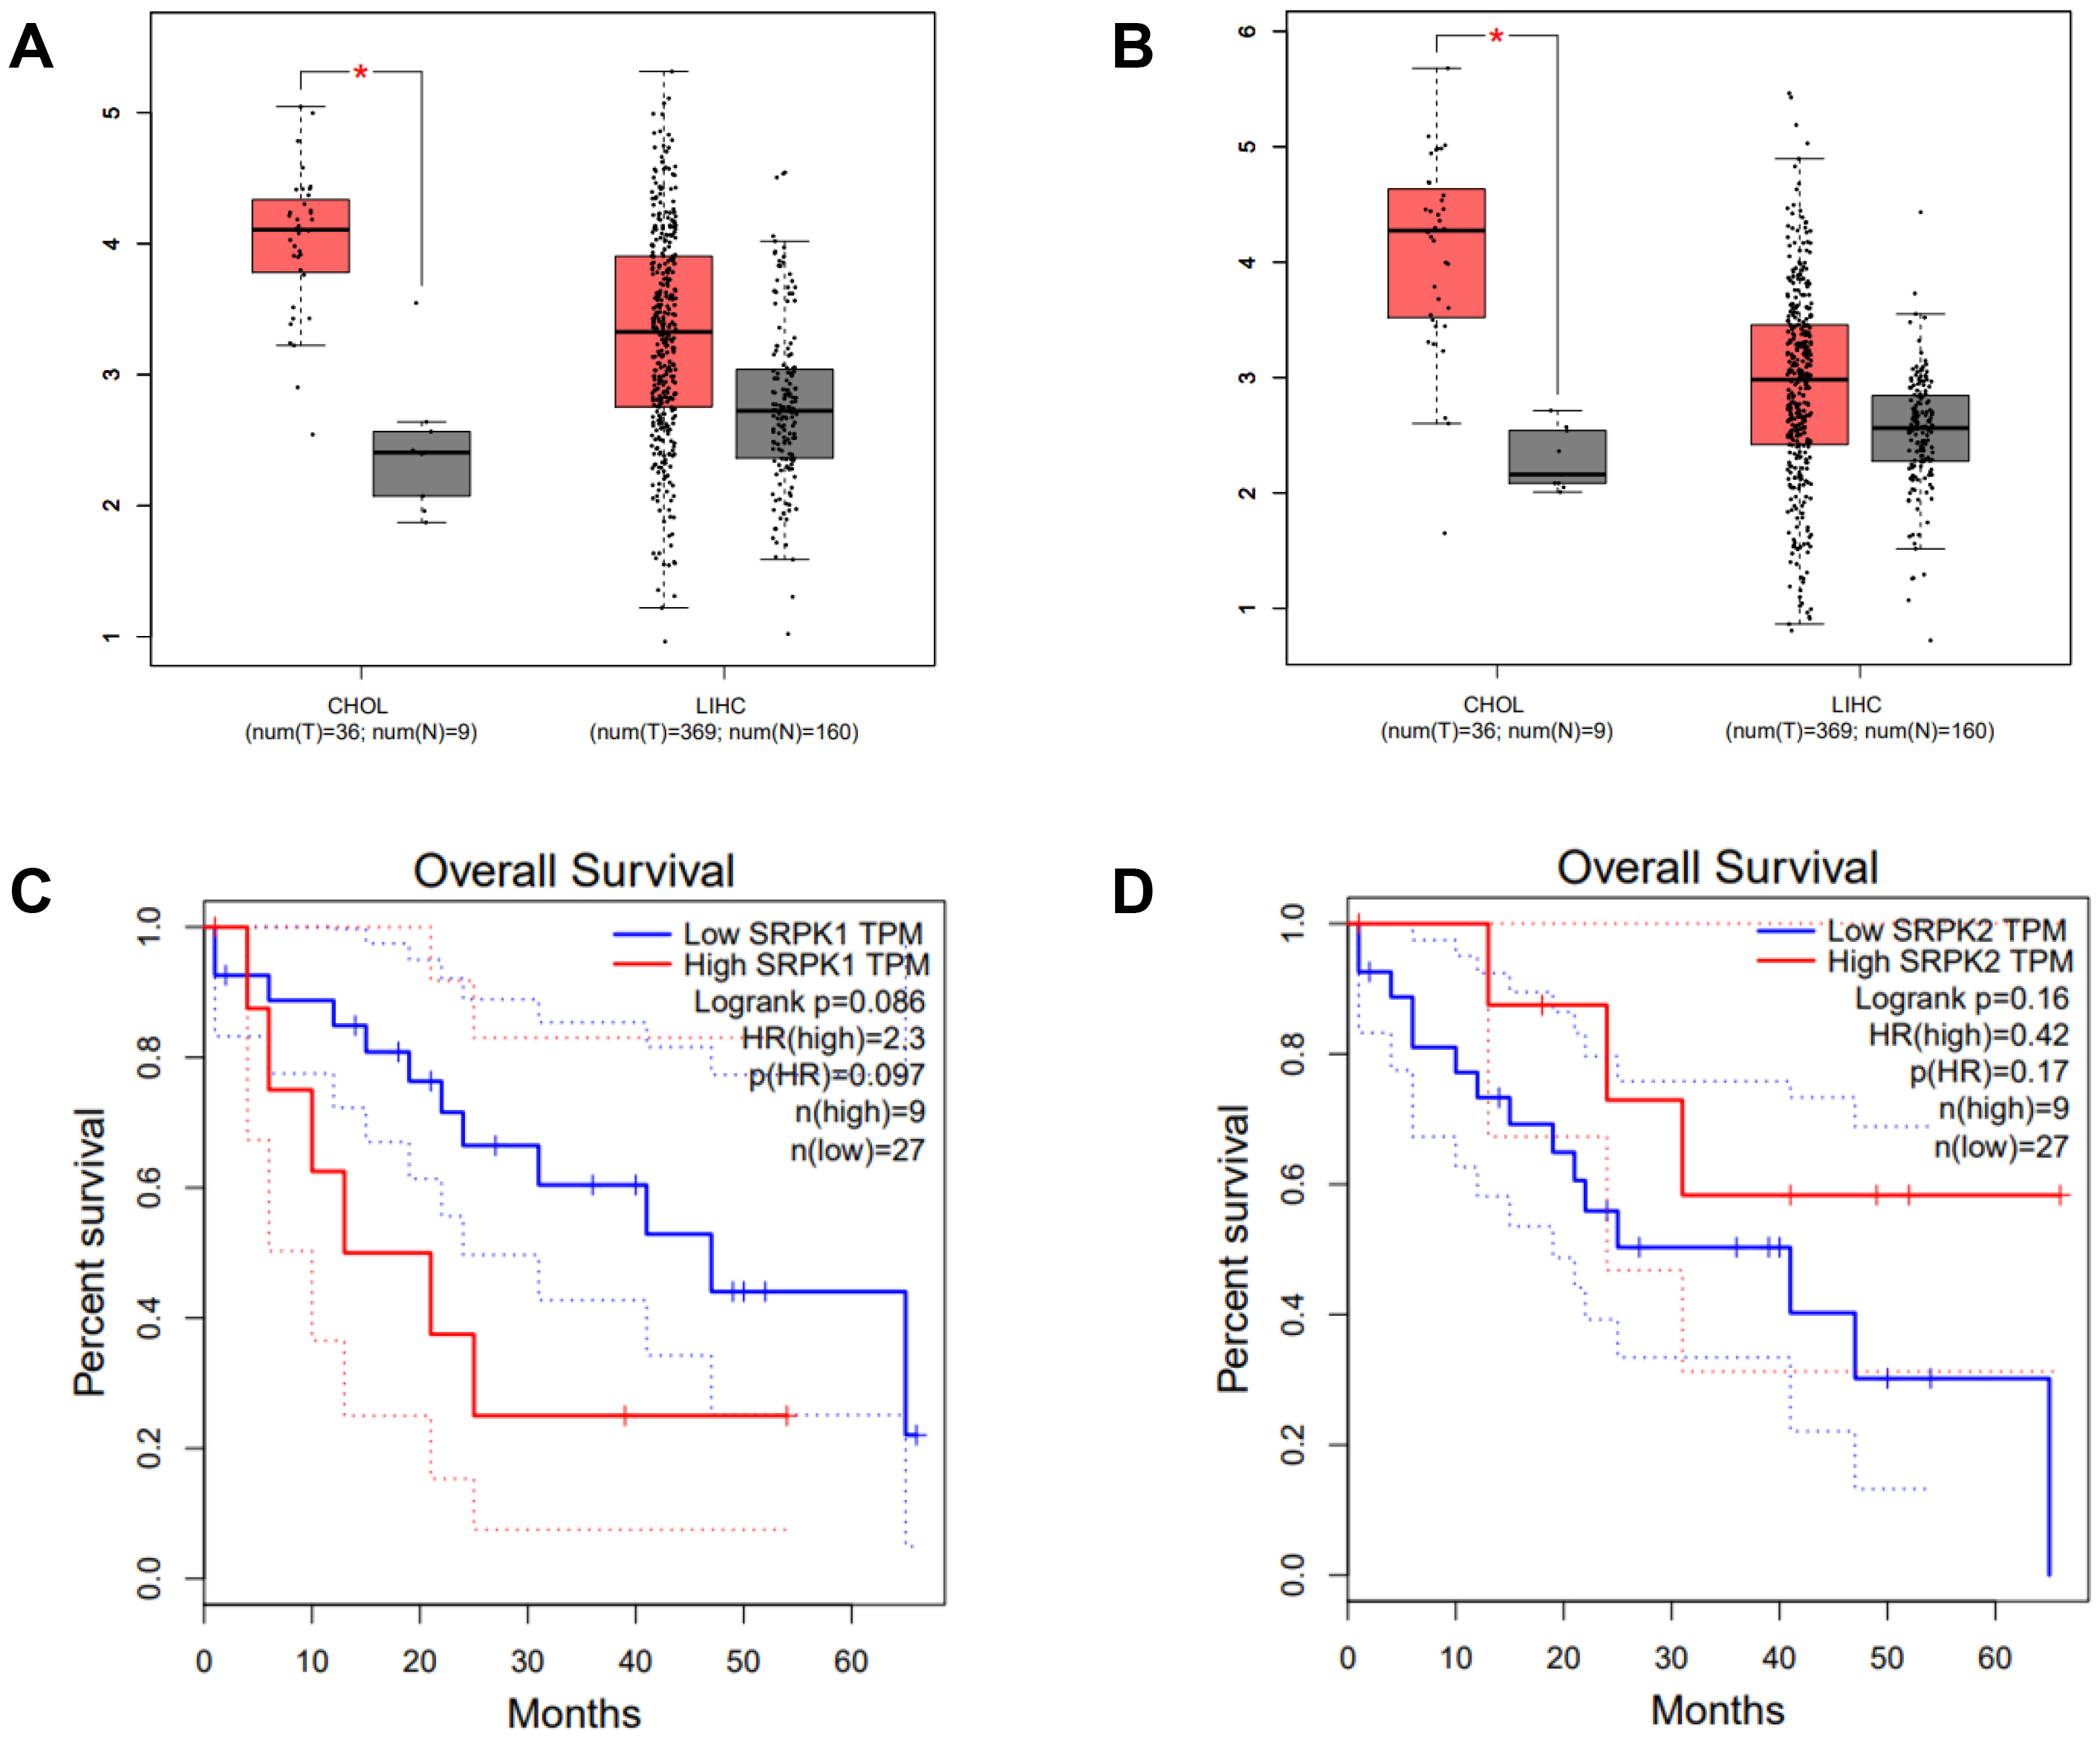 Fig. 1.
Expression of SRPK1 and SRPK2 (transcripts per
million, TPM), and correlation with the survival of CHOL patients (TCGA dataset,
GEPIA analysis). Box-plot analysis comparing the expression levels of
SRPK1 (A) and SRPK2 (B) in the cancer tissue of CHOL and LIHC
patients. Tumor tissue (T; red box), normal adjacent tissue (N; grey box).
Overall survival of CHOL patients according to high and low expression of
SRPK1 (C), and SRPK2 (D). High SRPK1 expression was
associated with a significantly worse survival rate (HR = 2.3) (C), whereas high
SRPK2 expression showed no significant association with survival (D).
*p
We next studied the effect of SRPK inhibitors on the induction of CCA cell
death. The differential live/dead cell count was monitored by dual staining. In
viable cells, the esterase enzyme catalyzes calcein into calcein-am, which emits
green fluorescence. Moreover, PI passes through the nuclear membrane and binds to
the DNA of dead cells, emitting red fluorescence. In both KKU-213A (Fig. 2A) and
TFK-1 (Fig. 2B) cells, the confluence of stained viable cells decreased following
treatment with SRPK inhibitors (as observed by fluorescence microscopy,
20
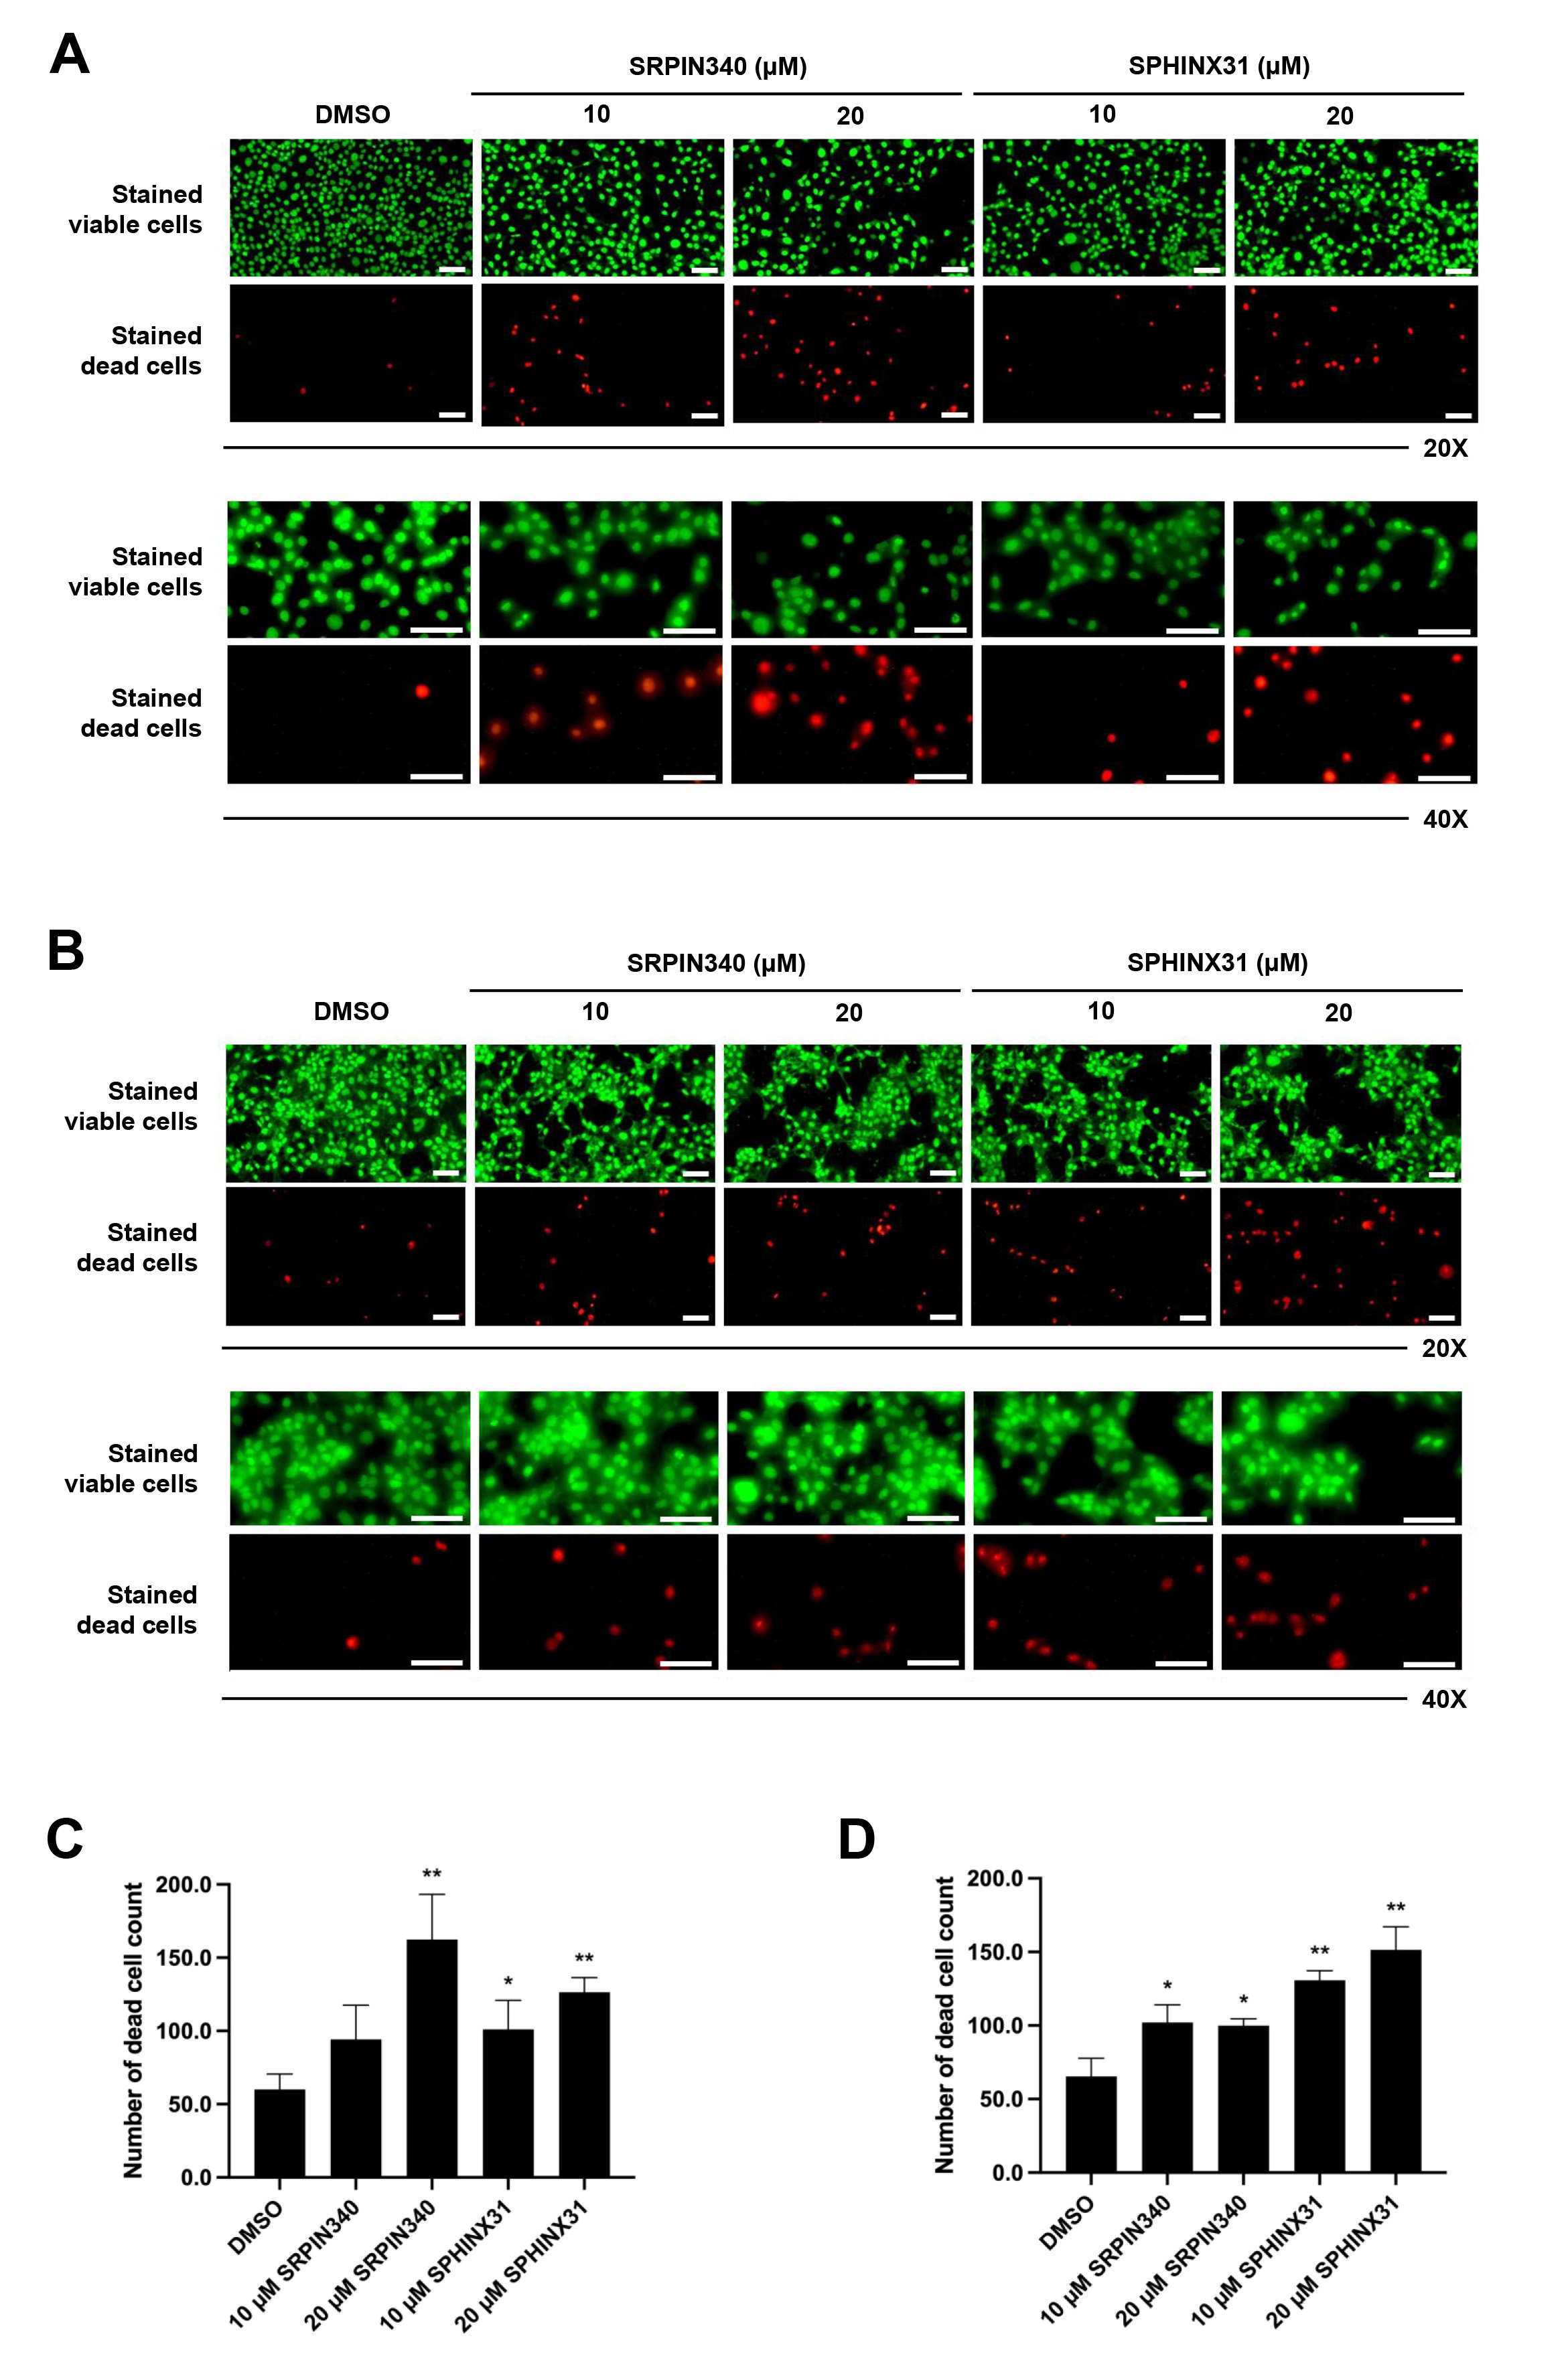 Fig. 2.
Effects of SRPIN340 and SPHINX31 on the induction of
CCA cell death. Fluorescence microscopy images of live/dead cell dual staining
of CCA cells treated with the SRPK inhibitors SRPIN340 and SPHINX31 (20
The dead cell phenotype of CCA cells following treatment with SRPK inhibitors
was investigated by flow cytometry after AnnexinV/7-AAD staining. Treated cells
were stained and classified into four staining quadrants. High annexinV staining
but low 7-AAD staining was gated as early apoptosis, whereas positive staining
for both annexinV and 7-AAD was gated as late-stage apoptosis. For KKU-213A, an
increasing number of early apoptotic cells was observed after treatment with the
SRPK inhibitors, especially with 20 µM SPHINX31 (Fig. 3A). For TFK-1,
dose-dependent effects were observed with both SRPIN340 and SPHINX31, with a
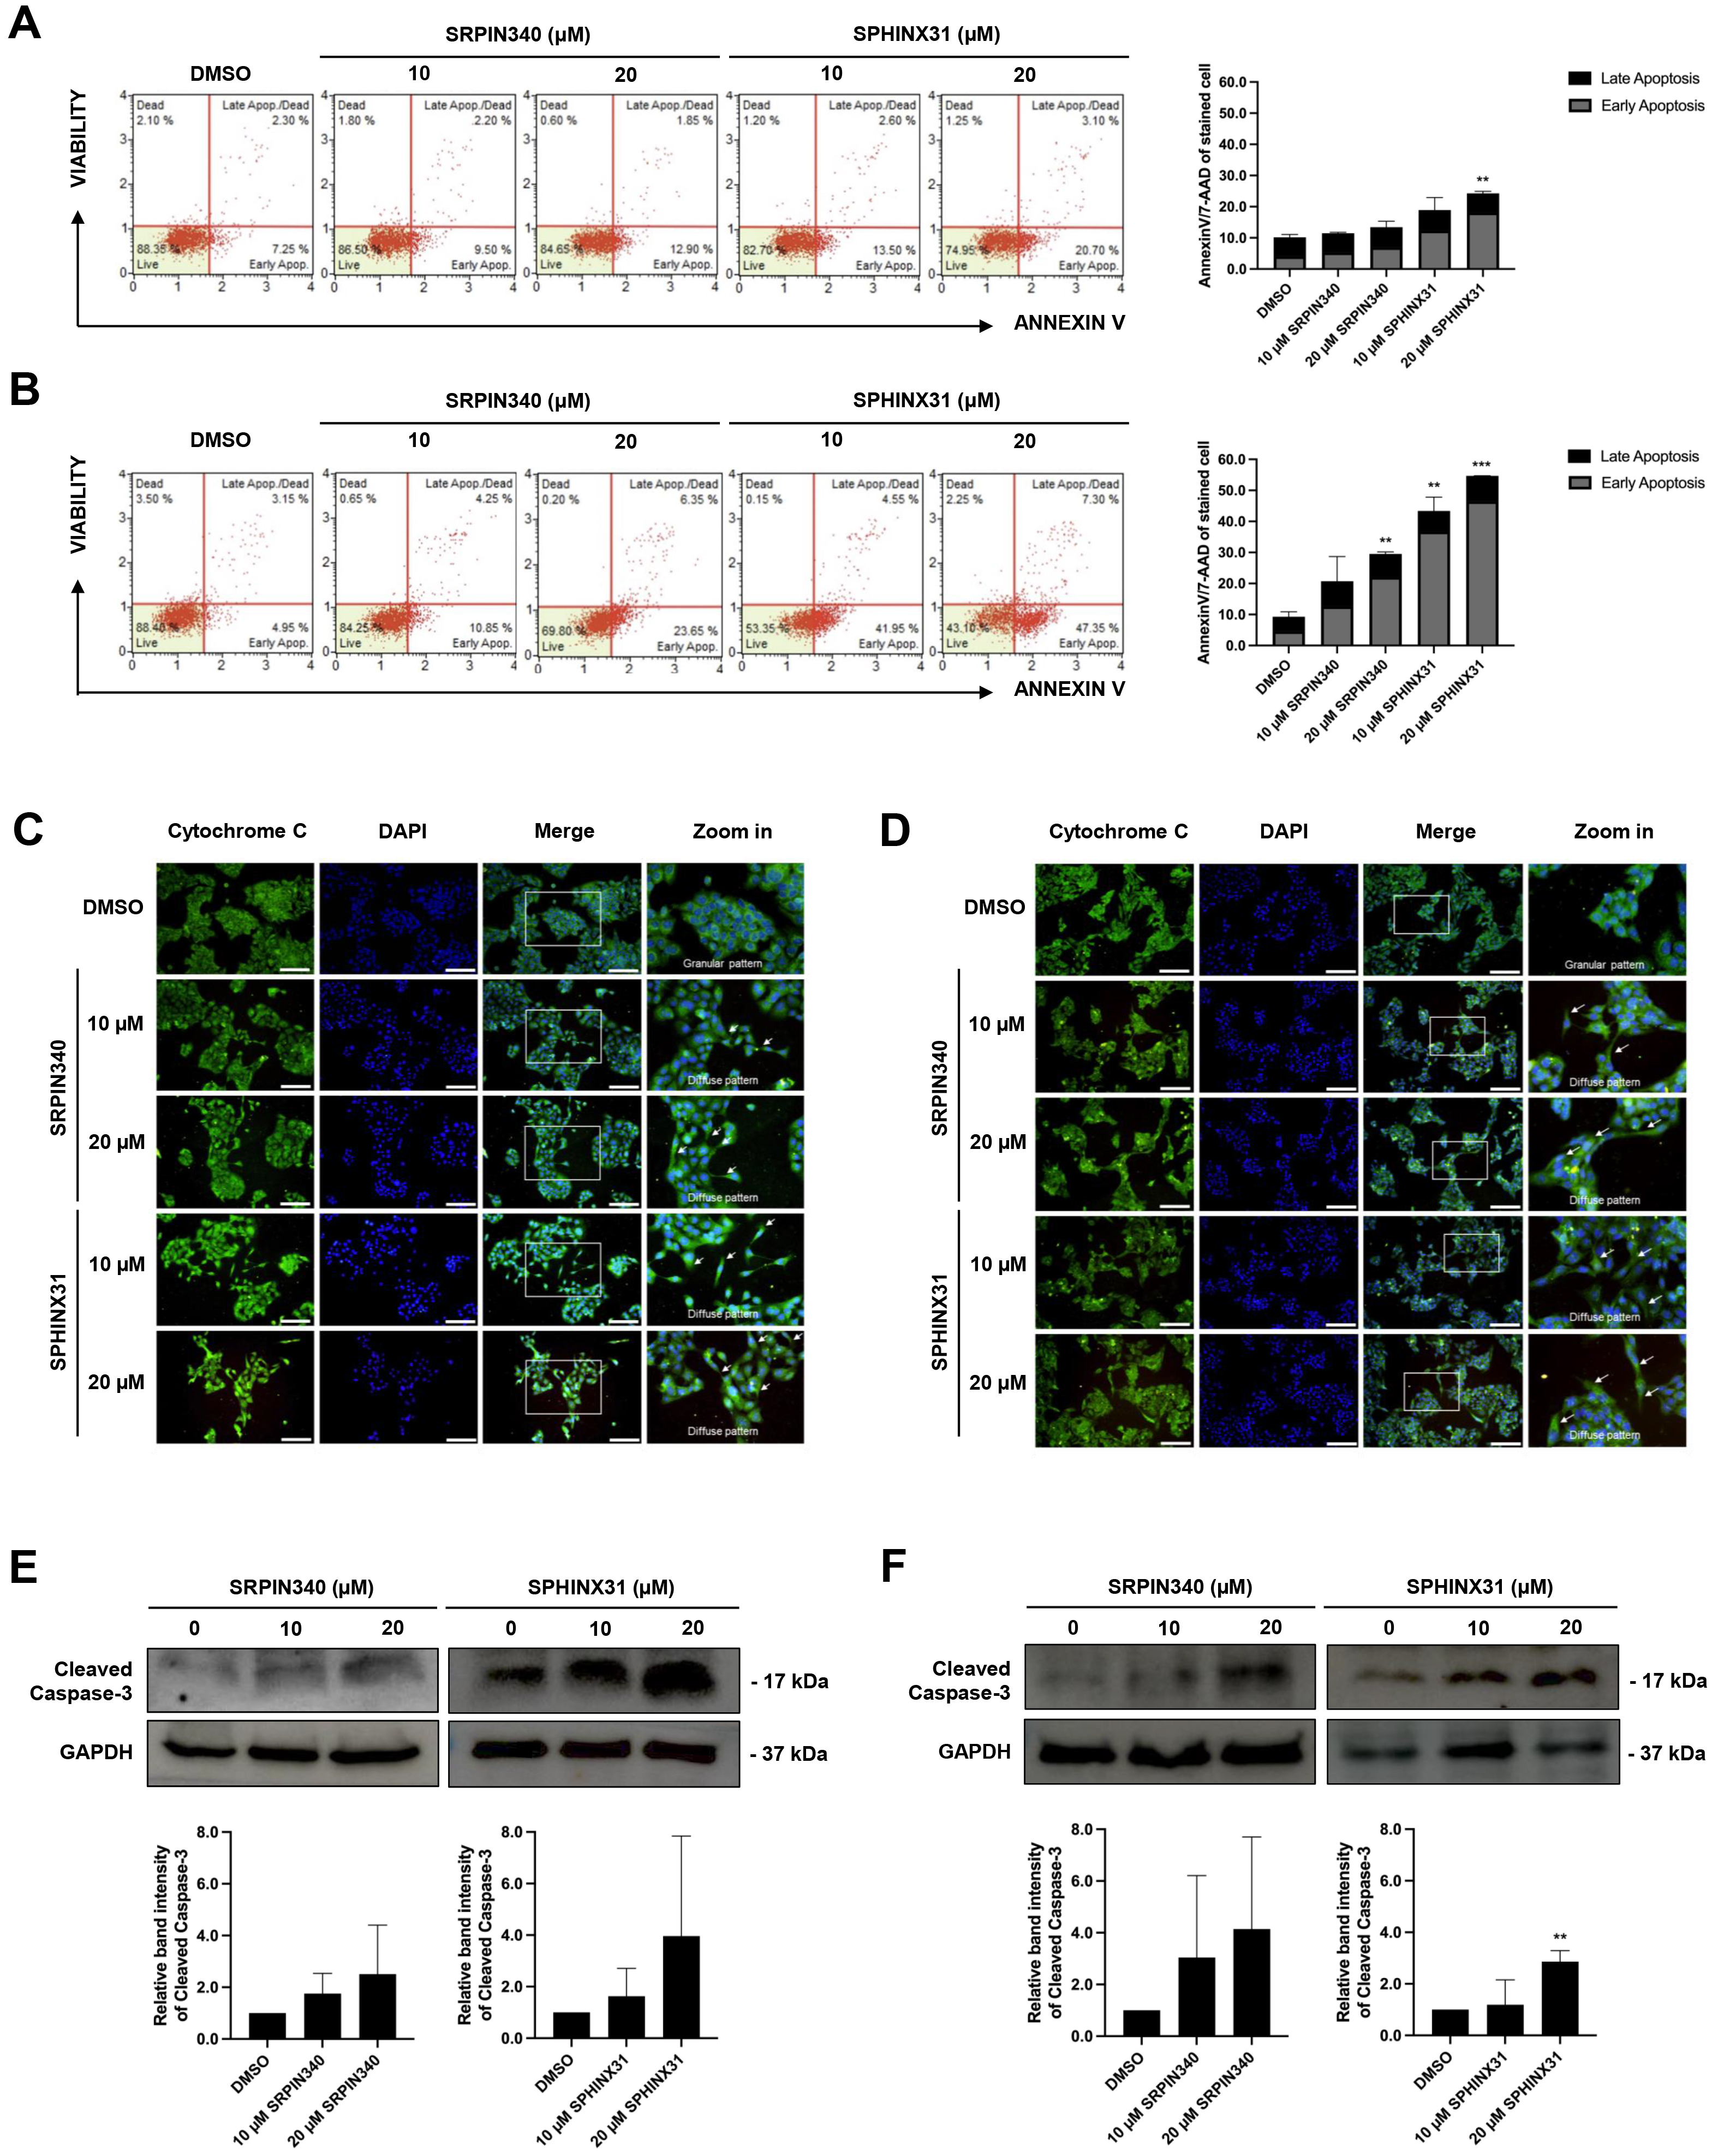 Fig. 3.
Effect of SRPIN340 and SPHINX31 on CCA cell apoptosis.
AnnexinV/7-AAD staining coupled with flow cytometry was used to gate apoptotic
cell populations after SRPIN340 or SPHINX31 treatment of KKU-213A (A) and TFK-1
(B) cells. The percentage of cells in each staining quadrant was calculated and
is shown in the bar graph. Early apoptosis is represented as grey color, and late
apoptosis as black color. Immunofluorescence (IF) was used to track mitochondrial leakage of
cytochrome C, thus allowing the evaluation of apoptotic induction in KKU-213A (C)
and TFK-1 (D) cells following treatment with SRPIN340 or SPHINX31. The white arrows indicate the diffuse pattern of cytoplasmic cytochrome C. Western blot
analysis of cleaved caspase-3 was performed to assess the induction of
caspase-dependent apoptosis in KKU-213A (E) and TFK-1 (F) cells treated with
SRPIN340 or SPHINX31. Statistical analysis was performed on data from three
independent experiments. Scale bar = 100 µm. **p
Cytochrome C is a mitochondrial protein that is released into the cytosol to form the apoptosome, which subsequently activates caspase enzymes. IF and confocal microscopy were used here to assess the intracellular diffusion of cytochrome C, with green fluorescence representing the localization of cytochrome C and merging with DAPI to mark the nuclei. Untreated controls revealed perinuclear staining with cytoplasmic spots (granular pattern) representing cytochrome C localized in the mitochondria. Following treatment with SRPIN340 or SPHINX31, a diffuse cytoplasmic staining pattern was observed for cytochrome C in KKU-213A (Fig. 3C) and TFK-1 (Fig. 3D) cells. Moreover, lower confluencies were observed for the treated cells in a dose-dependent-manner.
Caspase-3 is a pro-apoptotic protein. Once cleaved, it is responsible for the majority of proteolysis that occurs during apoptosis. The expression of cleaved caspase-3 was determined here by Western blotting. The results showed trends for increased levels of cleaved caspase-3 relative to controls following the treatment of KKU-213A and TFK-1 cells with SRPK inhibitors (Fig. 3E,F). Quantification of the protein band intensity revealed that treatment with 20 µM SPHINX31 significantly increased the level of cleaved caspase-3 expression in TFK-1 cells (Fig. 3F).
SRPKs are responsible for the phosphorylation of SRSFs, thereby inducing the nuclear localization of SRSFs and their ability to act as splicing factors. We investigated the effect of SRPK inhibitors on the phosphorylation of SRSF proteins in CCA cells by performing Western blot analysis with an anti-phosphoepitope SR protein antibody. These phosphoepitopes are present in each of the SRSF1-SRSF12 domains, but can be distinguished by differences in the molecular weight (MW) of the various pSRSFs.
The apoptotic cell populations and apoptotic protein activation in TFK-1 cells were investigated following treatment with SRPIN340 and SPHINX31 (Fig. 3B,D,F). Decreased expression of proteins with an approximate MW of 32, 35 and 40 kDa was observed following treatment with 10 µM and 20 µM SRPIN340, and with 10 µM SPHINX31, relative to vehicle controls (Fig. 4A). These protein bands were predicted to be pSRSF1/pSRSF12, pSRSF2/pSRSF7, and pSRSF5/pSRSF10, respectively, according to their MW. SRPIN340 significantly decreased the phosphorylation of pSRSF5/pSRSF10, pSRSF2/pSRSF7 and pSRSF1/pSRSF12 in a dose-dependent manner. Treatment with 10 µM SPHINX31 significantly decreased the phosphorylation of pSRSF2/pSRSF7 and pSRSF1/pSRSF12, with the trend increasing at 20 µM SPHINX31 (Fig. 4B).
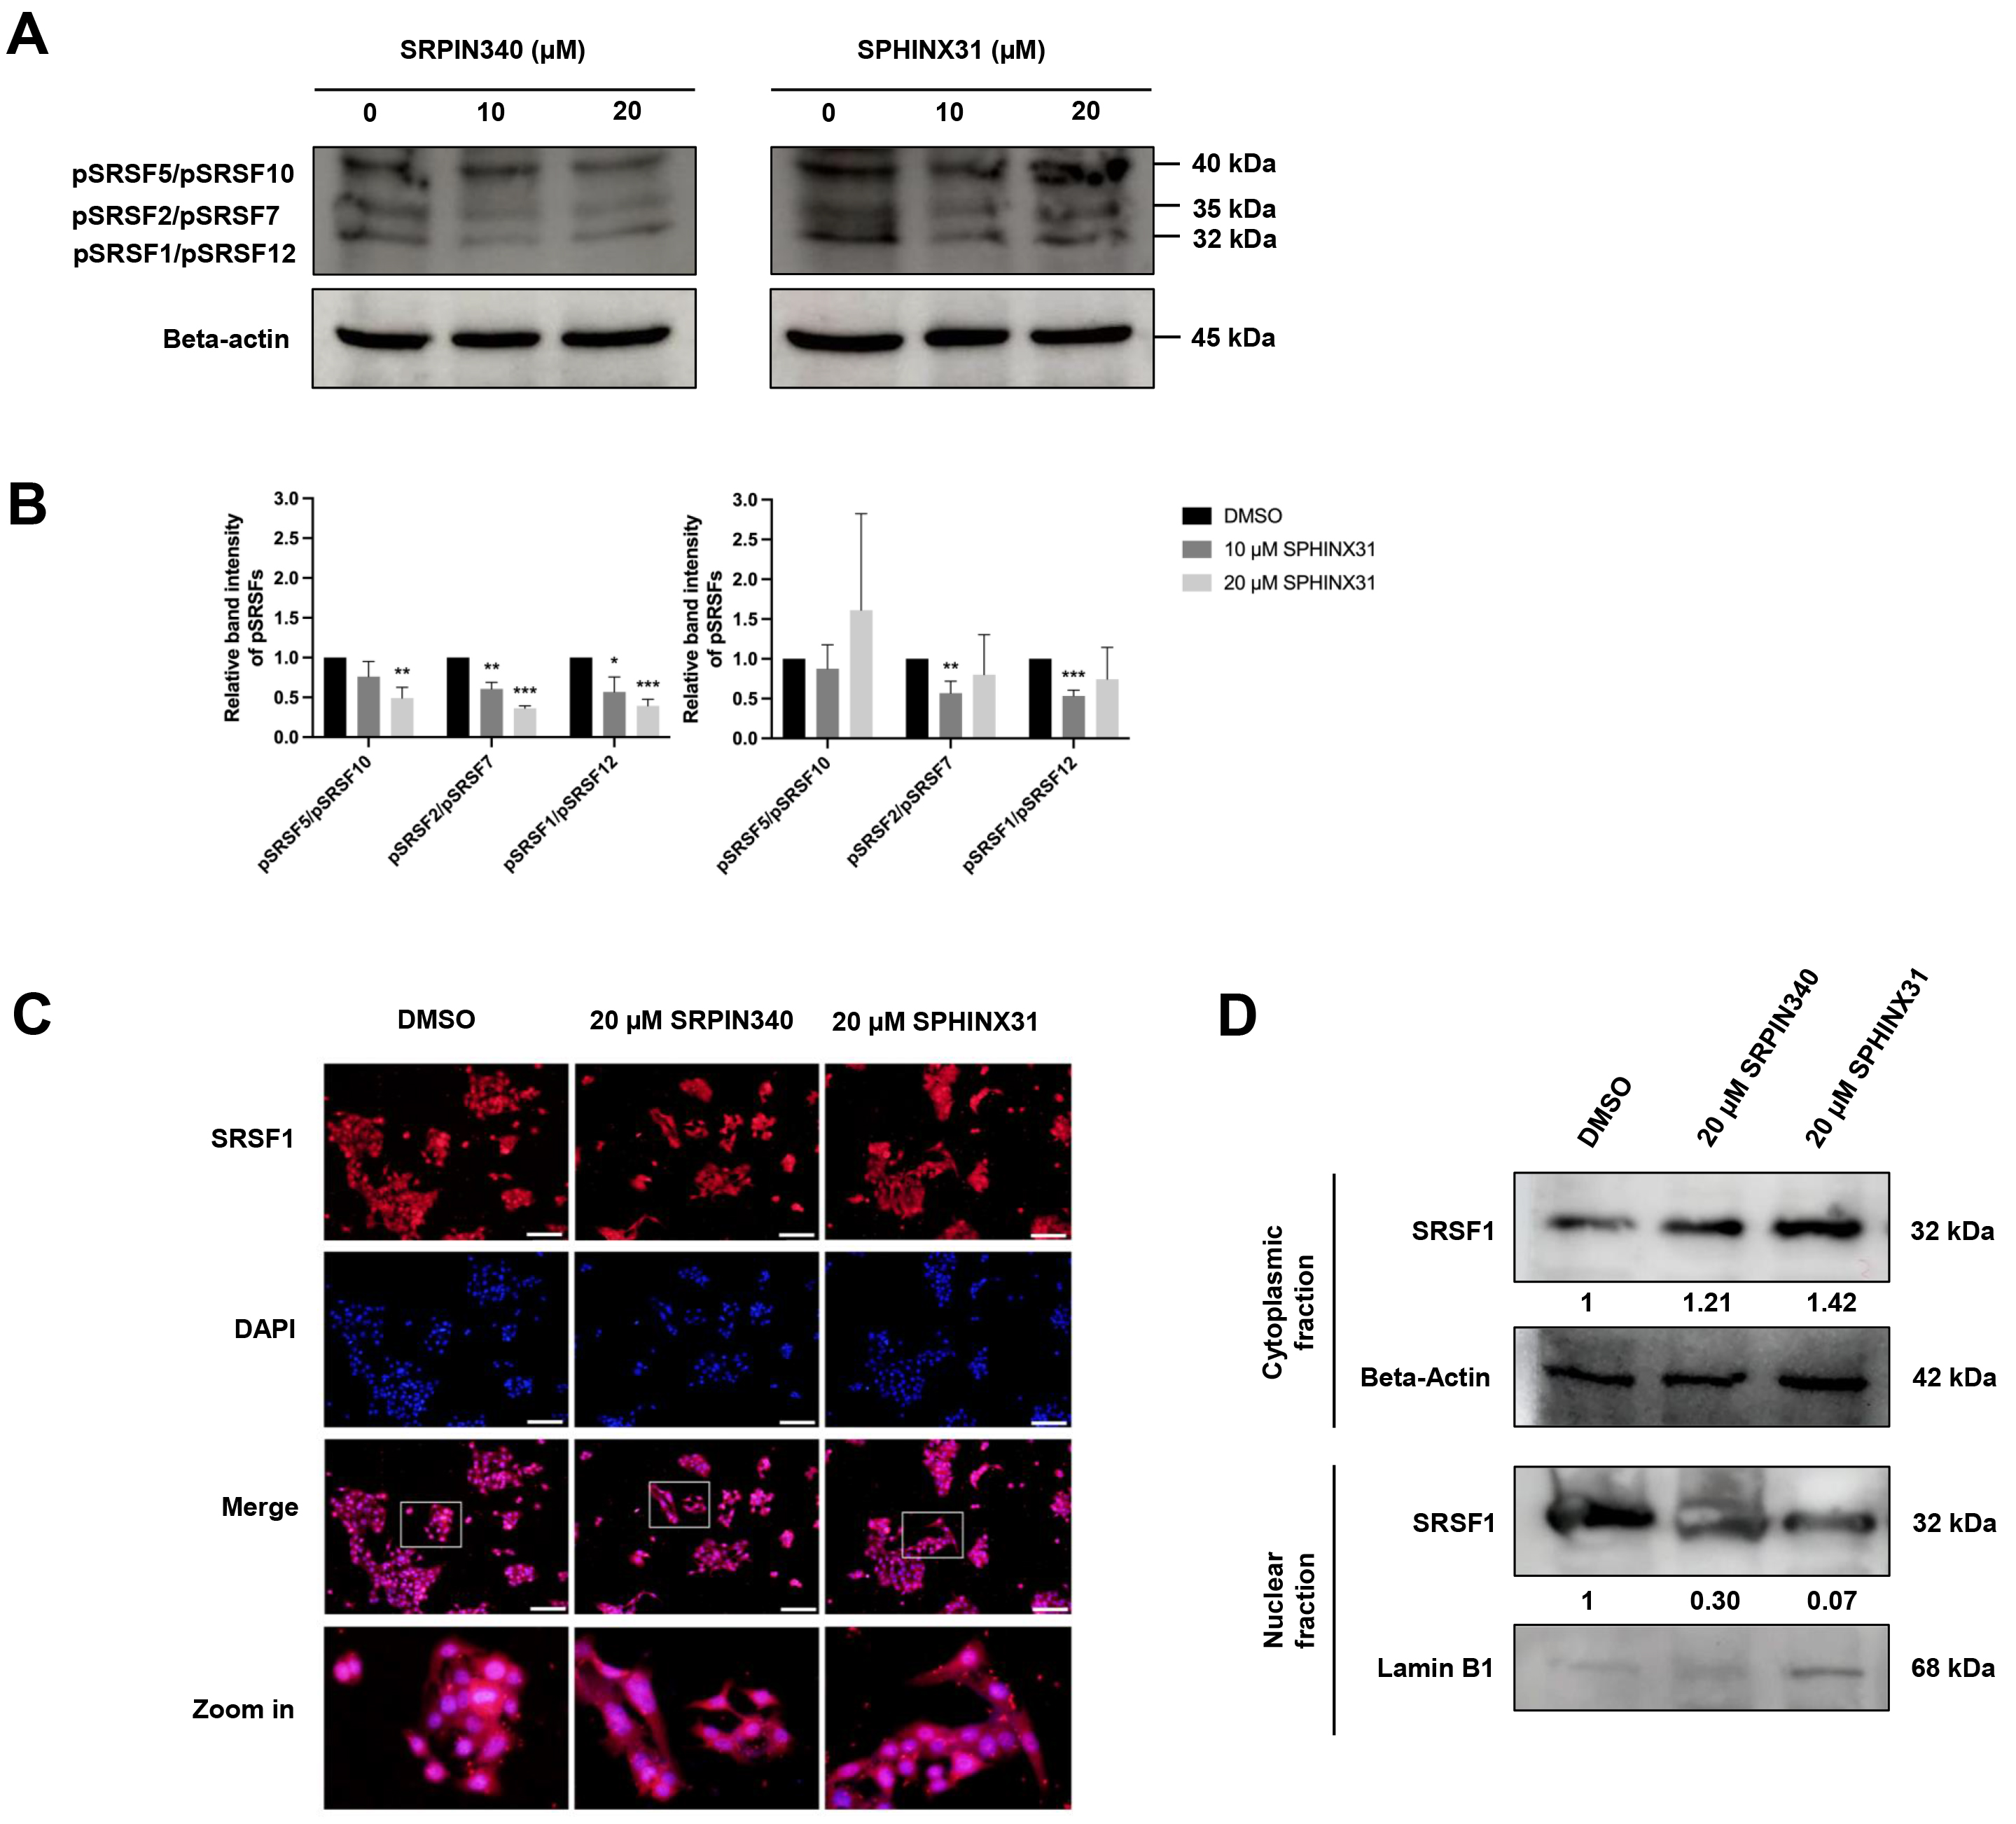 Fig. 4.
Inhibitory effects of SRPIN340 and SPHINX31 on the
phosphorylation and nuclear translocation of splicing factors in TFK-1 cells.
Western blot analysis of SRSFs with anti-phosphoepitope SR protein antibody in
TFK-1 cells treated with SRPIN340 or SPHINX31 (A). The band intensity for each
phospho-SRSF was calculated and the SRSFs were identified by their predicted
molecular weight (B). Immunofluorescence (IF) staining of the predominant SRSF1
is represented as red fluorescence, while the cell nuclei are marked by DAPI
staining (C). Western blot analysis of SRSF1 protein derived from cellular
fractionation revealed the accumulation of SRSF1 following treatment with SRPK
inhibitors (D). Statistical analysis was performed on data from three independent
experiments. *p
SRSF1 is the predominant SRSF expressed in various cancer types. Of note, pSRSF1/pSRSF12 was significantly decreased after treatment of TFK-1 cells with SRPK inhibitors (Fig. 4A,B). Therefore, a concentration of 20 µM of SRPK inhibitor was chosen to investigate the translocation of SRSF1 from the cytoplasm to the nucleus. IF and Western blotting were employed to study the effect of SRPK inhibitors on this translocation,
Under fluorescence microscopy, red fluorescence represents the localization of SRSF1 and is merged with DAPI staining to mark the nucleus. SRSF1 was mainly localized in the area with DAPI-marked nuclei in the vehicle control cells, but was dispersed into the cytoplasmic area after treatment with 20 µM SRPIN340 or SPHINX31 (Fig. 4C). To confirm the cytoplasmic vs. nuclear accumulation of SRSF1, Western blotting of SRSF1 protein was performed after subcellular protein fractionation. Relative to the vehicle control, higher SRSF1 levels were found in the cytoplasmic fraction and lower levels in the nuclear fraction after treatment with SRPK inhibitor, especially for 20 µM SPHINX31 (Fig. 4D).
After showing that treatment with SRPK inhibitors reduced SRSF phosphorylation (Fig. 4A) and the nuclear translocation of SRSFs (Fig. 4B), we next investigated changes in gene splicing errors. SRPK inhibitor treatment of TFK-1 cells clearly induced apoptosis (Fig. 3B,D,F). We therefore investigated splicing errors in the apoptotis-related genes BIN1, MCL1 and BCL2. The results showed that treatment with SRPIN340 or SPHINX31 significantly decreased the level of anti-apoptotic BIN1+12A, but not BIN1 all-forms (Fig. 5A,B), possibly explaining the restoration of cellular apoptosis. Furthermore, the levels of pro-apoptotic MCL-1S (Fig. 5C,D) and BCL-xS (Fig. 5E,F) isoforms were increased, thus enabling the cellular apoptosis of TKF-1 cells.
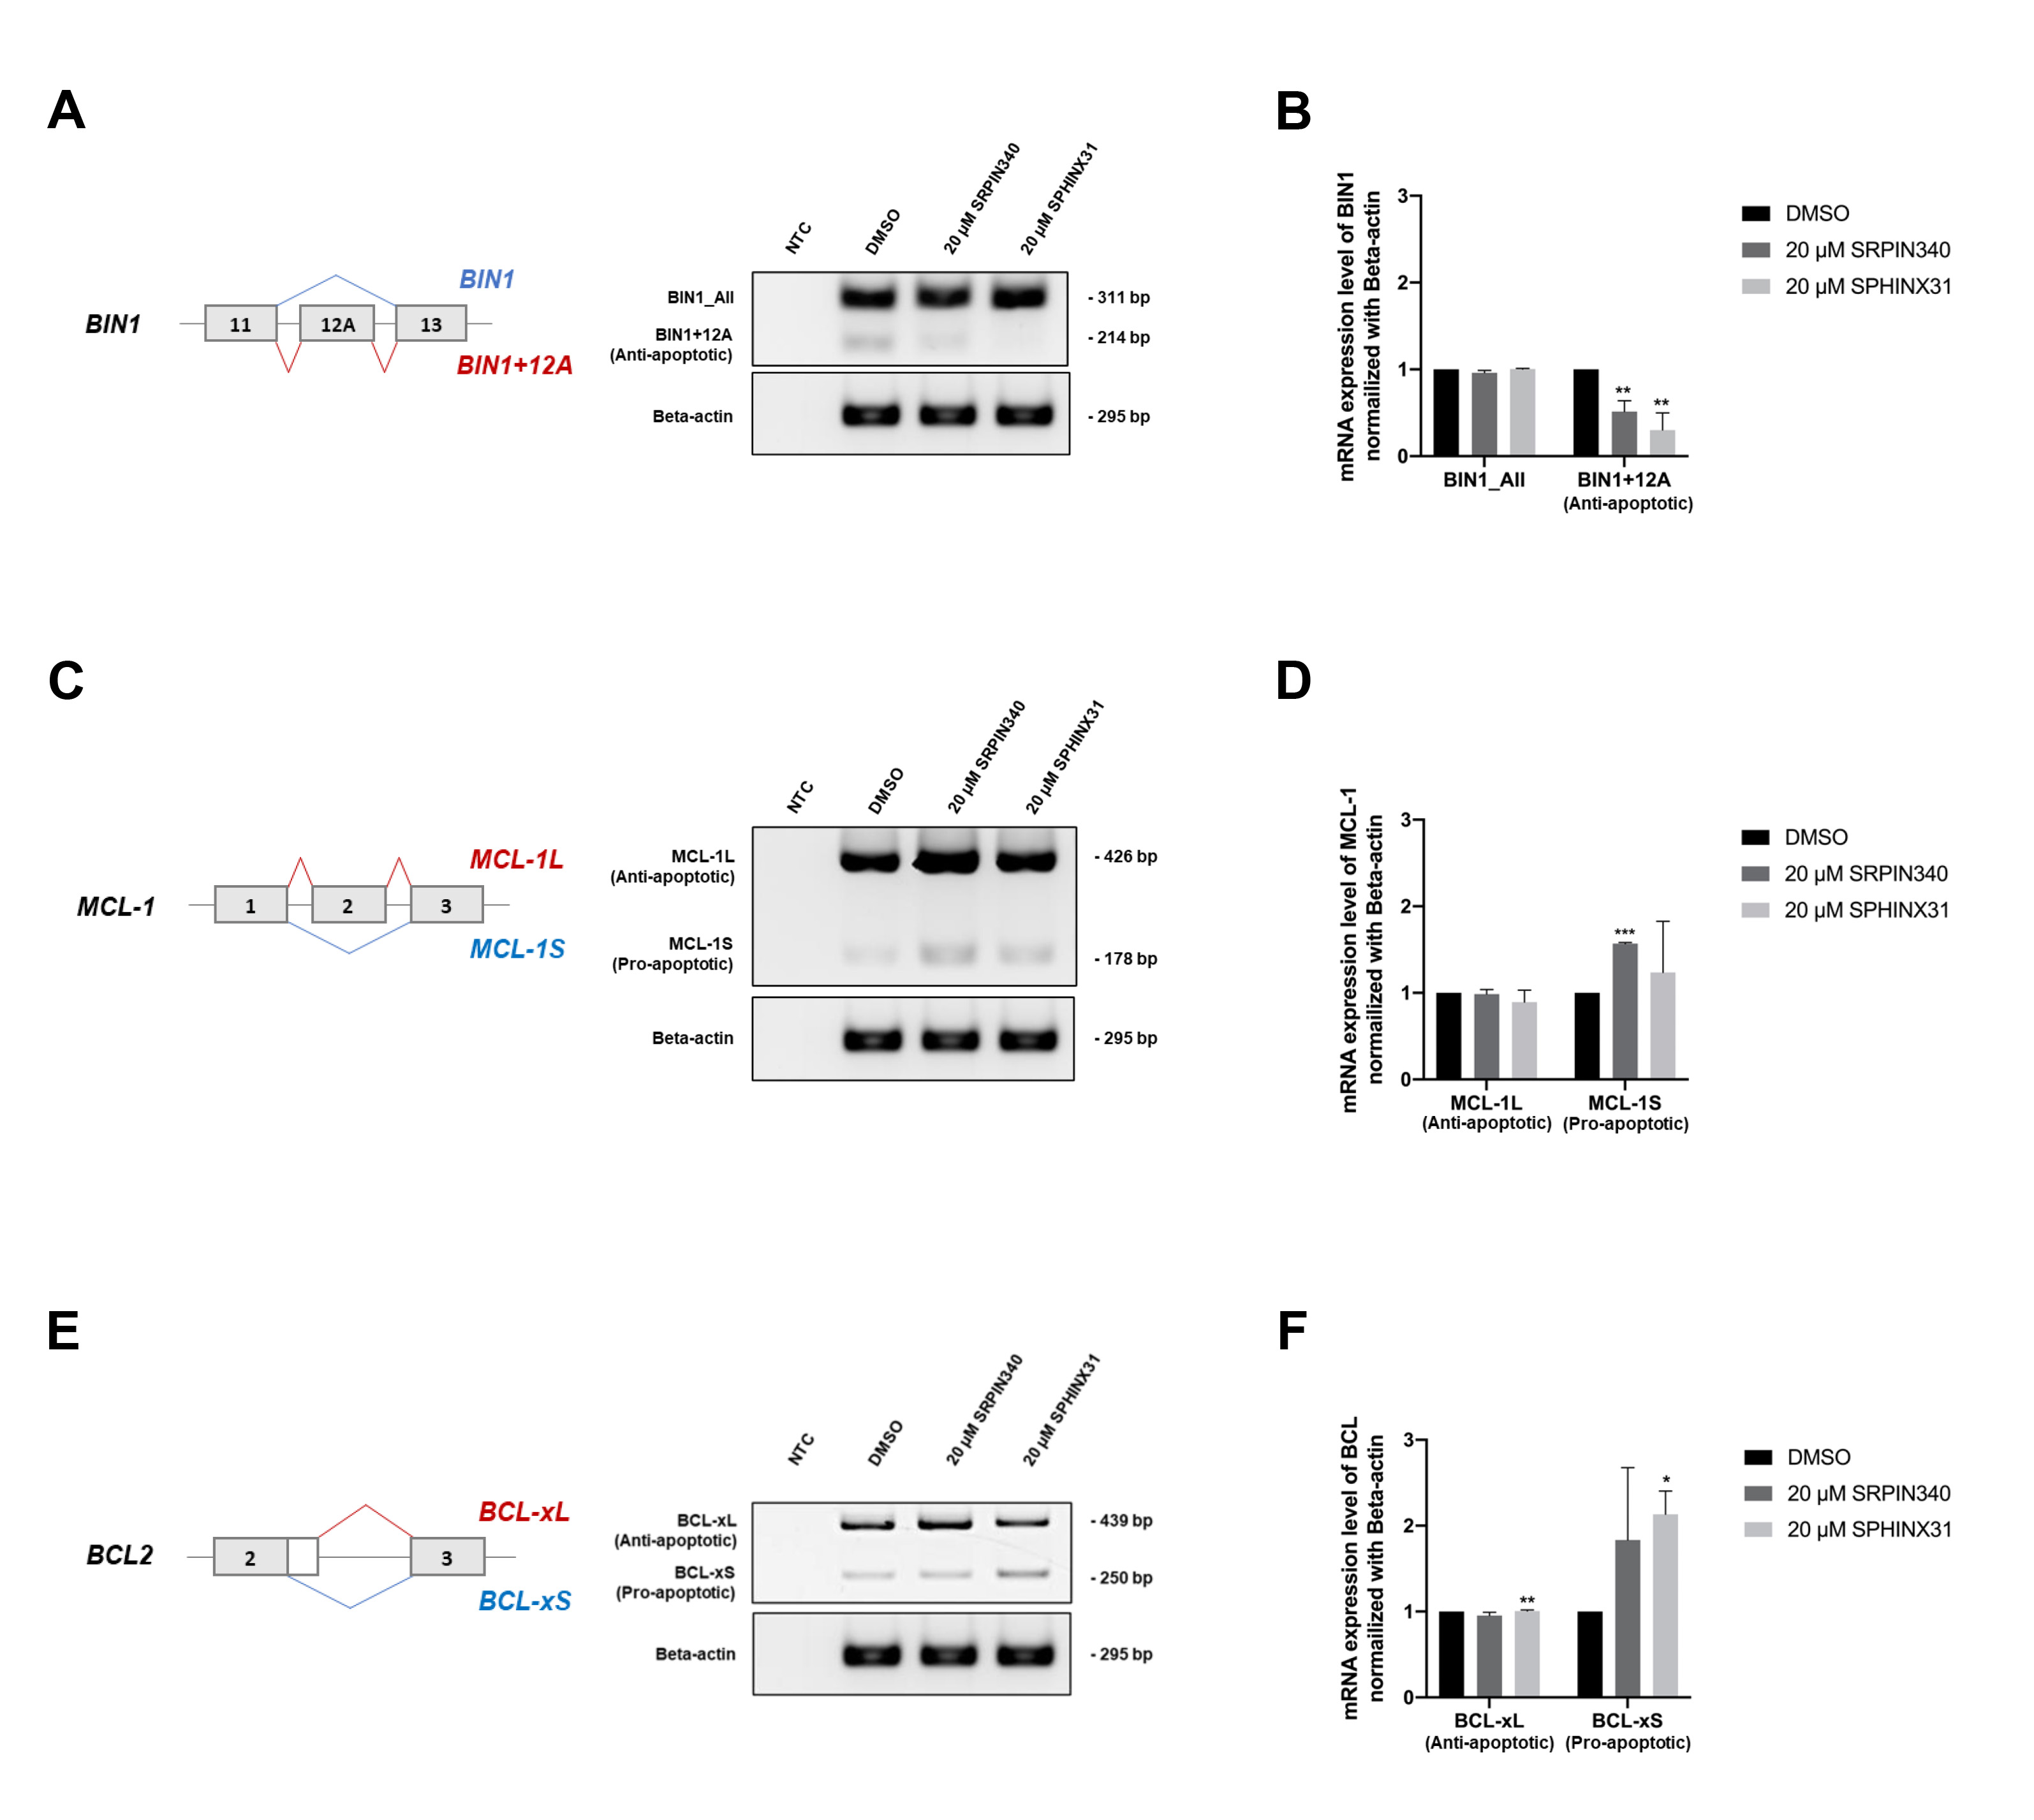 Fig. 5.
Effect of SRPIN340 and SPHINX31 on the correction of
splicing errors in apoptosis-related genes in TFK-1 cells. Reverse
transcription-polymerase chain reaction (RT-PCR) was performed to
quantify splicing of the apoptosis-related genes BIN1, MCL1 and
BCL2. The level of the anti-apoptotic BIN1+12A isoform was
compared to that of BIN1_All, comprising all isoforms (A), with the
normalized intensity shown in the bar graph (B). The level of pro-apoptotic
MCL-1S was also compared to that of MCL-1L (C), with the
normalized intensity shown in the bar graph (D). The level of pro-apoptotic
BCL-xS was compared to that of BCL-xL (E), with the normalized
intensity shown in the bar graph (F). Statistical analysis was performed on data
from three independent experiments. *p
Analysis of the TCGA dataset revealed the level of SRPK1 and SRPK2 transcripts was significantly higher in CCA tumor tissue than in normal adjacent tissue. Moreover, high SRPK1 expression was associated with shorter overall survival of CCA patients. We subsequently used the SRPK inhibitors SRPIN340 and SPHINX31 for in vitro studies with the CCA cell lines KKU-213A and TFK-1. Treatment with these inhibitors induced apoptosis, particularly in TFK-1 cells. Consequently, phosphorylation of the splicing factors was blocked, resulting in the cytoplasmic accumulation of the predominant splicing factor SRSF1. Lastly, the correction of splicing errors could be explained by decreased levels of BIN1+12A and increased levels of MCL-1S and BCL-xS, which were recoved by treatment with SRPK inhibitor.
Aberrant alternative splicing has been recognized as part of the oncogenic
machinery during the development of cancer. SRSFs are part of the SR protein
family and are key molecules regulated by SRPKs [19, 27]. Several studies have
established the contribution of specific SRPKs in cancers. Elevated expression of
SRPK1 enhances the anti-apoptosis capacity of colon cancer cells through the
SRPK1/AKT axis and NF-
We studied the dysregulation of SRSFs and SRPKs leading to abberant mRNA and protein synthesis and contributing to the oncogenesis of CCA [7]. Many studies in various cancer types have reported that overexpression of SRPK1 and SRPK2 correlated with advanced tumor stage and poor prognosis [32]. The SRPK inhibitor SRPIN340 demonstrated inhibitory effects on both SRPK1 and SRPK2 [33], whereas SPHINX31 was shown to inhibit SRPK1 only [34].
The present study showed that SRPIN340 and SPHINX31 significantly increased cell death in the KKU-213A and TFK-1 cell lines (Fig. 2), thus confirming previous reports that SPHINX31 decreased the growth of leukemic cells [35], and in xenografted-prostate cancer cells [36]. Interestingly, SPHINX31 significantly reduced the Ki-67 for proliferation suppression of umbilical vein endothelial cells (HUVECs) [37]. We found that SRPIN340 and SPHINX31 treatment of CCA cells increased the early apoptotic population in a dose-dependent manner, especially in TFK-1 cells (Fig. 3A,B). A previous study in lymphoma found that SPHINX31 and SRPIN340 increased ENKTL-related cell apoptosis [20]. SRPIN340 can also trigger early and late apoptosis in leukemia cells [21]. Moreover, depletion of SRPK1 by siRNA or shRNA increased the apoptosis of pancreatic carcinoma and glioma cells [38, 39, 40]. We also showed that SPHINX31 and SRPIN340 caused mitochondrial leakage of cytochrome C and increased the level of the cleaved form of caspase-3 protein (Fig. 3C–F). These observations are similar to previous results on endometrial cancer in which SPHINX31 reduced survivin expression and increased the level of cleaved PARP to induce apoptosis of SPEC-2 cells [22]. In addition, SRPIN340 and SPHINX31 increased the levels of cleaved PARP and cleaved caspase-3 in ENKTL cells [20].
SRPKs are responsible for the phosphorylation of splicing factors. The present study found lower levels of SRSF phosphorylation following treatment of TFK-1 cells with SRPK inhibitors (Fig. 4A,B). Interestingly, treatment with SPHINX31 resulted in non-linear changes in SRSF phosphorylation levels. A previous study on leukemic cancer cells (HL60 and Jurkat cells) suggested the optimal period to measure SRSF phosphorylation was 18 h after treatment rather than 9 h [21]. An intracellular feedback mechanism may occur under high dose treatment. HuCCA-1 cells also showed non-linear changes in the phosphorylation level at various inhibitor concentrations, with similar intensities of phospho-SRSF1 observed from 0.3–10 µM of SPHINX31 [23]. The dephosphorylation effect of SRPK inhibitors has been validated in several cancer cell models. SRPIN340 decreased the phosphorylation of SRSF2, SRSF4, SRSF5 and SRSF6 in HL60 and Jurkat cells [21], SPHINX31 decreased the kinase activity of SRPK1 by reducing the phosphorylated form of SRSFs in SPEC-2 cells [22], SPHINX31 reduced SRSF1 phosphorylation in RPE cells [34]. In addition, treatment by SRPIN340 and SPHINX31 reduced the EGF-dependent phosphorylation of SRSF1 and SRSF2 in PC-3 prostate cancer cells [36]. An earlier study on CCA cells showed that SPHINX31 reduced SRSF1 phosphorylation in HuCCA-1 cells [23]. Apart from SRPIN340 and SPHINX31, a docking blocker of SRPK1 (DBS1) inhibits protein-protein interactions of SRPKs, thus effectively preventing the phosphorylation of SRSF1 in A375 and HeLa cells [41]. We tracked the nuclear translocation of SRSF1, which is the predominantly expressed SRSF in cancer. We found that SRSF1 accumulated in the cytoplasm of TFK-1 cells following treatment with SRPK inhibitors (Fig. 4C,D). Similar results have been reported in other cancer types, with SRPIN340 effectively reducing SRPK1 nuclear translocation and phosphorylation of SR proteins in the murine melanoma cell line B16F10 [42].
Treatment with SRPK inhibitor reduced SRSF1 phosphorylation and its cytoplasmic
accumulation. Lower SRSF phosphorylation and cytoplasmic accumulation of SRSF1
were associated with CCA cell death and were subsequently explained by the
splicing of SRSF1-targeted mRNA. Three genes that contain SRSF1 recognition
sequences (GAAGAA and (A/G)GAAGAAC) and which contribute to cancer cell apoptosis
were selected for further study. We confirmed the correction of gene-splicing
errors by SRPK inhibitors in the apoptosis-related genes BIN1,
MCL-1 and BCL. Alignment analysis of the SRSF1 recognition
sequences with the full-length mRNA of each gene revealed three recognition sites
within BIN1 mRNA (exons 1, 6 and 10), two within MCL-1 mRNA
(exon 3), and 6 within BCL mRNA (exon 3). Decreased BIN1+12A
and increased MCL-1S and BCL-xS were associated with the
induction of apoptosis in TFK-1 cells (Fig. 5A–C). Similar results have been
reported for other treatments or agents in various cancer types. For example,
aberrant splicing of BIN1 to BIN1+12A attenuated cell death
mediated by E2F1 and etoposide, independently of the p53- and p73-mediated
pathways, leading to DNA damage-induced cell death [9]. Moreover,
BIN1+12A was shown to be under the control of SRSF1 in non-small cell lung cancer (NSCLC). BIN1+12A
exerts anti-apoptotic properties in NSCLC through changes in its subcellular
localization [11]. With MCL-1 splicing, Mcl-1S overexpression induced
apoptosis in basal cell carcinoma (BCC) cells. Antisense morpholino
oligonucleotides (AMOs) for MCL-1 can specifically target MCL-1
pre-mRNA and shift the splicing pattern from MCL-1L to MCL-1S mRNA and protein.
This shift induces apoptosis in BCC cells, as shown by the increased population
of sub-G1 apoptotic cells in MCL-1S-transfected cells [12]. In addition, the
modification of MCL-1 splicing in gastric cancer cells stimulates
pro-apoptotic factors, including cleaved-caspase-9, BAK and cleaved caspase-3
[43]. Finally, dysregulation of alternative splicing for the BCL gene
promoted the upregulation of BCL-xS in pancreatic
The contribution of aberrant alternative mRNA splicing in cancer development and progression is well recognized, particularly in CCA. There is now considerable evidence documenting the overexpression, overactivation, or dysregulation of splicing factor SRSFs as a consequence of uncontrolled phosphorylation by splicing kinase SRPKs. Upregulation of SRPK1 and SRPK2 in CCA was observed following analysis of the TCGA dataset. This study explored the cellular effects of the potent SRPK inhibitors SRPIN340 and SPHINX31 in CCA cells. Two CCA cell lines representing iCCA (KKU-213A) and eCCA (TFK-1) were treated with SRPK inhibitors to investigate their ability to induce cell death. The number of dead and apoptotic cell populations were increased after treatment and were characterized by the apoptosis-related proteins cytochrome C and cleaved caspase-3. Moreover, reduced SRSF phosphorylation and nuclear translocation were observed after treatment with the inhibitors, especially for SRSF1. Finally, additional insight into the downstream regulation and correction of splicing errors in apoptosis-related genes was obtained. Reduced levels of anti-apoptotic BIN1+12A, and increased levels of pro-apoptotic MCL-1S and BCL-xS could explain the induction of apoptosis in CCA cells following treatment with SRPK inhibitors. This study may serve as a basis for the targeting of SRPKs as an alternative treatment strategy for CCA.
The data presented in this study are available upon request from corresponding author.
AGR2, Anterior gradient-2; BCC, Basal cell carcinoma; BCL-2, B-cell lymphoma 2; BIN1, Bridging Integrator 1; CCA/CHOL, Cholangiocarcinoma; CD44, Cluster of Differetiation; c-MYC, Cellular myelocytomatosis oncogene; DMSO, dimethyl sulfoxide; eCCA, extrahepatic cholangiocarcinoma; ENKTL, extranidal NK/T-cell lymphoma; GEPIA, Gene Expression Profiling Interactive Analysis; GTEx, Genotype-Tissue Expression; HR, Hazard ratio; iCCA, intrahepatic cholangiocarcinoma; IF, Immunofluorescence; LIHC, liver hepatocellular carcinoma; MCL-1, Myeloid cell leukemia factor 1; NTC, No template control; OV, Opisthorchis viverrini; PARP, Poly-Adenosine diphosphate ribose polymerase; pSRSFs, phospho-SRSFs; RT-PCR, Reverse Transcription-Polynmerase Chain Reaction; SRPKs, serine-arginine protein kinases; SRSFs, serine/arginine rich-splicing factors; STR, Short Tandem Repeat; TCGA, The Cancer Genome Atlas; TPM, Transcript per million; VEGF, vascular endothelial growth factor; WB, Western blotting; WISP1, Wnt-Inducible Secreted Protein 1.
PC, TJ, WK conceived and designed the work; WK, SH, SK, SP, DS curated data; PC, CI performed the experiments; PC, CI, AS, WK analyzed the data; PC, CI, WK wrote the manuscript; SP, DS, TJ, WK administrated project; SK, AS, TJ, WK supervised. All authors contributed to editorial changes in the manuscript. All authors read and approved the final manuscript. All authors have participated sufficiently in the work and agreed to be accountable for all aspects of the work.
The KKU-213A cell line was established from a 58-year-old male diagnosed with iCCA at the Srinagarind Hospital, Khon Kaen University, Thailand, which the patients’ informed consent and the research protocol (HE621403) was formerly approved by the Ethics Committee for Human Research of Khon Kaen University.
Not applicable.
This study was supported by the grant from National Research Council of Thailand, NRCT-Research Career Development Grant (NRCT5-RSA63011-04).
The authors declare no conflict of interest.
References
Publisher’s Note: IMR Press stays neutral with regard to jurisdictional claims in published maps and institutional affiliations.