


 , Ayesha Sherzai 1, Jennifer Adeghate 2, Dean Sherzai 1
1 Department of Neurology, Loma Linda University Health, Loma Linda, CA 92350, USA
2 Department of Ophthalmology, University of Pittsburgh, Pittsburgh, PA 15213, USA
Abstract
Alzheimer’s disease (AD) and type 2 diabetes mellitus (T2DM) share many common
features including inflammation, oxidative stress and neuronal degeneration.
Insulin resistance (IR) appears to be a common path in these pathological
processes. IR is an early pathogenic event in AD, which leads to augmentation of
hyperphosphorylated tau and Amyloid beta (A
The reviewed studies related to AD have revealed a positive association between T2DM and AD. This association was maintained in peripheral hyperinsulinemia cases without the presence of T2DM, which might be due to decreased insulin transport to the brain or the inadequate cerebral insulin production. Gut dysbiosis induces inflammation and consequently provokes both peripheral and cerebral IR and can amplify processes promoting AD.
Additionally, the risk of increased progression of AD was revealed due to pre-diabetes, T2DM and gut dysbiosis. The pro-inflammatory changes might affect progression of AD pathology by inhibition of the autophago-lysosomal pathway and cerebral insulin signaling pathway. This review elaborates the role that cerebral IR might play in the underlying pathological events in AD.
Keywords
- Alzheimer’s disease
- Type 2 diabetes mellitus
- Gut dysbiosis
- Brain insulin resistance
- Peripheral insulin resistance
Alzheimer’s disease (AD) is a neurodegenerative brain disorder and the most common cause of dementia [1].
According to an estimation of the 2010 US Census Bureau and the Chicago Health and Aging Project (CHAP) 5.8 million Americans age 65 and older are living with Alzheimer’s disease in 2020. The population with AD increases with age, and the estimated growth of the population of age 65 and older is from 56 million in 2020 to 88 million by 2050. If there are no preventative measures instituted, the number of those suffering from AD is expected to grow to 13.8 million by 2050 [2, 3].
In 2011, the National Institute on Aging (NIA) and the Alzheimer’s Association revised the diagnostic guidelines of AD, determining the stages of the disease based on clinical symptoms and biomarkers [4, 5]. Their recent studies have examined the brain processes underlying cognitive impairment by using post-mortem samples and in vivo biomarkers. In AD, slowly progressive cognitive decline is associated with characteristic pathological changes such as accumulation of beta-amyloid plaques outside neurons, and tau-protein tangles inside neurons [4, 5]. Inflammatory processes and enhanced amyloid aggregation consequently increase tau-protein accumulation, which exacerbate the progression of cognitive decline [6, 7].
Alzheimer’s disease is a multifactorial disease associated with both genetic and
modifiable factors. Early-onset AD has been linked with genetic mutations of
pre-senilin 1 and 2, as well as of the encoding gene of APP (amyloid precursor
protein) [8]. Late-onset AD has been associated with factors such as older age,
especially above 75 years, family history of AD, and being a carrier of the APOE
(apo-lipoprotein E)
Multidomain lifestyle prevention trials have shown a significant effect on maintaining cognitive decline or improving cognitive performance among elderly who had increased risk of dementia. The interventions included dietary counseling, exercise, cognitive training, and management of vascular and metabolic risk factors [13, 14, 15]. The latest World Health Organization report highlighted diabetes, obesity, smoking and hypertension as leading risk factors contributing to increased risk of dementia and cognitive decline [16].
T2DM predisposes to the development of dementia in the elderly population and increases the risk of AD by two-to three-fold compared with subjects without T2DM [17, 18, 19]. Type 2 diabetes (T2DM) and AD share common pathological features including inflammation, oxidative stress, which contribute to insulin resistance and neuronal degeneration in both disorders [20, 21, 22, 23, 24]. Moreover, metabolic disturbances such as peripheral hyperglycemia and hyperinsulinemia before the T2DM stage have a negative impact on the pathophysiological processes and progression of AD [25, 26, 27]. A positive correlation was revealed between brain insulin signaling desensitization, brain insulin resistance and AD progression during the early stage of the disease regardless of the presence of T2DM [28, 29]. Dysbiosis due to the increased level of pro-inflammatory bacteria of the gut caused by a long-term high-fat diet can lead to systemic oxidative stress, inflammation and thus metabolic disturbance [30, 31]. This systemic inflammatory state might explain the increased risk of development of T2DM and AD with a high-fat diet [32, 33, 34].
Overall, prevention strategies that focus on improvement of metabolic impairment, such as lifestyle modification, may have a protective effect against cognitive decline in AD [13, 35, 36]. Our review aims to discuss the role that insulin resistance plays in Alzheimer’s disease as well as the effect of Type 2 diabetes and gut dysbiosis in the progression of cognitive decline in AD.
We searched PubMed for articles, clinical studies and human experimental studies published during 2015–2020, with search terms including Alzheimer’s disease, peripheral and brain insulin resistance, type 2 diabetes mellitus, gut microbiome and gut dysbiosis. The search yielded publications which covered human cell culture and brain tissue experiments, clinical trials, and population based studies, and excluded all animal related studies.
T2DM-associated decreased in cognitive function, memory impairment, and increased risk of AD have previously been shown by preliminary epidemiological studies [18, 37, 38]. Subsequent studies discussed below have focused on the correlation between AD progression and the level of peripheral insulin as well as the role that insulin plays in the brain.
Among numerous clinical trials which have demonstrated an association between DM
and cognitive decline was a prospective cohort study, which showed a 19% greater
cognitive decline over 20 years-in participants with diabetes than in
participants without diabetes [39]. Decreased cognitive performance was found in
the pre-diabetic group (HbA1c 5.7–6.4%), the poorly controlled diabetic group
(HbA1c
| Study design and objectives | Sample Size | Results | Conclusions | References | |
| Statistical Analysis | P-value | ||||
| • Prospective study (1993–2004). To determine relation between insulin resistance and the risk of AD | • N = 3139 | Insulin resistance and AD: 1.39 (95% CI 1.04, 1.86) | • Higher plasma insulin level and insulin resistance were associated a higher short-term risk of AD with an increase in risk of approximately 40%. | [43] | |
| • Prospective study (1987–2013). To determine if diabetes in mid-life is associated with a 20-year cognitive decline | • N = 13351 | 20 years decline, No diabetes: -0.78 (95% CI: -0.80, -0.75) | 0.071 | • Diabetes in midlife was associated with significantly greater cognitive decline over 20 years. | [40] |
| 20 years decline, Diabetes: -0.92 (95% CI: -1.00, -0.85) | Subjects with poorly controlled diabetes (HbA1c ≥ 7.0%) had a larger decline compared to persons whose diabetes was controlled (HbA1c | ||||
| Difference: -0.15 (95% CI: -0.22, -0.08) | |||||
| • Prospective study (1990–2013). To determine the association | • N = 1232 | • Higher baseline HOMA-IR levels were associated with | [41] | ||
| between HOMA- IR and cognitive performance in individuals | 1. follow-up between 2004–2009 (N = 489) | 1/a. β = -3.66 |
1/a. 0.003 | poorer cognitive performance after 15 years. The observed re- | |
| with cardiovascular disease, with and without diabetes | 1/b. exclusion of DM cases: β = -4.45 |
1/b. 0.004 | lationships were independent of vascular risk factors and dia- | ||
| 2. follow-up between 2011–2013 (N = 347) | 2/a. β = -0.16 |
2/a. 0.006 | betic status. | ||
| 2/b. exclusion of DM cases: β = -0.17 ± 0.06 | 2/b. 0.008 | ||||
| • Cross-sectional study (2014). To determine the association | • N = 444 | • Hyperglycemia was associated with cognitive dysfunction, | [42] | ||
| between HOMA-IR and cognitive performance | 1. With diabetes (N = 61) | 1. MMSE score: β = -0.105 HOMA-IR | 1. 0.022 | mainly in the executive function domain. IR was associated | |
| 2. Without diabetes (N = 383) | 2. Logical memory II score: β = -0.091 | 2. 0.047 | with memory impairment. | ||
| AD: Alzheimer’s disease; HOMA-IR: Homeostatic Model Assessment of Insulin Resistance; DM: diabetes mellitus; IR: insulin resistance. | |||||
It is known that peripheral insulin levels correspond with insulin levels in the cerebrospinal fluid (CSF), as human studies have shown an increase in CSF insulin after injection of insulin peripherally in normal individuals [43]. Recent studies showed that individuals with peripheral insulin resistance have reduced CSF insulin levels. A study by Heni et al. showed a positive correlation between CSF insulin level and serum insulin level in insulin sensitive individuals, and a negative correlation between the two factors in insulin-resistant participants [44]. Another study by Kern et al., obese human subjects showed, independently from other variables, that insulin resistance negatively correlated with the CSF: plasma insulin ratio [45]. Reduced CSF insulin levels might be a consequence of impaired insulin transport through the blood-brain barrier (BBB) by receptor mediated transcytosis [46, 47]. According to an experimental model, reduced insulin receptor density on microvascular endothelial cell cultures of T2DM subjects can support this theory [48].
Reduced insulin levels were found in the CSF of participants with mild cognitive
impairment (MCI) and early stage AD without the presence of an increased level in
peripheral insulin [49]. On one hand, this could potentially be explained by the
reduced brain insulin production in AD [29]. The insulin gene and insulin
receptor expression was found to be at a higher distribution in the hypothalamus
and the hippocampus in postmortem brain tissue and its reduction corresponded
with the progression of AD [50, 51]. On the other hand, transcytosis of insulin
may also be affected in AD and have an impact on the CSF insulin level. An
experimental model of the BBB consisting of human cerebral microvascular
endothelial cells (hCMEC/D3) showed decreased insulin transcytosis in the
presence of A
Although an inverse correlation was found between peripheral insulin levels and
CSF insulin levels in AD, but a positive association was found between peripheral
insulin levels and levels of AD biomarkers. This is supported by the study
performed by Westwood et al., whereby a significant association was
found between plasma insulin levels and CSF A
| Study designs and objectives | Sample Size | Results | Conclusions | References | |
| Statistical Analysis | P-value | ||||
| • Cross-sectional study. To evaluate whether a higher HOMA- | • N = 186 | 1. HOMA-IR frontal: F (1, 135) = 5.429 | 1. 0.021 | • Normoglycemia with higher insulin resistance corresponded | [58] |
| IR may predict greater amyloid burden using [C-11]-Pittsburgh | 2. HOMA-IR temporal: F (1,135) = 4.751 | 2. 0.031 | to higher PiB uptake in frontal and temporal areas, reflecting | ||
| compound (PiB) and PET scanning in asymptomatic, late | 3. PiB uptake frontal: R |
3. |
increased amyloid deposition. | ||
| middle-aged adults. | 4. PiB uptake temporal: R |
4. |
|||
| • Cross-sectional study. To evaluate whether higher HOMA- | • N = 70 middle-aged | 1. CSF sAPP-β (HOMA-IR): F (1 ,63) = 4.21 | 1. 0.044 | • Higher HOMA-IR was associated with higher sAPP-β and | [55] |
| IR and APOE-ε4 levels would be associated with greater AD | cognitively asymptomatic | 2. Aβ42 (HOMA-IR): F (1, 63) = 4.26 | 2. 0.043 | Aβ42 levels. APOE-ε4 carriers had significantly higher lev- | |
| pathology in the CSF and worse memory performance. | adults with a parenteral | 3. CSF sAPP-α (APOE ε4): F (1, 63) = 8.65 | 3. 0.005 | els of sAPP-α, sAPP-β and P-tau181/ Aβ42 ratios compared | |
| history of AD | 4. sAPP-β (APOE ε4): F(1,63) = 7.74 | 4. 0.007 | to noncarriers. Higher HOMA-IR and greater P-tau181/ Aβ42 | ||
| 5. P-tau181/Aβ42: F (1,63) = 5.21 | 5. 0.026 | ratios predicted lower memory performance. | |||
| 6. memory performance: F (1,60) = 6.14 | 6. 0.016 | ||||
| • Cross-sectional study. To examine the influence of IR on AD using plasma and CSF biomarkers related to IR and AD in cog- | • N = 58 cognitively asymptomatic men | • Significant correlation between plasma insulin and CSF Aβ/tau ratio. CSF and serum proteins significantly correlated | [53] | ||
| nitively healthy men (age and APOE-ε4- matched). | 1. IR (N = 28) | 1. P-insulin and CSF T-tau: r = 0.310 | 1. 0.018 | with CSF AD biomarkers (Aβ, T-tau and P-tau). | |
| 2. non-IR (N = 30) | 2. P-insulin and CSF T-tau: r = 0.299 | 2. 0.023 | |||
| 3. compare IR (N = 28) and non-IR (N = 30) | 3. FCN2 β = -0.57 | 3. 0.014 | |||
| A | |||||
Cerebral glucose uptake through the BBB and metabolism in the brain are mainly insulin-independent and peripheral hyperinsulinemia does not have a strong effect on this process [59, 60]. However, some studies have found insulin resistance to alter brain glucose metabolism.
Insulin-independent glucose transporters are glucose transporter (GLUT) 1 in the astrocytes, GLUT3 in the neurons, and GLUT5 in the microglia [61, 62, 63]. The insulin-dependent, GLUT4 has limited expression in the brain and is found mainly in astrocytes [64]. A study examining the effects of insulin on human SH-SY5Y neuroblastoma cells revealed increased GLUT4 transporter translocation to the plasma membrane, as well as increased glucose uptake in the presence of insulin [65]. However, the role of insulin is mainly of regulatory nature within the brain. Insulin plays an important role in memory and learning processes, which was demonstrated in the medial-temporal lobe where it enhanced neuronal activity [66].
Insulin has been shown to directly stimulate neurite outgrowth by regulation of tau phosphorylation, which likely contributes to neuronal cytoskeleton dynamics and neural plasticity [67, 68]. Additionally, insulin enhances the proliferation and glycogen storage of astrocytes [69], which is supported by the fact that abundant insulin-dependent glucose transporters (GLUT4) can be found in astrocytes [64]. Thus, astrocytes can contribute to the metabolic changes in the brain during disease processes by effect on the metabolic demand of neurons [24].
Older adults with prediabetes or diabetes were shown to have greater insulin resistance associated with decreased cerebral glucose metabolism observed on fluorodeoxyglucose (FDG)-positron emission tomography (PET) [70]. The brain regions with reduced glucose metabolism were found in the posterior cingulate cortex, the precuneus region, the parietal cortices (Brodmann areas (BA) 7 and 40, the temporal/angular gyri (BA 39)), and the anterior and inferior prefrontal cortices, which are all affected in AD as well. Although the participants were not diagnosed with MCI, a reduced ability to recall words was recorded during an activation scan compared to the healthy adult group of similar age and level of education [70].
Other studies have found similar results, whereby a higher HOMA-IR value and
decreased glucose metabolism in the medial temporal lobe were associated with
worse immediate and delayed memory performance on neuropsychological testing
[71]. Further examinations of the medial temporal lobe and hippocampus of
individuals with MCI and higher HOMA-IR values showed hypo- or hypermetabolism in
these areas, depending on the rate of progression of the disease [72]. Namely,
active progression of the MCI stage is related with hypermetabolism, and AD with
hypometabolism, as detected by FDG-PET scanning [72]. This phenomenon might be
explained by metabolic compensation against the incremental amount of the amyloid
deposition [73]. In addition to using FDG-PET scanning to map cognitive
performance, Dowling et al. also measured CSF biomarkers in subjects during a
24-month period [74]. This study found that towards the later stages of AD, there
is an inverse correlation between baseline CSF biomarkers of intra-neuronal
neurofibrillary degeneration, t-Tau and p-Tau181p, and the progression of
hypometabolism and cognitive decline [74]. Tau hyperphosphorylation can be
stimulated by amyloid beta oligomers and it was revealed that insulin is able to
inhibit A
Reduced brain insulin signaling, and thus brain insulin resistance, which was observed in AD and T2DM cases, can promote neurodegeneration by decreasing brain glucose metabolism and hyperphosphorylation of tau [76]. These pathological changes and the previously mentioned regulatory role of insulin points toward the direction that insulin resistance has an indirect effect on metabolic disturbance of the brain by contribution to neuronal cell death (Table 3) (Fig. 1).
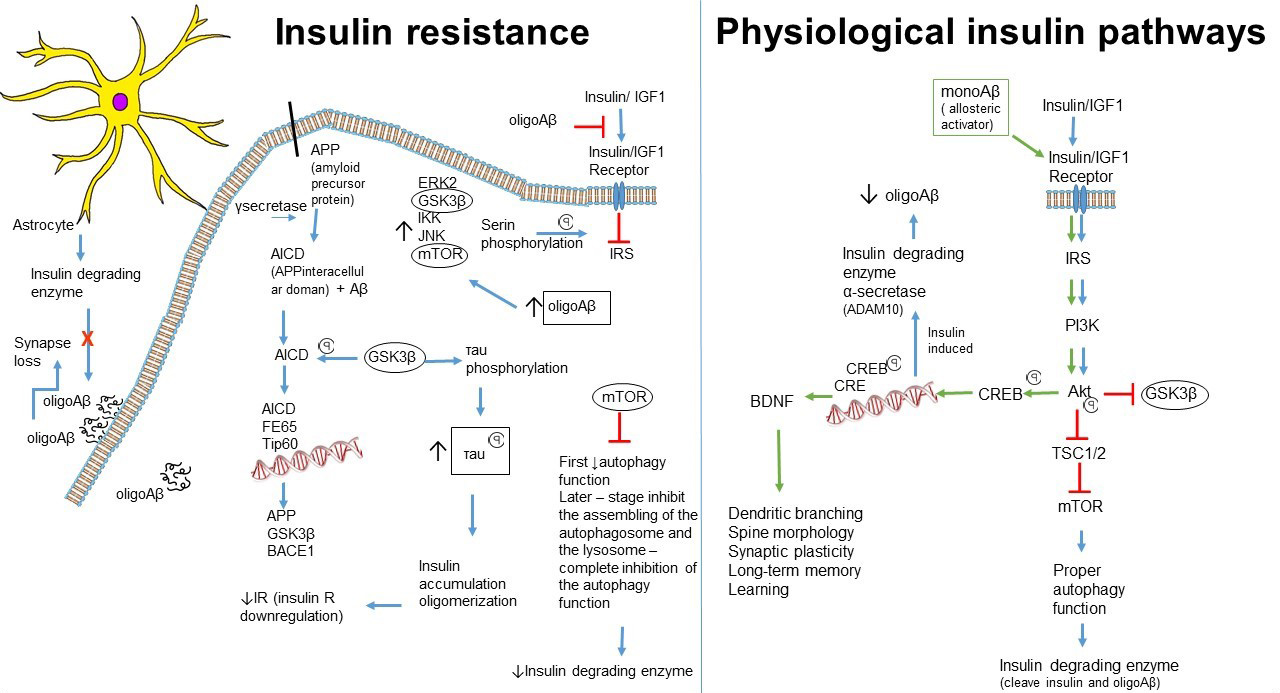 Fig. 1.
Connection between neuronal insulin resistance and progression of Alzheimer’s Disease.
| Study designs and objectives | Sample Size | Results | Conclusions | References | |
| Statistical Analysis | P-value | ||||
| • Cross-sectional study. To examine cognitively normal individual with higher HOMA-IR value and diagnosed prediabetes | • N = 23 with pre-diabetes or diabetes | 1. Right frontal glucose metabolic rate uptake (HOMA-IR): r = -0.63 | 1. |
• Higher HOMA-IR associated with reduced glucose metabolic rate at areas affected by AD, including posterior cingulate | [25] |
| and diabetes were associated with reduced cerebral glucose metabolic rate in AD related brain areas. | 2. Posterior cingulate cortex glucose metabolic rate uptake (HOMA-IR): r = -0.58 | 2. |
cortex, the precuneus region, parietal cortices, the temporal/angular gyri, and the anterior and inferior prefrontal cortices. | ||
| • Cross-sectional study. To determine the association between IR, deficits in brain glucose metabolism, and cognitive perfor- | • N = 150 middle-aged adults with normal cogni- | 1. global glucose metabolism (HOMA-IR): β = -0.29 | 1. |
• Insulin resistance is associated with significantly lower regional cerebral glucose metabolism, especially the medial tem- | [71] |
| mance in those at risk for AD. | tion and parental history of AD | 2. medial temporal lobe glucose metabolism (HOMA-IR): R |
2. |
poral lobe, which in turn may predict poorer memory performance. | |
| 3. immediate memory (Lower glucose metabolism): β = 0.317 | 3. |
||||
| 4. delayed memory (Lower glucose metabolism): β = 0.305 | 4. |
||||
| • N = 280 | |||||
| • Cross-sectional study. To determine the association between | 1. Control (N = 26) | • Higher HOMA-IR predicted lower FDG metabolism in the | [72] | ||
| FDG metabolism and HOMA-IR in MCI and AD. | 2. MCI (N = 194) | medial temporal lobe and hippocampus among participants | |||
| 3. Stable (N = 148) | with AD, and higher FDG for MCI participants who progressed | ||||
| 4. MCI progressed to AD (N = 39) | FDG metabolism in hippocampus (MCI progressed): F = 0.098 ± 0.029 | 4. /a |
to AD by 24 months. | ||
| FDG metabolism in medial temporal lobe (MCI progressed): F = 0.099 ± 0.020 R |
4. /b |
||||
| 5. AD (N = 60) | 5. /a FDG metabolism in hippocampus (AD): F= -0.076 ± 0.032 | 5. /a |
|||
| 5. /b FDG metabolism in medial temporal lobe: F = -0.074 |
5. /b |
||||
| • Prospective study (24-month follow-up). To evaluate rela- | • N = 412 | t-Tau (FDG-PET 24 months): r = -0.17 | • Higher baseline concentrations of t-Tau, and p-Tau181p were | [74] | |
| tionships between cerebrospinal fluid (CSF) analyses include | p-Tau181p (FDG-PET 24 months): r = -0.27 | associated with a decline in cerebral glucose metabolism. | |||
| hyperphosphorylated tau (p-Tau181p), β-amyloid 1-42 (Aβ1-42) and total tau (t-Tau). To evaluate change in cognitive func- | p-Tau181p/Aβ1-42 (FDG-PET 24 months): r = 0.25 | FDG-PET changes appeared to mediate t-Tau or t-Tau/Aβ1-42-associated cognitive change across all brain regions. Sig- | |||
| tion. To assess change in FDG uptake using PET scanning. | t-Tau/Aβ1-42 ADAS-Cog (24 months): r = 0.37 | nificant direct effects of alterations in Aβ1-42 levels on hypometabolism were observed in a single brain region: mid- | |||
| t-Tau (ADAS-Cog 24 months): r = 0.28 | dle/inferior temporal gyrus. | ||||
| FDG-PET M24 (ADAS-Cog 24 months): r = -0.66 | |||||
| 1. Normal cognition (N = 82) | |||||
| 2. MCI (N = 241) | |||||
| 3. AD (N = 89) | 3. FDG-PET M24 (ADAS-Cog 24 months): r = -0. 40 | 3. |
|||
| A | |||||
The presence of insulin resistance and the detailed steps of the insulin pathway
were examined on post-mortem brain tissues from non-diabetic subjects with AD and
MCI and control subjects [77, 78]. The examined areas were the hippocampus, the
dentate gyrus and subiculum, the prefrontal cortex and the cerebellar cortex. The
insulin biological pathway under normal conditions is Insulin
The levels of all the aforementioned kinases were elevated in brain tissue
samples of subjects with AD, and elements of the amyloid plaques (A
Insulin has a role in impeding amyloid beta accumulation by promoting APP
cleavage into the non-amyloidogenic, soluble sAPPalfa and stimulating the
degradation of A
A
The A
The microglia is the main phagocyte in the central nervous system (CNS), and
provides a surveillance mechanism against pathogens via toll-like receptors
(TLR), antigen presentation and cytotoxicity activity, such as the production of
reactive oxygen species and cytokines [91]. Microglia shows pro-inflammatory
hyperactivation in AD, which is induced by interferon gamma (INF
Furthermore, the transcription of certain microRNAs (miRNA), such as miRNA-125b,
is upregulated in AD, and has a higher concentration in the CSF [95]. This is
thought to be a consequence of activated nuclear factor kappa B (NF-
Peripheral proinflammatory cytokines may be able to activate the microglia, as
the integrity of the BBB decreases with age. BBB degradation, which begins in the
hippocampus, was observed to be more prominent in MCI and in early-onset AD than
in normal aging brains [98, 99]. Moreover, hyperglycemia and hyperinsulinemia, as
seen in T2DM, synergistically impair the permeability of the BBB [100].
Additionally, T2DM enhances the pro-inflammatory signals due to the increase the
oxidative stress and NF-
The enhanced pro-inflammatory signals in the brain due to the increased
cytokines and reactive oxygen species (ROS) leads to initiation of autophagy.
Accumulation of A
Production of pro-inflammatory cytokines (IL-1, IL-6, TNF
Several bacteria have the ability to cause inflammation, such as
Bacteriodes, Alistipes, Gemella, and Blautia,
which are more abundantly found in AD cases, whereas the anti-inflammatory
bacteria, including Firmicutes, Actinobacteria,
Dialister, and Bifidobacterium are less abundant in AD [106].
An increased number of AD-related bacteria was associated with a greater level of
CSF AD biomarkers (p-tau and p-tau/A
An investigation by Cattaneo et al. showed a greater number of pro-inflammatory bacteria, such as Escherichia and /Shigella species, and a lower number of anti-inflammatory, Eubacterium rectale species in the gut of cognitively impaired individuals [107]. Furthermore, an increased level of pro-inflammatory bacteria was found in cognitively impaired subjects with detectable amyloid plaques by PET scan, but not in subjects with undetectable amyloid plaques [107].
The abundant pro-inflammatory bacteria already predominate in the pre-diabetic state, and the increased ratio of Bacteroidetes to Firmicutes is accompanied by reduced glucose tolerance in diabetes [108, 109]. This indicates that systemic inflammation, influenced by the composition of the gut microbiome, may have a significant role in the progression of pre-diabetes and that of AD.
Dietary habits influence the composition of the microbiome; an animal-based diet, including meat, eggs, and cheeses increased the abundance of Bacteriodes and decreased the abundance of Firmicutes [110]. In contrast, the plant-based diet, rich in grains, legumes, fruits, and vegetables increased the abundance of fiber-fermenting Firmicutes, such as Eubacteria and Roseburia, which leads to an increased level of short-chain fatty acids [110].
SCFAs, particularly butyrate, have several protective features such as
maintenance of the integrity of the intestinal wall, tight junction amplification
and maintaining the balance of the inflammatory pathways [111]. Butyrate
suppresses production of the bacterial LPS-induced pro-inflammatory cytokines,
IL-1, IL2, IL6, IL8, IL12, and TNF
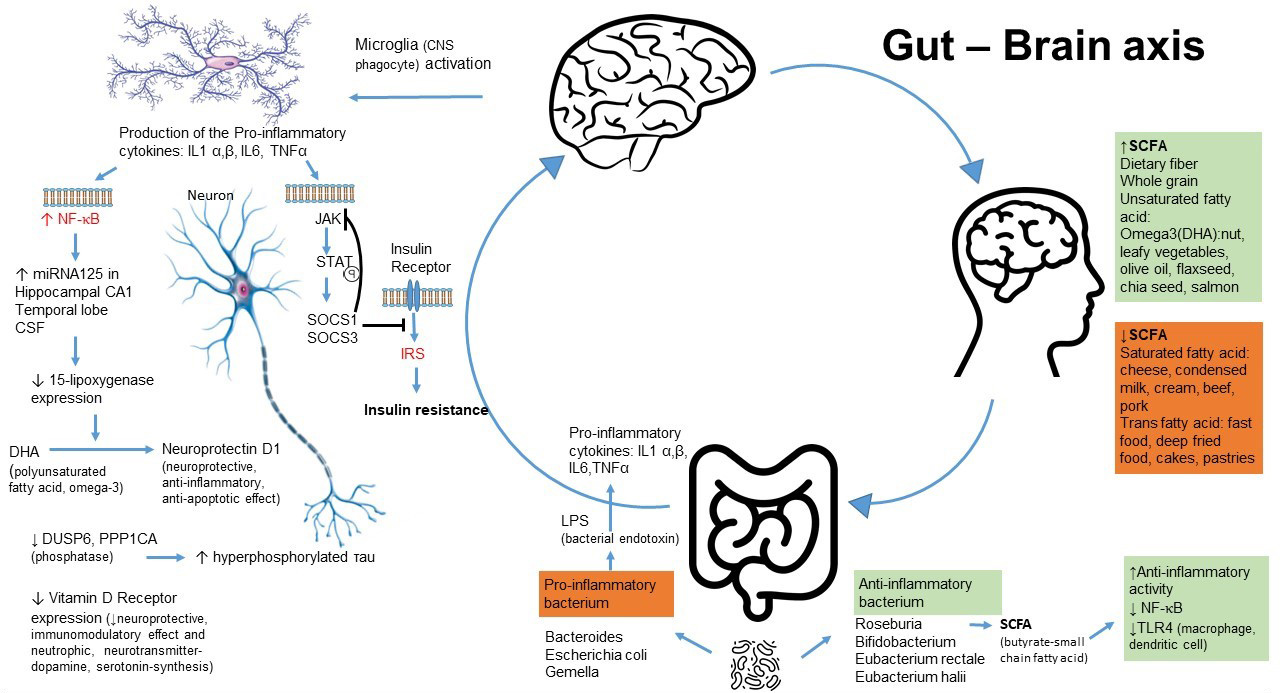 Fig. 2.
Dietary effect on the gut microbiome. The gut microbiome plays an important role in insulin resistance in Alzheimer’s Disease and in Type 2 Diabetes.
The pathological processes of AD and T2DM share many common features such as inflammation. Moreover, the peripheral insulin resistance without the development of T2DM can further exacerbate the pathological processes in the progression of AD. The pathological changes of AD may also be involved in causing insulin resistance in neurons. It is important to note that the function of the insulin in the central nervous system is primarily neuroregulatory, and has less of a role in the metabolism of glucose in the brain, in contrast to its function in peripheral organ systems.
Numerous factors play a role in the development of AD, and each enhancing the other can cause a vicious cycle in its progression. The discussed experimental models, clinical trials and population-based studies indicate that brain insulin resistance can be present independently of peripheral insulin resistance, which itself leads to amyloid plaque and tau neurofibrillary tangle formation and consequently neuronal cell death.
The presented studies indicate that gut dysbiosis might be one of the causative factors of brain insulin resistance, independently of peripheral insulin resistance. This theory is supported by the previously revealed pathological inflammatory pathways stimulated by gut dysbiosis. Peripheral insulin resistance can also develop or become further accelerated by the stimulated pro-inflammatory pathways in gut dysbiosis. Therefore, evidence suggests that gut dysbiosis may have a crucial role in the progression of AD by promoting insulin resistance in the periphery and in the brain. There is a negative association between a reduced anti-inflammatory bacterial load and AD pathology. On the other hand, an abundantly anti-inflammatory gut microbiome presumably decreases the risk and progression of AD by production of protective factors, such as SCFA. Consequently, lifestyle modification, which a properly composed healthy diet is a pivotal part of, has proved its efficient protective role in deceleration of cognitive decline in AD.
Both AD and T2DM are considered chronic diseases, which constantly develop from the asymptomatic to the symptomatic forms. The progression of AD can be mitigating by alleviation of aggravating factors, such as systemic inflammation and diabetes. The presence of brain IR in AD, elaborated in this review, needs further clarification by possible postmortem brain tissue evaluation and clinical trials. Increasing evidence shows the determinative role of inflammation in the progression of AD that might attain its effect through the brain insulin pathway and the defective autophagic function. Moreover, it was revealed that insulin can affect autophagy via regulatory molecules. These associations point towards new therapeutic targets.
In conclusion, we propose the importance of implementing adequate lifestyle changes and initiating timely treatment of chronic inflammatory conditions and metabolic dysfunction in order to decrease the risk of and prevent progression of AD. Further research is warranted in the investigation of these associations.
EL conceived and designed the research project and interpreted the data. She was a major contributor in writing the manuscript. AS, DS and JA contributed writing and editing the manuscript. AS and DS revised manuscript. All authors read and approved the final manuscript.
Not applicable.
Not applicable.
Not applicable.
The author declares no conflict of interest.