


1 Laboratory of Molecular Immunology, Federal State Budgetary Scientific Institution Research Institute of Fundamental and Clinical Immunology, 630099 Novosibirsk, Russia
2 Center for Collective Usage SPF-vivarium, Institute of Cytology and Genetics, Siberian Branch of the Russian Academy of Sciences, 630090 Novosibirsk, Russia
3 Department of Personalized Cancer Immunotherapy, Mie University Graduate School of Medicine, 514-8507 Tsu, Mie, Japan
‡Deceased.
Abstract
Disialoganglioside (GD2) is a tumor-associated antigen that is highly expressed in various neuroectodermal cancers, including melanoma. While chimeric antigen receptor (CAR) T-cell immunotherapy has demonstrated remarkable success in treating hematologic neoplasms, the identification of suitable targets remains a major obstacle in translating this approach to solid tumors.
Peripheral blood T lymphocytes from six healthy donors were used to generate GD2-specific CAR T cells via retroviral transduction. The resulting GD2.CAR T cells were characterized by NanoString transcriptome profiling, flow cytometry with hierarchical stochastic neighbor embedding (HSNE) dimensionality reduction, and in vitro cytotoxicity assays against GD2+ and GD2- melanoma cell lines. In vivo experiments were also performed using GD2+ xenograft models and a single intratumoral dose of 8 × 10⁶ GD2.CAR T cells.
The GD2.CAR T cell population exhibited a predominantly naive phenotype (CD8+CD40L+CD69‒CD107a+4-1BB+FasL+) and effective anti-tumor mechanisms involving the granzyme A/B axis, the Fas/FasL axis, and cytokine release. Transcriptome analysis revealed transduction-related effects on proliferation and a shift towards an effector phenotype during early co-culture with tumor cells, accompanied by upregulation of interferon-gamma (IFN-γ) and cytokine signaling genes. GD2.CAR T cells demonstrated robust cytotoxicity against GD2+ melanoma cells in vitro, while significant in vivo tumor control was observed in xenograft models.
GD2.CAR T cells demonstrate potent anti-tumor activity against melanoma in vitro and in vivo, highlighting their therapeutic potential and warranting further clinical investigation.
Keywords
- CAR T cells
- disialoganglioside
- xenograft model
- cytotoxicity
- transcriptome profiling
Melanoma is a common and aggressive cancer type originating from melanocytes and notorious for its rapid metastasis [1, 2]. Although surgery, chemotherapy, and radiation remain first-line therapies, melanoma often develops resistance, and prognosis worsens at later stages [3]. Immunotherapy is a promising method that employs natural defense mechanisms to treat tumors. Adoptive cell therapy is effective in the treatment of metastatic melanoma [4], but lacks specificity in targeting tumor cells. To address this limitation, chimeric antigen receptor (CAR) T-cell therapy has been developed. Genetically engineered CAR T cells can recognize tumors in a non-major histocompatibility complex (MHC)-restricted manner without co-stimulation [5]. As a result, CAR T cells are an off-the-shelf T cell product capable of targeting specific antigens for tumor elimination. Nonetheless, the application of CAR T-cell therapy has significant challenges in an immunosuppressive tumor microenvironment (TME) characterized by molecular, cellular, and metabolic profiles that could lead to T cell exhaustion and dysfunction [6].
The selection of a tumor-specific surface antigen that is highly expressed on tumor cells but minimally expressed on normal cells is critical for effective CAR T-cell therapy. This is essential for achieving optimal treatment outcomes and minimizing negative side effects. Disialoganglioside (GD2) is overexpressed in melanoma but shows limited expression in normal tissues [7, 8]. Increased GD2 expression on melanoma cells may be associated with metastasis [9] and the malignant phenotype of melanoma [10]. Structurally, GD2 is a glycolipid expressed on the cell surface, making it a suitable target for recognition by antibodies or chimeric antigen receptors. In addition, GD2 has shown potential as a target for the development of CAR T-cell therapies against melanoma [11].
Preclinical studies have shown that GD2.CAR T cells, either alone or in combination with other therapeutic agents, can efficiently eliminate melanoma cells in vitro and suppress tumor growth in vivo [12, 13, 14, 15]. However, a phase I clinical trial of GD2.CAR T cells demonstrated limited expansion and persistence, with T cells exhibiting an exhausted phenotype in metastatic melanoma patients, as evidenced by ex vivo analysis of peripheral blood samples after infusion [16]. This approach requires the development of novel methods to enhance the design of the CAR construct. Moreover, further investigations are required into the impact of the TME on CAR T cells.
In the present study, we have built upon our previous observation of antitumor
activity with melanoma-associated antigen family A4 (MAGE-A4)-specific T-cell
receptor (TCR)-like CAR T cells and New York esophageal squamous cell carcinoma 1
(NY-ESO-1)-specific TCR-engineered T cells [17, 18] to evaluate the therapeutic
potential of GD2-specific CAR T cell therapy. We utilized a previously optimized
retroviral construct encoding a GD2-specific single-chain variable fragment
(scFv) derived from a modified mAb 220-51, fused to human CD28 and CD3
The study was carried out in accordance with the guidelines of the Declaration
of Helsinki and was approved by the local ethics committee of the Research
Institute of Fundamental and Clinical Immunology (protocol #139 on May 30,
2022). Healthy blood donors (n = 6 males, age 27.33
The human melanoma cell line SK-MEL-37 (RRID: CVCL_3878) and patient-derived
cell lines S6 and V9 were provided by Professor H. Shiku (Mie University Graduate
School of Medicine, Japan). The local ethics committee of the Research Institute
of Fundamental and Clinical Immunology approved the use of patient-derived cell
lines S6 and V9 in this study (protocol #139 on May 30, 2022). All cell lines
(SK-MEL-37, S6, and V9) tested negative for Mycoplasma (Cat. #MR004, Evrogen,
Moscow, Russia), and the SK-MEL-37 cell line was validated by short tandem repeat
(STR) profiling. To ensure the identity of the cell lines used, the S6 and V9
patient-derived cell lines were validated using light microscopy to confirm
characteristic melanoma morphology (pleomorphism, large nuclei, variable
cytoplasm, and the presence/absence of melanin pigment). Cells were cultured in
RPMI-1640 medium supplemented with 10% fetal bovine serum (Cat. #RM10832-500ML,
HiMedia, Maharashtra, India), 2 mM L-glutamine (Cat. #1383, Biolot, Saint
Petersburg, Russia), 5
A gamma-retroviral vector encoding a GD2-specific CAR was provided by Professor H. Shiku. The structure of the pGD2 transfer Moloney murine leukemia virus (MMLV) plasmid is shown in Fig. 1.
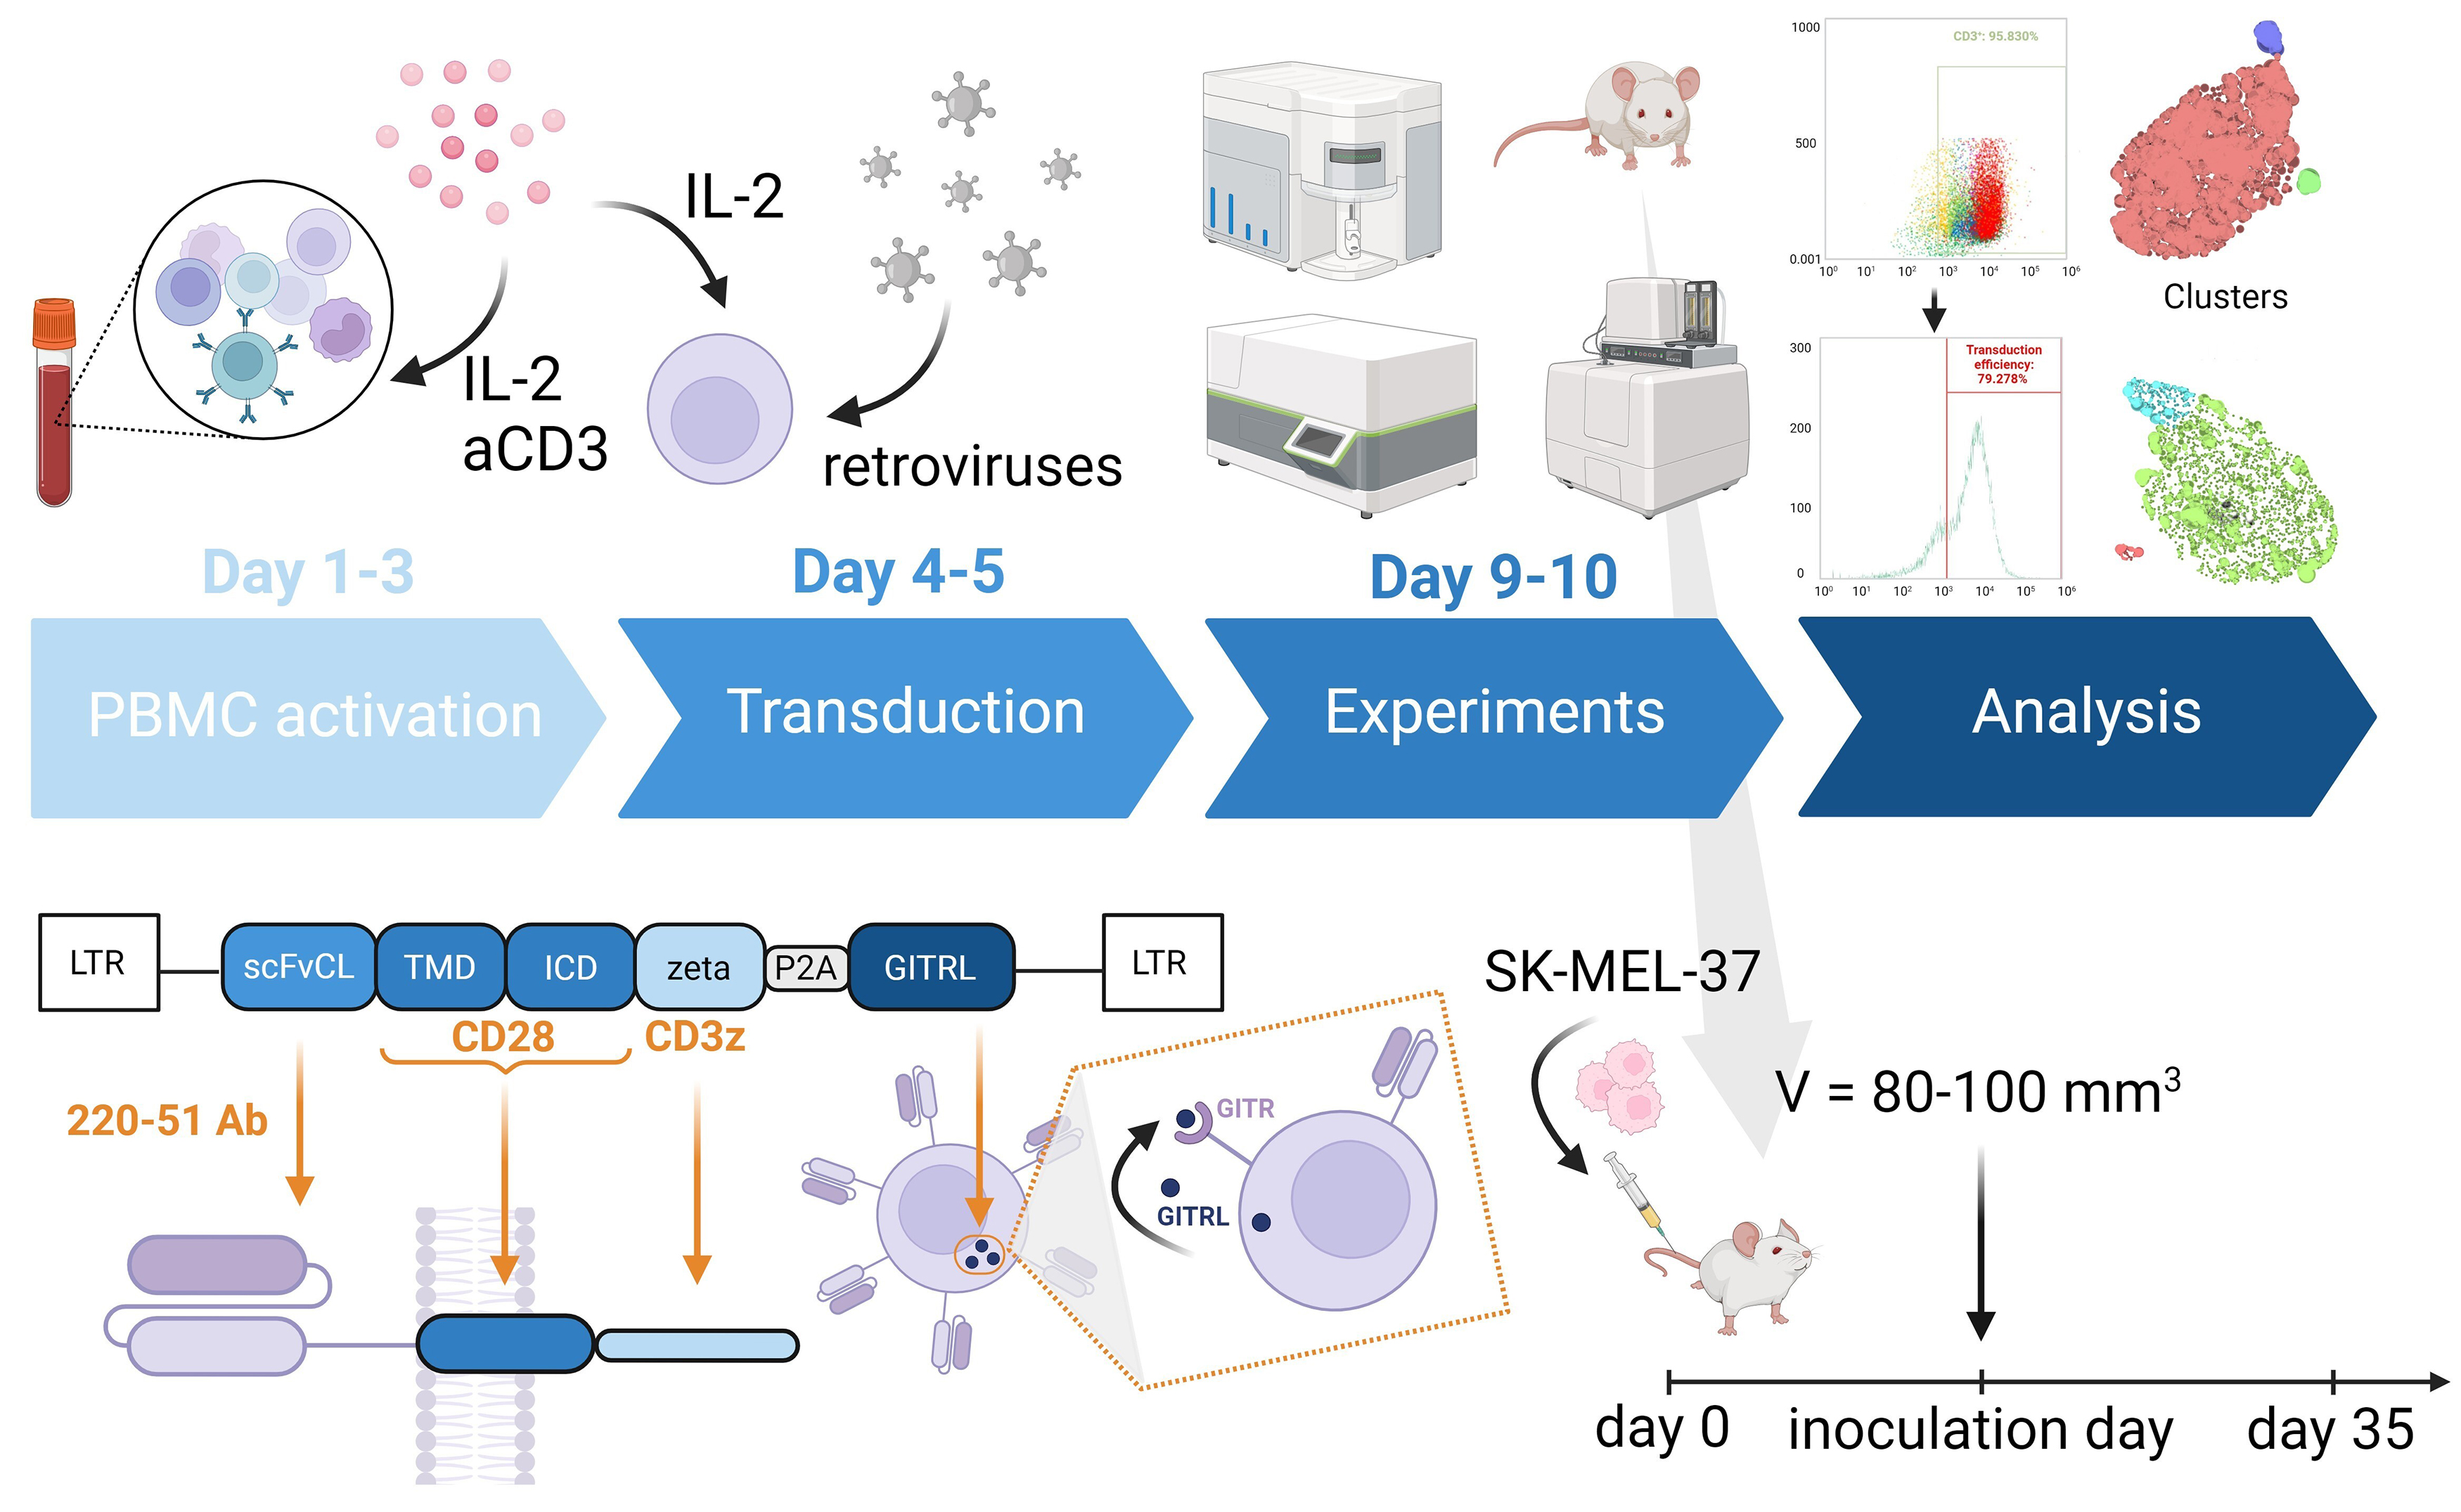 Fig. 1.
Schematic representation showing the structure of the pGD2
transfer MMLV plasmid, and the in vitro and in vivo
experiments. The CAR construct includes GD2-specific scFv from a modified mAb
220-51, as well as the human signaling endodomains CD28 (transmembrane and
intracellular domain) and
CAR T cells were generated by isolating PBMCs from healthy adult donors using
Ficoll-Urografin (Cat. #17-1440-03, PanEco, Moscow, Russia) density gradient
centrifugation and washed twice with PBS (Cat. #1247, Biolot, Saint Petersburg,
Russia). Proliferation was stimulated by coating 12-well plates (TPP,
Trasadingen, Schaffhausen, Switzerland) with 25 µg/mL RetroNectin
(Cat. #T100B, Takara Bio, Kyoto, Japan) and 5 µg/mL anti-CD3
antibodies (Cat. #300465, Biolegend, San Diego, CA, USA). PBMCs were then plated
at 0.5
Tumor cells (SK-MEL-37, S6, and V9) were seeded at 4–5
Flow cytometric analysis was performed using the following monoclonal antibodies (all from Biolegend, San Diego, CA, USA): CD3 (clone HIT3a), CD4 (clone RPA-T4), CD8 (clone SK1), CD45RA (clone HI100), CD62L (clone DREG-56), CD137 (4-1BB) (clone 4B4-1), CD154 (CD40L) (clone 24-31), CD69 (clone FN50), CD178 (FasL) (clone NOK-1), CD107a (clone H4A3), CD366 (TIM-3) (clone F38-2E2), CD279 (PD-1) (clone EH12.2H7), and GD2 (clone 14G2a). These were conjugated with phycoerythrin (PE), PE-Cy7, peridinin-chlorophyll-protein complex (PerCP)-Cy5.5, allophycocyanin (APC)-Cy7, Alexa Fluor (AF) 647, AF488, AF700, Brilliant Violet (BV) 421, BV570, BV647, and BV711. Antibodies were used according to the manufacturer’s recommendations, and FMO controls established negative gates. Transduction efficiency was assessed using biotin-SP-AffiniPure F(ab’)2-fragment-specific goat anti-mouse IgG (1:1000, Cat. #115-066-072, Jackson ImmunoResearch, West Grove, PA, USA) for the detection of GD2-CAR. Cells were stained by incubating with antibodies (1 to 1000 dilution) for 20 minutes at room temperature in the dark. After washing, streptavidin-PE (1 to 600 dilution) (1:600, Cat. #405203, Biolegend, San Diego, CA, USA), anti-CD3, and Zombie Aqua Dye (1:100, Cat. #423101, Biolegend, San Diego, CA, USA) were added to determine the population of CAR T cells and their viability. Stained cells were washed in PBS with 0.1% NaN3 and analyzed on an Attune NxT flow cytometer. Non-transduced cells served as controls.
Flow cytometry data analysis was performed using a combination of software tools. Cells were gated using Attune NxT software (version 3.2.1, Thermo Fisher Scientific, Waltham, MA, USA) to exclude debris, doublets, and dead cells, and to identify CD3+ and transduced cells (Supplementary Fig. 1). The resulting .fcs files were converted to .csv format using custom Python (version 3.13, Wilmington, DE, USA) code via Jupyter Notebooks (version 6.5.4, Austin, TX, USA). Subsequently, the .csv files were arcsinh-transformed and fdaNorm-normalized using an R script [21] and exported as .fcs files. HSNE dimensionality reduction was performed using the Cytosplore app [22] on cytotoxic and activation markers (CD4, CD8, CD40L, CD69, 107a, 4-1BB, and FasL), and T cell memory and exhaustion markers (CD8, CD45RA, CD62L, CD69, PD-1, and TIM-3). Subsequently, GraphPad Prism (version 9.4.1, GraphPad Prism Software, San Diego, CA, USA) was used to export cell frequencies per cluster and visualize them as box plots.
Cytokine concentrations in supernatant were measured using the LEGENDplex™ Human CD8/NK Panel (13-plex) and Filter Plate Kit (Cat. #740267, Biolegend, San Diego, CA, USA) according to the manufacturer’s recommendations. Cytokines were subsequently classified based on their respective concentration levels.
Cytotoxicity was assessed by measuring LDH release in cell culture supernatants using a CytoTox 96 Non-Radioactive Cytotoxicity Assay (Cat. #G1780, Promega Corporation, Madison, WI, USA) according to the manufacturer’s recommendations. This assay measures LDH activity via a 30-minute enzymatic reaction that converts tetrazolium salt INT into red formazan product. The absorbance of the resulting color was measured using a Varioskan plate reader (Thermo Fisher Scientific, Waltham, MA, USA). Color intensity correlated with the number of lysed cells.
For gene expression analysis, transduced T cells were isolated using a two-step
magnetic sorting procedure. First, cells were incubated with
F(ab’)2-fragment-specific goat anti-mouse IgG antibodies for 20 minutes in
cold Versene solution containing 0.5% bovine serum albumin, labeled with
MojoSort™ Streptavidin Nanobeads (Cat. #480016, Biolegend, San
Diego, CA, USA) at a ratio of 10 µL antibodies/beads per 10
Total RNA was extracted from 3–6
Gene expression analysis was performed using the NanoString nCounter SPRINT
Profiler system with 100 ng of total RNA per sample (n = 6). The nCounter Human
Immunology v2 panel, comprising 579 genes (Cat. #XT-CSO-HIM2-12, NanoString,
Seattle, WA, USA), was used to analyze RNA samples on the NanoString Sprint
instrument (NanoString, Seattle, WA, USA). Samples were hybridized according to
the manufacturer’s recommendations. Normalization and quality control were
performed using nSolver 4, incorporating synthetic positive controls and the 15
housekeeping genes included in the panel. To remove non-expressing genes, a
background threshold was applied to the normalized data, defined as: (mean of all
NEG controls) + 2
To determine the anti-tumor efficacy of transduced T cells in vivo,
8-week-old male or female non-obese diabetic (NOD)/Rag1-null/Il2r
Data are presented as frequencies, percentages, or mean
Three human melanoma cell lines (SK-MEL-37, S6, and V9) were analyzed for surface expression of GD2 by flow cytometry using mAb 14.G2a. The SK-MEL-37 and S6 cell lines showed high GD2 expression (89.4% and 85.1%, respectively). The V9 cell line was used as a negative control due to its low GD2 expression (2.3%) and antigen density on the cell surface.
The second-generation CAR construct containing GD2-specific scFv from a modified
mAb 220-51 [19] and human signaling endodomains CD28 and CD3
To further evaluate the signature of GD2.CAR T cell memory subpopulation changes, flow cytometry and HSNE analysis were used to assess marker expression according to T cell memory subsets immediately after transduction and before co-culture with the tumor cells. CAR T cells were classified into four differentiation subsets based on CD45RA and CD62L expression: naive/stem memory T cells (Tn/scm, CD62L+CD45RA+), central memory T cells (Tcm, CD62L+CD45RA‒), effector memory T cells (Tem, CD62L‒CD45RA‒), and late effector memory T cells (Temra, CD62L‒CD45RA+) [24]. HSNE analysis (Fig. 2) revealed the CD8+ GD2.CAR T cell population was mainly composed of Tn/scm cells, with only small percentages of Tcm and Temra cells observed (Supplementary Fig. 2).
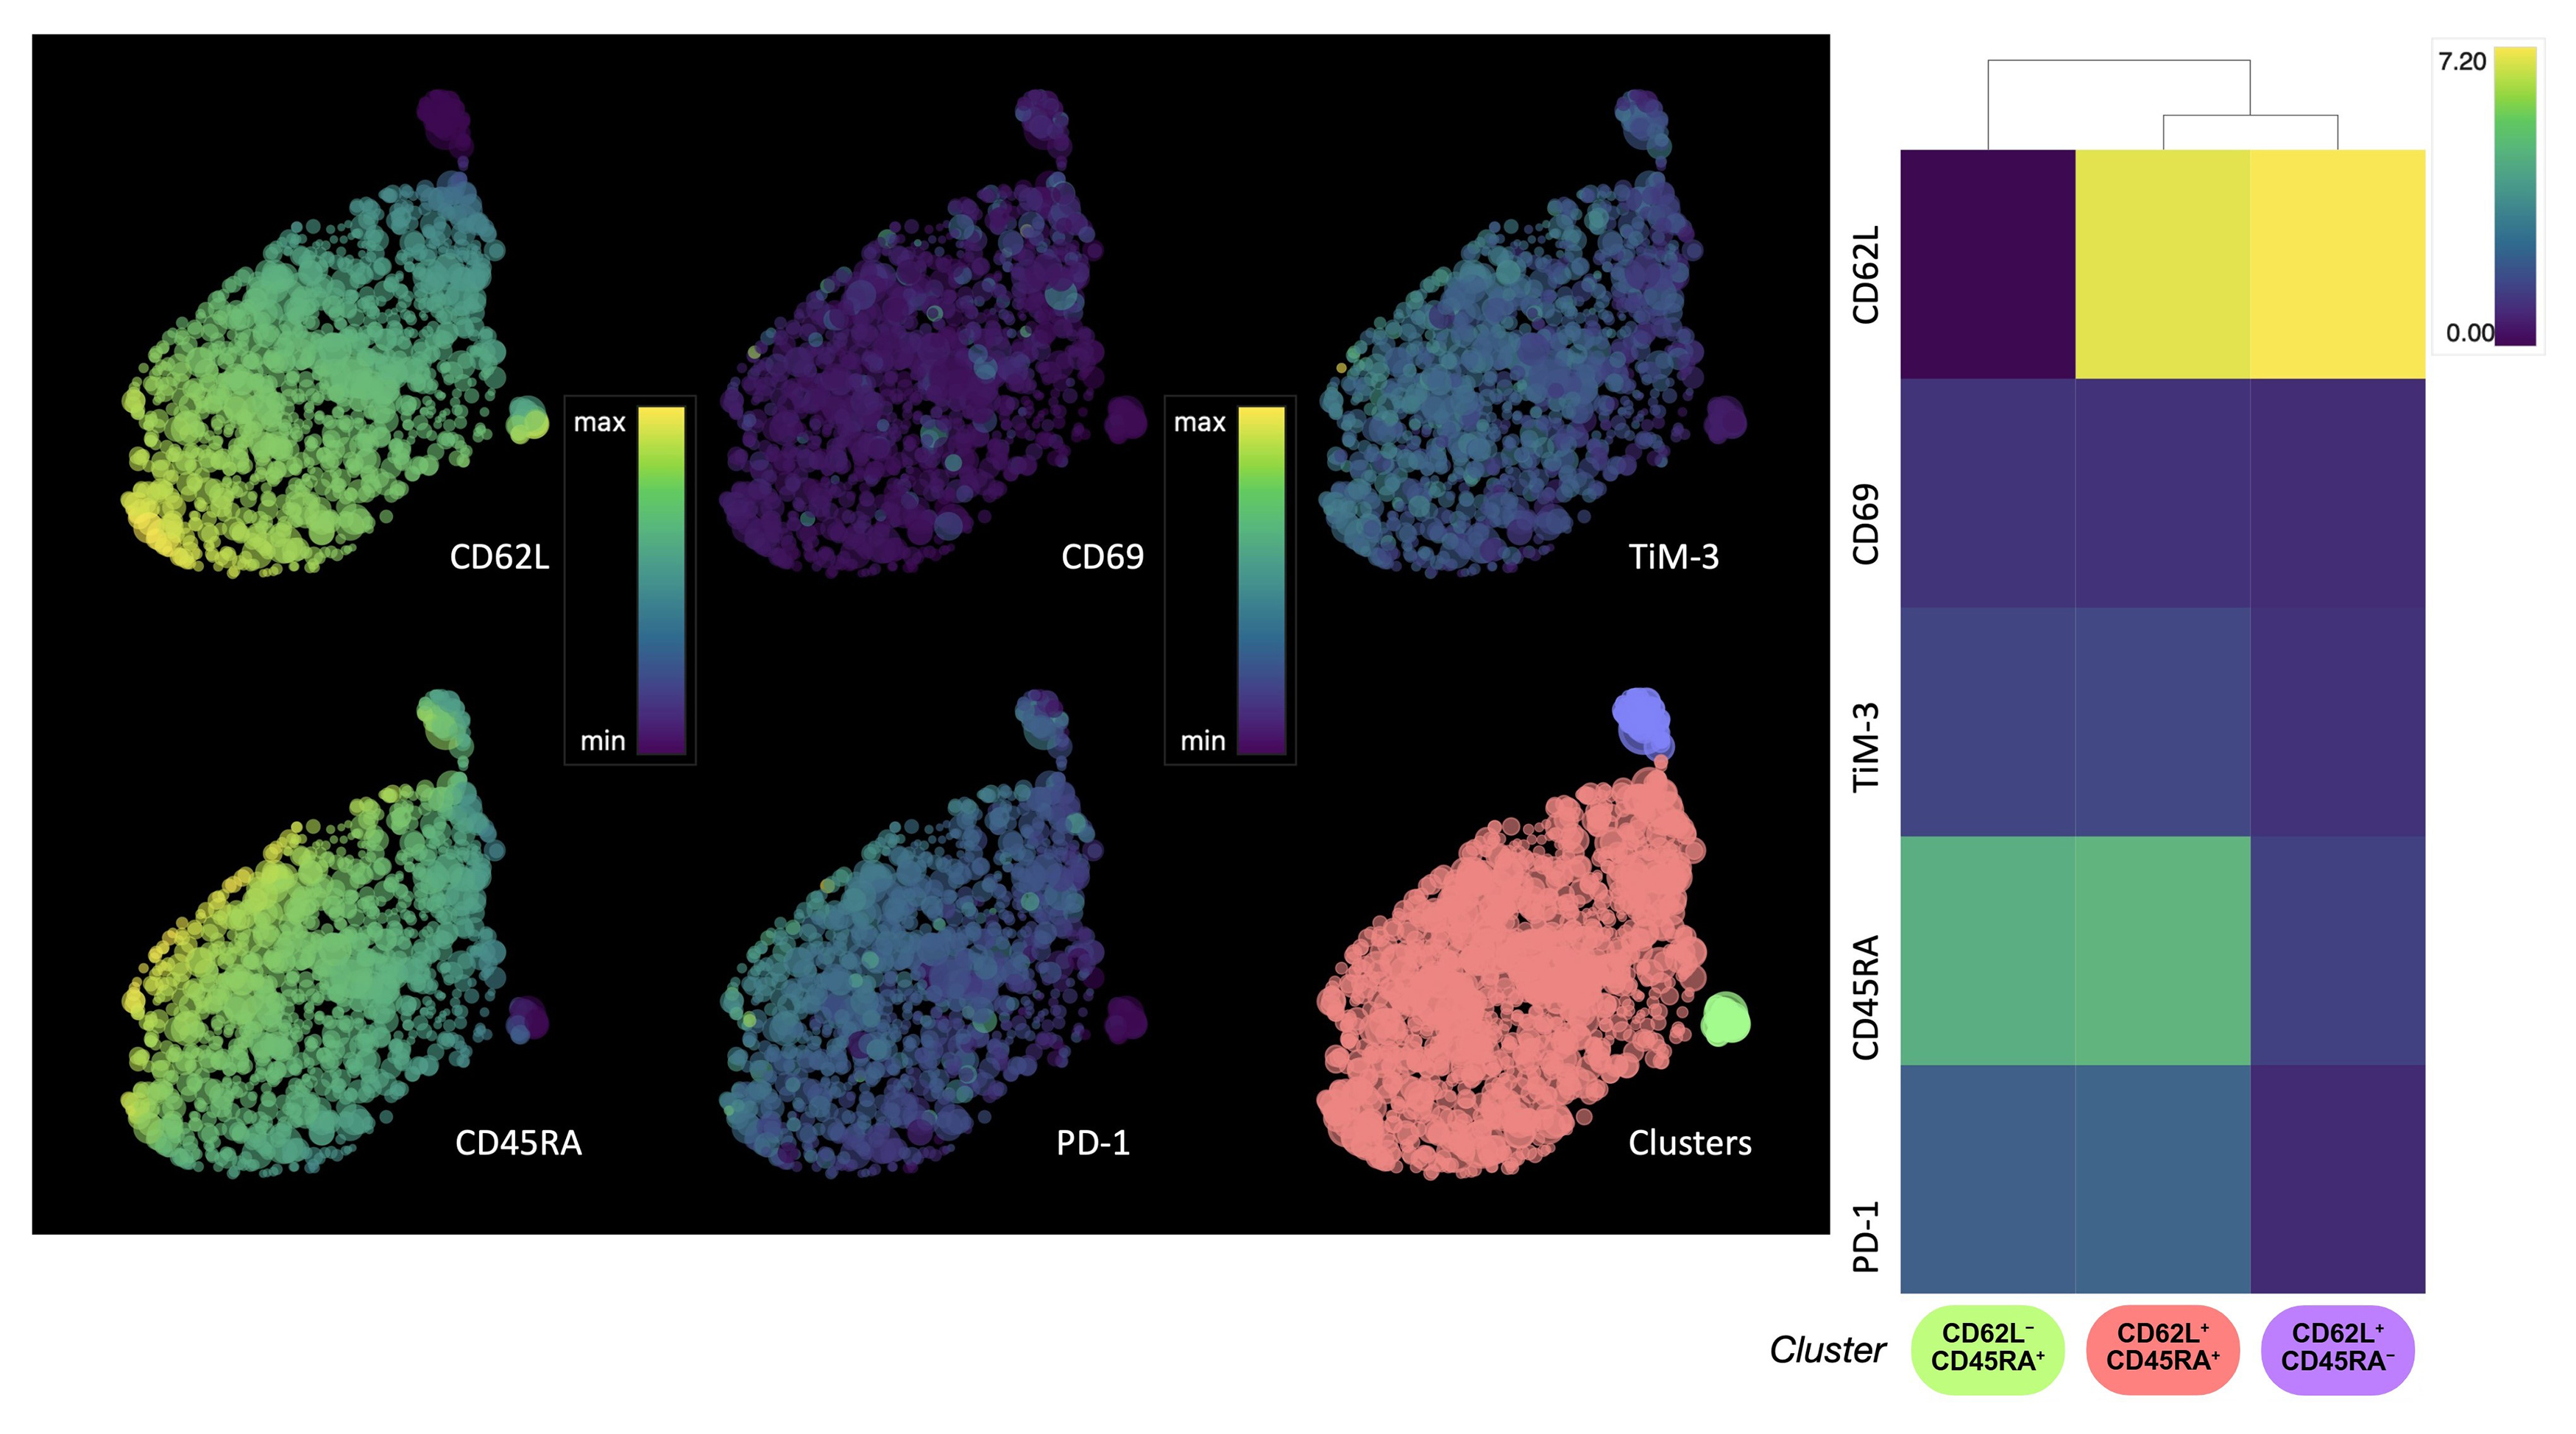 Fig. 2.
HSNE analysis of the expression of T cell memory and activation/exhaustion markers in CD8+ GD2.CAR T cells. Single-cell level HSNE dot plots show the expression of T cell memory (CD62L, CD45RA) and activation/exhaustion (PD-1, TIM-3) markers by CD8+ GD2.CAR T cells after transduction. The color scale represents the level of expression for arcsinh transformation phenotypic markers, where violet color indicates low expression and yellow color indicates high expression. The clusters are color-coded based on the heat map (n = 5). HSNE, hierarchical stochastic neighbor embedding; PD-1, programmed cell death protein 1; TIM-3, T-cell immunoglobulin and mucin domain-containing protein 3.
Expression of the cell exhaustion markers programmed cell death protein 1 (PD-1) and T-cell immunoglobulin and mucin domain-containing protein 3 (TIM-3) was also evaluated. In general, the GD2.CAR T cell population did not show signs of exhaustion. However, a correlation was observed between the expression of CD45RA and CD62L markers and the expression of TIM-3 and PD-1 markers. The expression of cell exhaustion markers gradually increased as the cells differentiate into Tcm cells, and decreased in Temra cells (Fig. 2). It was previously reported that the increase in CD69 level is likely a manifestation of the basal level of activation by CAR-mediated tonic signaling [25]. Our transduction protocol resulted in a population of CD69‒ CAR T cells, indicating the potential absence of tonic signaling. Meanwhile, only a low proportion of CD69+ T cells was observed (Fig. 2). Furthermore, the CD69 marker is expressed only when an effector cell recognizes an antigen [26].
To investigate how retroviral transduction affects the expression of genes related to phenotypic signatures (Fig. 3), we used NanoString technology to compare the transcriptome profiles of transduced and non-transduced cells. After transduction, GD2.CAR T cells showed upregulation of genes associated with the CD8 Tn cell differentiation signature, including CD8A, CD8B, SELL, IL7R, CD45RA [27], and IL2RG [28], as well as genes associated with the CD8 Tscm/cm cell differentiation signature, such as FAS and CD45RO [27]. Upregulation of the CD40LG gene, which is canonically expressed on CD4+ T cells, was also observed in CAR+ cells [29]. In contrast, transduced cells showed downregulation of CD4 Treg-associated genes, including CD4, FOXP3, IL2RA, and CTLA4-TM [27]. It is worth noting that retroviral transduction had an impact on T cell proliferation, whereas anti-CD3-primed non-transduced cells showed upregulation of genes related to T cell activation, such as TNFRSF4 and TNFRSF9 [30]. Furthermore, GD2.CAR T cells showed increased expression of the HAVCR2 gene within the T cell exhaustion signature, whereas non-transduced cells showed increased expression of the LAG3 gene.
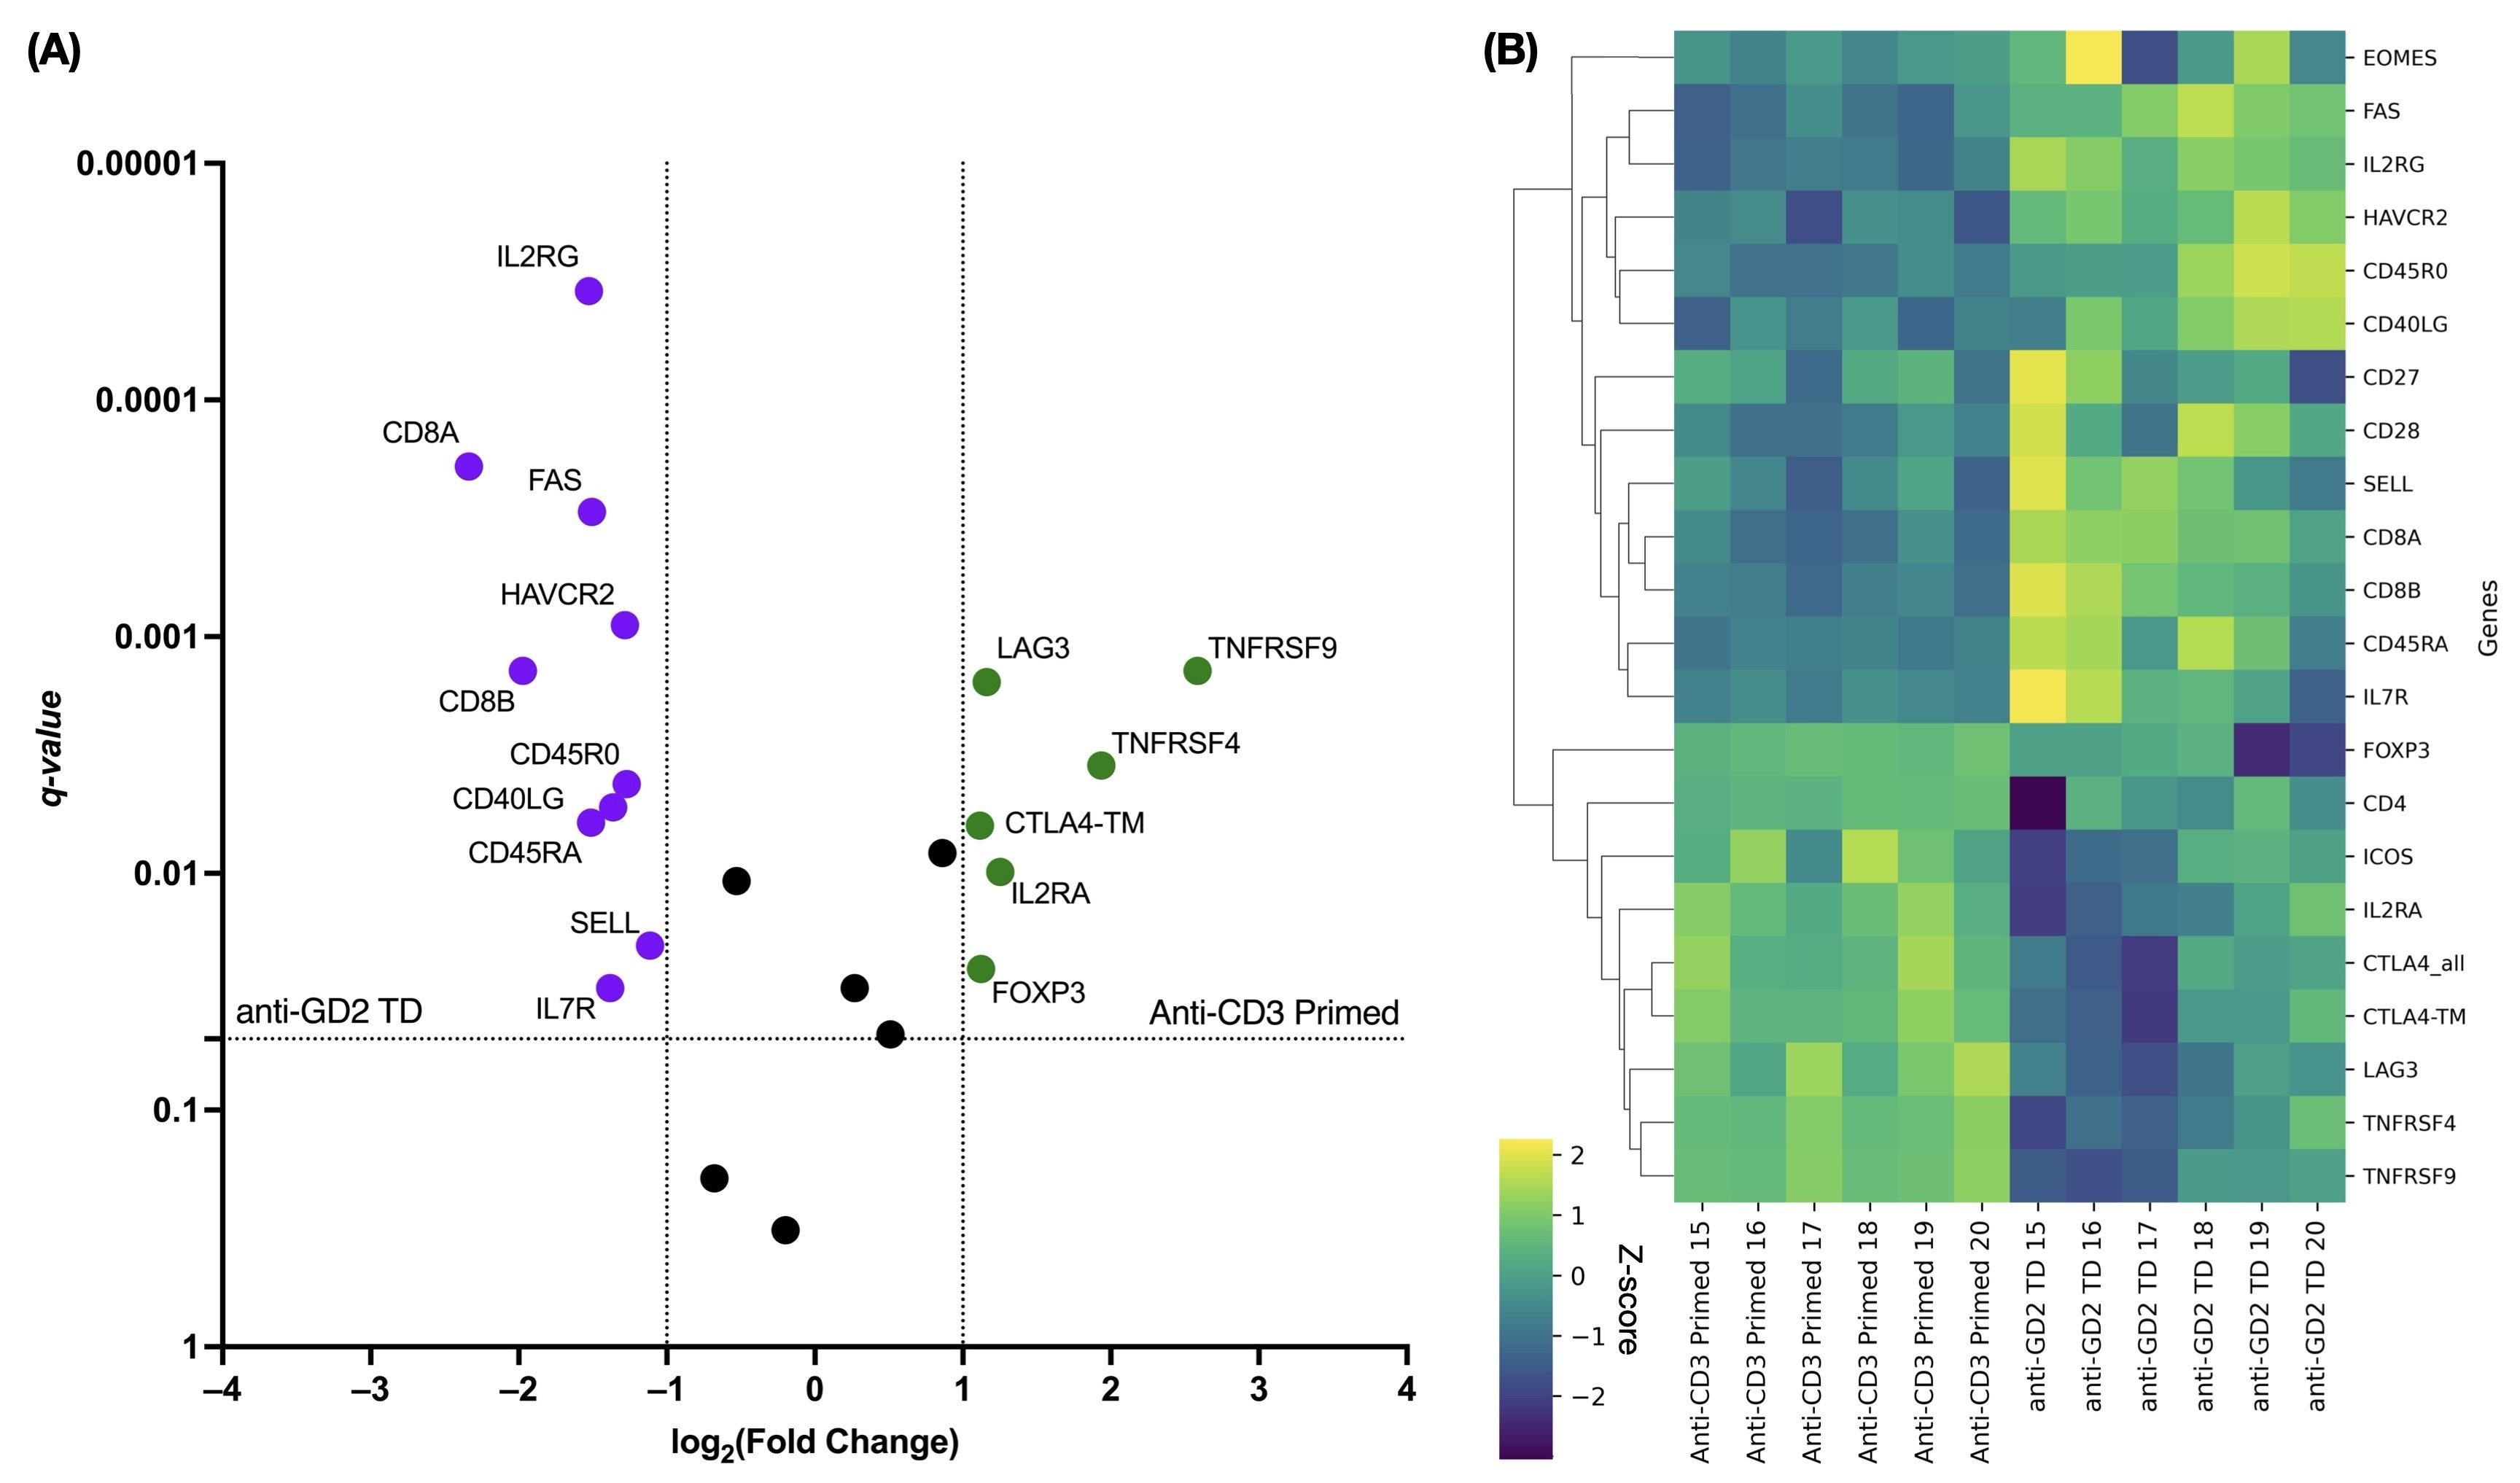 Fig. 3.
Differential gene expression in transduced versus non-transduced
T cells related to the Tn/scm phenotype. (A) The volcano plot shows
significantly up- and down-regulated genes. Violet color indicates up-regulated
genes in transduced cells, while green color indicates down-regulated genes in
non-transduced cells. q-values
Using NanoString technology, we performed differential gene analysis of GD2.CAR T cells before and after co-culture with SK-MEL-37 cells. Because our aim was to examine changes in gene expression linked to the immune response before and after co-culture with tumor cells, we selected the Human Immunology v2 panel for this study. CAR+ cells were first magnetically sorted from the general cell population and then stimulated with IL-2 for 16–17 h. GD2.CAR T cells were then cultured with tumor cells for 2 h to activate key genes that regulate the immune response. These cells were then separated from GD2-positive SK-MEL-37 cells using CD45-positive magnetic sorting to remove any contamination with tumor cells.
Although the interaction between GD2.CAR T cells and tumor cells was short, alterations were detected in several genes (Supplementary Table 1) encoding co-signaling molecules, cytokines, and chemokines that affect the immune response (Fig. 4A).
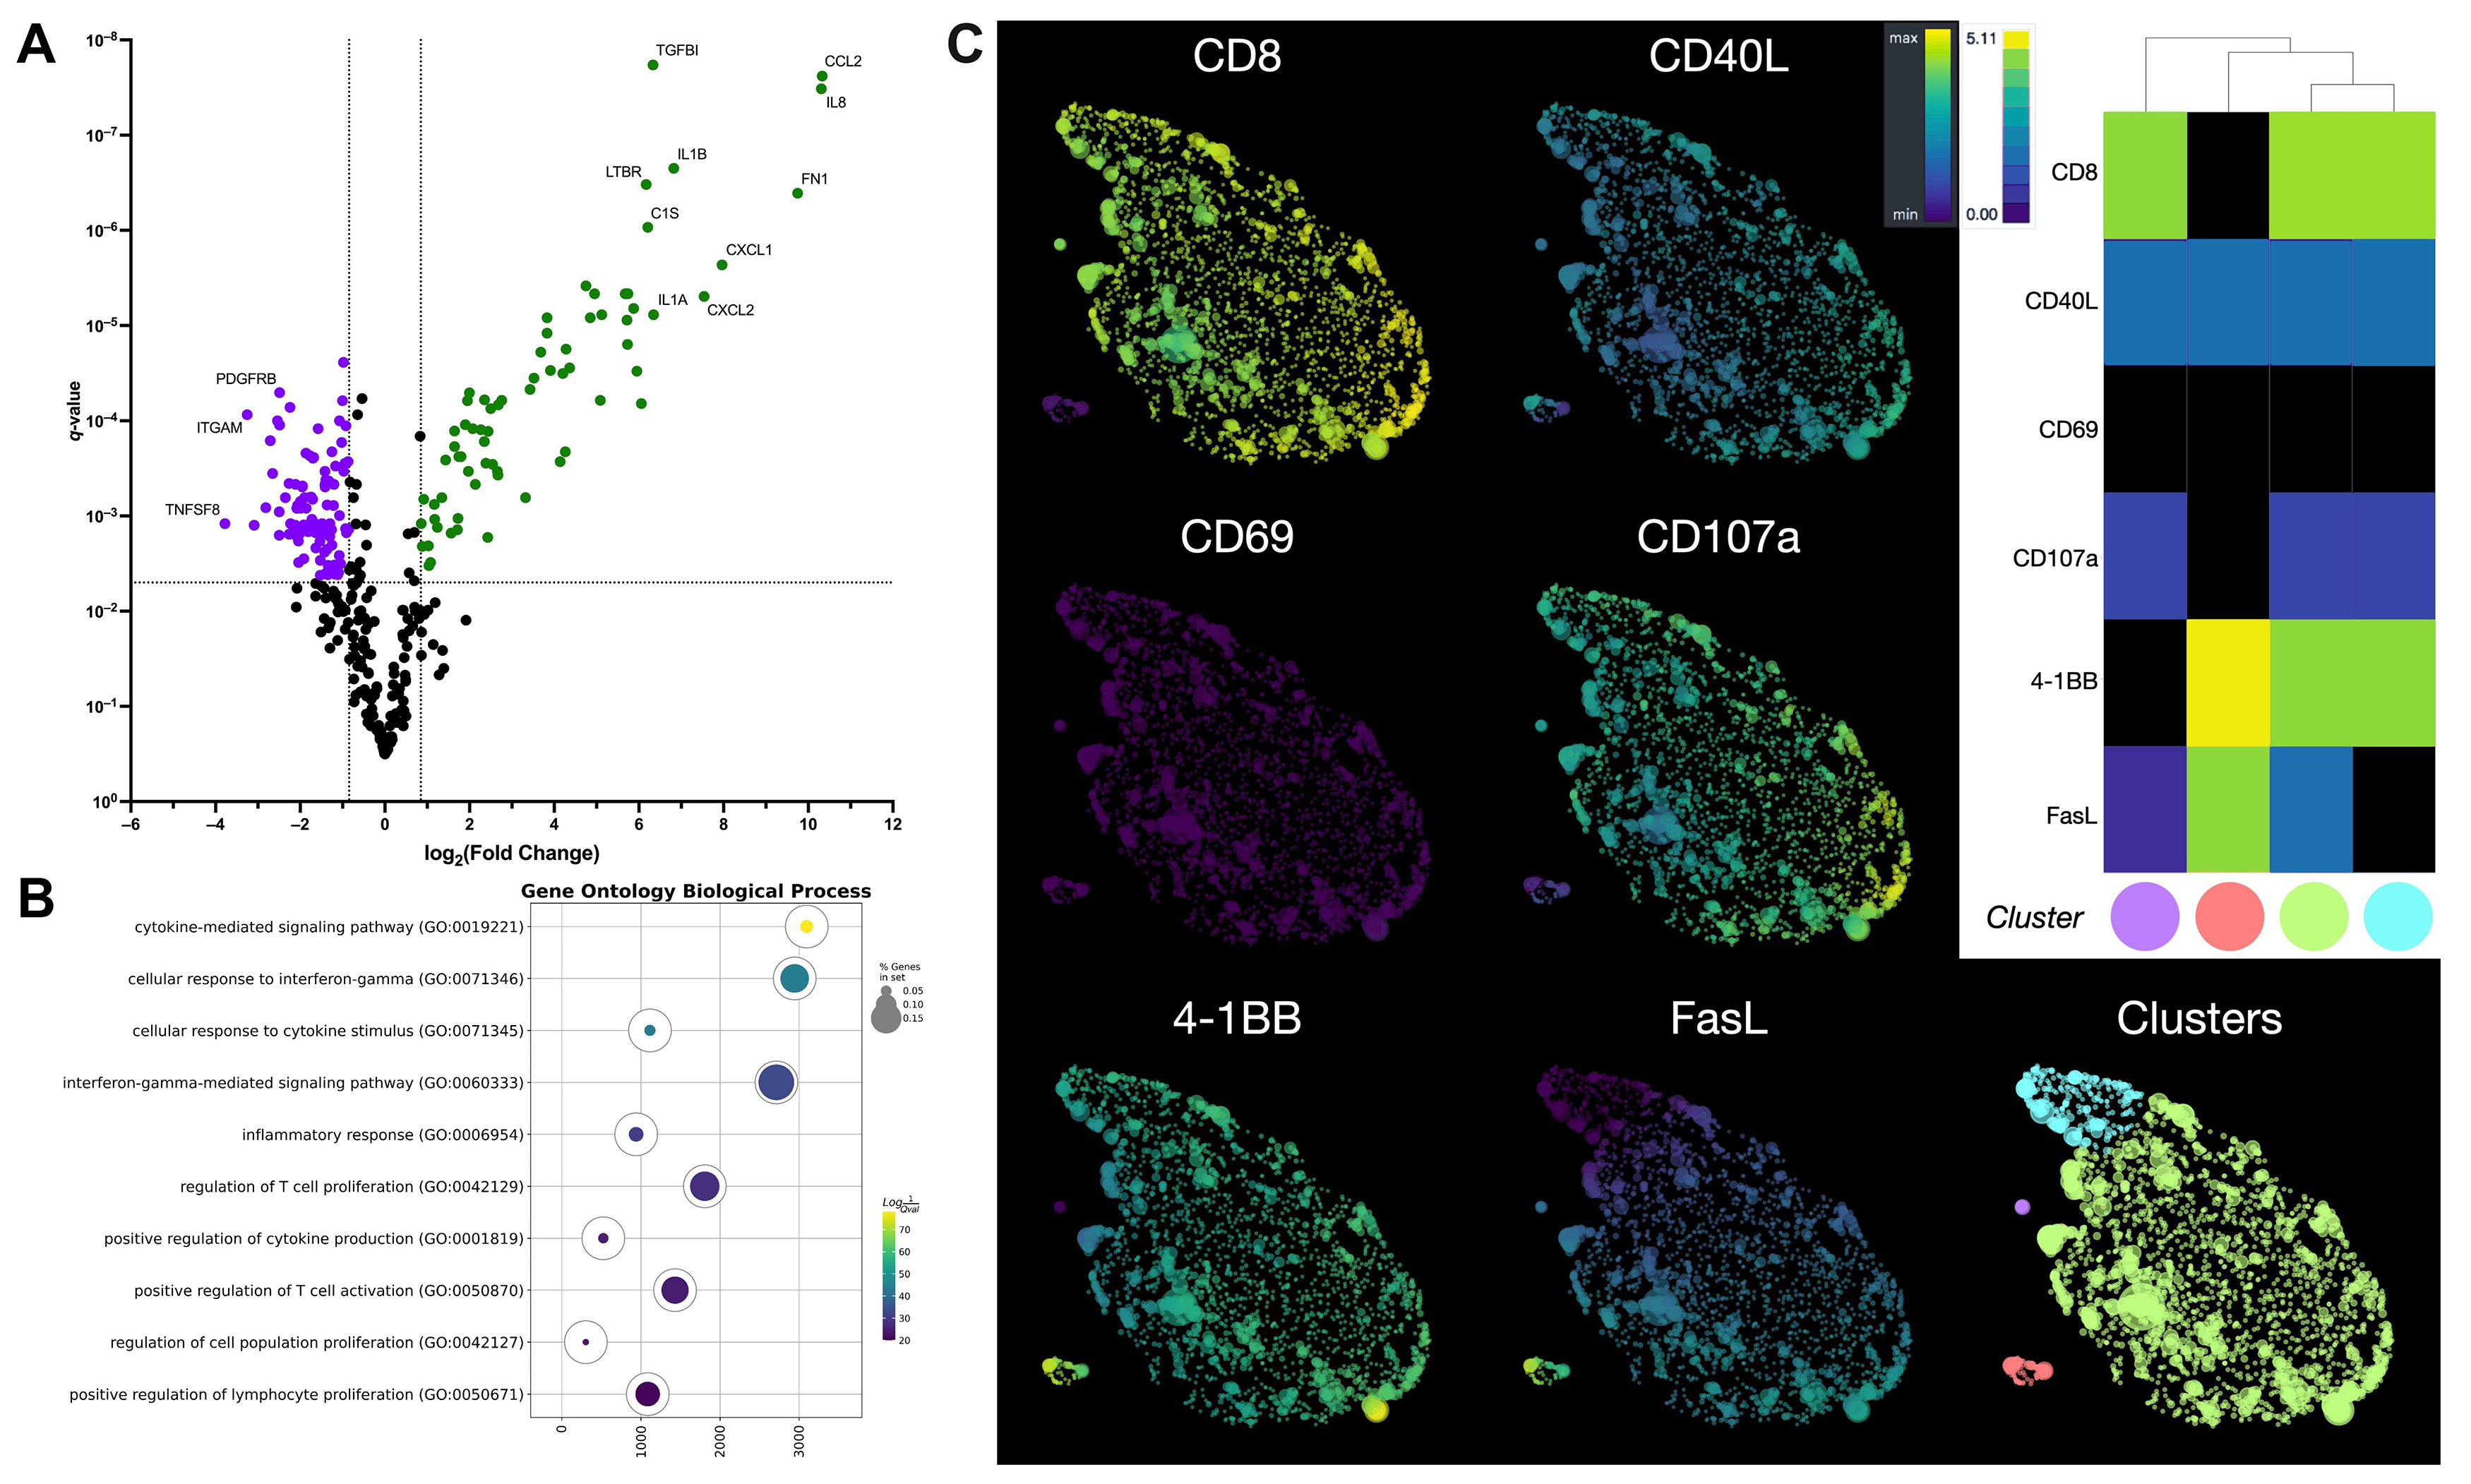 Fig. 4.
Comprehensive analysis of gene expression, signaling, and
phenotype in GD2.CAR T cells following co-culture with a melanoma cell line. (A)
The volcano plot shows differentially expressed genes in GD2.CAR T cells before
and after co-culture with SK-MEL-37 cells. Green color indicates up-regulated
genes, while violet color indicates down-regulated genes. q-values
Signatures for chemokines (CCL2, CCL20, CCL3, CCL4, CXCL1, CXCL10, CXCL11, and CXCL2), cytokines and their receptors (CSF1, CSF2, IL13, IL13RA1, IL1A, IL1B, IL1RAP, IL6, IL8, and IFNG) were found after co-culture with the tumor cell line. In contrast, a decrease in the expression of chemokine receptor genes (CCR1, CCR2, CCR5, CCR7, CCRL2, CX3CR1, CXCR3, CXCR4, and CXCR6) was observed, as well as that of cytokine receptors and their component genes (IL10RA, IL12RB1, IL21R, IL2RG, IL4R, and IL7R). We also observed a decrease in the expression of genes associated with the Tem cell differentiation signature, including CCR7, CD27, CD28, CD45RA, CD45RB, CX3CR1, IL7R, LEF1, and TCF7 [27]. Furthermore, increased expression of the CTNNB1 [31, 32] and BCL6 [33] genes and decreased expression of the LAIR1 [34] and SELPLG [35] genes are also signatures of Tem cell differentiation. Regarding the effector function of T cells, increased expression of genes associated with activation was observed, including TNFRSF9 [30] and MHC class II genes (HLA-DMA, HLA-DMB, HLA-DPA1, HLA-DPB1, HLA-DQA1, HLA-DRA, HLA-DRB1, and HLA-DRB3), as well as genes associated with migration (IL6, IL6ST, SELE, and ICAM1) [36]. We also observed upregulation of TRAF1 gene expression, which is involved in downstream signaling of 4-1BB [37] or GITR [38]. Upregulation of EGR2 gene expression was also observed, which promotes differentiation toward Tem cells and regulation of the exhausted transcriptional state [39], as well as improved survival and proliferation [40]. However, the expression of genes encoding effector molecules (GZMA, GZMK, and pRF1) and signaling molecules (LCK and ZAP70) essential for the initiation of TCR signaling were downregulated [41]. Notably, after co-culture of GD2.CAR T cells with tumor cells, decreases were observed in signatures associated with T cell dysfunction, including expression of the HAVCR2, CISH [42, 43], CD244 and SLAMF7 [44] genes, as well as T cell death genes (BAX, BCL2, CASP1, and CASP8) [45, 46].
The up-regulated genes (Supplementary Table 2) were enriched by gene set enrichment analysis (GSEA) [23] using ontology biological process terms. GSEA analysis revealed that the top three pathways were associated with the cytokine-mediated signaling pathway, cellular response to interferon-gamma, and interferon-gamma-mediated signaling pathways (Fig. 4B). In contrast, genes associated with T cell proliferation and cytokine production were not significantly expressed during early stages of the CAR T cell-tumor interaction.
To investigate the potential application of CAR T cells as effector cells against melanoma, we evaluated the expression of surface activation and cytotoxicity markers (CD69, 4-1BB or CD137, CD107a, FasL, and CD40L) following 4–6 h of co-culture with GD2-positive tumor cell lines. This duration is sufficient to induce expression of the markers. Using a panel of antibodies, we analyzed the flow cytometry data from the GD2.CAR T cells using HSNE dimensionality reduction after arcsinh transformation with automated cofactors. Data were normalized using fdaNorm to correct for batch effects and ensure data integrity. HSNE analysis identified four GD2.CAR T cell subpopulations (Fig. 4C). The predominant population was CD8+CD40L+CD69‒CD107a+4-1BB+FasL+ T cells, suggesting cytotoxic function (Supplementary Fig. 3). Smaller populations of CD8+CD40L+CD69‒CD107a+4-1BB+FasL‒ and CD4+CD40L+CD69‒CD107a‒4-1BB+FasL+ T cells with similar proportions were also observed, as well as a minor population of CD8+CD40L+CD69‒CD107a+4-1BB‒FasL+ T cells (Supplementary Fig. 3).
The LDH release assay was employed to assess the cytotoxic activity of GD2.CAR T cells against melanoma tumor cell lines expressing the GD2 antigen. CAR T cells were co-cultured at an effector-to-target ratio of 5:1 for 6–8 h with tumor cells that expressed GD2 (SK-MEL-37 and S6), or did not express GD2 (V9) (Fig. 5). This ratio and co-culture duration were based on the manufacturer’s protocol and optimized for reliable results in the LDH release assay. Significant differences in GD2-specific anti-tumor cytotoxicity, as measured by LDH release, were observed after co-culture with the GD2-expressing SK-MEL-37 and S6 tumor cell lines. Importantly, no significant differences in cytotoxicity were observed between the SK-MEL-37 and S6 cell lines. These results demonstrate the efficacy and specificity of GD2.CAR-T cells in targeting GD2-expressing melanoma cells.
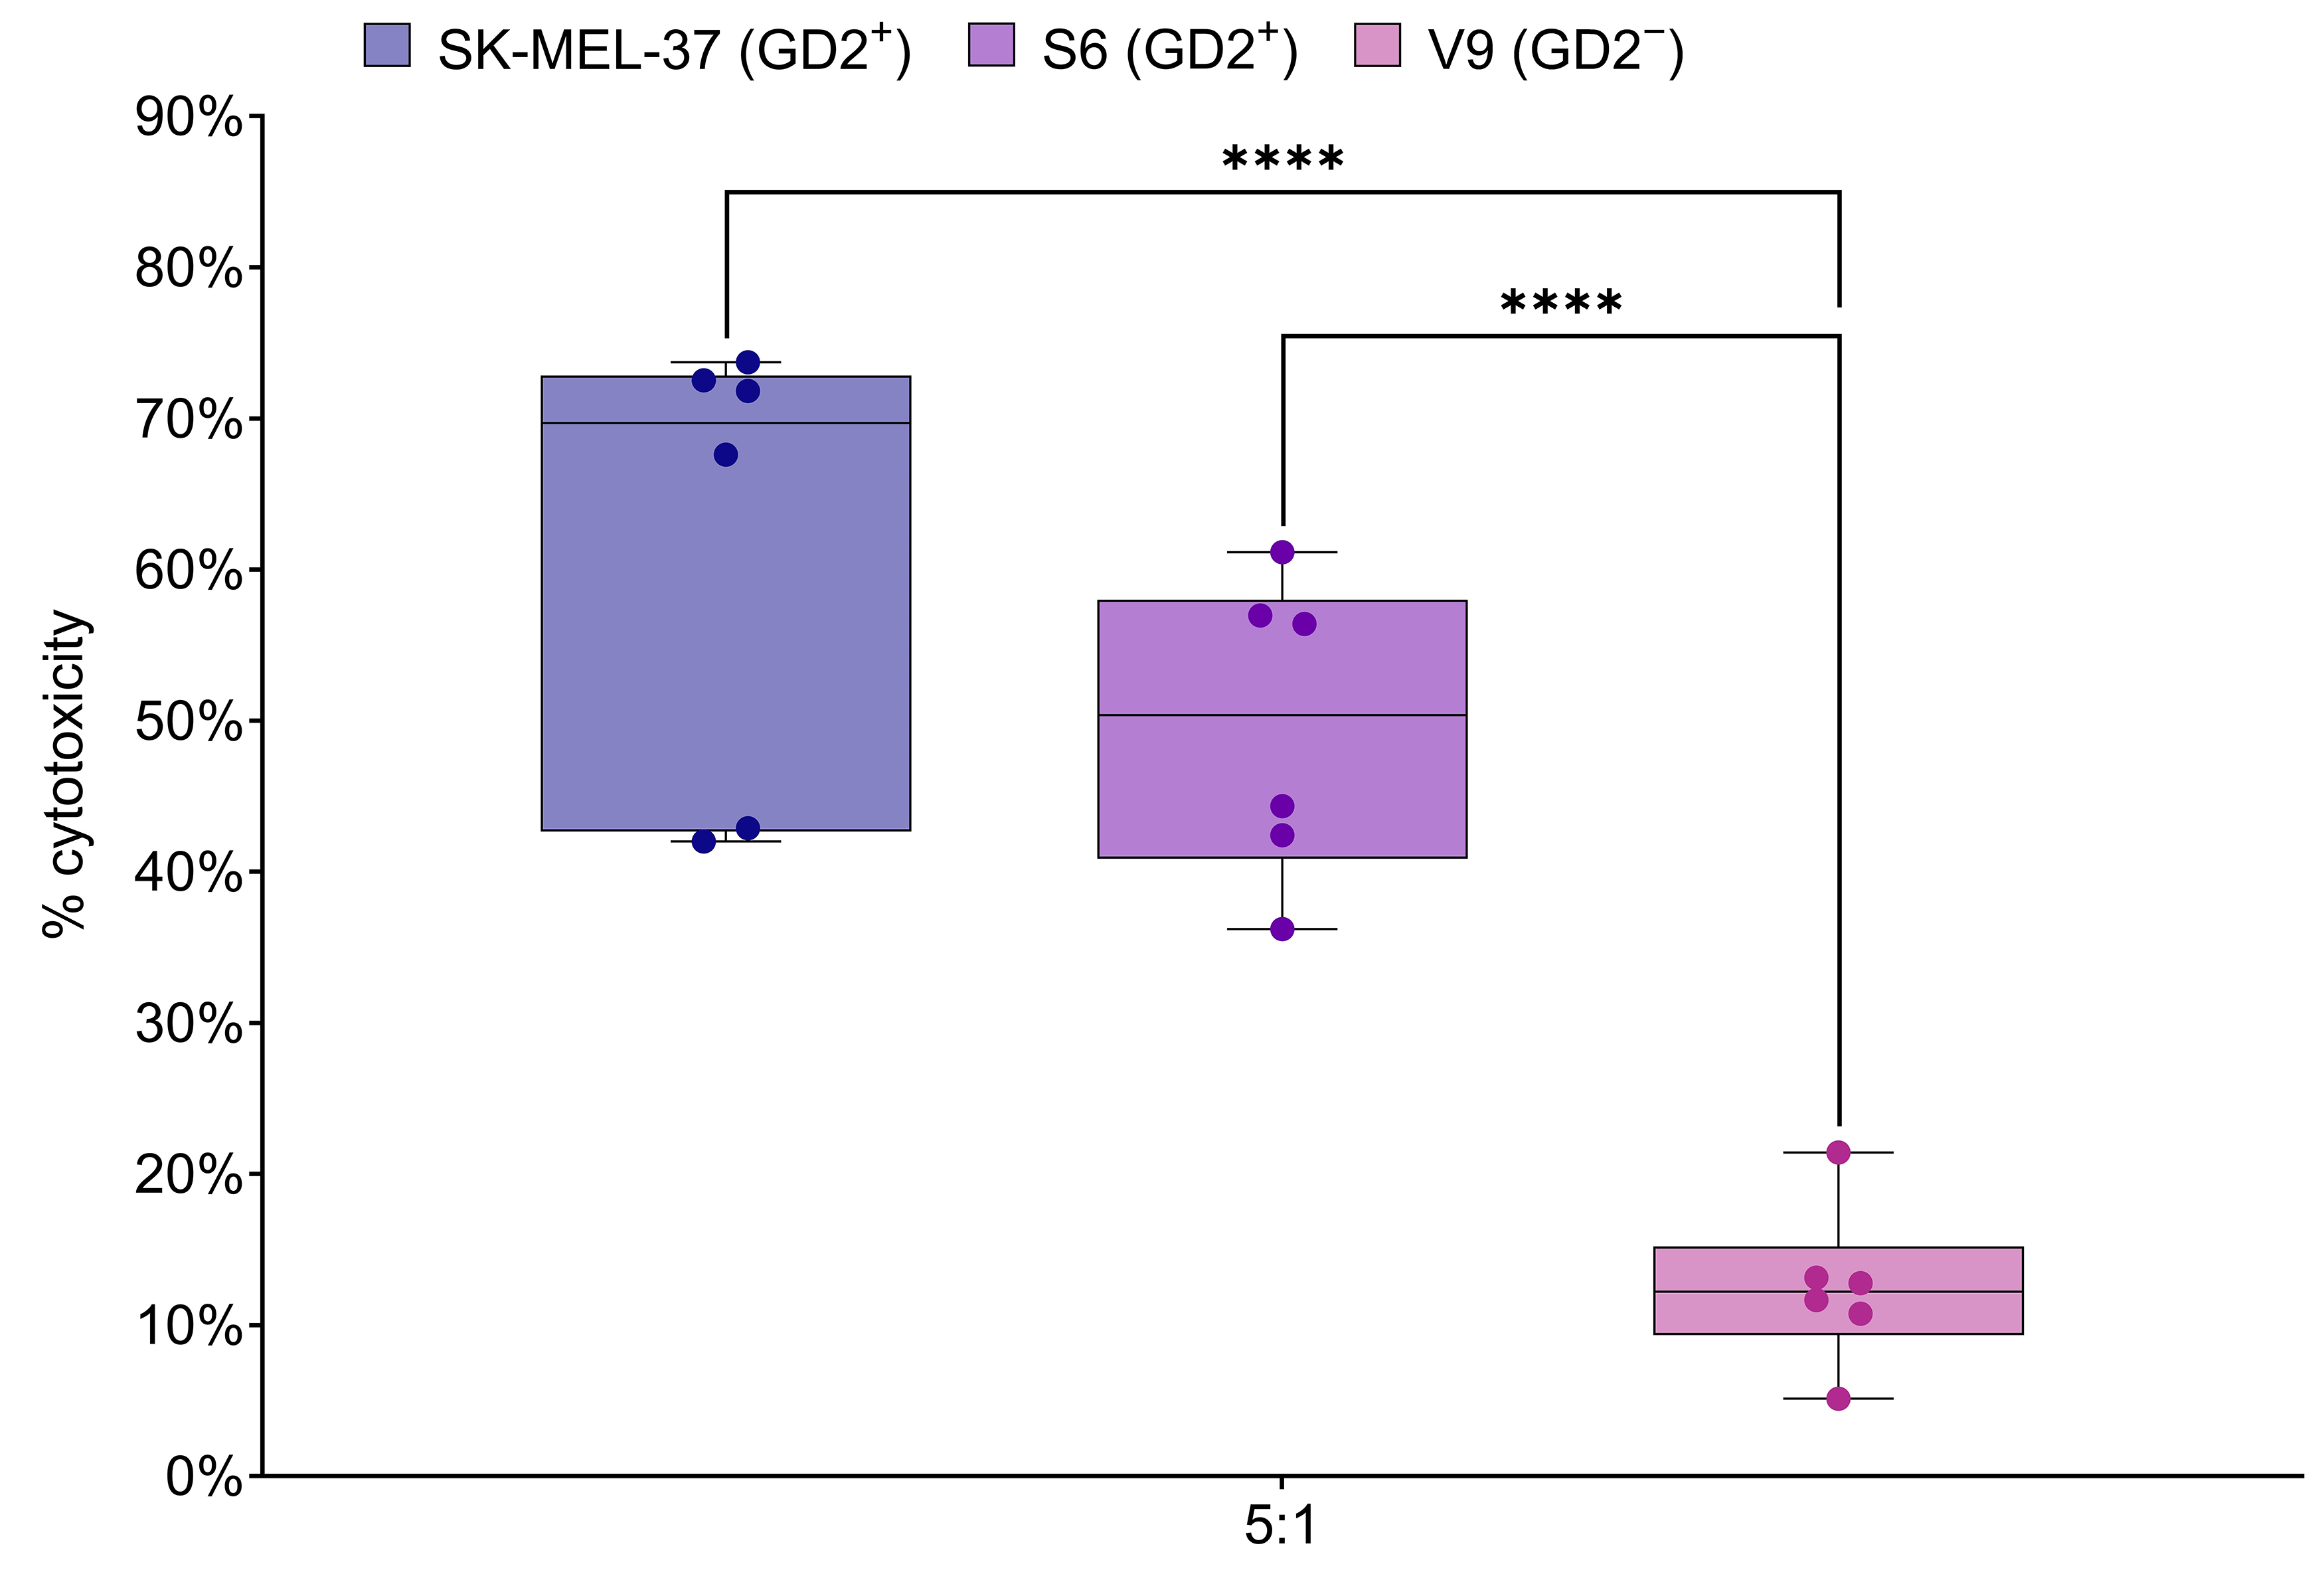 Fig. 5.
GD2.CAR T cell cytotoxicity against melanoma cell lines. Box
plots show LDH release, a measure of cytotoxicity, following 6–8 h co-culture of
GD2.CAR T cells with GD2-positive SK-MEL-37 (89.4% GD2 expression), S6 (85.1%
GD2 expression) and GD2-negative V9 (2.3% GD2 expression) melanoma cell lines at
a 5:1 effector-to-target ratio (n = 6). Asterisks indicate significant
p-values as follows: ****p
Cytokine release from transduced and non-transduced T cells was assessed 48 h
after contact with a GD2+ target at an effector-to-target ratio of 5:1. The
LEGENDplex™ Human CD8/NK panel was used to simultaneously analyze
cytokines, including IL-2, IL-6, and IL-17, and effector molecules, including
granzyme A, granzyme B, granulysin, perforin, and sFasL, in the cell co-culture
supernatants. Compared to non-transduced T cells, GD2.CAR T cells tended to
secrete more pro-inflammatory cytokines and effector molecules (Fig. 6). No
statistically significant differences between non-transduced cells and GD2.CAR T
cells were observed for the levels of perforin, granulysin, IL-2, and IL-6 in the
culture medium. However, significant increases were observed in the levels of
granzymes A/B, IFN-
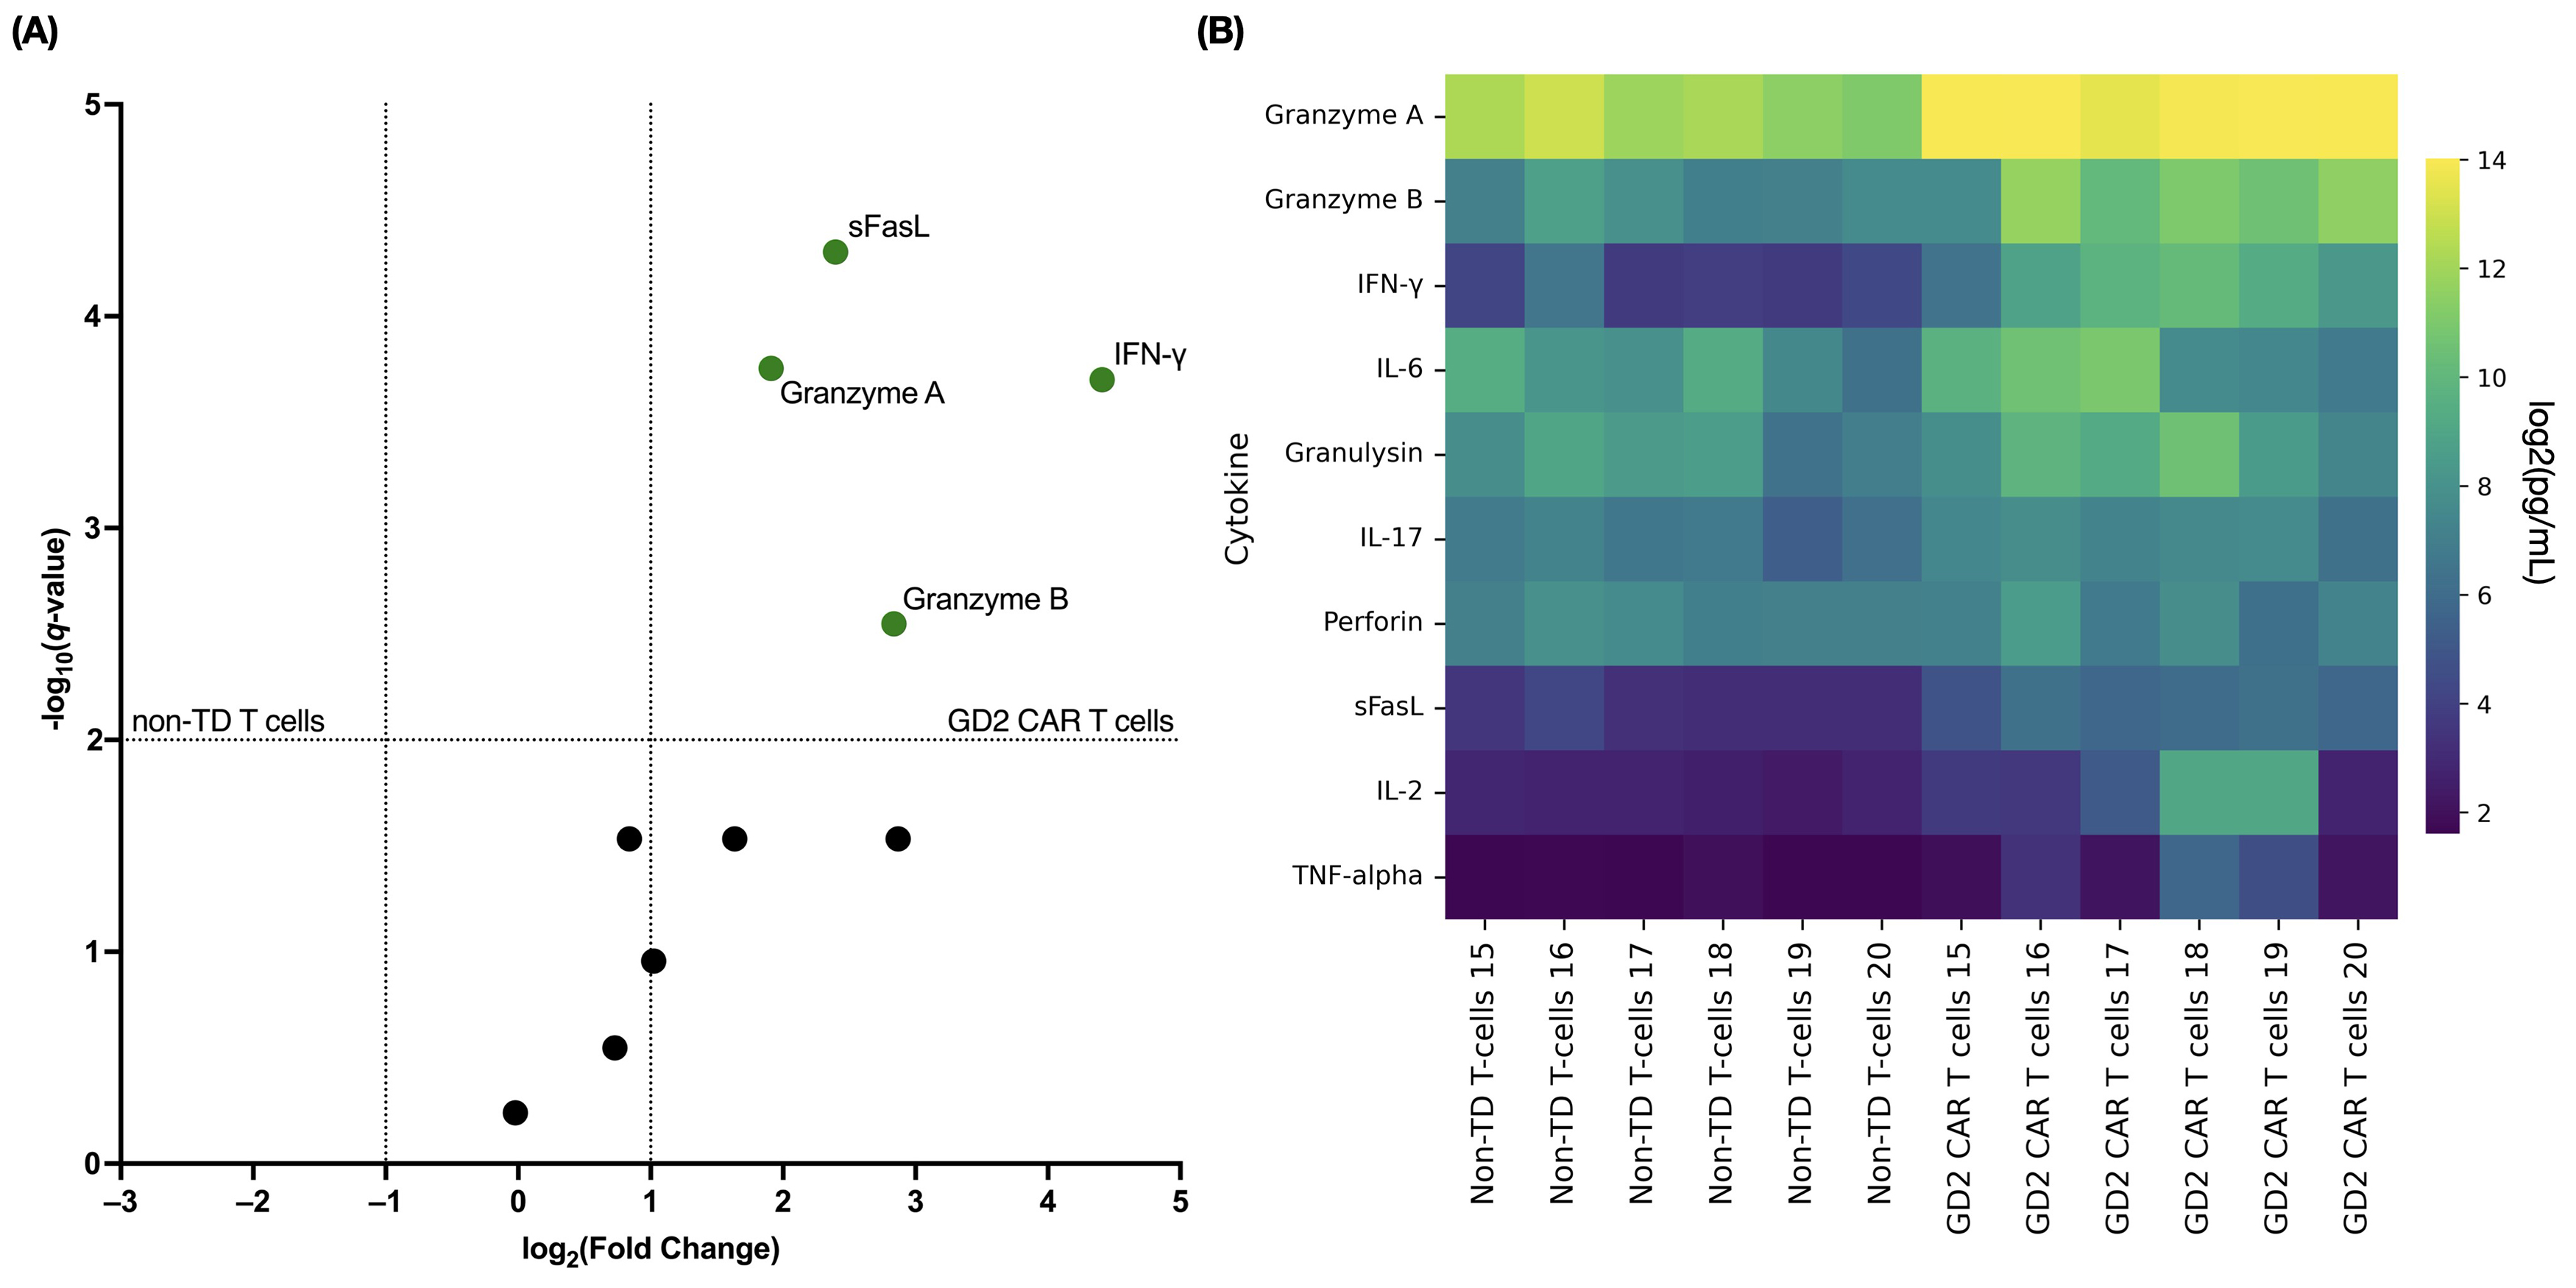 Fig. 6.
Cytokine response of GD2.CAR T cells to co-culture with
SK-MEL-37. (A) The volcano plot shows fold-changes in cytokine levels in
co-culture supernatants of GD2.CAR T cells (green dots indicate significance)
with SK-MEL-37 cells (compared to non-transduced T cells). The x-axis
values represent log2 (fold-change), and the y-axis values represent
‒log10 of q-values. The q-values indicate FDR-adjusted
p-values for multiple t-tests. The upper right quadrant
indicates statistically significant results (q-value
We next evaluated the antitumor efficacy of generated GD2.CAR T cells against
GD2-positive tumors in a xenograft model by inoculating SK-MEL-37 cells (5
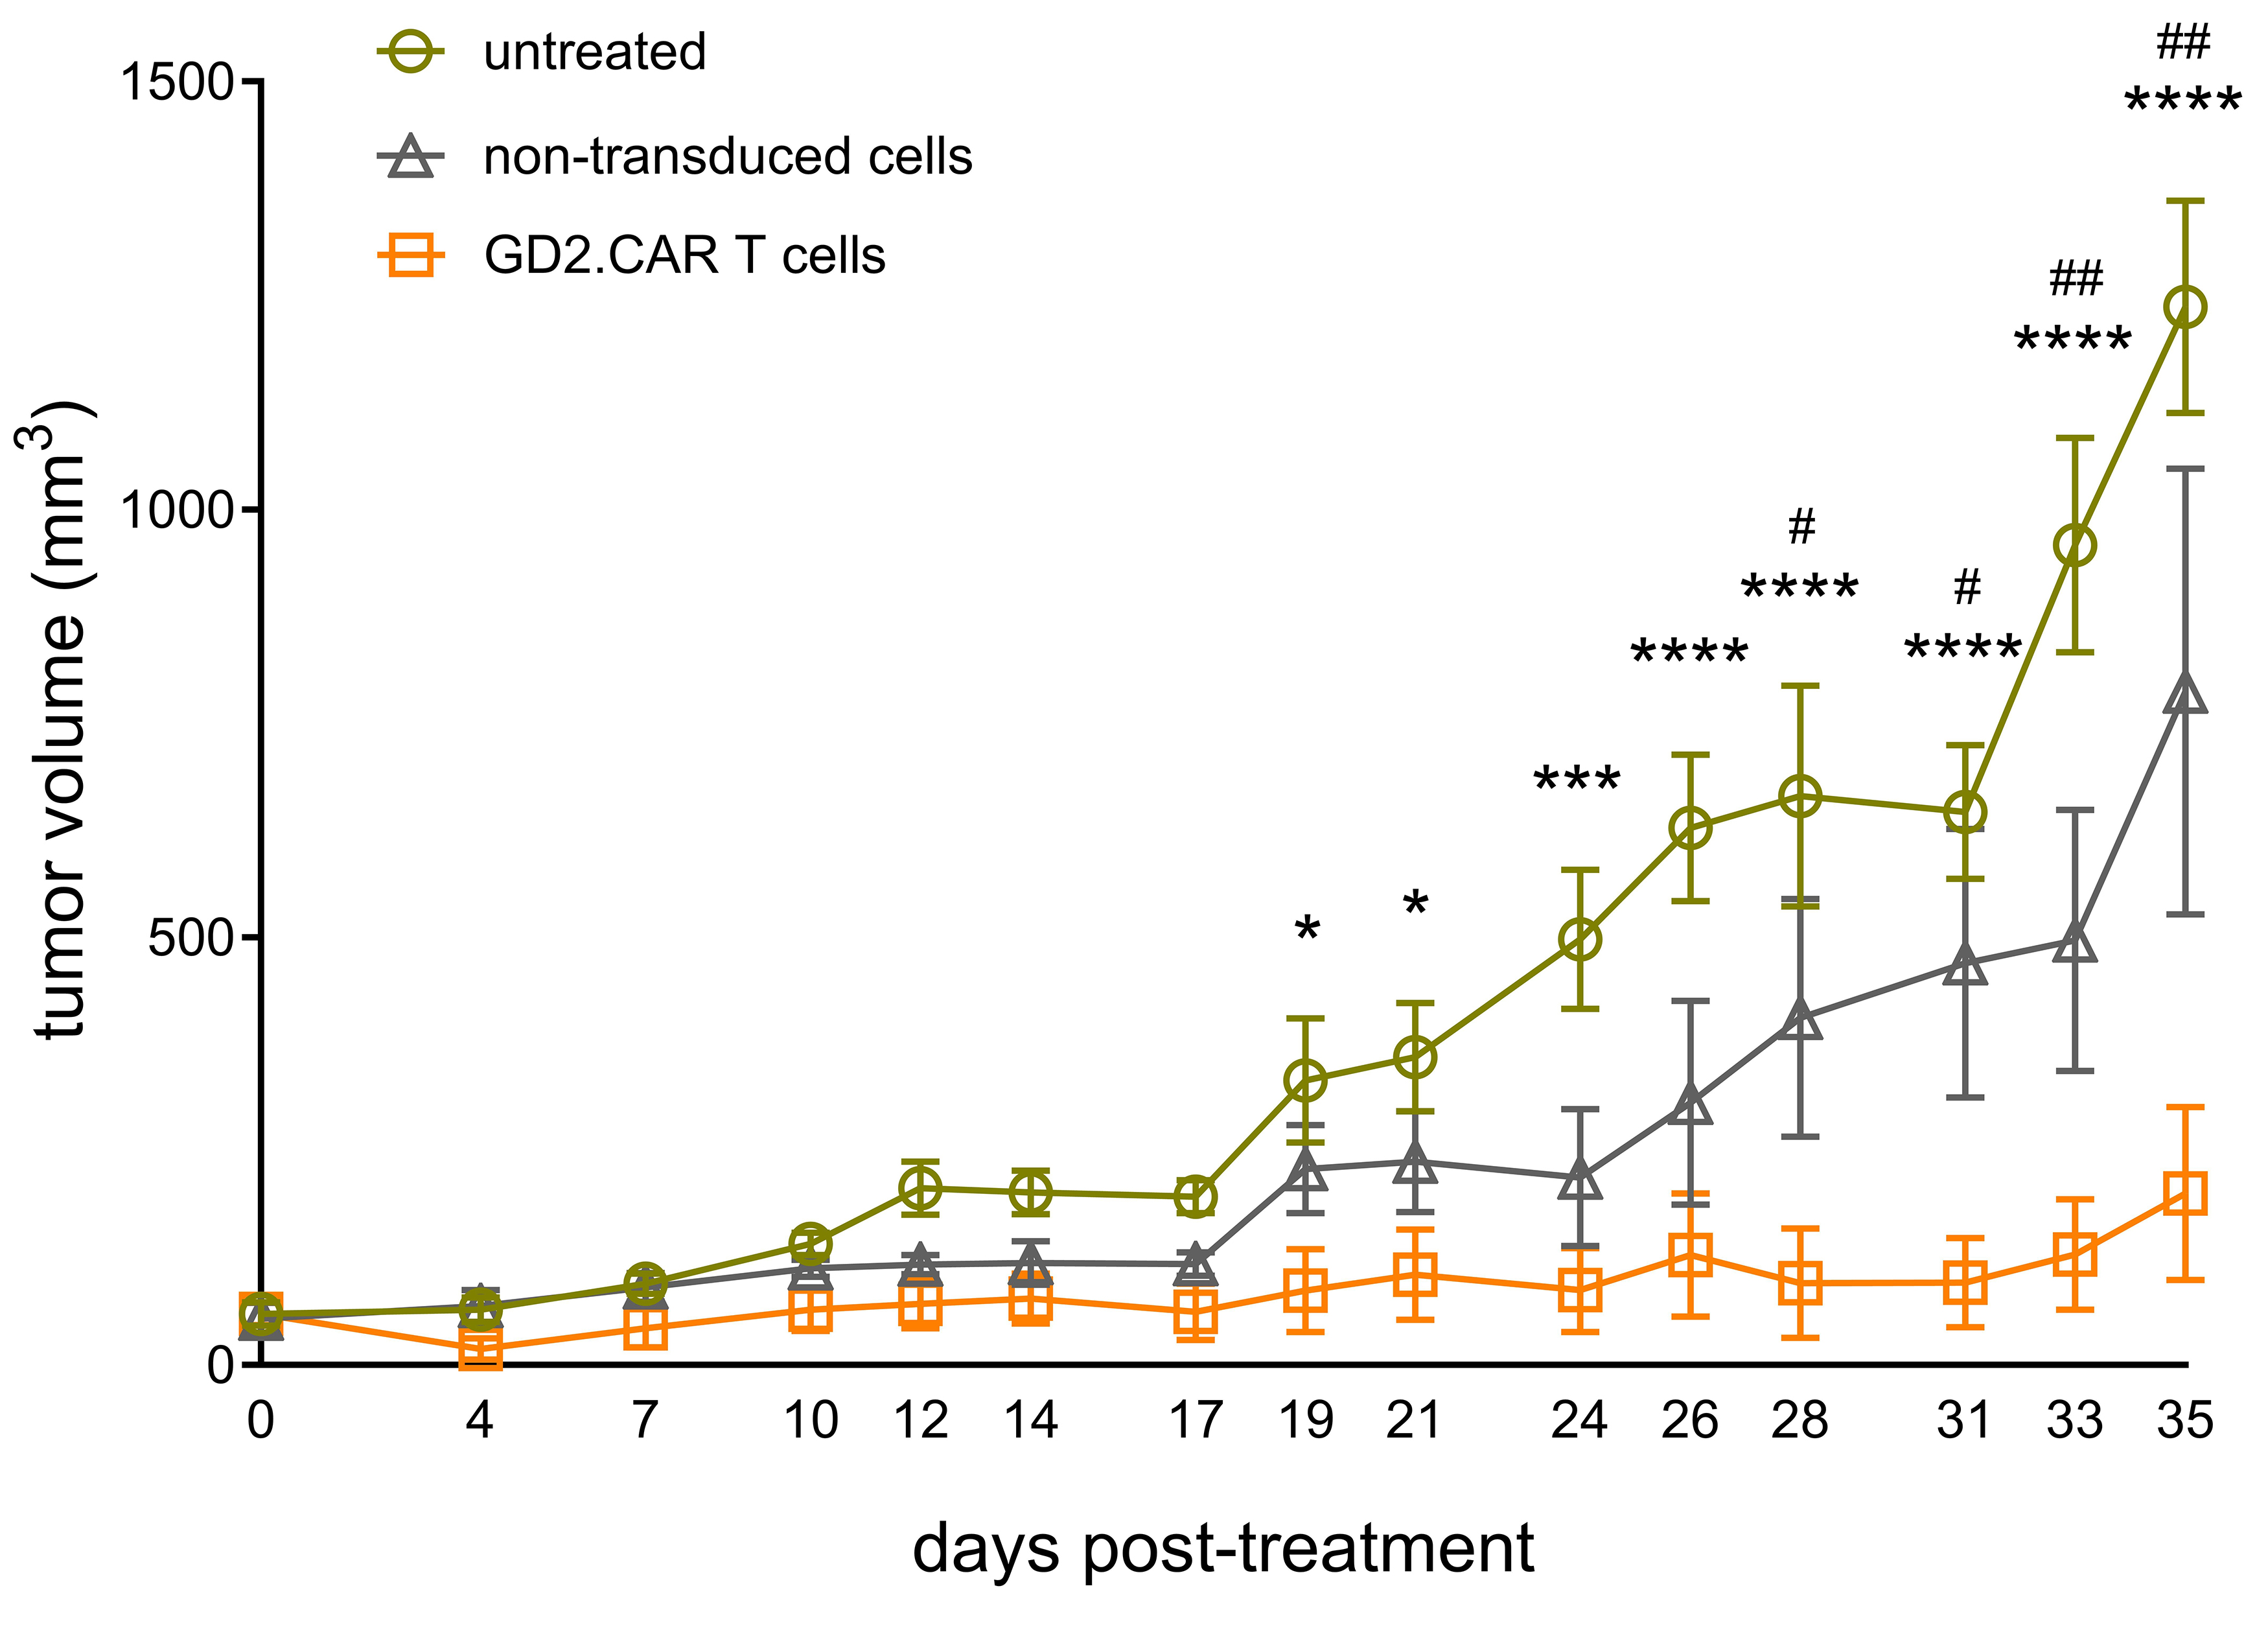 Fig. 7.
Antitumor efficacy of GD2.CAR T cells in vivo.
SK-MEL-37 cells were subcutaneously inoculated into NRG mice (n = 24) at a dose
of 5
In this study, we comprehensively analyzed the phenotypic and functional
characteristics of GD2.CAR T cells containing CD28 and CD3
The CD137 receptor serves as a T cell activation marker and is expressed on the
cell surface after CD3 or CD28 stimulation [53]. This results in the activation
of intracellular signaling through TRAF-mediated activation of NF-kB and MAPK,
leading to increased cell survival and enhanced effector functions. We found that
early co-culture of GD2.CAR T cells with tumor cells results in upregulation of
TRAF1 and TNFRSF9 gene expression, suggesting that antigenic
stimulation of CARs or the GITR-GITRL interaction [38, 54] may enhance
signaling. The GITR-GITRL interaction has a dual effect on the CD3+ T cell
population, as it can promote the generation of both Treg cells and cytotoxic
CD8+ T cells [55]. Nevertheless, we observed downregulation of
TGFB1 and TGFBR1 gene expression, which control development of
the Treg cell population [56, 57]. Therefore, we suggest that GITRL promotes the
development of effector CD8+ T cells, as evidenced by the increased
expression and secretion of inflammatory cytokines, alongside the absence of
detectable IL-10. Furthermore, previous research has shown that forced expression
of GITRL in CAR T cells resulted in increased IFN-
It is well known that cytotoxic CD8+ CAR T cells exert antitumor effects
through several underlying mechanisms, including the perforin-granzyme axis, the
Fas-FasL axis, and cytokine secretion [51]. The GD2.CAR T cells we generated have
significant cytotoxic efficacy and the ability to express FasL and the
degranulation marker CD107a on their cell surface, as well as the secretion of
effector molecules such as granzyme A/B, the pro-inflammatory cytokine
IFN-
A pattern of granzyme A, granzyme B, and perforin secretion was observed,
consistent with the functional differentiation of memory T cells. Effector
molecules secreted by the GD2.CAR T cells were in the order of GrmA
Several features of the transcriptome of GD2.CAR T cells were identified
following their initial interaction with GD2-positive tumor cell lines.
Specifically, chemokine signatures were detected in CAR T cells, suggesting a T
cell chemokine response to an antigen [67]. We propose that one of the key steps
in early CAR T cell-tumor interaction is the recruitment of other effector cells
to the site of the lesion. A recent study showed that expression of chemokine and
cytokine receptor genes is upregulated following anti-CD3/CD28 and IL-2
stimulation [68]. However, we found these genes were downregulated in CAR T cells
after co-culture with tumor. Therefore, the incorporation of chemokine receptors
into CAR T cell constructs may be a promising approach for further research [69].
GSEA analysis revealed the involvement of cytokine-mediated signaling pathways,
cellular response to IFN-
In summary, our findings provide robust preclinical evidence for the potential of GD2-specific CAR T cells as a therapeutic strategy for melanoma. Although it has provided valuable insights, our in vivo study was limited to a xenograft model utilizing a single tumor cell line (SK-MEL-37). Therefore, it is important to acknowledge this model cannot fully replicate the complexity of the human TME, nor the heterogeneity of human melanoma. Successful clinical translation will require further investigations to overcome these limitations. Future research should prioritize strategies for increasing the migration of CAR T cells to the tumor site, improving their resistance to inhibitory signals within the TME, and promoting the development of a long-lived memory phenotype. Additional studies employing a broader range of melanoma models, including patient-derived xenografts and those evaluating systemic delivery, will be crucial for assessing long-term efficacy and safety, thus paving the way for clinical trials.
GD2-specific CAR T cells generated and characterized using advanced techniques showed potent in vitro and in vivo antitumor activity against melanoma. The phenotypic and functional characteristics of these cells, including a naive-to-effector transition and strong cytotoxic potential, highlight their potential as an effective therapeutic strategy warranting further clinical development.
The datasets generated and analyzed during the current study are accessible from the corresponding author upon email request.
HS conceptualized and initiated the study, and provided materials (retroviral vector, tumor cell lines). SS, JS, and JP designed the research study and reviewed the literature. VK managed donor recruitment. JP, JS, MF, SA, AA, JL, MV, EZ, and OS performed the investigation and formal analysis: JP, JS, and MF conducted CAR T cell production and tumor cell line culture; JP, JS, and JL performed in vitro co-culture experiments (flow cytometry, LDH and cytokine analysis, magnetic sorting); SA, AA, and MV conducted NanoString gene expression analysis; EZ and OS performed in vivo experiments. RPZ, SA, JP, and JS analyzed and visualized the data. SA, RPZ, OPZ, and MV conducted differential gene expression, HSNE, and GSEA analyses. RPZ, SA, JP, and AA prepared the figures. JP wrote the original draft. JP, SS, JS, AA, SA, RPZ, and VK revised and edited the manuscript. All authors contributed to editorial changes in the manuscript. All authors read and approved the final manuscript. All authors have participated sufficiently in the work and agreed to be accountable for all aspects of the work.
The study was carried out in accordance with the guidelines of the Declaration of Helsinki and was approved by the local ethics committee of the Research Institute of Fundamental and Clinical Immunology at a meeting on May 30, 2022 [protocol #139]. This approval encompassed all procedures involving human participants and laboratory animals, including the collection of blood samples from healthy adult donors, the use of human biomaterials (including human-derived cell lines S6 and V9), and the conduct of animal experiments. All animal experiments were conducted in accordance with the European Community Directive (86/609/EEC) and the standards of humane treatment. All healthy blood donors provided written informed consent for their participation in this study, including the use of their samples in research.
Not applicable.
This study was supported by Research Work [project #124112200103-3] “The investigation of the role of molecular-cellular interactions in immunoregulation and the substantiation of new immunotherapy technologies”.
The authors declare no conflict of interest.
Supplementary material associated with this article can be found, in the online version, at https://doi.org/10.31083/FBL41221.
References
Publisher’s Note: IMR Press stays neutral with regard to jurisdictional claims in published maps and institutional affiliations.