


1 College of Animal Science and Technology, Inner Mongolia Minzu University, 028000 Tongliao, Inner Mongolia, China
2 College of Life Science and Food Engineering, Inner Mongolia Minzu University, 028000 Tongliao, Inner Mongolia, China
3 Hulunbuir Agriculture and Animal Husbandry Technology Extension Center, 021000 Hulunbuir, Inner Mongolia, China
4 College of Life Science, Inner Mongolia Agricultural University, 010018 Hohhot, Inner Mongolia, China
Abstract
Background: Under fasting conditions, the pathway converting gluconeogenesis precursors into muscle glycogen becomes crucial due to reduced glycogen reserves. However, there is limited research on skeletal muscle gluconeogenesis and the impact of fasting on gluconeogenic gene expression. Methods: Sheep fetal skeletal muscle cells cultured in vitro were used to study the effects of varying lactic acid concentrations (0 to 30 mM) and 2.5 mM glucose on the expression of gluconeogenesis-related genes after 6 h of fasting. The effects on mRNA and protein expression of key genes involved in skeletal muscle gluconeogenesis were measured by quantitative real time polymerase chain reaction (qRT-PCR), immunofluorescence, and western blotting at 48 h. Results: Fasting increased the expression of key gluconeogenic genes, fructose-1,6-bisphosphatase 2 (FBP2), glucose-6-phosphatase 3 (G6PC3), pyruvate kinase M (PKM), monocarboxylate transporter1 (MCTS1), glucose transporter type 4 (GLUT4), pyruvate carboxylase (PC), and lactate dehydrogenase A (LDHA). The mRNA levels of FBP2, G6PC3, and MCTS1 significantly decreased with glucose addition. Additionally, 10 mM lactic acid significantly promoted the expression of FBP2, PC, MCTS1, LDHA, GLUT4, and PKM while inhibiting phosphoenolpyruvate carboxykinase (PEPCK) expression. At the protein level, 10 mM lactic acid significantly increased FBP2 and PKM protein expression. Conclusions: This study shows that fasting regulates key gluconeogenic gene expression in sheep skeletal muscle cells and highlights the role of lactic acid in inducing these gene expressions.
Keywords
- glucose
- lactic acid
- ovine skeletal muscle cells
- gluconeogenesis
Under normal physiological conditions, livestock muscles primarily utilize glucose as an energy substrate [1]. Sugar metabolism is crucial for maintaining normal cell function and status [2]. Unlike monogastric animals, carbohydrates in ruminant feed are mostly absorbed and fermented by microorganisms in the rumen to produce short-chain volatile fatty acids (VFAs). Consequently, glucose absorption from feed in the small intestine is minimal. Therefore, approximately 90% of glucose in ruminants is derived from endogenous glucose, synthesized through gluconeogenesis [3]. Gluconeogenesis converts various noncarbohydrate substances (pyruvate, lactic acid, glycerol, and amino acids) into glucose or glycogen [4].
While hepatic gluconeogenesis is well-studied, most research has focused on monogastric model animals such as humans and mice. Studies on gluconeogenesis in ruminants primarily focus on the lactation period to meet the increased glucose demand through nutritional supplementation, emphasizing hepatic gluconeogenesis. However, studies on gluconeogenesis in sheep skeletal muscle are limited. Skeletal muscles play a central role in controlling body metabolism and movement and are a major site for glucose uptake and utilization [5]. During exercise, skeletal muscles uptake glucose from circulation and completely oxidize it to provide energy for contraction [6]. Additionally, under low oxygen conditions, skeletal muscles can also undergo glycolysis to produce a large amount of lactic acid [7]. It is widely believed that lactic acid produced by skeletal muscles needs to be transported to the liver as a substrate for gluconeogenesis, to be resynthesized into glucose or glycogen [8]. Recent studies show that skeletal muscle also has a certain gluconeogenic capacity. Using carbon labeling, researchers found that lactic acid is a substrate for glycogen synthesis and lipid storage in human myotubes [9]. Another study found that lactic acid could promote the synthesis of glycerol and glycogen in rat skeletal muscle by reversing pyruvate kinase M (PKM) [10]. During glycolysis, PKM catalyzes the conversion of phosphoenolpyruvate (PEP) to enolpyruvate, and then to pyruvate, making the reverse reaction of PKM important to gluconeogenesis [11]. Previous studies proved that the PKM reaction is reversible under in vivo conditions [12]. Given that lactic acid easily produces pyruvate, Jin et al. [10] speculated that under high concentrations of lactic acid, the reversal of PKM is more powerful, but there is no concrete data to support this hypothesis.
In summary, preliminary research on gluconeogenesis in skeletal muscle has primarily focused on humans and mice. Studies on gluconeogenesis in ruminant skeletal muscle have not been reported. Our laboratory previously found that high-fiber, low-protein diets promote muscle gluconeogenesis and inhibit glycolysis through epigenetic regulation [13, 14]. However, functional validation at the cellular level is lacking. The intensity of gluconeogenesis has not been determined by detecting key protein expression in muscle cells, such as glucose-6-phosphatase (G6PC), phosphoenolpyruvate carboxykinase (PEPCK), and pyruvate carboxylase (PC) [15, 16]. This study investigates the regulatory mechanisms of gluconeogenesis in skeletal muscle cells in vitro. It examines key gene expression involved in gluconeogenesis in skeletal muscle cells under fasting conditions. The study also analyzes the regulatory effects of the gluconeogenesis precursor lactic acid on key genes (G6PC, PEPCK, PC, PKM, fructose-1,6-bisphosphatase 2 (FBP2), monocarboxylate transporter (MCTS), glucose transporter type 4 (GLUT4), and lactate dehydrogenase A (LDHA)) in skeletal muscle cells after fasting. Lactic acid is an important gluconeogenesis precursor and a main product of skeletal muscle exercise. Previous studies have shown that extracellular lactic acid concentration in skeletal muscle is closely related to exercise intensity [17]. Therefore, we evaluated the effect of different lactic acid concentrations on gluconeogenic genes to study the dose effect of lactic acid on skeletal muscle gluconeogenesis.
Due to the rapid growth rate of fetal sheep cells, we collected the longissimus
dorsi muscle of three-month-old maternal fetal sheep (Singleton, Mongolian sheep,
and Small-Tailed Han sheep). After immersion in 75% ethanol for 30 s, the fascia
and adipose tissue were excised, and the muscle was diced into 1 mm
Ovine muscle cells were separated and purified based on different adhesion rates
between fibroblasts and muscle cells. The growth curve was plotted using the Cell
Intelligence Monitoring Assistant (MN-100, Cellaview, Yuyao, China).
Immunofluorescence was used to detect the muscle cell marker
Muscle cells were cultured in DMEM supplemented with 10% FBS and 1%
penicillin-streptomycin (Procell, Wuhan, China). The cells were maintained at 37
°C with 5% CO
The release of lactic acid dehydrogenase (LDH) was determined using the LDH cytotoxicity assay kit (Beyotime, Shanghai, China). Skeletal muscle cells were seeded into 96-well cell culture plates. After fasting for 6 h, skeletal muscle cells were cultured in a glucose-free medium containing 0, 10, 20, or 30 mM lactic acid for 48 h. The samples were centrifuged at 400 g for 5 min using a Perforated Plate Centrifuge (Centrifuge 5430R, Eppendorf, Hamburg, Germany), followed by the addition of diluted LDH-releasing reagent and continued incubation at 37 °C for 1 h. The samples were centrifuged again at 400 g for 5 min. A supernatant of 120 µL from each well was transferred to a new 96-well plate, and 60 µL of LDH detection working solution was added. The mixture was incubated at room temperature in the dark for 30 min. The absorbance was measured at 490 nm using a Microplate Reader (Nanodrop2000, Thermo Fisher, Waltham, MA, USA); a dual-wavelength assay was performed using 620 nm as the reference wavelength.
Skeletal muscle cells were fasted for 6 h and cultured in a glucose-free medium containing 0, 10, 20, or 30 mM lactic acid for 48 h. The culture solution and cells were placed into the centrifuge tube, sonicated (ice bath, power 20%, sonication 3 s, interval 10 s, repeated 30 times), and then placed in a 95 °C water bath for 10 min. After cooling, the samples were centrifuged at 8000 g, 25 °C for 10 min. The supernatant was added to a 96-well plate, and the reagent was added according to the instructions of the glucose assay kit (Sangon Biotech, Shanghai, China). After mixing, the samples were placed in a 37 °C water bath for 15 min. A spectrophotometer was used to detect the absorbance at 505 nm.
Total RNA was extracted from cells fasted for 6 h, which were cultured with
different lactic acid concentrations (0, 10, 20, or 30 mM) for 48 h. Total RNA
was also extracted from cells fasted for 6 h and cultured with 2.5 mM glucose for
48 h. RNAiso (TAKARA, Kusatsu, Shiga, Japan) was used for RNA extraction. After
determining RNA purity (OD260/280 ratio
| Gene name | Accession number | Sequences (5 |
Amplicon size (bp) |
| PC | XM_042237684 | F: CCAACAGAGGCGAGATTGC | 198 |
| R: TCTCCTTGGCGACCTTAATGA | |||
| FBP2 | XM_027964239 | F: TTATCACCGCCAAGGAGAAGA | 184 |
| R: TAGCCAGCAGCCACAATGT | |||
| LDHA | XM_042238239 | F: AGTGTCAGCGGTGTTCCTT | 177 |
| R: TTCATCTGCCAAGTCCTTCATT | |||
| G6PC3 | XM_027974447 | F: TGGCTTAATAACTGGTGCTGTC | 179 |
| R: ACTTAGAGGCTAGGTTGATGGA | |||
| PEPCK | XM_004014441 | F: GATGCCTCCTCAGCTCTCA | 106 |
| R: GGCGCTACTCTCCACGA | |||
| GLUT4 | XM_027974995 | F: GTCTGTCTGTCCCCTCCAG | 149 |
| R: AGCCCACTGTCCCTTCC | |||
| MCTS1 | XM_042242075 | F: GTCAAAATAGTGCGATGCC | 145 |
| R: CAACCTGCTGATGTGGAA | |||
| PKM | XM_004010279 | F: GTGTTTAGCGGCAGCTTTGA | 113 |
| R: CTGTCTGGTGATTCCGGGTC | |||
| NM_001009784 | F: GCAAATGCTTCTAGGCGGAC | 194 | |
| R: TGCTGTCACCTTCACCGTTC |
PC, pyruvate carboxylase; FBP2, fructose-1,6-bisphosphatase 2; LDHA, lactate dehydrogenase A; G6PC3, glucose-6-phosphatase 3; PEPCK, phosphoenolpyruvate carboxykinase; GLUT4, glucose transporter type 4; MCTS1, monocarboxylate transporter 1; PKM, pyruvate kinase M.
Skeletal muscle cells were cultured with different lactic acid concentrations
(0, 10, 20, or 30 mM) for 48 h. After rinsing twice with pre-chilled PBS, total
protein was extracted using pre-chilled RIPA (Beyotime, Shanghai, China) and
Phenylmethylsulfonyl fluoride (PMSF) (Beyotime, Shanghai, China) premixes.
Protein concentration was determined using a protein assay kit (Beyotime,
Shanghai, China). Proteins were separated through sodium dodecyl sulfate
polyacrylamide gel electrophoresis (Mini-P4, BioRad, Hercules, CA, USA) and
transferred onto polyvinylidene fluoride membranes (Solarbio, Beijing, China).
After a 25-minute blocking step, membranes were incubated with primary antibodies
overnight at 4 °C and washed three times. Primary antibodies included
Skeletal muscle cells were cultured with different lactic acid concentrations
(0, 10, 20, or 30 mM) for 48 h. Cells were rinsed twice with PBS and incubated
with 4% paraformaldehyde (Solarbio, Beijing, China) for 10 min at room
temperature. After three PBS rinses, samples were incubated with 0.1% Triton
X-100 (Solarbio, Beijing, China) for 10 min to permeabilize cells. Membranes were
incubated with primary antibodies overnight at 4 °C, including PC
(SinoBiological, Beijing, China),
This experiment had three biological replicates and three technical replicates,
totaling nine independent experimental units. Sheep skeletal muscle cells were
the experimental unit. Statistical analysis was performed using GraphPad Prism
8.0 (GraphPad Software Inc., San Diego, CA, USA), with One-Way ANOVA to determine
group differences. The results are expressed as means
After purification and culture, skeletal muscle cells extracted in this
experiment were found consistent with known skeletal muscle cells and considered
suitable for subsequent research. The cell growth curve was drawn using the cell
intelligence monitoring assistant (Fig. 1). Additionally,
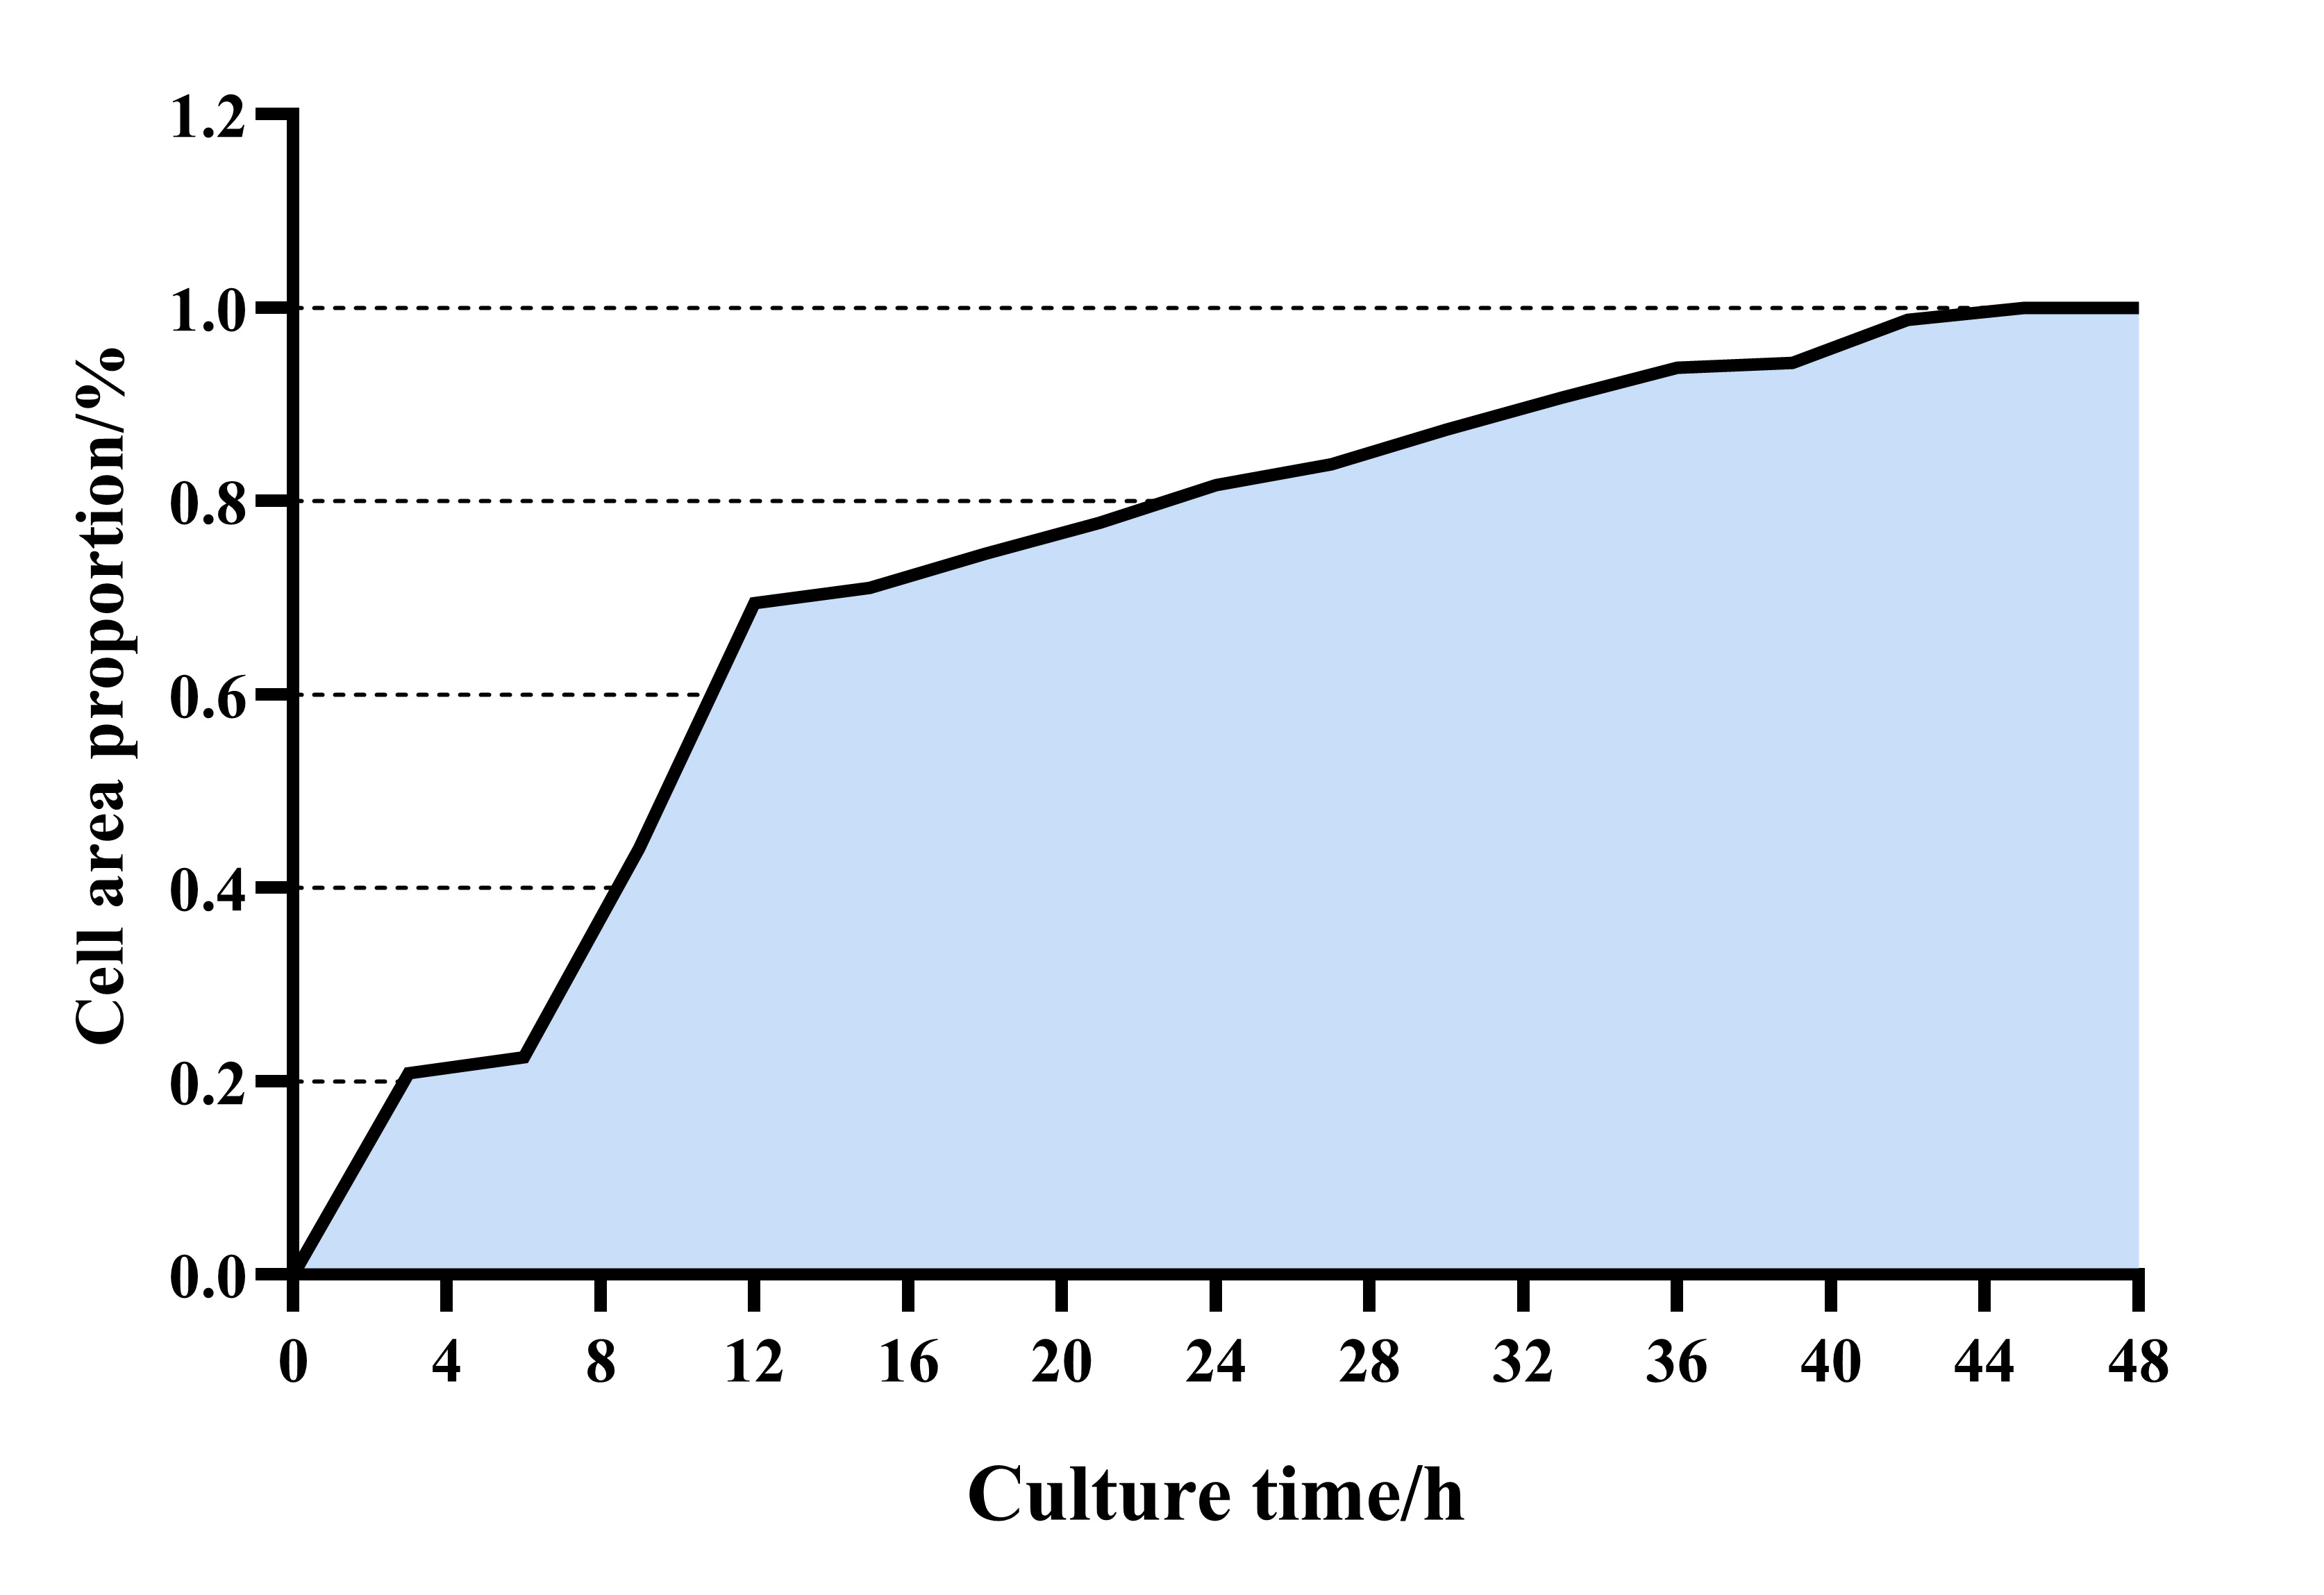 Fig. 1.
Sheep skeletal muscle cell growth curve. X and Y axes are labeled in the figure.
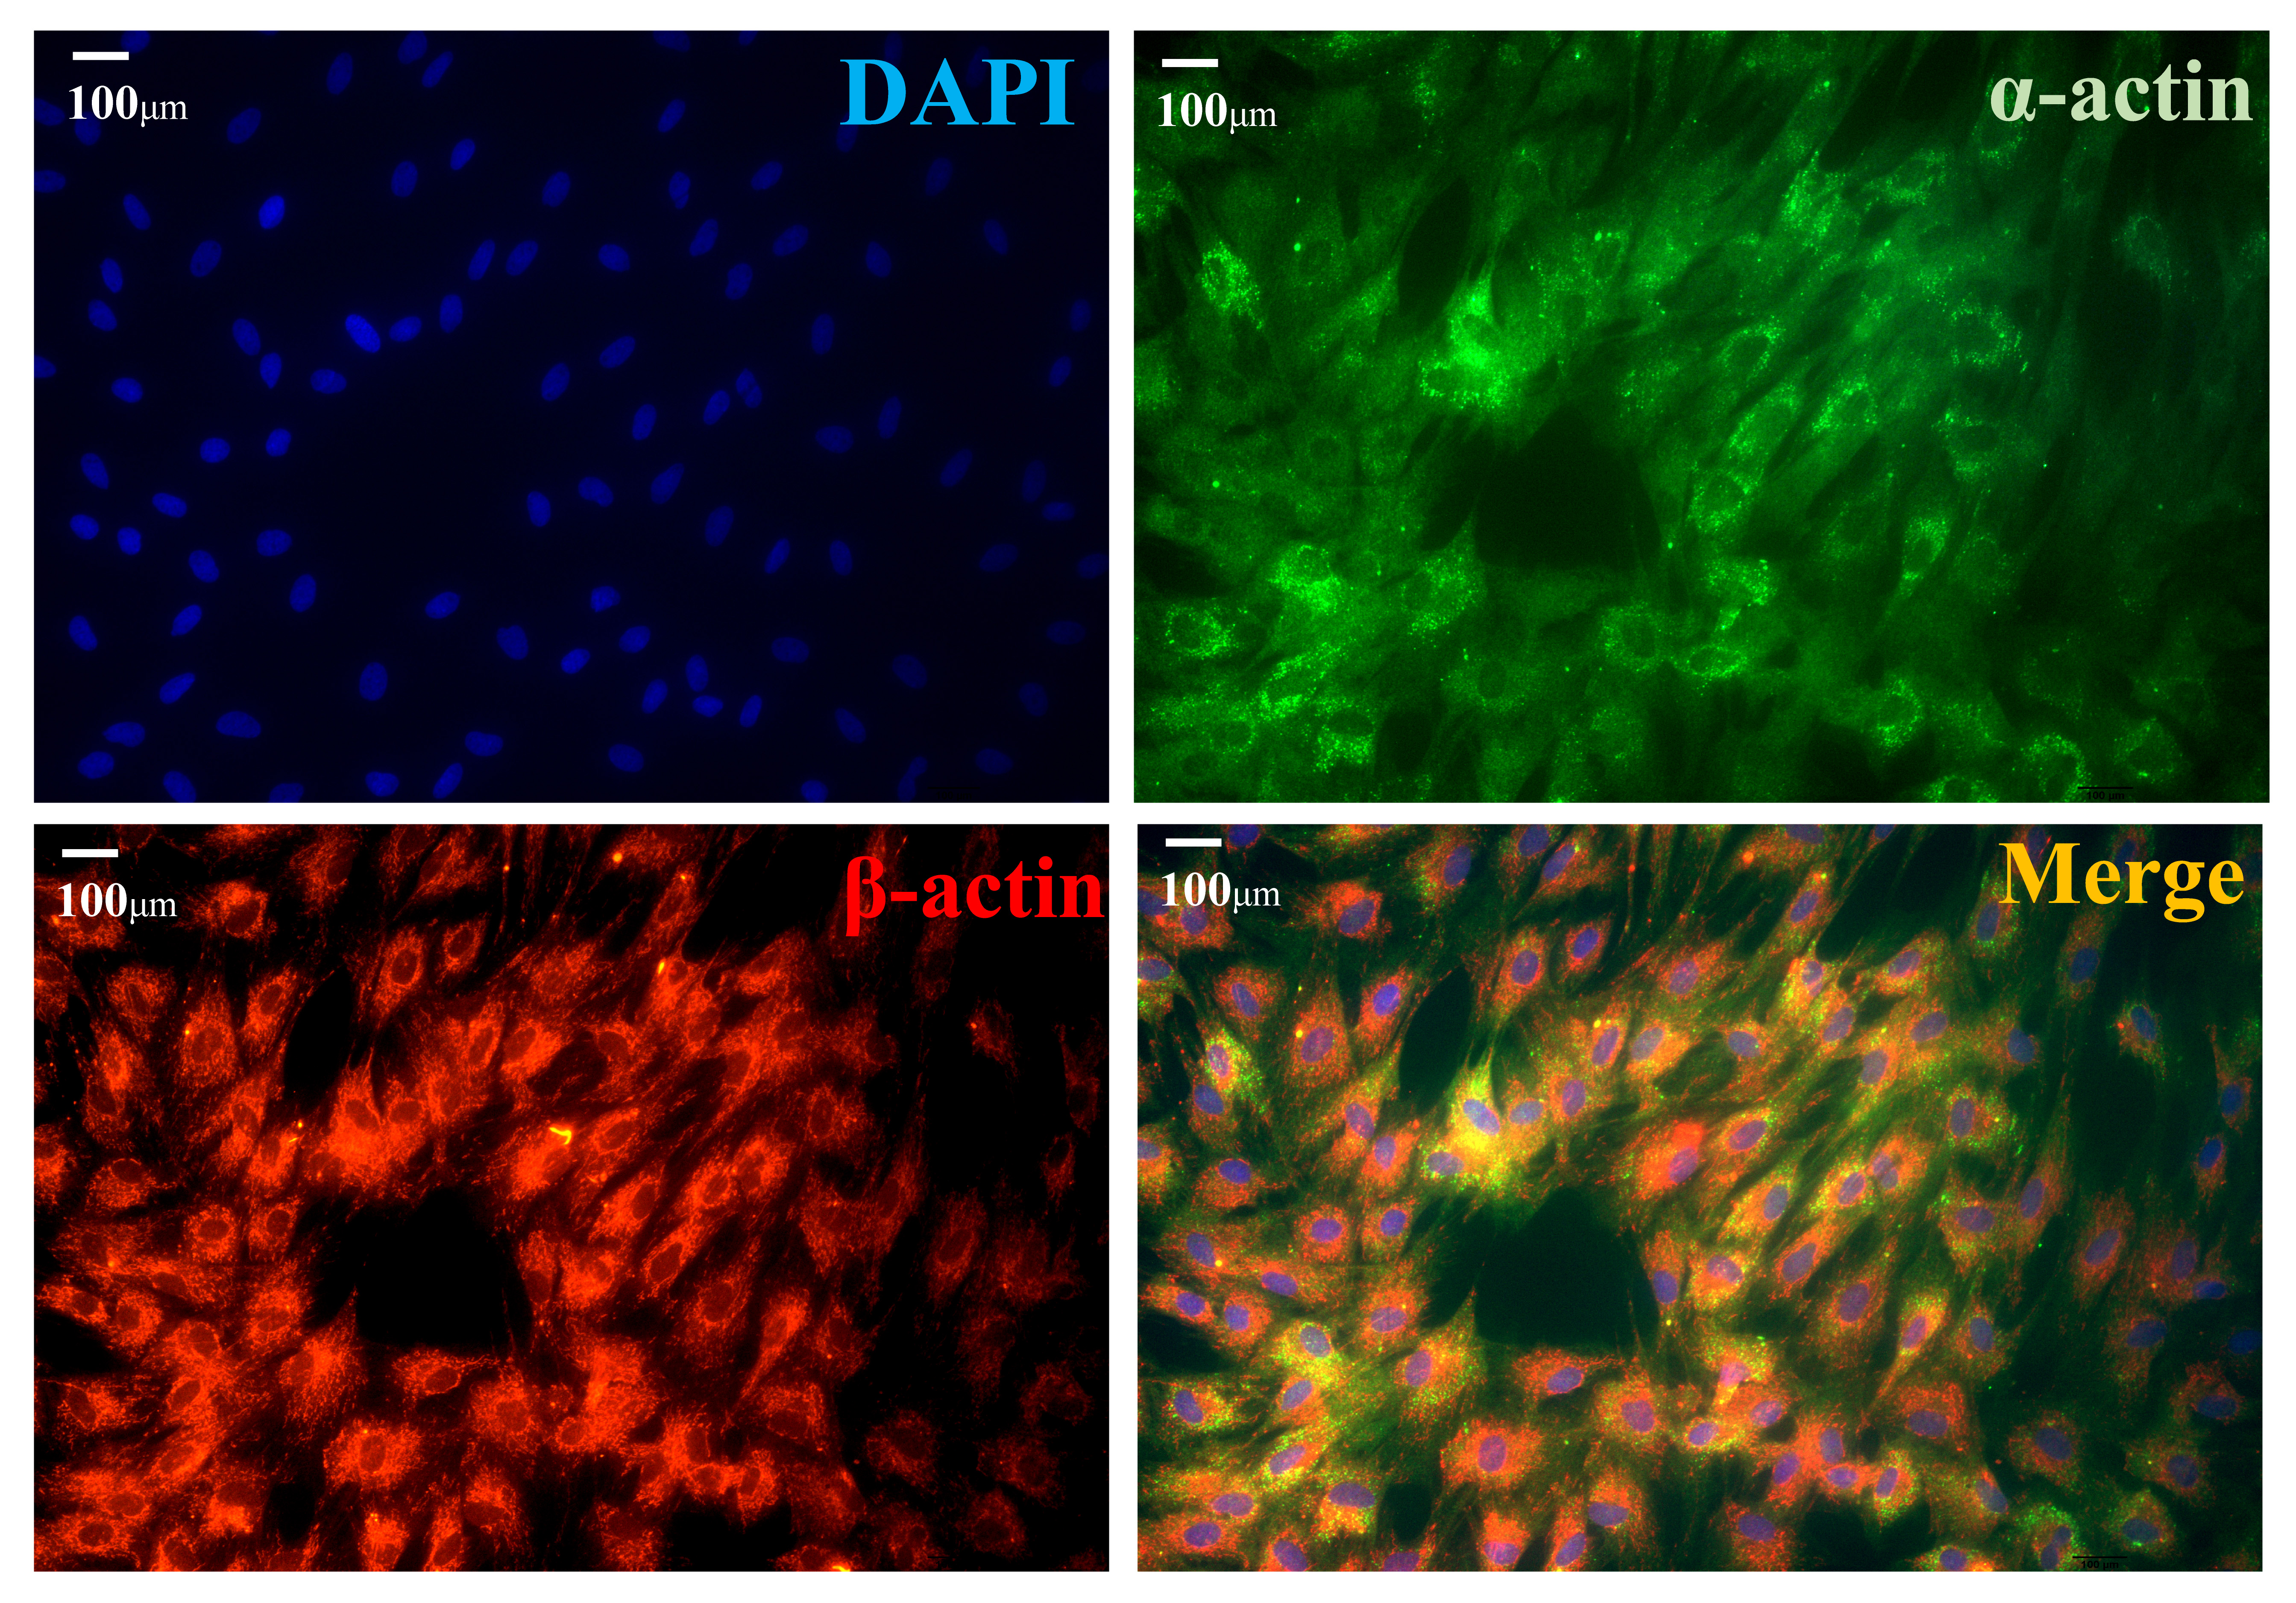 Fig. 2.
Immunofluorescence detection of
To detect the expression of key genes during gluconeogenesis in skeletal muscle
cells, we subjected skeletal muscle cells to fasting treatment. The results
showed that after 6 h of fasting, the expression levels of key gluconeogenic
genes such as FBP2, PC, G6PC3, MCTS1,
LDHA, and PKM were significantly upregulated (p
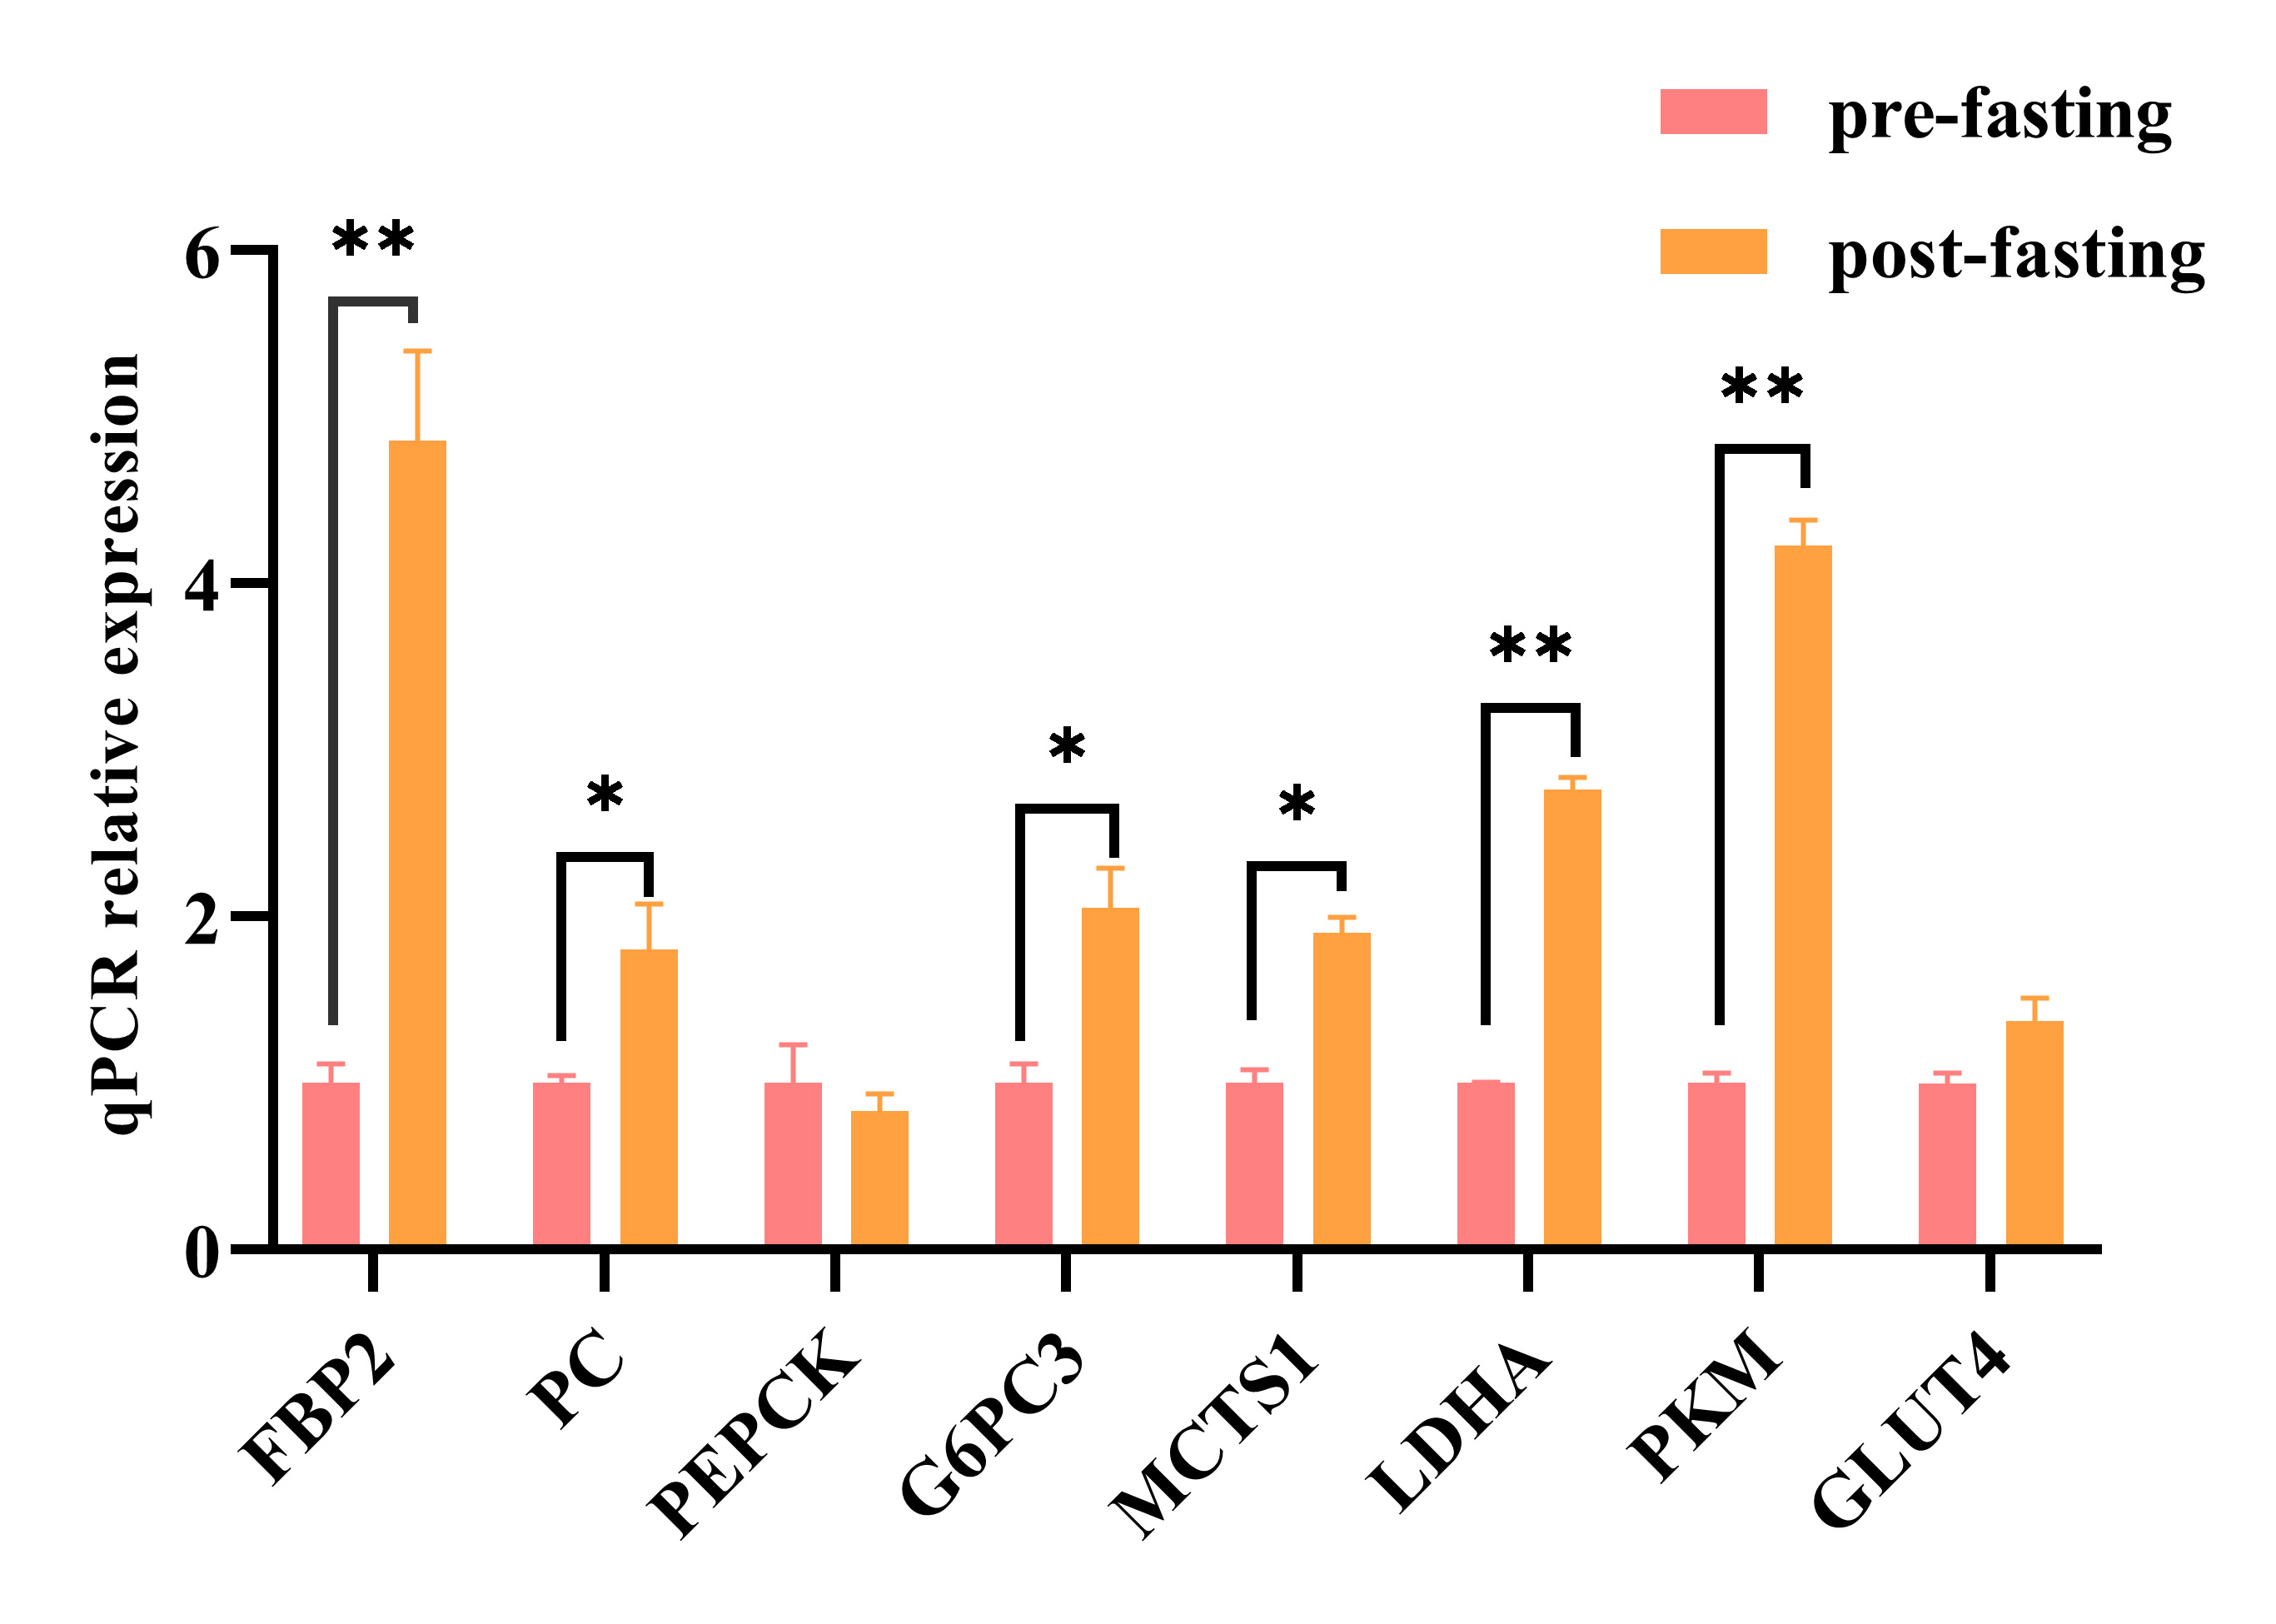 Fig. 3.
Relative mRNA expression levels of key genes involved in
skeletal muscle gluconeogenesis before and after 6 h of fasting. The data
represent three independent cell culture experiments. * p
The results showed that after fasting for 6 h and incubation of skeletal muscle
cells with 2.5 mM glucose for 48 h, a notable decrease in mRNA levels of
FBP2, G6PC3, and MCTS1 genes (p
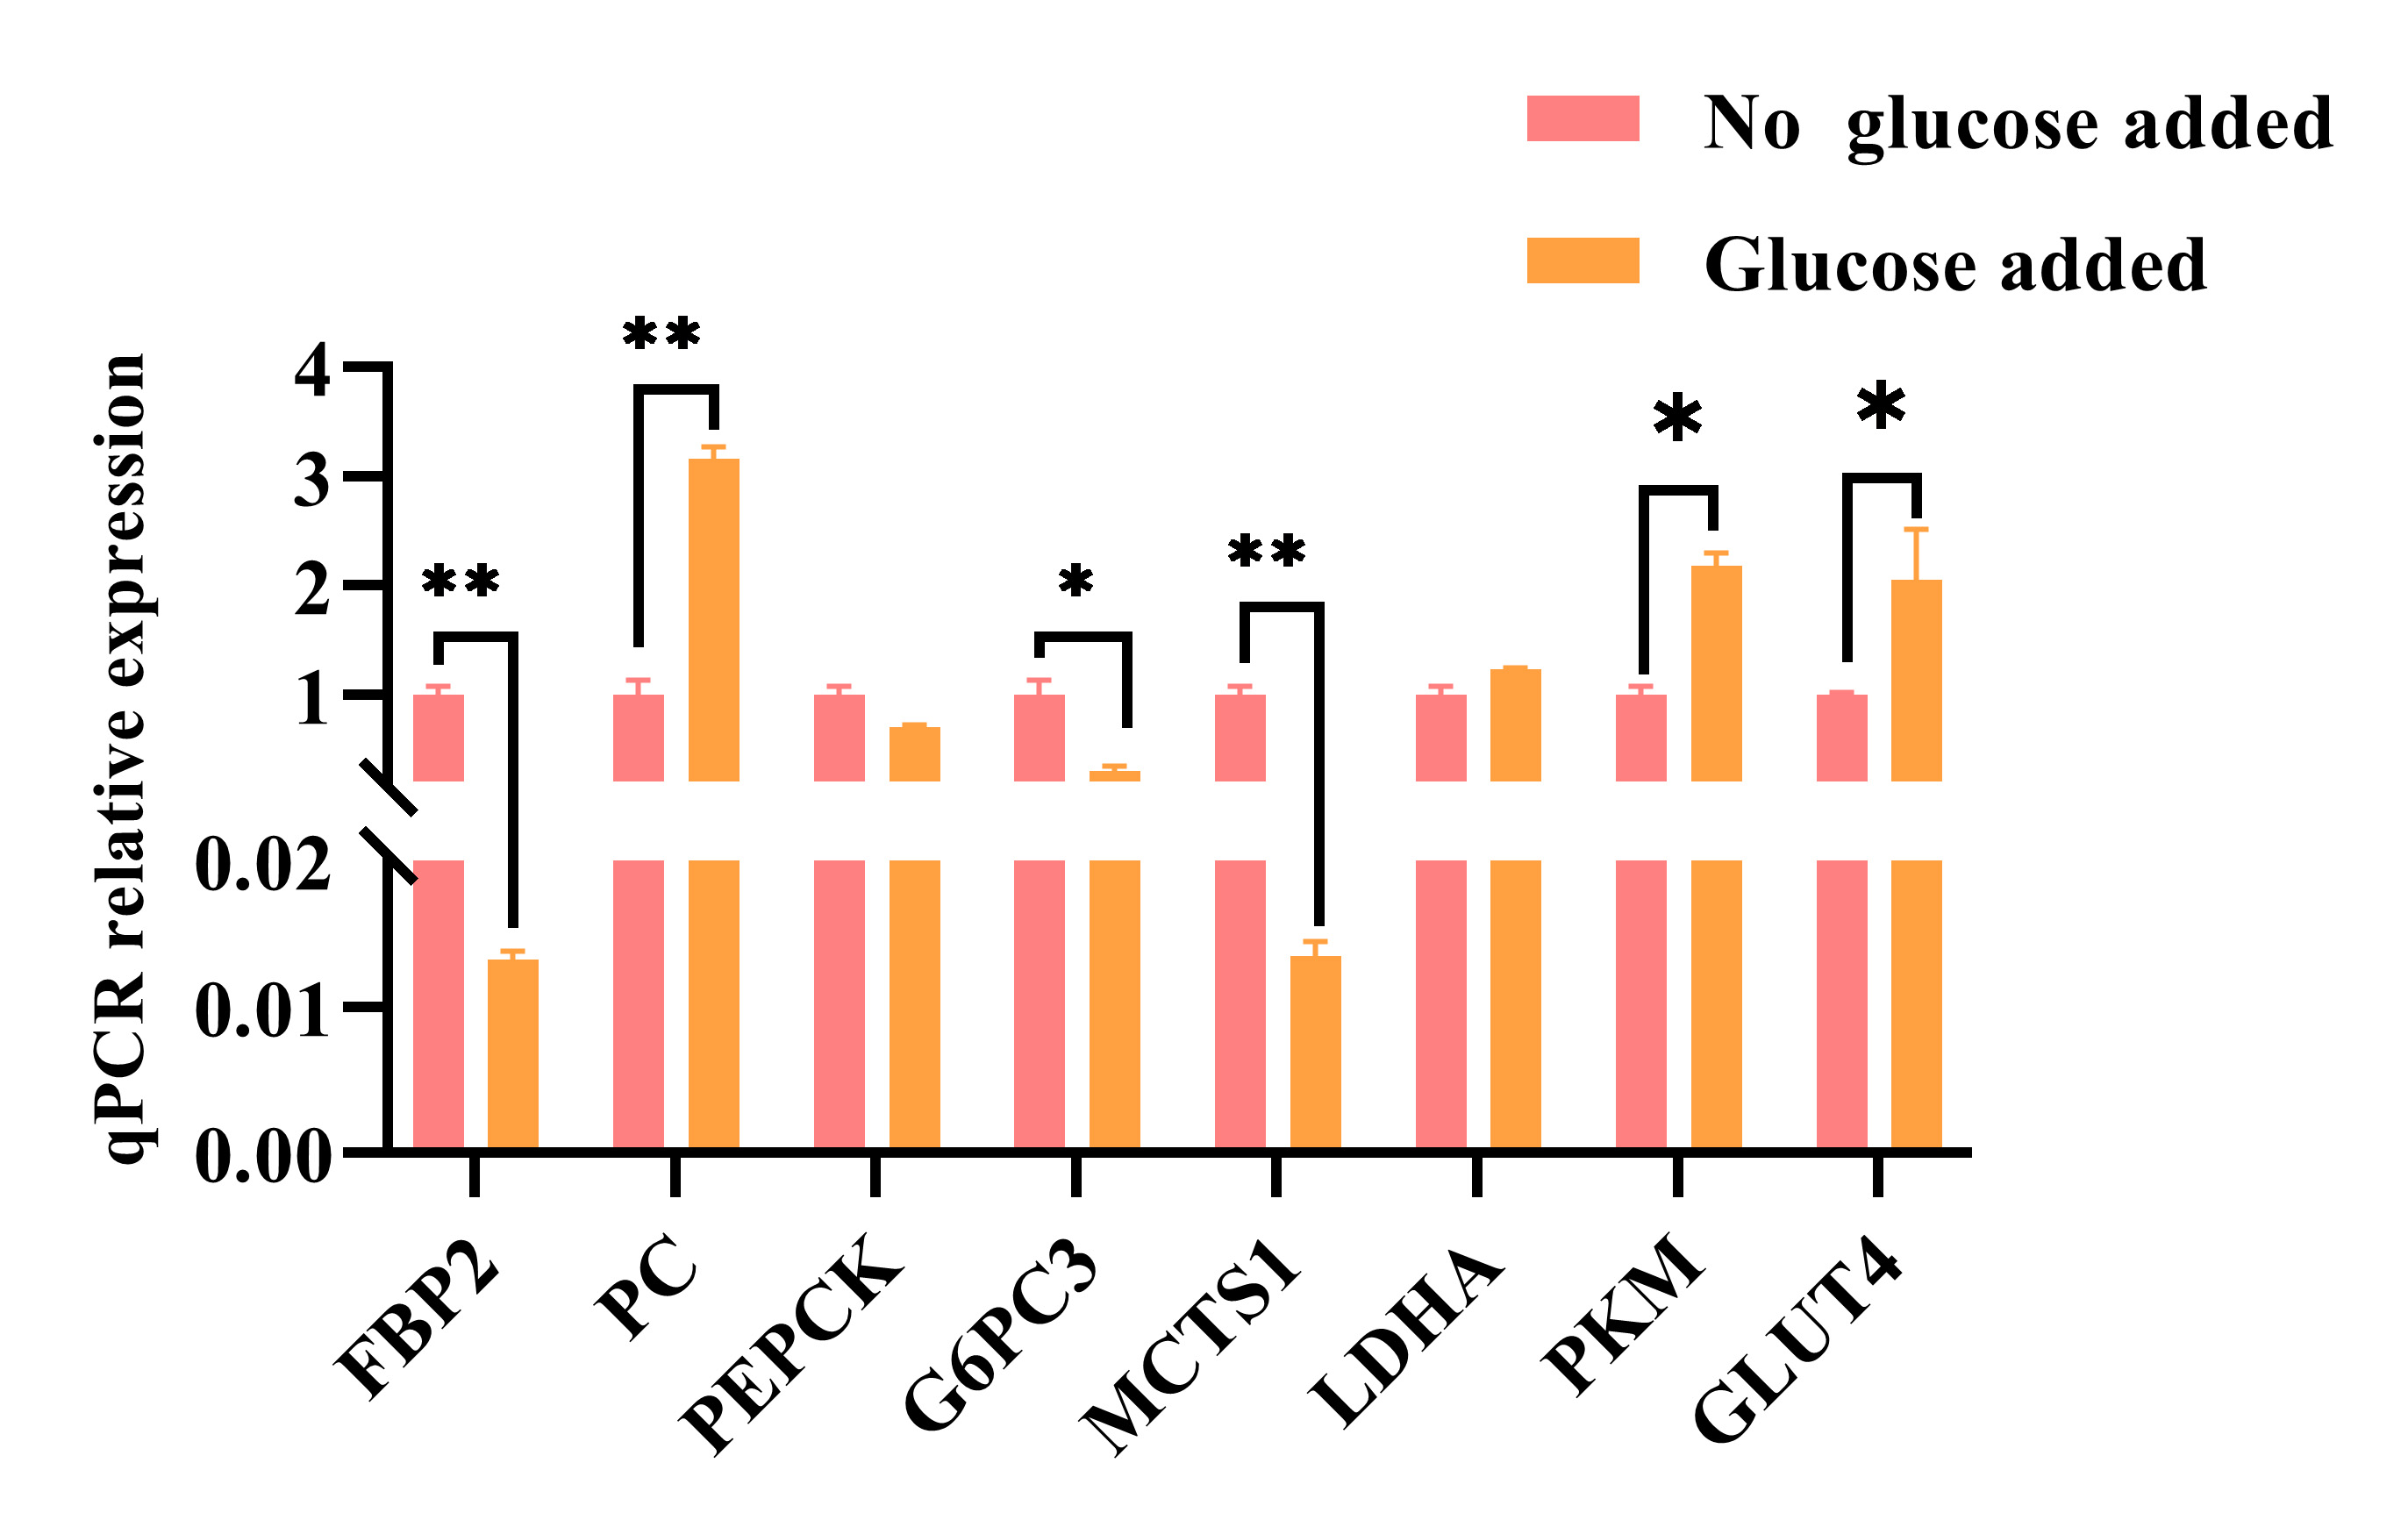 Fig. 4.
After 6 h of fasting, the relative mRNA expression levels of key
genes involved in gluconeogenesis in muscle cells cultured with glucose for 48
h. The data represent three independent cell culture experiments. * p
Fasting and glucose addition significantly affected the expression of key genes
of gluconeogenesis in skeletal muscle cells. To determine the effect of the
gluconeogenic precursor lactic acid on skeletal muscle cell metabolism and
glucose concentration, different concentrations of lactic acid (0 to 30 mM) were
added to the culture medium. The activity of lactate dehydrogenase (LDH) and
glucose concentration in cells were estimated. The results showed that the
addition of 10 and 20 mM lactic acid resulted in slightly higher glucose
concentration than 0 and 30 mM (Fig. 5A). Additionally, 10 and 20 mM lactic acid
resulted in slightly lower lactate dehydrogenase (LDH) release than 0 and 30 mM
(Fig. 5B), but there was no significant difference between the groups (p
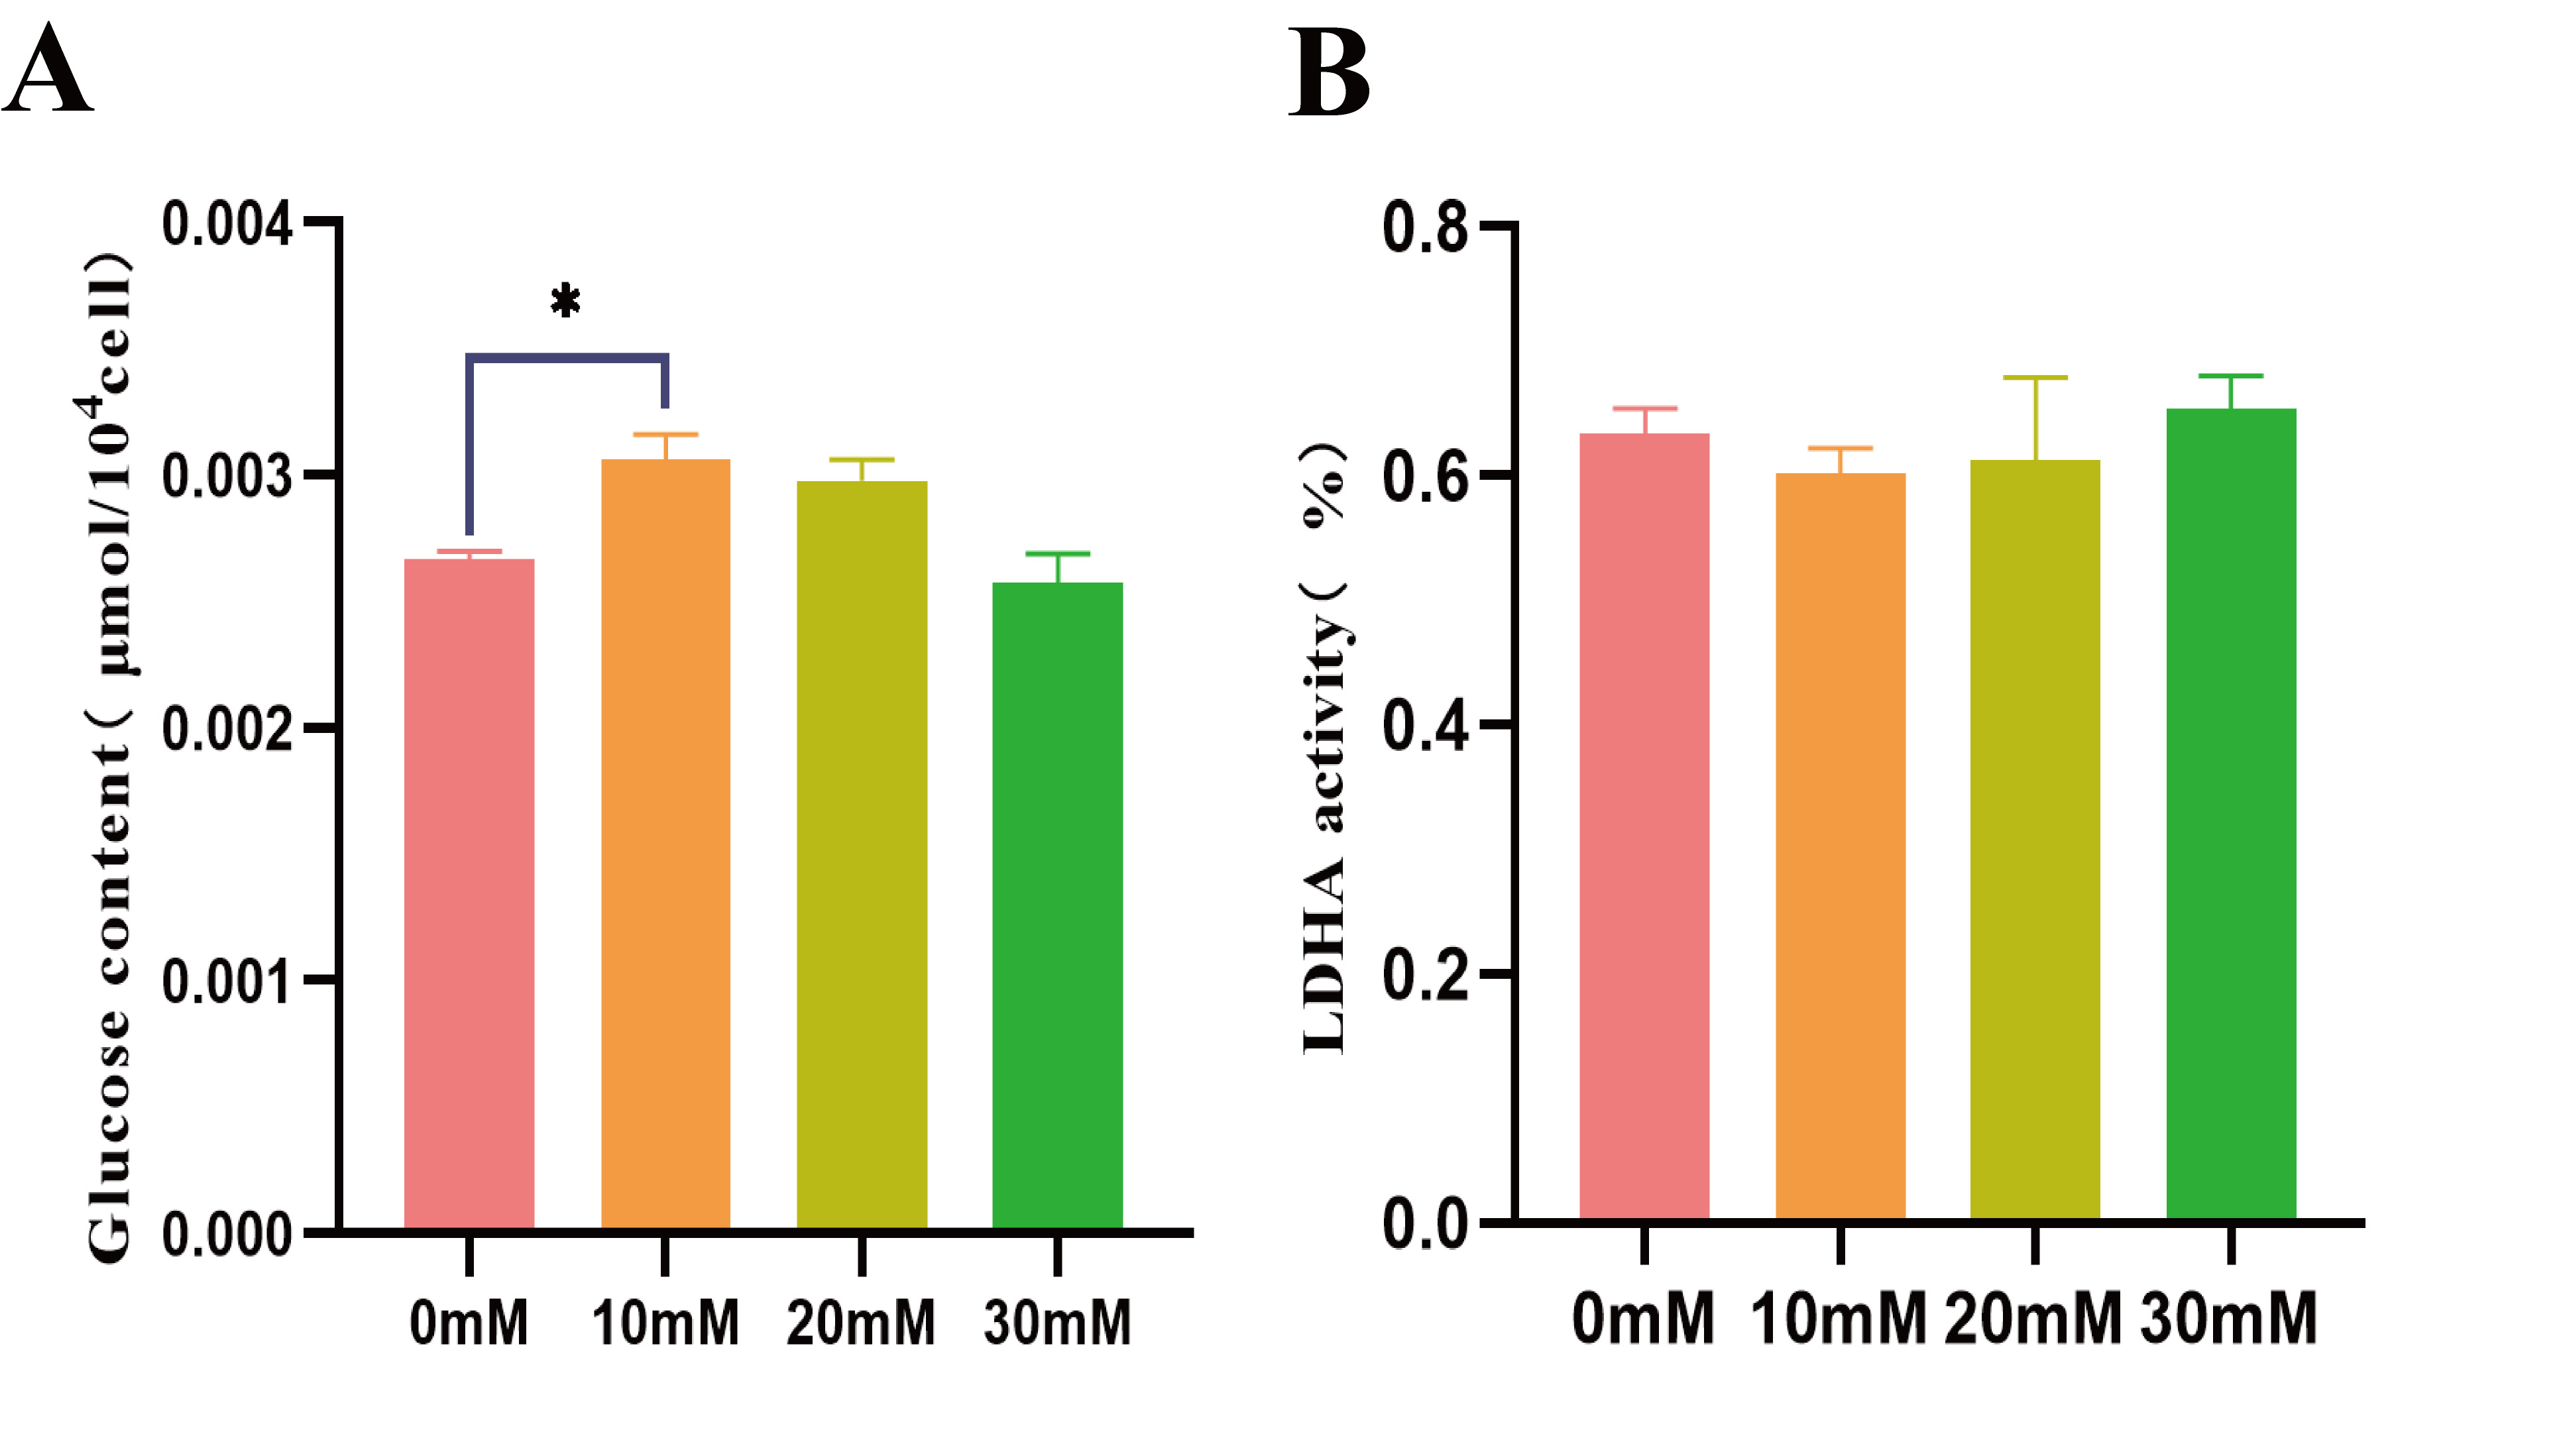 Fig. 5.
Effects of lactic acid on skeletal muscle cells and glucose
concentration. (A) Glucose content detection. (B) Lactate dehydrogenase
activity. * p
To explore the regulatory role of lactic acid in the gluconeogenesis pathway of
skeletal muscle cells after fasting, changes in mRNA expression levels of key
genes were analyzed using qRT-PCR technology. The results showed that adding 10
and 20 mM lactic acid promoted the expression of FBP2, G6PC3,
PKM, MCTS1, GLUT4, PC, and LDHA in
skeletal muscle cells cultured for 48 h after fasting for 6 h. Among them, 10 mM
lactic acid significantly increased mRNA expression levels of FBP2,
PKM, MCTS1, GLUT4, PC, and LDHA
(p
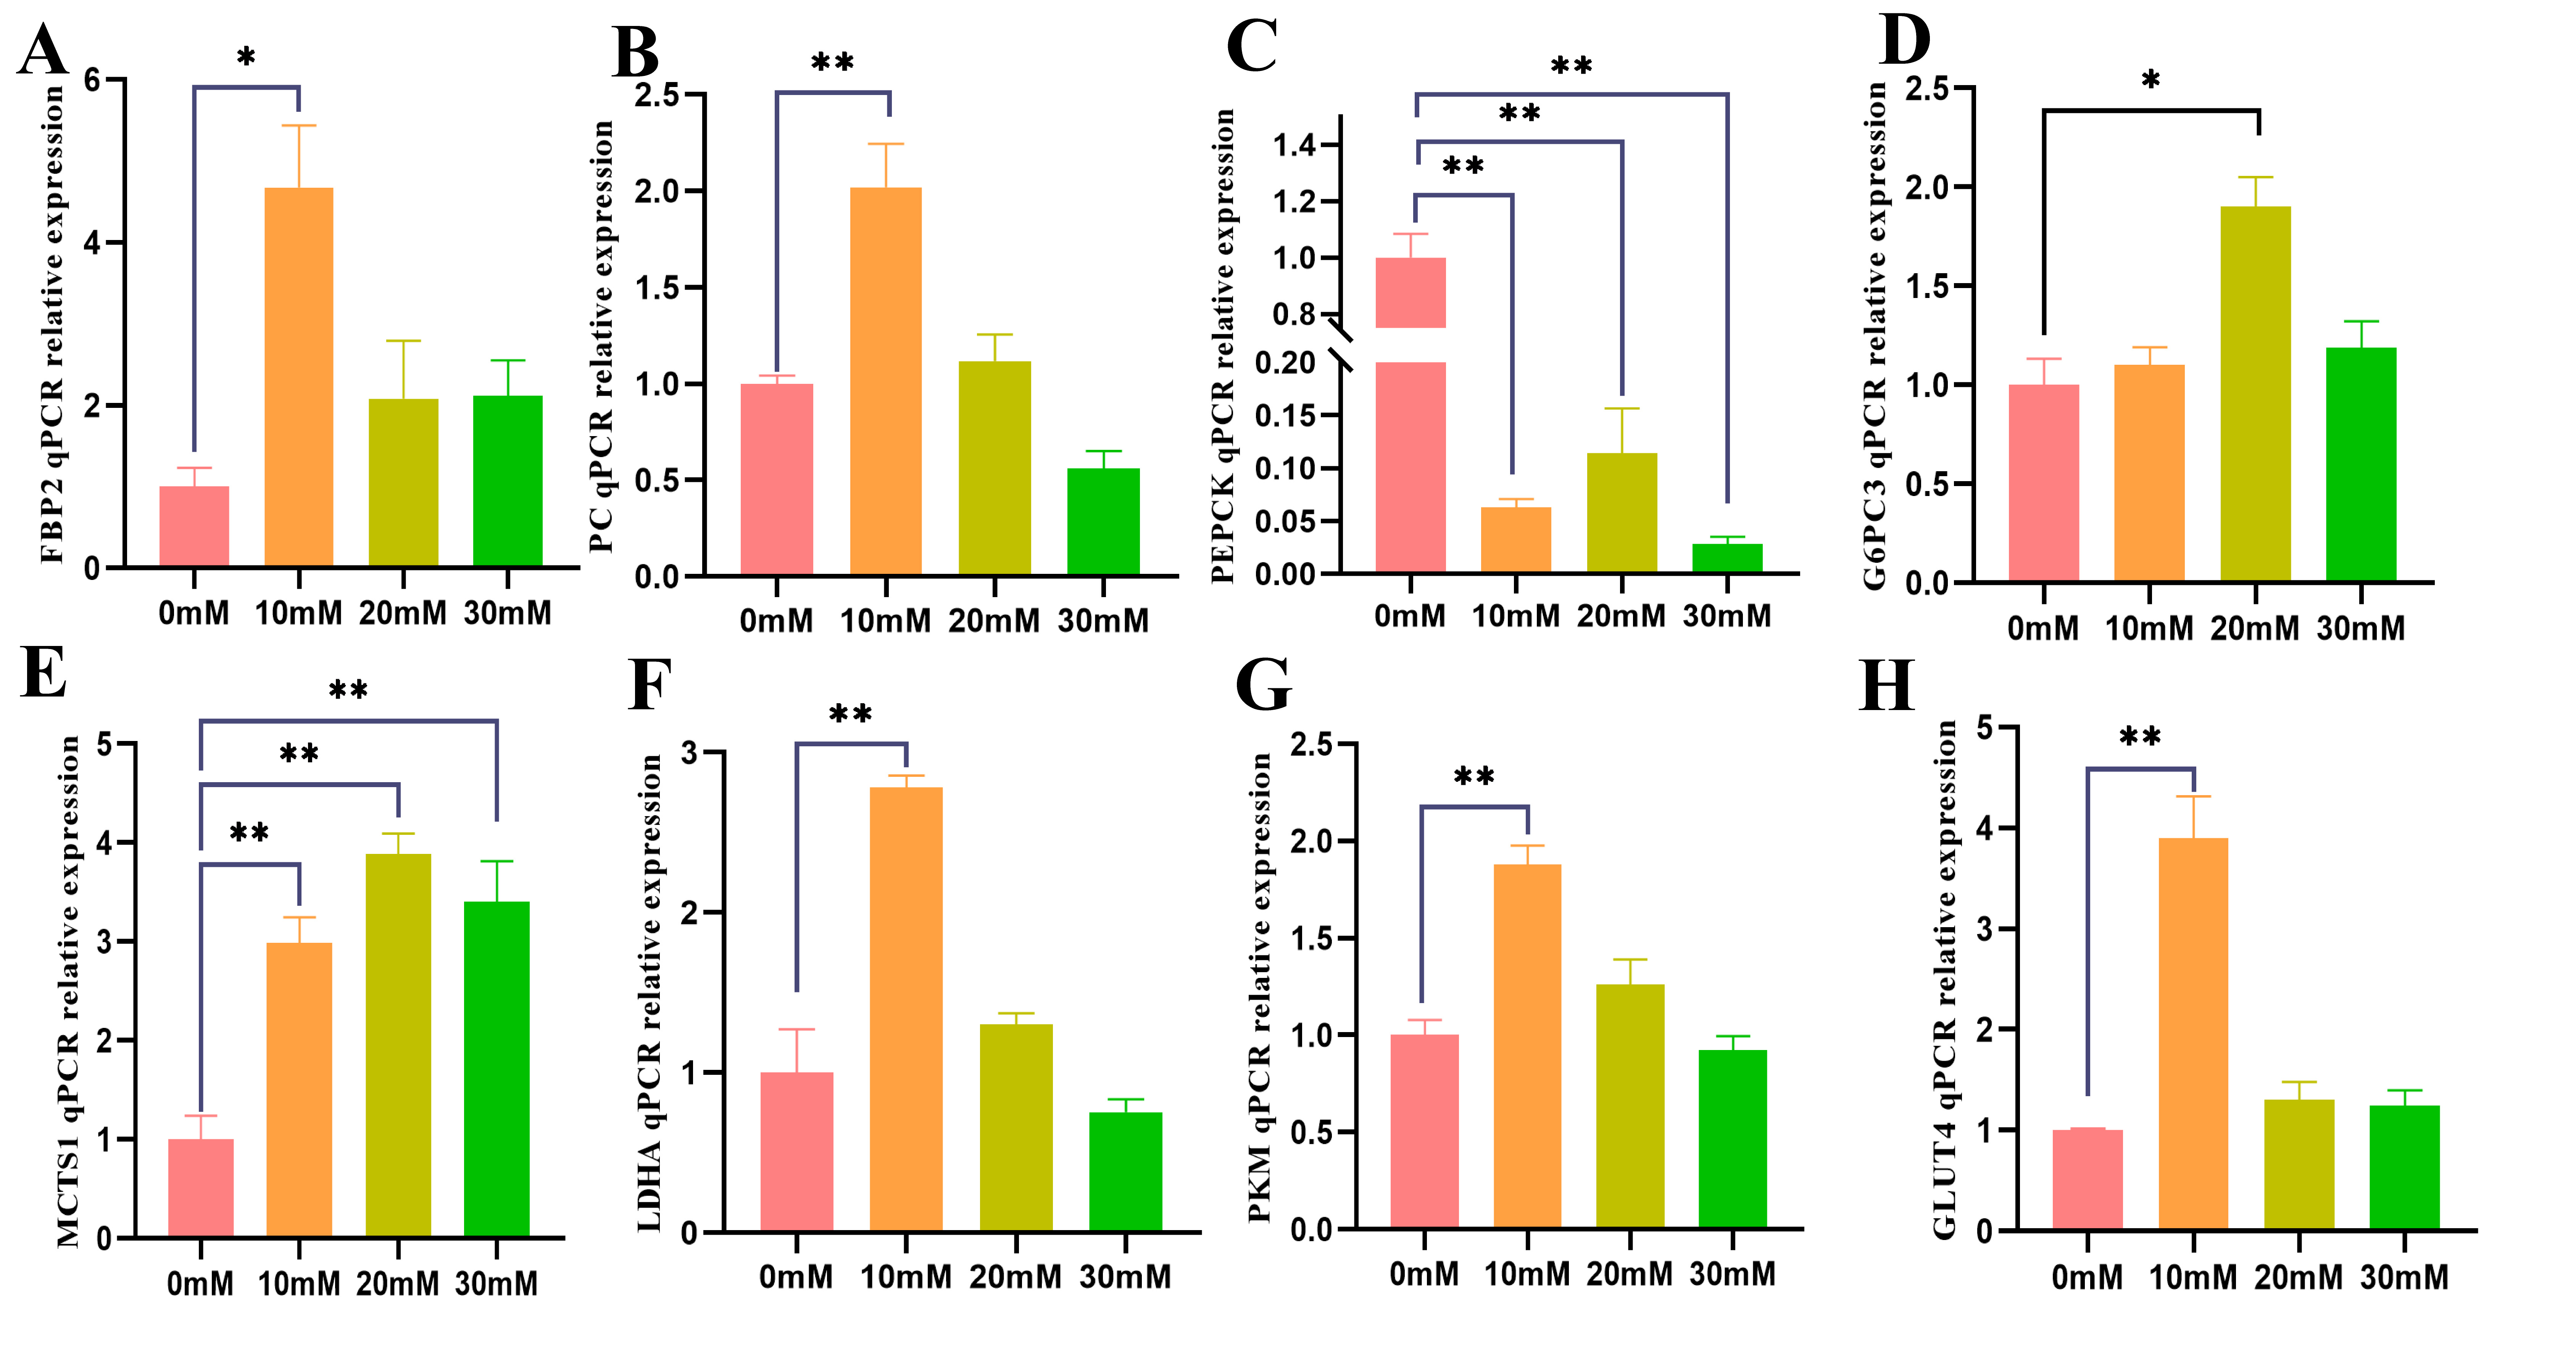 Fig. 6.
After 6 h of fasting, skeletal muscle cells were cultured with
0, 10, 20, and 30 mM lactic acid for 48 h, and the relative mRNA expression
levels of key genes involved in gluconeogenesis were measured. The qRT-PCR
relative expressions of (A) FBP2, (B) PC, (C) PEPCK,
(D) G6PC3, (E) MCTS1, (F) LDHA, (G) PKM, and
(H) GLUT4 are shown. The data represent three independent cell culture
experiments. * p
Western blotting and immunofluorescence techniques were used to analyze the
expression and intracellular localization of key proteins in gluconeogenesis. The
results indicated a significant increase in levels of FBP2 and PKM proteins with
the addition of 10 mM lactic acid (p
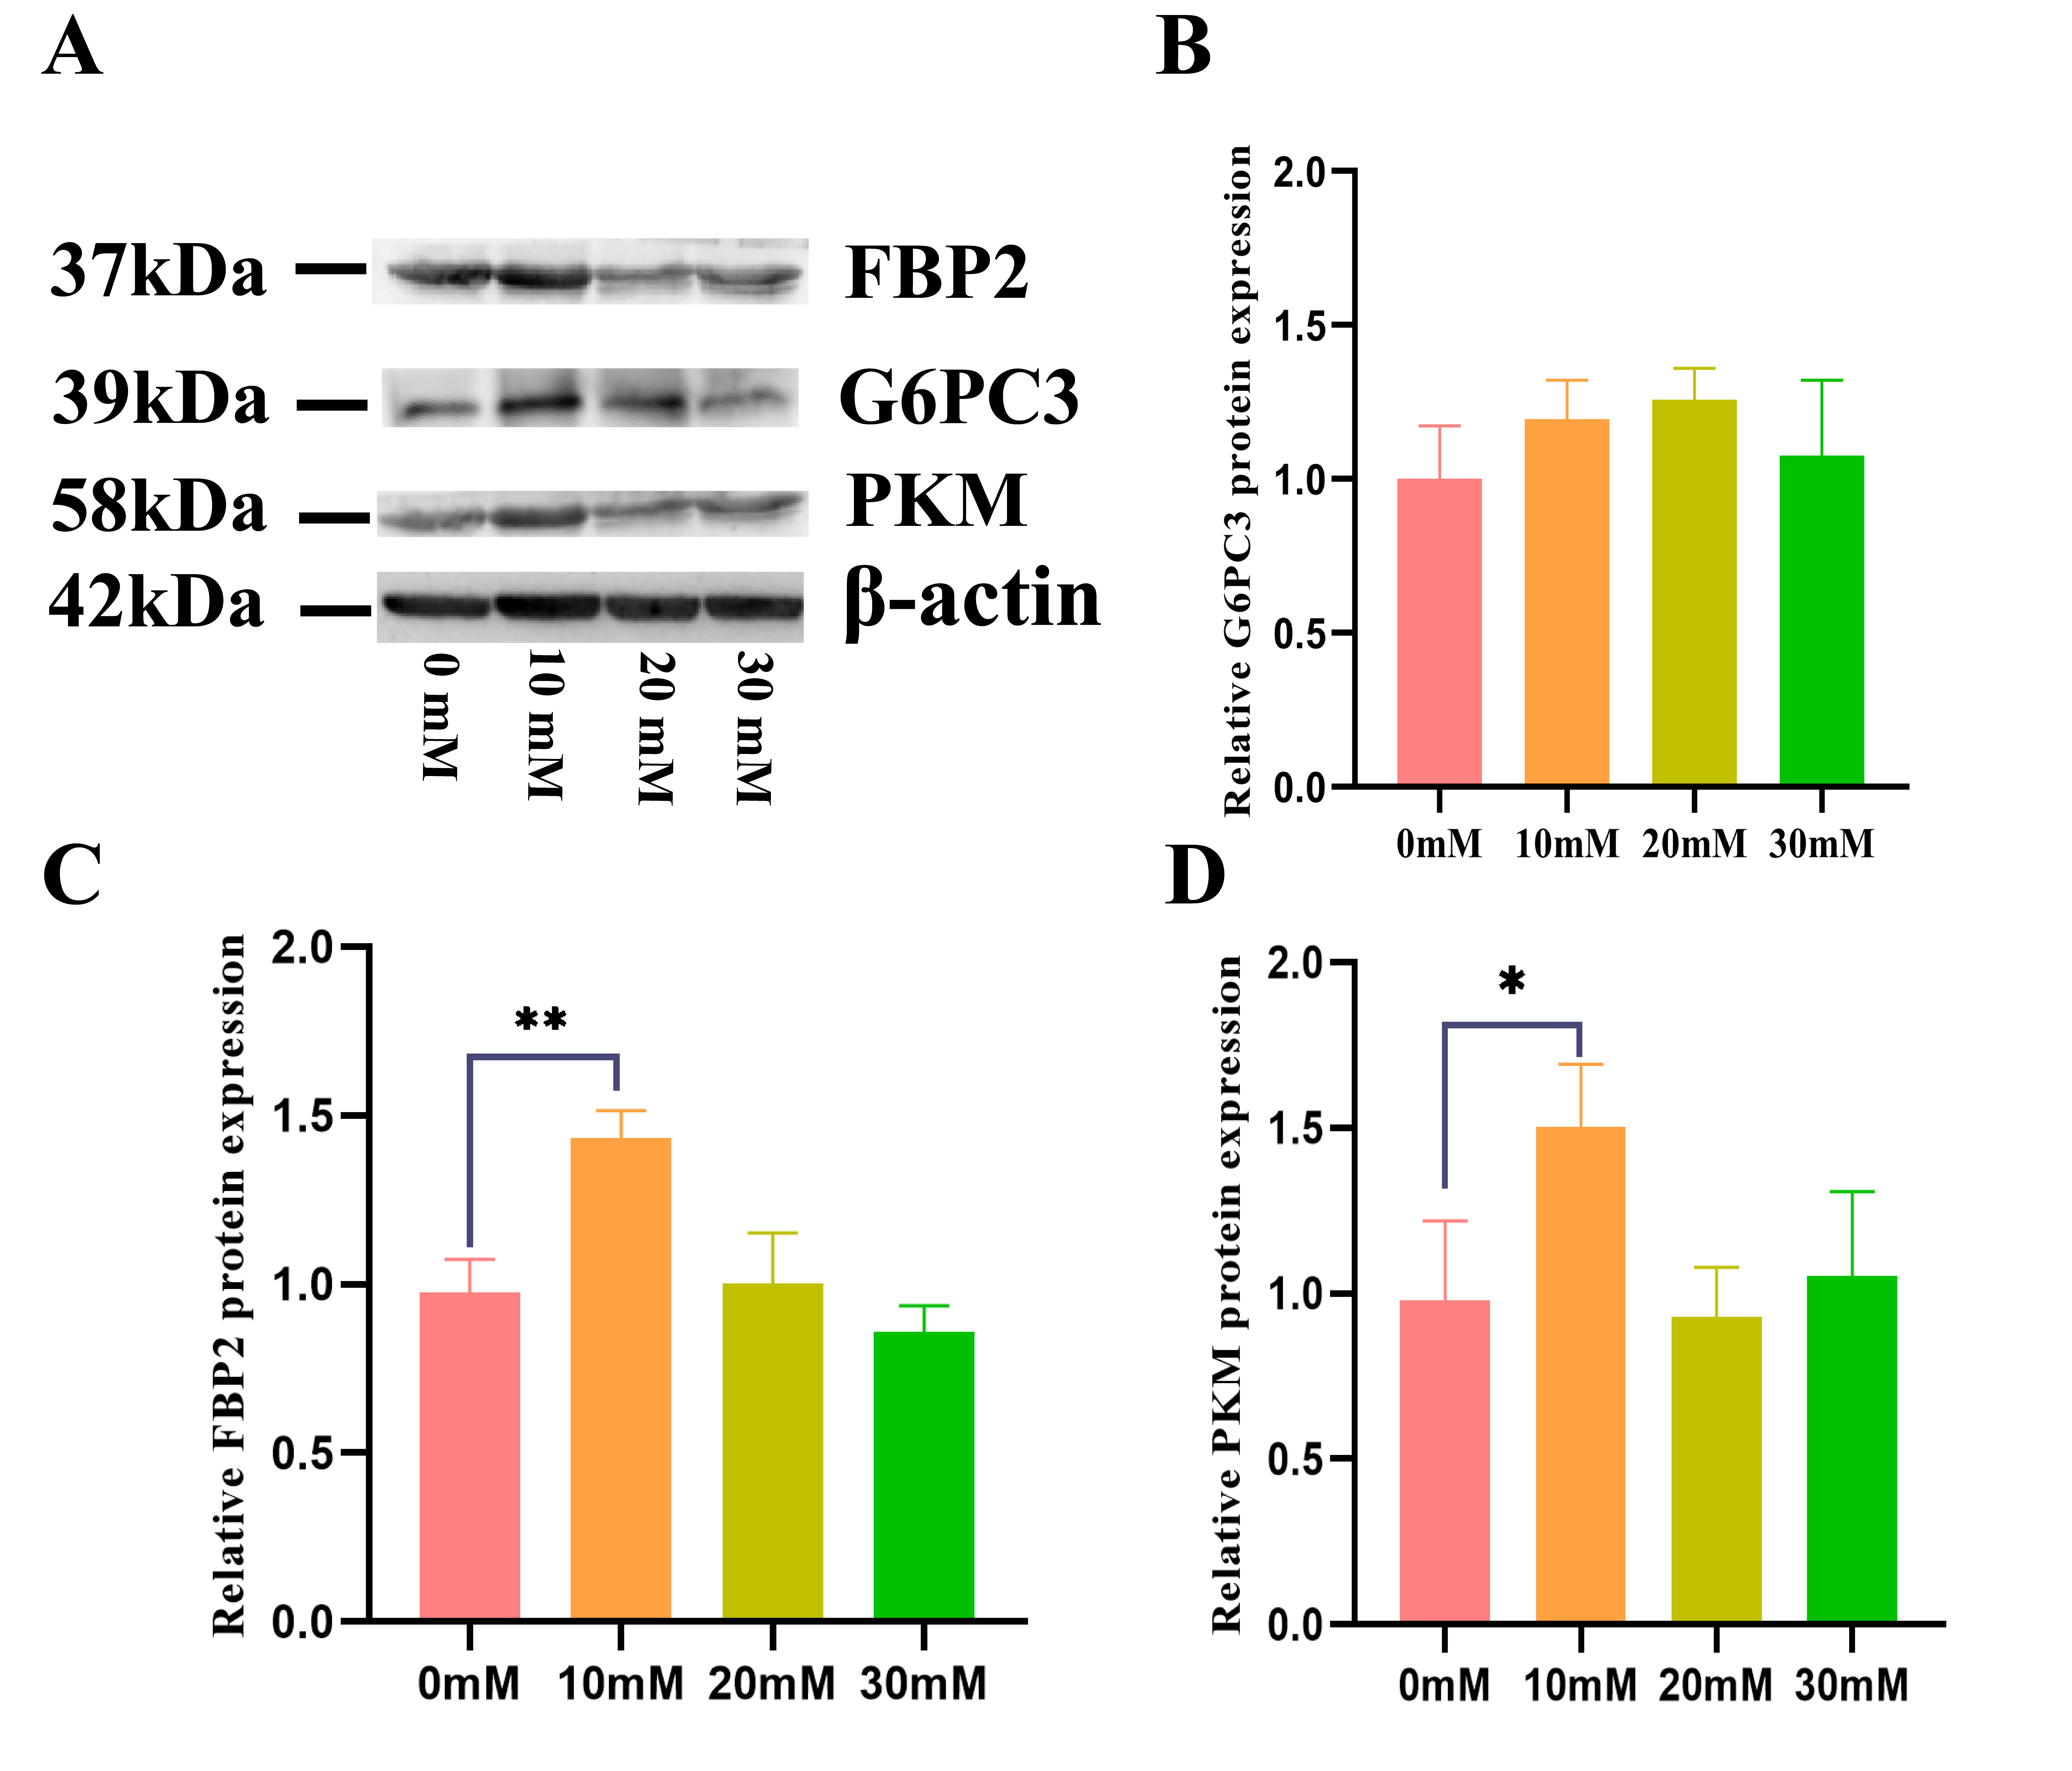 Fig. 7.
After 6 h of fasting, skeletal muscle cells were cultured with
0, 10, 20, and 30 mM lactic acid for 48 h to determine the protein levels of
FBP2, G6PC3, and PKM in skeletal muscle cells. Quantitative analysis of FBP2,
G6PC3, and PKM protein levels by western blotting. (A) The blotting results of
key gluconeogenesis proteins. The relative protein levels of (B) G6PC3, (C) FBP2,
and (D) PKM. The bar graphs depict the normalized expression of respective
proteins relative to
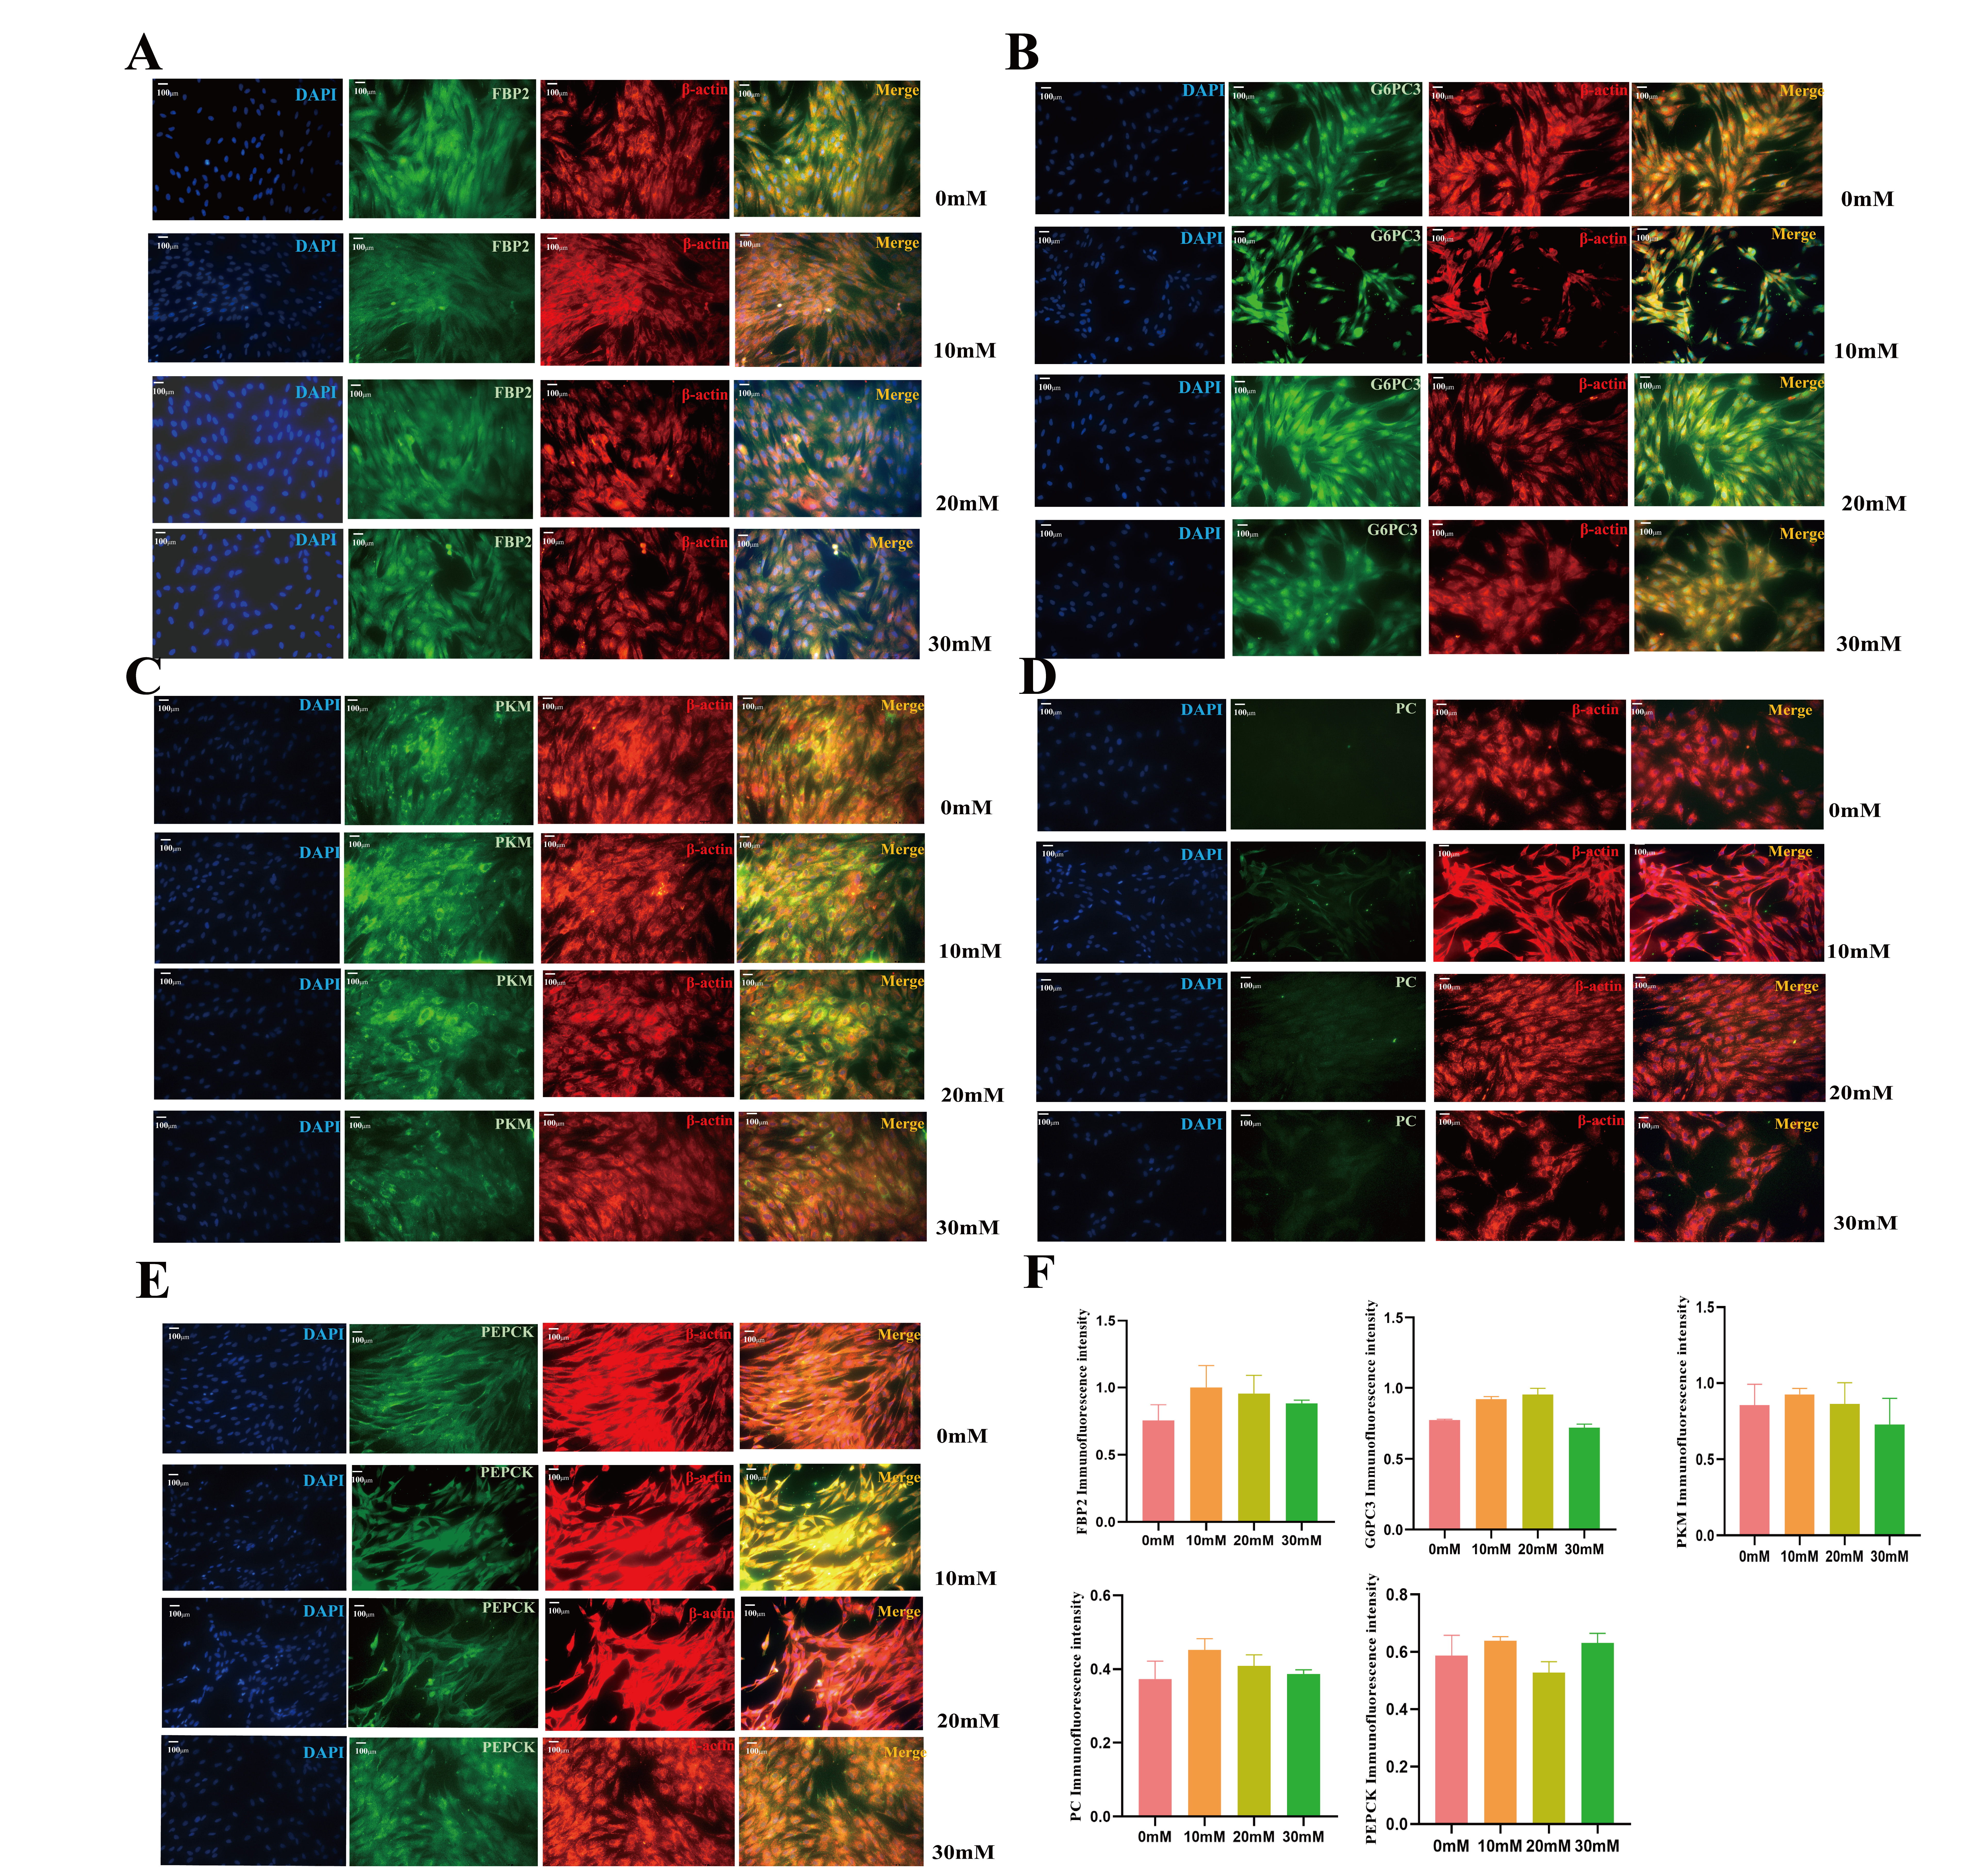 Fig. 8.
After 6 h of fasting, skeletal muscle cells were cultured with
lactic acid (0 to 30 mM) for 48 h. Immunofluorescence validation of key
gluconeogenic protein levels in muscle cells (10
The liver and kidneys are traditionally seen as the main sites of gluconeogenesis. However, recent studies indicate that gluconeogenesis-related genes are also expressed in the skeletal muscles of ruminants. This study found that after fasting, skeletal muscle cells expressed key gluconeogenic genes except PEPCK. This suggests that during prolonged fasting or hypoglycemia, muscles may provide an energy source and regulate blood glucose metabolism through gluconeogenesis and glycolysis [18]. Additionally, lactic acid, a main metabolic product in skeletal muscle, is an important precursor of gluconeogenesis, which can regulate the expression of gluconeogenesis genes.
Glucose is the most important carbohydrate in the body. In the fed state, most circulating glucose comes from the diet, while gluconeogenesis and glycogenolysis maintain physiological glucose concentration in the fasting state. After a night of fasting, gluconeogenesis provides 25%–50% of total glucose production in the human body, while the rest is produced by glycogenolysis [19]. With prolonged fasting and depletion of glycogen reserves, total glucose production relies more on gluconeogenesis [19]. This research observed that the expression levels of gluconeogenesis-related genes, including PKM, PC, LDHA, MCT1, FBP2, and G6PC3, notably increased after fasting treatment. A previous study showed that PKM expression was highest in fasted fish and decreased with feeding [20]. This change in PKM may respond to the decreased glycolytic pathway flux, increasing glucose levels. Glucose effectively stimulates PKM [20]. Pyruvate produced by glycolysis and glycogenolysis in skeletal muscle during exercise or fasting has two fates. Pyruvate can convert to oxaloacetic acid by PC and enter the citric acid cycle or convert to lactic acid under the catalysis of LDHA, producing glucose through the gluconeogenesis pathway [21]. These studies suggest that decreased glycolytic flux and upregulated PKM, PC, and LDHA gene expression after fasting may improve pyruvate conversion and utilization efficiency.
The main physiological role of MCT1 is to promote lactic acid entry or exit from cells. Hoshino et al. [22] observed that MCT1 protein levels and muscle glycogen concentration significantly increased in the tibialis anterior muscle of mice after exercise. MCT1 protein expression positively correlated with muscle glycogen concentration (r = 0.969). Studies also show that FBPase and G6PC, key gluconeogenesis genes, are significantly upregulated during fasting [23]. This indicates that skeletal muscle gluconeogenesis activation after fasting or exercise may relate to muscle glycogen recovery [18].
Our results showed that adding glucose to skeletal muscle significantly inhibited the expression of gluconeogenesis-related genes such as FBP2, MCTS1, and G6PC3. In addition, glucose promoted the expression of PKM, PC, and GLUT4. Since GLUT4, PKM, and PC genes are involved in glucose transport and the synthesis of pyruvate and oxaloacetate, respectively [24, 25, 26], oxaloacetate eventually enters the tricarboxylic acid cycle. Previous research showed that continuous glucose addition to cultured mouse hepatocytes led to the inhibition of PEPCK expression [27], consistent with our results. Therefore, an increase in intracellular glucose concentration will change gene expression levels to adapt to metabolic changes, effectively using high-concentration glucose for energy production and metabolic regulation.
After fasting, glucose supply can affect the metabolic pathways and gene expression of muscle cells, thereby regulating muscle energy metabolism. Glucose supply can promote the glycolytic pathway, activate energy metabolism-related genes, increase ATP synthesis, and adjust muscle energy metabolism [28, 29].
The results showed that adding 10 and 20 mM lactic acid promoted skeletal muscle cells to produce a small amount of glucose, with relatively low LDH activity. However, at 30 mM lactic acid concentration, intracellular glucose concentration decreased, and LDH activity increased. Reduced cell activity usually increases LDH release. Previous studies found that lactic acid concentrations exceeding 20 mM (22 mM, 27 mM) significantly inhibited the growth activity of osteoblast-like cells [30]; the maximum tolerated concentration was 30 mM [31]. This indicates a limit in the utilization of lactic acid by the body. Excessive lactic acid harms cells, inhibiting their growth activity. These results are significant for understanding the biological role of lactic acid in cells and its regulatory mechanisms for cell growth.
The past gluconeogenesis research has focused mainly on liver metabolic
pathways, but the impact of lactic acid on key genes involved in gluconeogenesis
in ruminant skeletal muscle remains unclear. The hepatic gluconeogenesis pathway
has four key rate-limiting enzymes: PC, PEPCK, FBPase,
and G6PC. PC and PEPCK catalyze the first and second
steps, respectively. PC converts PEP into oxaloacetic acid (OAA), while
PEPCK catalyzes the synthesis of phosphoenolpyruvate from OAA. This
study found that in skeletal muscle cells exposed to varying lactic acid
concentrations, PC expression initially rose and then declined, whereas
PEPCK expression notably dropped. Adding a low dose of lactic acid (10
mM) caused these changes. The increased PC expression in skeletal muscle
cells may enhance the carboxylation ability of pyruvate, promoting its conversion
into OAA and its entry into the tricarboxylic acid cycle to generate energy for
increased intracellular lactic acid metabolism [10, 32]. The decreased
PEPCK expression suggests OAA mainly entered the tricarboxylic acid
cycle after lactic acid addition rather than converting to PEP. This may be due
to the increased pyruvate supply from lactic acid metabolism, reducing the need
for skeletal muscle cells to synthesize PEP. This study also observed that the
expression of the PKM gene and protein in cells increased after adding
different lactic acid concentrations. PKM is the main subtype of
pyruvate kinase (PK) expressed in muscles [33], catalyzing the transfer
of phosphate groups from PEP to ADP to produce ATP and pyruvate. It is a key
rate-limiting enzyme in the final step of glycolysis, which is generally
considered irreversible [26]. However, many studies have confirmed the existence
of a reverse flux of PKM in skeletal muscle [10, 12, 34]. Jin et
al. [34] found through
FBP2, an enzyme in muscles, hydrolyzes 1.6-diphosphofructose to 6-phosphofructose and is crucial in skeletal muscle gluconeogenesis [37]. Lactic acid addition increases FBP2 gene expression in mouse skeletal muscle, enhancing glycogen synthesis [18]. Previous studies found that overexpressing the FBP2 gene in mouse right tibial muscles increased glucose uptake and gluconeogenic flux [38]. FBP2-knockout mice exhibited severe intolerance to cold when fasted. Cold-induced conversion of lactic acid to glycogen (glycogenesis) was absent in FBP2-knockout muscles, causing a lack of glycogen for thermogenesis [39]. These findings underscore the role of FBP2 in skeletal muscle gluconeogenesis. This study showed that lactic acid addition increased FBP2 expression, promoting intramuscular glycogen synthesis, consistent with previous studies [18, 38, 39].
Recent research identified G6PC3, an enzyme in the endoplasmic reticulum that generates glucose. Unlike G6PC1, which is in the liver, kidneys, and intestines, G6PC3 is commonly expressed in tissues [24]. However, G6PC activity in muscles is low and its physiological effects are often overlooked [40]. This study found that lactic acid did not significantly affect G6PC3 protein expression. Although 10 mM lactic acid increased cell glucose synthesis, it was limited and lacked physiological significance. This suggests that glucose-6-phosphate synthesized by skeletal muscle gluconeogenesis is converted to glycogen rather than released into the circulatory system [40].
Lactic acid crosses the plasma membrane via the MCTS of the SLC16 gene family, promoting the transmembrane transport of lactic acid and pyruvate [41]. This study showed that varying lactic acid concentrations significantly improved MCTS1 gene expression. GLUT4 facilitates glucose passage across cell membranes and is the bottleneck in peripheral glucose utilization [42]. At 10 mM concentration, GLUT4 gene mRNA expression increased significantly, consistent with the increase in glucose concentration found at 10 mM. LDHA converts lactic acid to pyruvate [43]. The LDHA gene mRNA expression also increased after adding 10 and 20 mM lactic acid.
Skeletal muscle cell growth and proliferation rates differ between fetal and postpartum sheep, but cell morphology and function are similar. Studying gluconeogenesis in fetal sheep skeletal muscle cells may help understand postpartum muscle metabolism. Sheep skeletal muscle cell gluconeogenesis is regulated by multiple factors including nutrition, hormones, and the environment. Studying fasting and lactic acid effects on key gluconeogenic genes in sheep skeletal muscle cells helps reveal energy metabolism regulation in ruminants and provides energy supply strategies for sheep during winter hay shortages.
This research discovered that fasting regulates the expression of crucial gluconeogenic genes (FBP2, G6PC3, PKM, MCTS1, GLUT4, PC, and LDHA) in sheep skeletal muscle cells and further revealed the role of lactic acid in inducing these key gluconeogenic genes, providing new insights and methods for related research.
The datasets used and analyzed during the current study are available from the corresponding author upon reasonable request.
JW, YP and SH designed the research study. YP, BW and DW performed the research. FS and DW provided help and advice on the cell experiments. YP, BW, FS and JY analyzed the data and drew figures. YP wrote the manuscript. JW, SH, JY and YP reviewed and revised the manuscript. All authors contributed to editorial changes in the manuscript. All authors read and approved the final manuscript. All authors have participated sufficiently in the work and agreed to be accountable for all aspects of the work.
The Experimental Animal Welfare and Ethics Committee of the College of Animal Science and Technology, Inner Mongolia Minzu University has reviewed and approved (Approval No. 2022015) for studies involving animals.
Thanks to Zaccheaus Pazamilala Akonyani for polishing the manuscript.
This work was supported by the National Natural Science Foundation of China (32260812, 32161143026), the Inner Mongolia Autonomous Region’s Key Technology Tackling Plan (2023YFDZ0027, 2021GG0008, 2020GG0069), the Program for Young Talents of Science and Technology in Universities of Inner Mongolia Autonomous Region (2023NJYT23015), the Youth Program for Grassland Elite in Inner Mongolia Autonomous Region, and the Doctoral Scientific Research Foundation of Inner Mongolia Minzu University (BS527, BS526).
The authors declare no conflict of interest.
References
Publisher’s Note: IMR Press stays neutral with regard to jurisdictional claims in published maps and institutional affiliations.