


 , I-Shiang Tzeng 3,4, Lu-Kai Wang 5, Chang-Chieh Wu 6, Mao-Liang Chen 3, Chan-Yen Kuo 3, Rong-Yaun Shyu 7, Fu-Ming Tsai 3,*
1 Department of Dermatology, Taipei Tzu Chi Hospital, Buddhist Tzu Chi Medical Foundation, 231 New Taipei City, Taiwan
2 School of Medicine, Tzu Chi University, 970 Hualien, Taiwan
3 Department of Research, Taipei Tzu Chi Hospital, The Buddhist Tzu Chi Medical Foundation, 231 New Taipei City, Taiwan
4 Department of Statistics, School of Business, National Taipei University, 237 New Taipei City, Taiwan
5 Department of Life Sciences, Ministry of Science and Technology, 106 Taipei, Taiwan
6 Department of Surgery, Tri-Service General Hospital Keelung Branch, National Defense Medical Center, 202 Keelung, Taiwan
7 Department of Internal Medicine, Taipei Tzu Chi Hospital, The Buddhist Tzu Chi Medical Foundation, 231 New Taipei City, Taiwan
Abstract
Background: This study investigated the mechanism by which tazarotene-induced gene 1 (TIG1) inhibits melanoma cell growth. The main focus was to analyze downstream genes regulated by TIG1 in melanoma cells and its impact on cell growth. Methods: The effects of TIG1 expression on cell viability and death were assessed using water-soluble tetrazolium 1 (WST-1) mitochondrial staining and lactate dehydrogenase release assays. RNA sequencing and Western blot analysis were employed to investigate the genes regulated by TIG1 in melanoma cells. Additionally, the correlation between TIG1 expression and its downstream genes was analyzed in a melanoma tissue array. Results: TIG1 expression in melanoma cells was associated with decreased cell viability and increased cell death. RNA-sequencing (RNA-seq), quantitative reverse transcription PCR (reverse RT-QPCR), and immunoblots revealed that TIG1 expression induced the expression of Endoplasmic Reticulum (ER) stress response-related genes such as Homocysteine-responsive endoplasmic reticulum-resident ubiquitin-like domain member 1 (HERPUD1), Binding immunoglobulin protein (BIP), and DNA damage-inducible transcript 3 (DDIT3). Furthermore, analysis of the melanoma tissue array revealed a positive correlation between TIG1 expression and the expression of HERPUD1, BIP, and DDIT3. Additionally, attenuation of the ER stress response in melanoma cells weakened the impact of TIG1 on cell growth. Conclusions: TIG1 expression effectively hinders the growth of melanoma cells. TIG1 induces the upregulation of ER stress response-related genes, leading to an increase in caspase-3 activity and subsequent cell death. These findings suggest that the ability of retinoic acid to prevent melanoma formation may be associated with the anticancer effect of TIG1.
Keywords
- Tazarotene-induced gene 1
- retinoic acid receptor responder protein 1
- ER stress
- melanoma
Tazarotene-induced gene 1 (TIG1), also known as retinoic acid receptor responder protein 1 (RARRES1), is located on chromosome 3q25.32 and can be induced by the vitamin A derivative tazarotene or retinoic acid receptors. It primarily encodes for TIG1 protein (TIG1B isoform) consisting of 228 amino acids with a molecular weight of 25.8 kDa. Additionally, TIG1 can encode the TIG1A protein (TIG1A isoform) consisting of 294 amino acids with a molecular weight of 33.3 kDa. However, there are no significant differences between TIG1A and TIG1B with regard to cellular activities involving cell growth or autophagy [1, 2].
Methylation of CpG islands in the TIG1 promoter leads to downregulation of TIG1 expression in prostate cancer, gastric cancer, squamous cell carcinoma of the esophagus, and many other cancer types [3, 4, 5, 6]. Methylation of the TIG1 gene is also associated with the staging of various cancer types. TIG1 is predominantly expressed in differentiated intestinal tissues [4, 7], and the in vitro expression of TIG1 has been shown to inhibit cellular invasion [8, 9, 10]. Sequence alignment studies have shown a high degree of similarity between TIG1 and members of the latexin family. The latter act primarily as inhibitors of carboxypeptidase, and may participate in cancer cell invasion by activating matrix metalloproteinase (MMP)-related proteins [11, 12]. Previous studies have also found that TIG1 inhibits cytoplasmic carboxypeptidase AGBL2, cathepsin V, and activated serine protease inhibitor Kazal-Type 2, thereby inhibiting cell invasion [9, 10, 13]. TIG1 is thus recognized as a tumor suppressor gene.
Malignant melanoma develops from melanocytes and commonly occurs on the skin, but may also manifest in the oral cavity, intestines, or eyes. Melanoma is the most dangerous type of skin cancer, but early diagnosis and treatment through surgical excision can improve the cure rate. Once melanoma spreads, both radiotherapy and chemotherapy show limited efficacy in improving outcomes, making melanoma one of the leading causes of death from skin cancer. Over the past decade, immunotherapy with immune checkpoint inhibitors such as pembrolizumab have been used to manage melanoma, as well as antibodies that target the mutated BRAF gene, such as vemurafenib. Although these newly developed drugs may improve the survival of patients with malignant melanoma, inconsistent findings have meant that more extensive clinical trials are needed for verification [14, 15, 16, 17]. Overall, clinical trials of treatments for the metastatic phase of melanoma have not been successful [18].
Vitamin A has been shown to be effective at preventing the formation of melanoma [19, 20], however the severe side effects prevent its widespread promotion. TIG1 is one of the genes induced by vitamin A. Recent literature suggests that TIG1 can inhibit the proliferation of insulin-induced melanoma cells via the mTOR signaling pathway [21]. Whether other molecules are involved in the anti-cancer effects of TIG1 remains to be explored. The aim of this study was to determine which intracellular signaling molecules are used by TIG1 to regulate the growth of melanoma cells. This was achieved through the use of RNA-sequencing (RNA-seq) analysis to identify downstream genes regulated by TIG1.
The methods for cell culture and transfection with the TIG1-myc-his expression vector were as described previously [21]. Human melanoma A2058 and A375 cells were obtained from the Bioresource Collection and Research Center (BCRC, Hsinchu, Taiwan). The authentication of the A2058 and A375 cell lines was conducted by the Genomics life science company (https://www.genomics.com.tw/tw) using STR profiling and comparison with the DSMZ database. The certificate of certification can be found in the supplementary material. Additionally, cell lines were regularly analyzed by staining with the DNA dye DAPI to exclude mycoplasma contamination.
Cell viability and cell death were evaluated as described previously [22].
Briefly, A2058 or A375 cells (2
After transfection with empty vector or with TIG1-myc-his expression vector for
24 h, RNA was extracted from A2058 cells using TRIzol reagent (Invitrogen, Carlsbad, CA, USA). RNA-seq was then
performed and the data analyzed by Biotools Microbiome Research Center
(https://www.toolsbiotech.com/product_service_detail.php?id=390&cateId=1459).
Raw reads obtained after sequencing were filtered for quality using Trimmomatic
to obtain clean reads. Clean reads were aligned to the reference sequence using
HISAT2, and gene expression levels (raw read counts) were calculated using
feature Counts. Expression levels were normalized using RLE/TMM/FPKM.
Differential gene expression analysis was performed based on biological
replicates (triplicates) using DESeq2, with genes filtered based on a
A melanoma tissue cDNA array (MERT301) was obtained from Origene Technologies.
After transfection of A2058 or A375 cells with empty vector or TIG1-myc-his
expression vector for 24 h, RNA was extracted using TRIzol reagent. Reverse
transcription was performed using GScript RTase enzyme (GeneDireX, Inc, Taiwan)
according to the manufacturer’s instructions. Primers for amplifying
TIG1 were as described in the literature [2], while the primer sequences
for amplification of other genes were as follows: Schlafen family member 11
(SLFN11): forward primer: 5
After transfection of A2058 and A375 cells with empty vector or TIG1-myc-his
expression vector, cells were lysed with Radioimmunoprecipitation assay (RIPA) buffer (a lab-made solution). Western blotting was
performed as previously described [21]. Antibodies recognizing myc-epitope (TIG1)
or
After transfection of A2058 and A375 cells with empty vector or TIG1-myc-his expression vector, cells were lysed with RIPA buffer. Caspase-3 activity was measured using a caspase-3 substrate as described previously [23]. Briefly, cell lysates were incubated in a buffer containing 25 mM HEPES [pH 7.5], 0.1% CHAPS, 5% sucrose, 5 mM DTT, 2 mM EDTA, and 2 mM caspase-3 substrate (Ac-DEVD-pNA; Sigma). Absorbance at 405 nm was then measured using an Enzyme Immuno Assay (EIA) reader (Infinite F200, Tecan, Durham, NC, USA).
Statistical analysis was carried out using SPSS version 24 (IBM Corp., Chiago,
IL, USA). Each experimental data point represents the analysis of at least 3
replicates and is presented as the mean
Previous studies have revealed that TIG1 expression is downregulated in skin cancer tissue [21]. Therefore, we further analyzed the impact of TIG1 expression on cell growth in melanoma cell lines. Results from Fig. 1A demonstrate a significant decrease in cell viability and induction of cell death when A2058 melanoma cells express TIG1 for 24–48 h compared to the control group. Furthermore, as shown in Fig. 1B, the activity of caspase-3 increased in cells that expressed TIG1. This suggests that the cell death induced by TIG1 is associated with its promotion of apoptosis. Similar results were observed in A375 cells, where TIG1 was shown to reduce cell viability and promote apoptotic cell death (Fig. 1C,D). These findings suggest that the expression of TIG1 in melanoma cells inhibits cell growth.
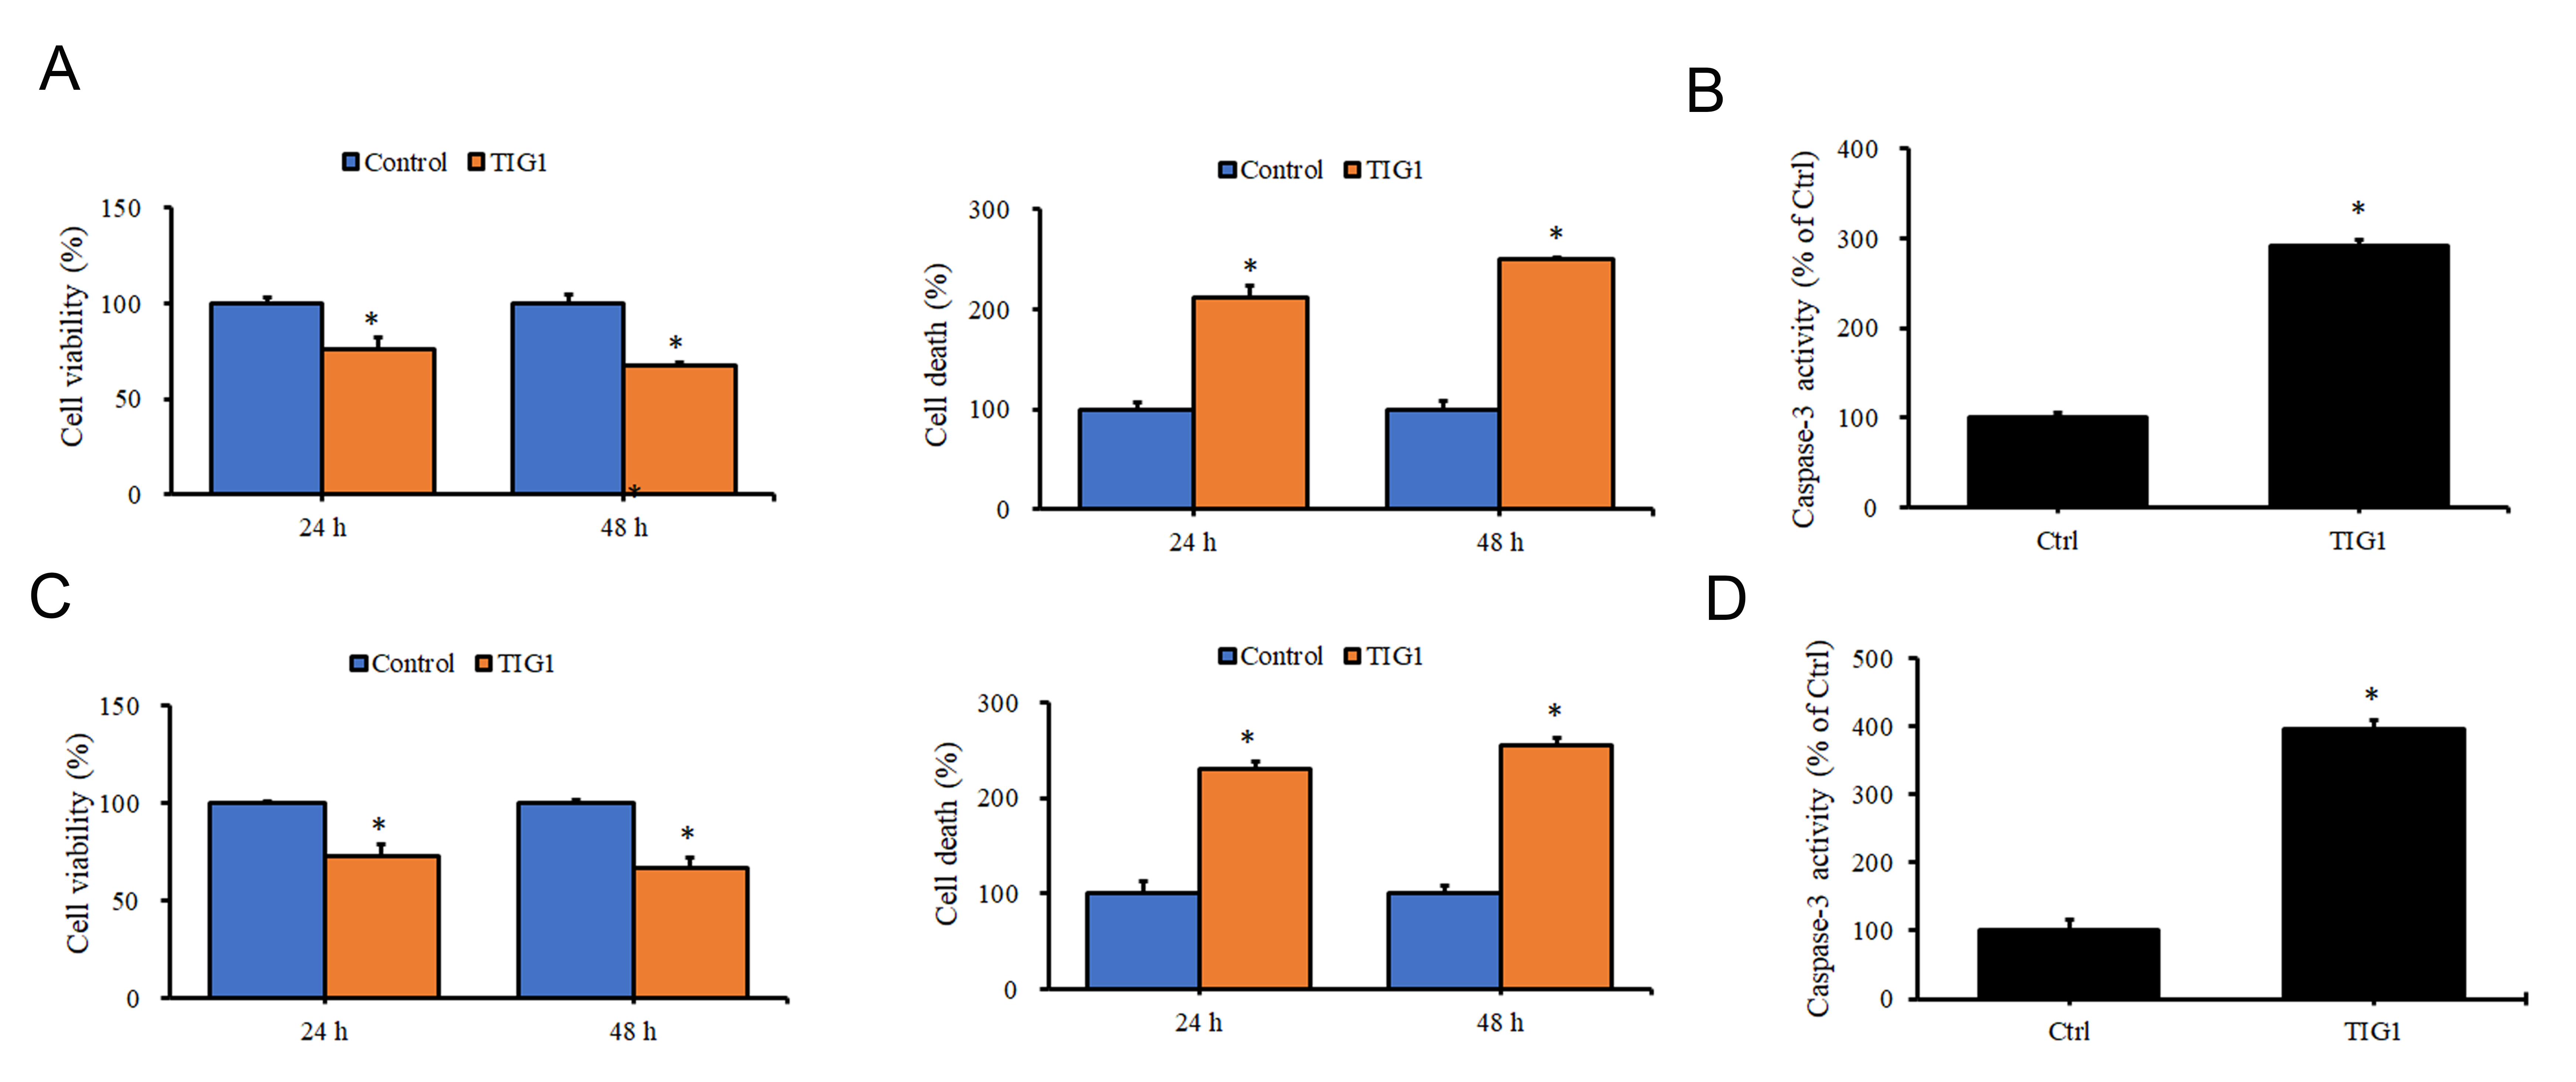 Fig. 1.
The effect of Tazarotene-induced gene 1 (TIG1) on cell viability
and death of A2058 and A375 cells. A2058 (A) or A375 (C) cells were transfected
with empty vector or TIG1-myc-his expression vector and expressed for 24–48 h.
Cell viability and death were measured by water-soluble tetrazolium 1 (WST-1) and
lactate dehydrogenase (LDH) release, respectively. Caspase-3 activity was
measured using a colorimetric substrate following the transfection of A2058 (B)
and A375 (D) cells with empty vector or with TIG1-myc-his expression vector for
24 h. *p
To further explore the mechanism by which TIG1 inhibits melanoma cell growth, RNA-seq was used to investigate the impact of TIG1 expression on gene expression in the A2058 cell line. Results from the Bland-Altman (MA) plot show a significant increase in the expression of TIG1 and SLFN11 compared to the control group (Fig. 2A). Additionally, the Volcano plot results revealed significant upregulation of 100 genes in TIG1-expressing cells, and downregulation of one gene (Fig. 2B). The top 50 genes showing the most significant changes in expression are displayed using a heatmap (Fig. 2C).
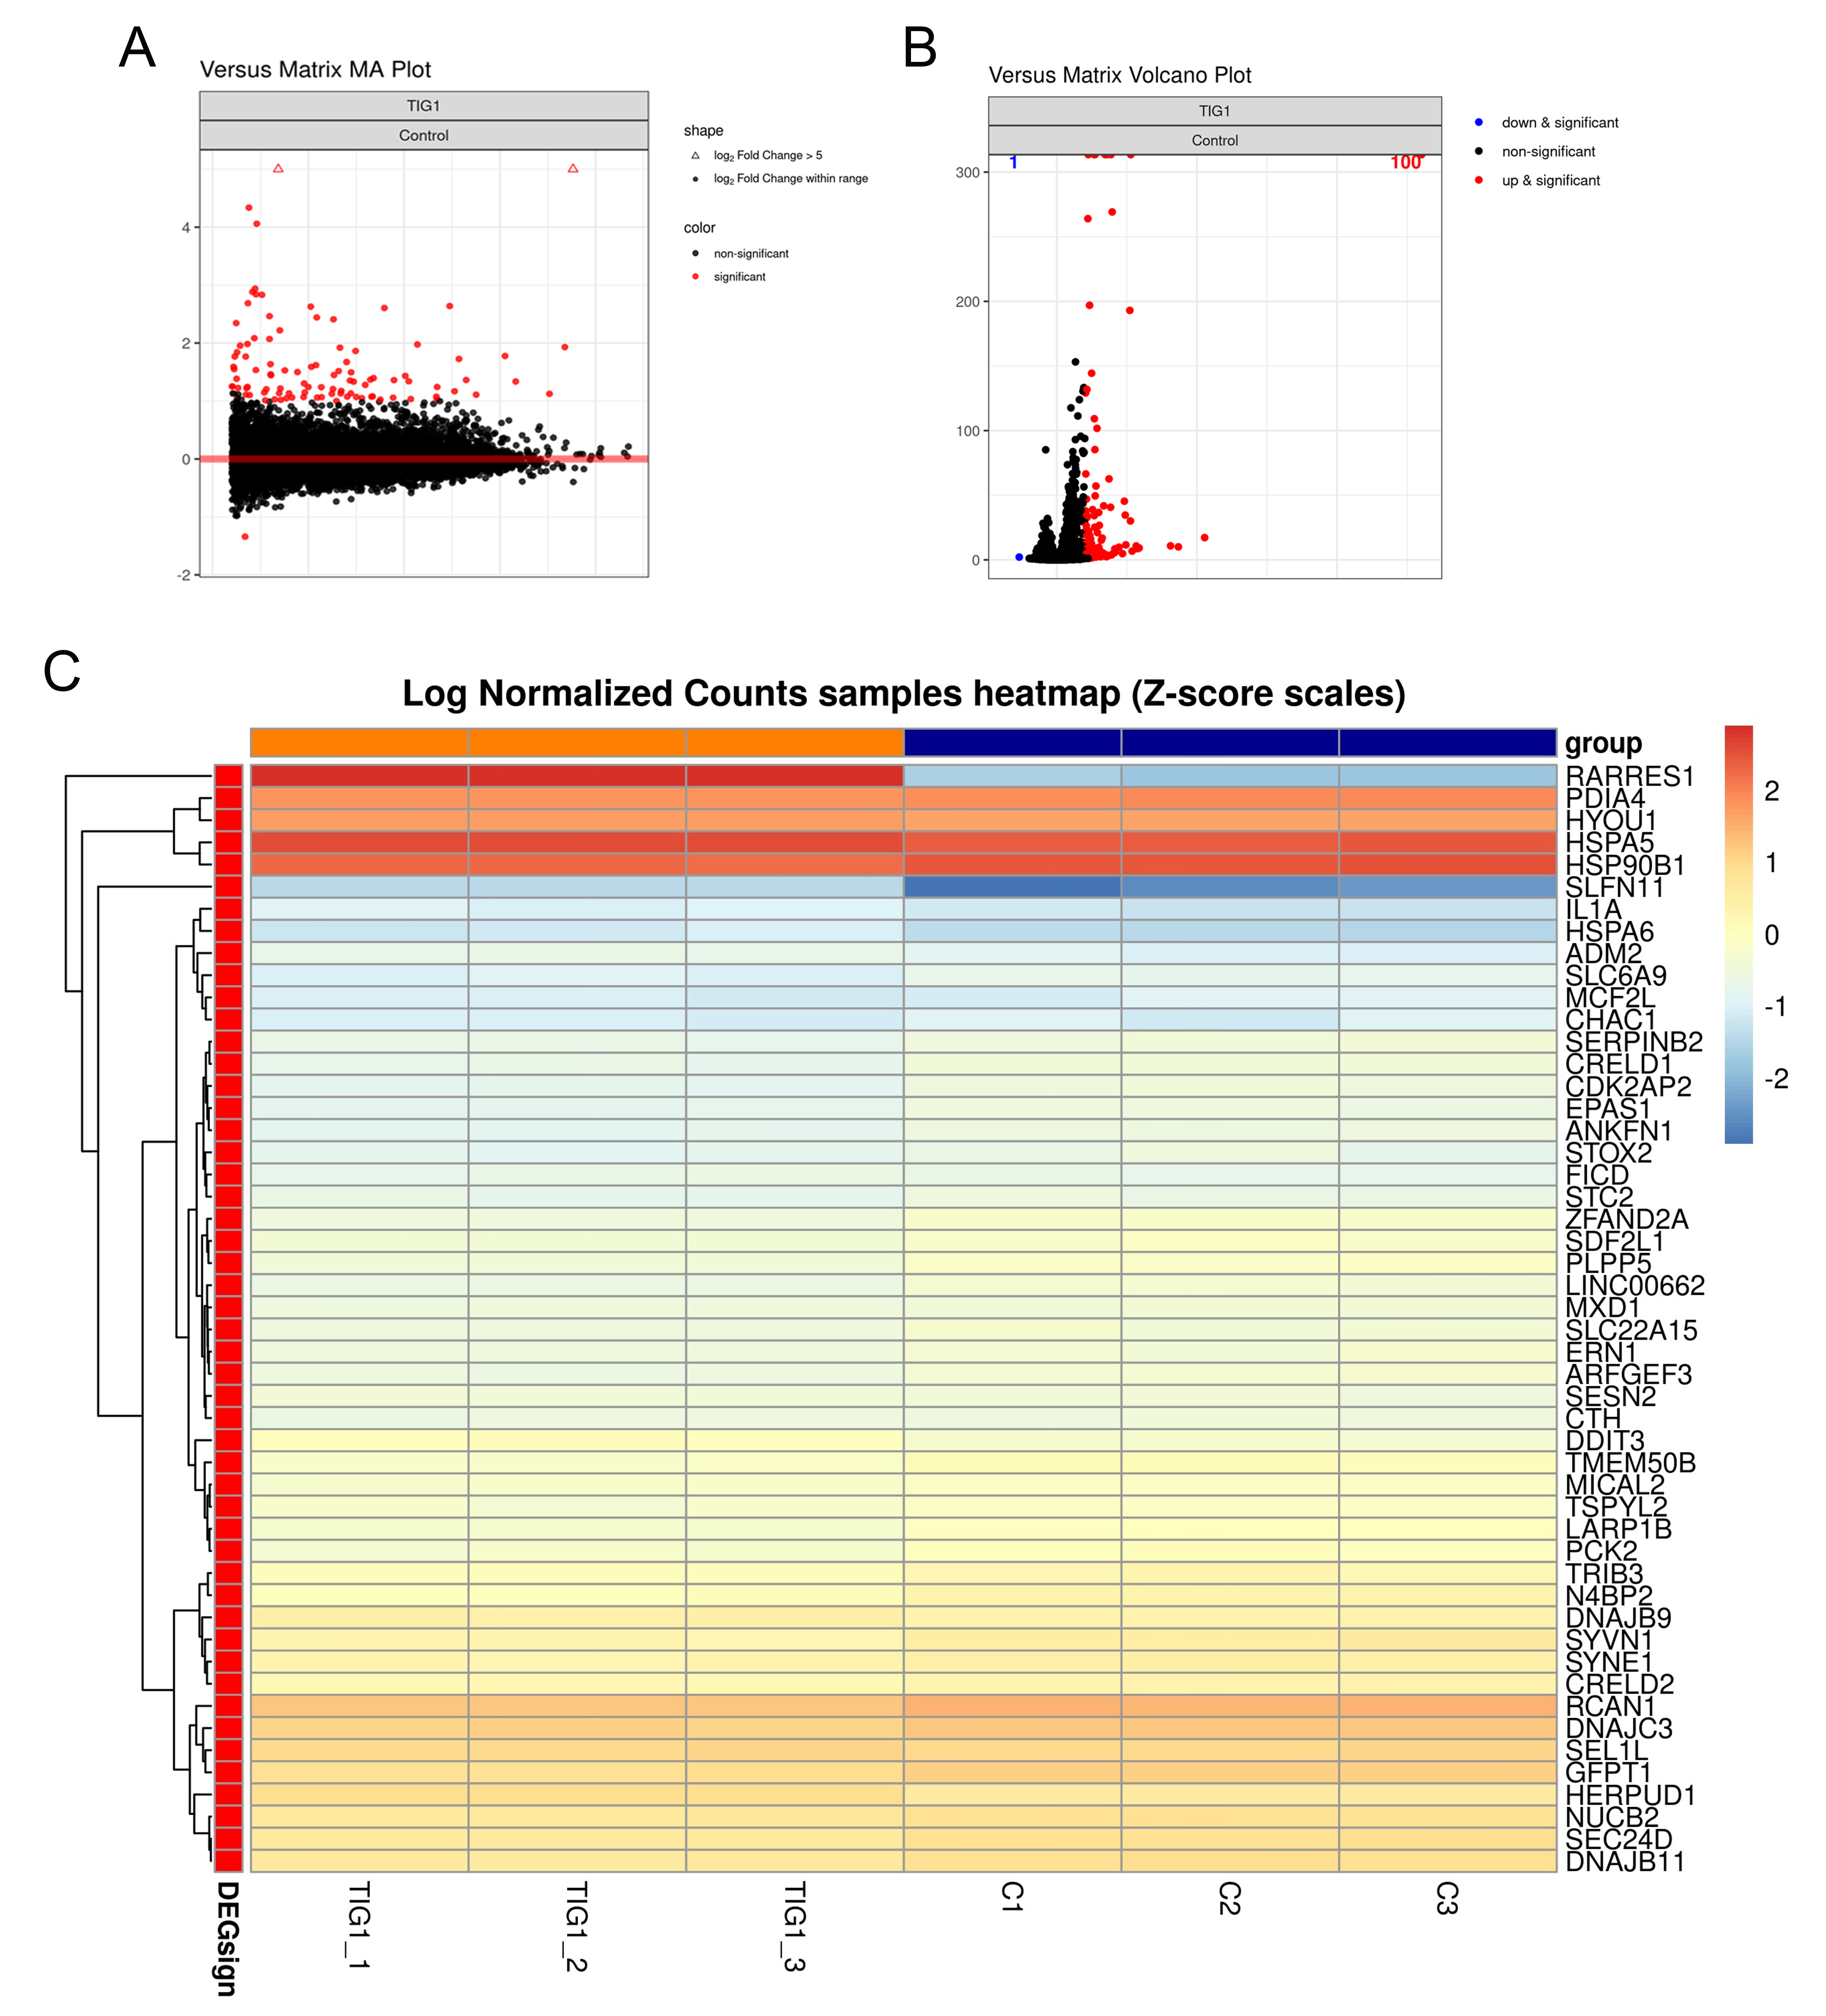 Fig. 2.
RNA-seq analysis of genes that were differentially regulated by TIG1 in A2058 cells. A2058 cells were transfected with empty vector or TIG1-myc-his expression vector and expressed for 24 h. RNA-seq was used to determine gene expression profiles, and the Bland-Altman (MA) (A) and Volcano (B) plots are shown. Red dots indicate significant differences between groups transfected with the empty vector or the TIG1-myc expression vector. Genes with a more than two-fold difference in expression ratio between cells transfected with empty vector or TIG1 are presented as a heatmap for the top 50 genes (C). RNA-seq, RNA-sequencing.
Analysis of the gene ontology (GO) enrichment plot indicated that most of the genes regulated by TIG1 are associated with the cellular ER stress response (Fig. 3A). Among the genes regulated by TIG1, 25 were found to be associated with ER stress response and unfolded protein response, including DERL3, HSPA5 (BIP), DDIT3 and HERPUD1 (Fig. 3B).
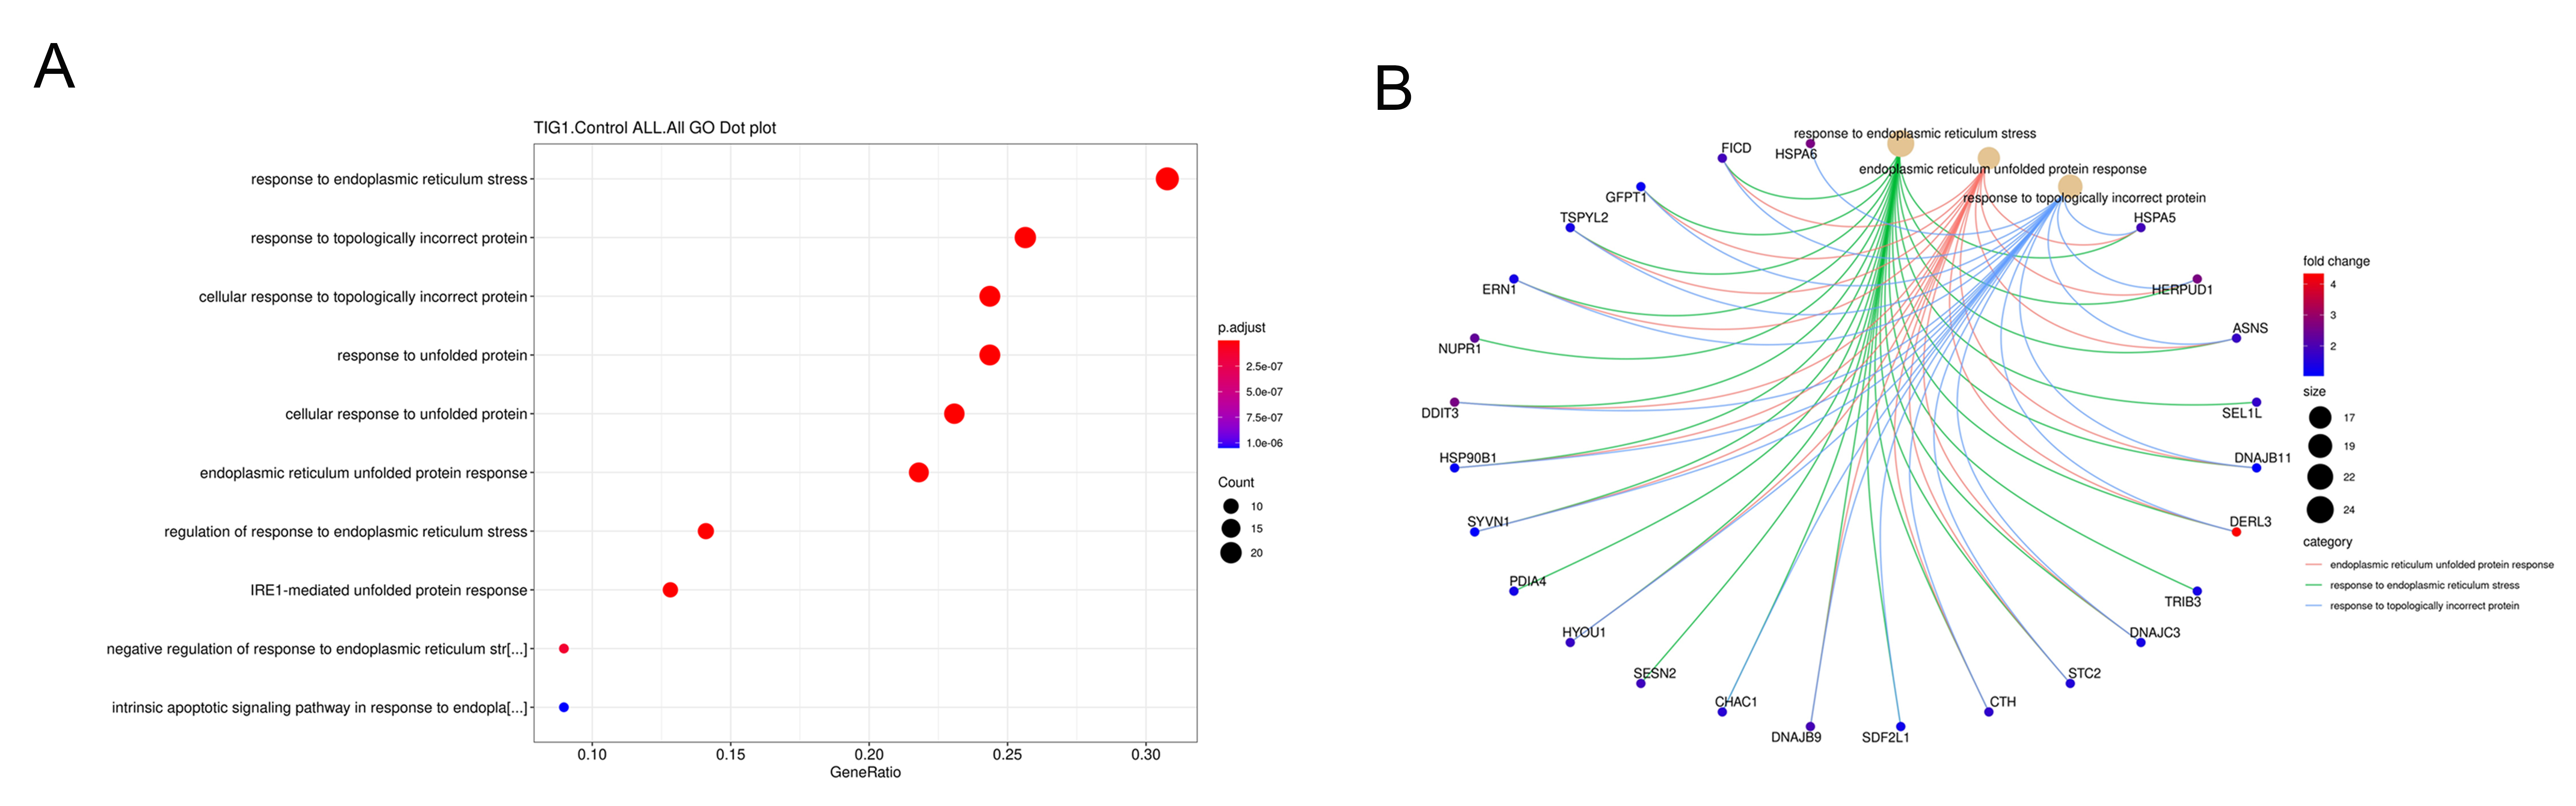 Fig. 3.
The category of gene ontology (GO) biological process affected by TIG1 and derived from the RNA-seq data. Following transfection of A2058 cells with TIG1 expression vector, significant gene expression changes were mapped to cellular pathways, as represented by GO enrichment dot plots (A). Genes associated with Endoplasmic Reticulum (ER) stress response and unfolded protein response are shown (B).
To validate the results of RNA-seq, mRNA from A2058 and A375 cells transfected with empty vector or TIG1 expression vector was analyzed for the expression of genes related to ER stress response using real-time PCR. As shown in Fig. 4A, the expression of genes including DERL3, SLFN11, HSPA6, DNAJB9, HERPUD1, DDIT3 and BIP was significantly upregulated after A2058 cells were transfected with the TIG1 expression vector for 24 h, as compared to the control group. Similar results were observed in A375 cells, with significant upregulation of these genes following transfection with the TIG1 expression vector (Fig. 4B). HERPUD1, BIP and DDIT3 in particular showed high expression levels and were therefore selected for further study. The expression of SLFN11 was significantly increased following transfection with the TIG1 expression vector compared to the control group, consistent with the fold-change observed in the RNA-seq analysis. However, SLFN11 was excluded from further investigation due to its low expression level.
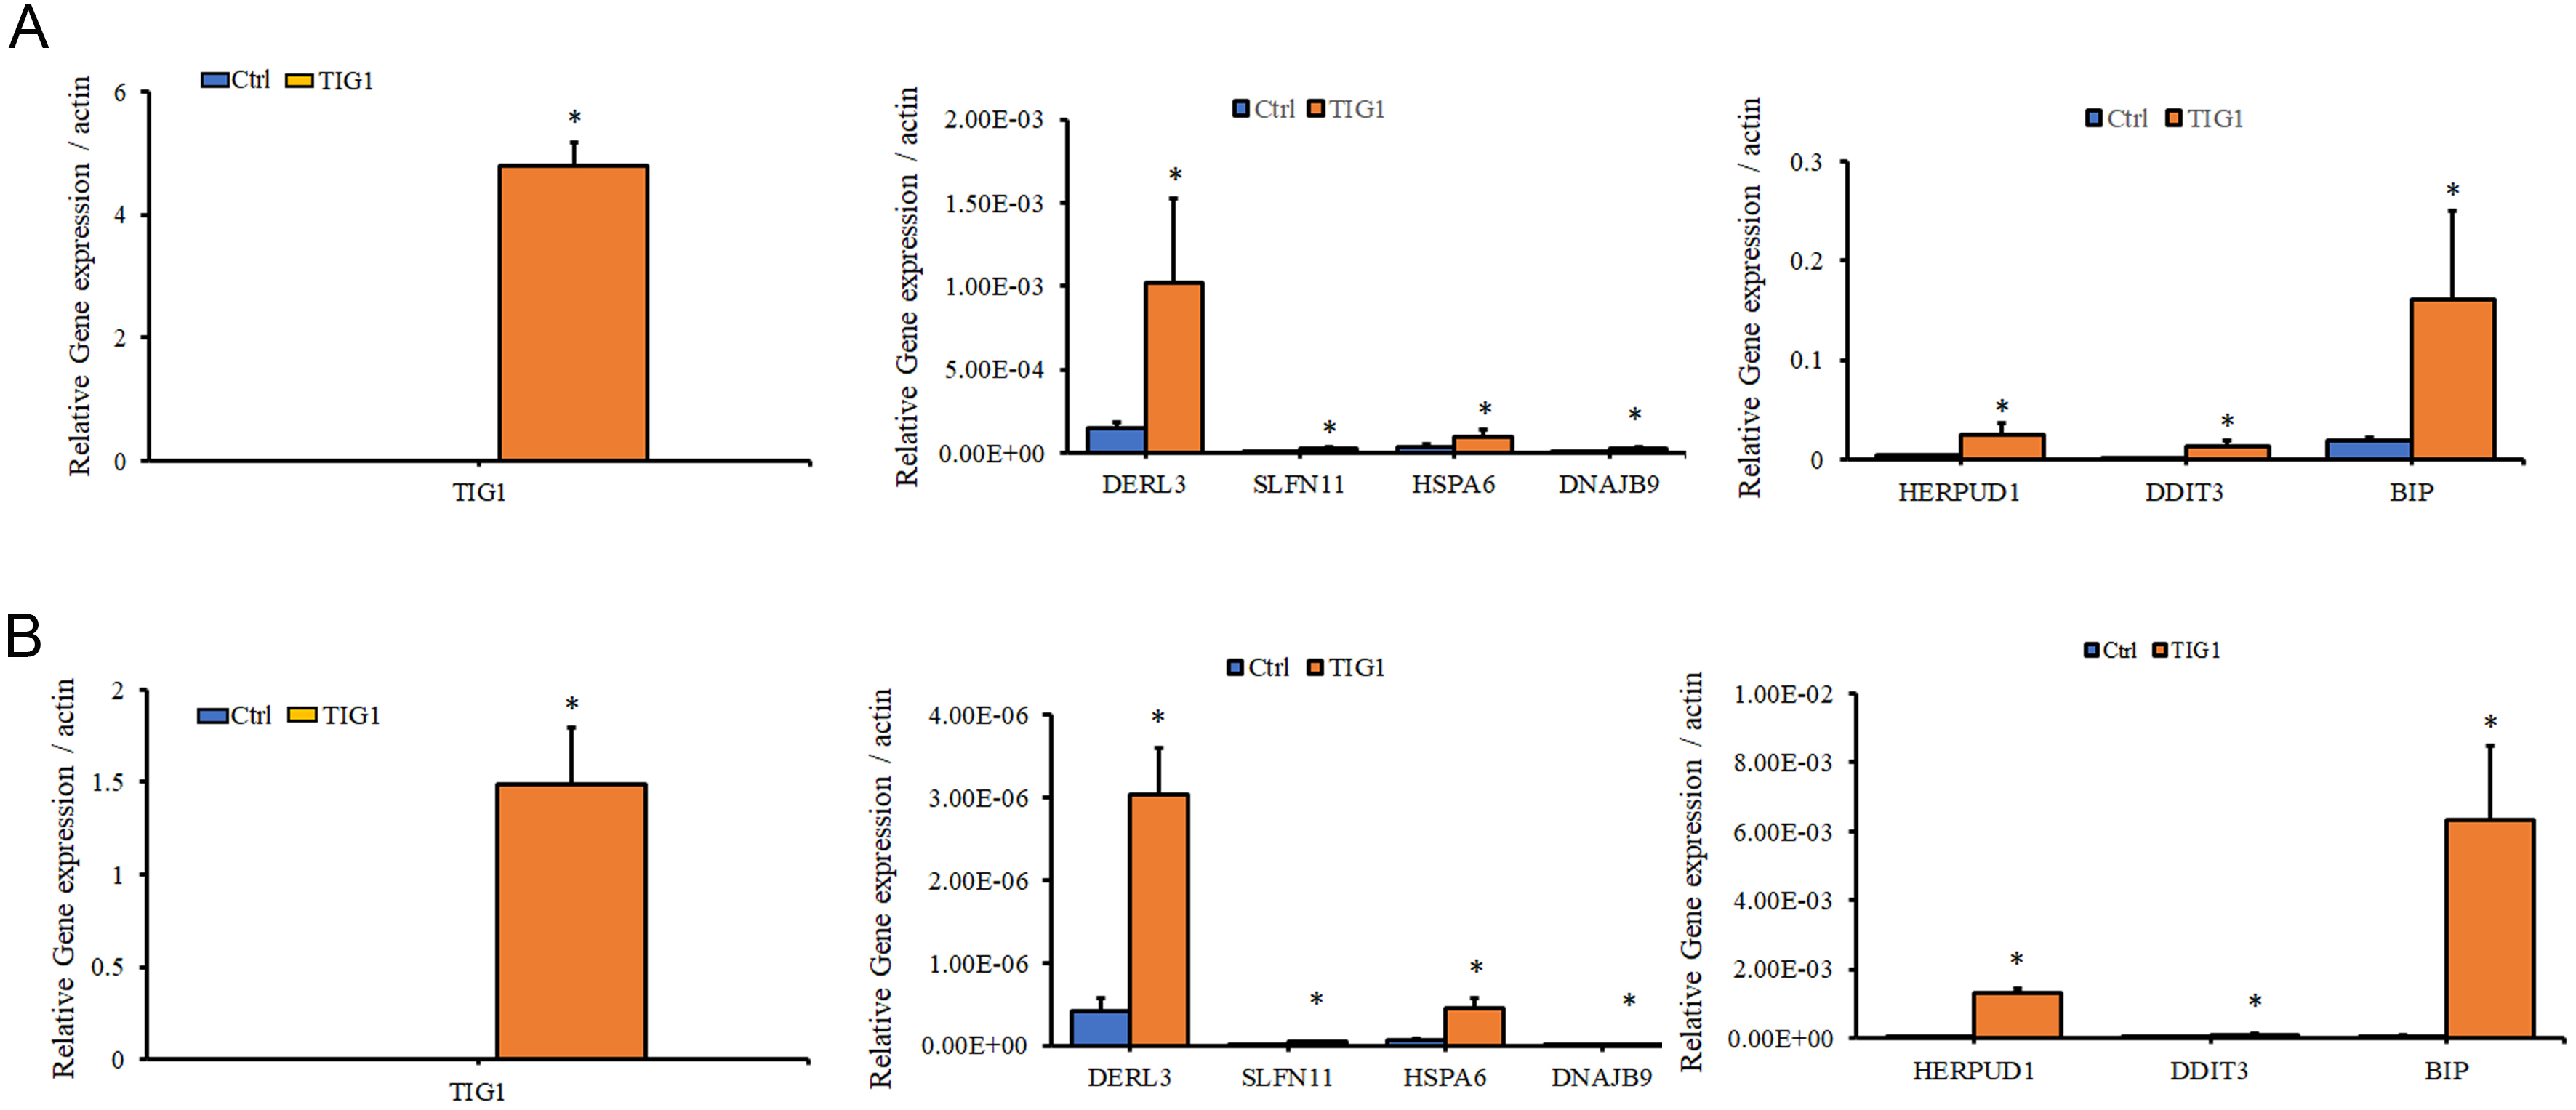 Fig. 4.
The effect of TIG1 on the expression of ER stress
response-related genes in A2058 and A375 cells. A2058 cells (A) and A375 cells
(B) were transfected with empty vector or with the TIG1-myc-his expression vector
and expressed for 24 h. Total RNA was extracted and relative levels of the
indicated mRNAs were measured by quantitative real-time polymerase chain reaction
(PCR) after normalization to the expression of
In addition to validating gene expression levels, we further analyzed whether the protein expression of these candidate genes also corresponds to the changes in mRNA expression. As shown in Fig. 5A, the protein levels of HERPUD1, BIP and DDIT3 in TIG1-expressing A2058 cells were increased compared to the control group. Similar trends in protein upregulation were observed in TIG1-expressing A375 cells (Fig. 5B). Increased expression of proteins related to the ER stress response is associated with the activation of intracellular caspase cascades [24, 25, 26]. As shown in Fig. 1B, the increased activity of caspase-3 in cells expressing TIG1 may be related to the upregulation of ER stress-related proteins induced by TIG1.
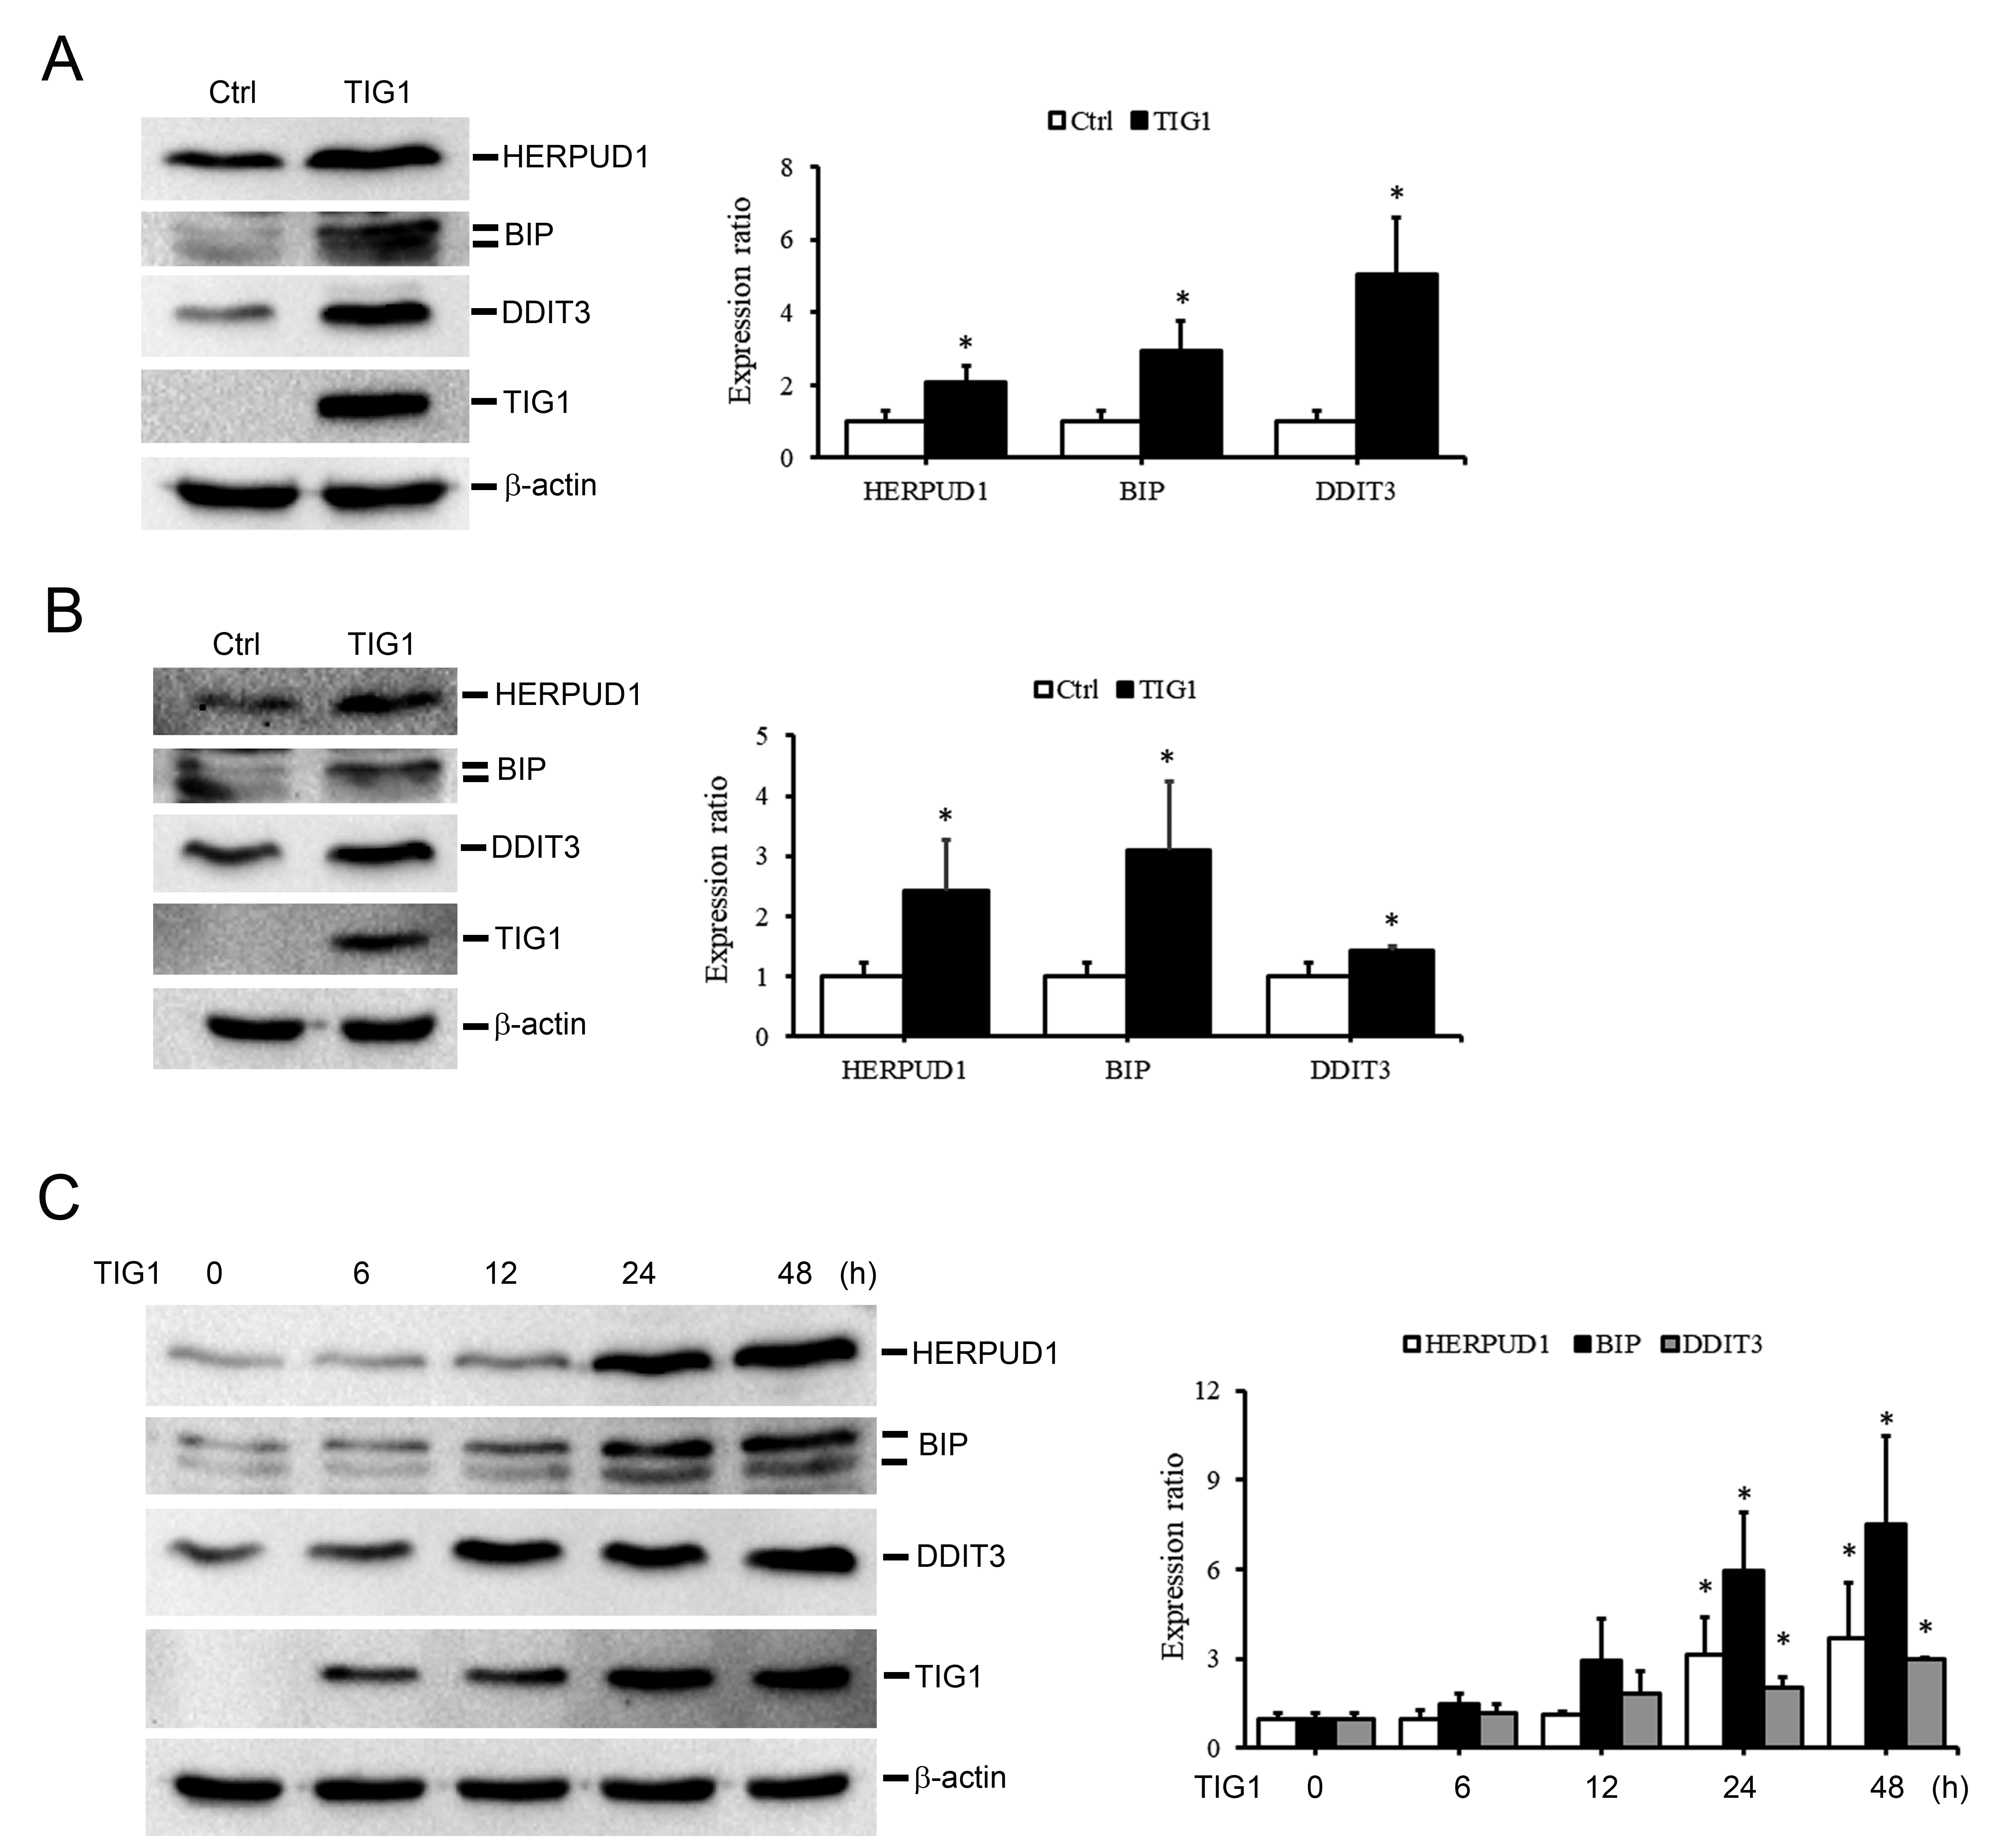 Fig. 5.
The effect of TIG1 on the expression of ER stress
response-related proteins in A2058 and A375 cells. A2058 cells (A,C) and A375
cells (B) were transfected with empty vector or TIG1-myc-his expression vector
and expressed for 24 h (A,B) or 6–48 h (C). Cell lysates were collected and the
protein expression levels of HERPUD1, BIP and DDIT3 were measured by
immunoblotting. The bar graphs quantify the indicated protein, with each sample
normalized to the level of
To clarify the relationship between TIG1 expression and ER stress-related proteins, cell extracts from different time points were collected after transfection with the TIG1 expression vector and the expression level of these proteins was evaluated. As shown in Fig. 5C, TIG1 protein expression began 6 h after transfection with TIG1 expression vector, whereas upregulation of HERPUD1, BIP and DDIT3 protein expression occurred 12 or 24 h after transfection. These observations indicate that ER stress-related proteins are indeed regulated by TIG1 protein.
We next investigated the relationship between TIG1 expression and the expression
of ER stress-related genes in skin cancer tissue using a melanoma cDNA array.
Results from this analysis showed a positive correlation between the expression
of TIG1 and that of HERPUD1, BIP and DDIT3 in melanoma
tissue (Fig. 6). We also conducted LOWESS assay for TIG1 and
HERPUD1, DDIT3, BIP, respectively. Pearson correlation
analysis was used to study the association between TIG1 and these genes. Overall,
significantly positive correlations
(p
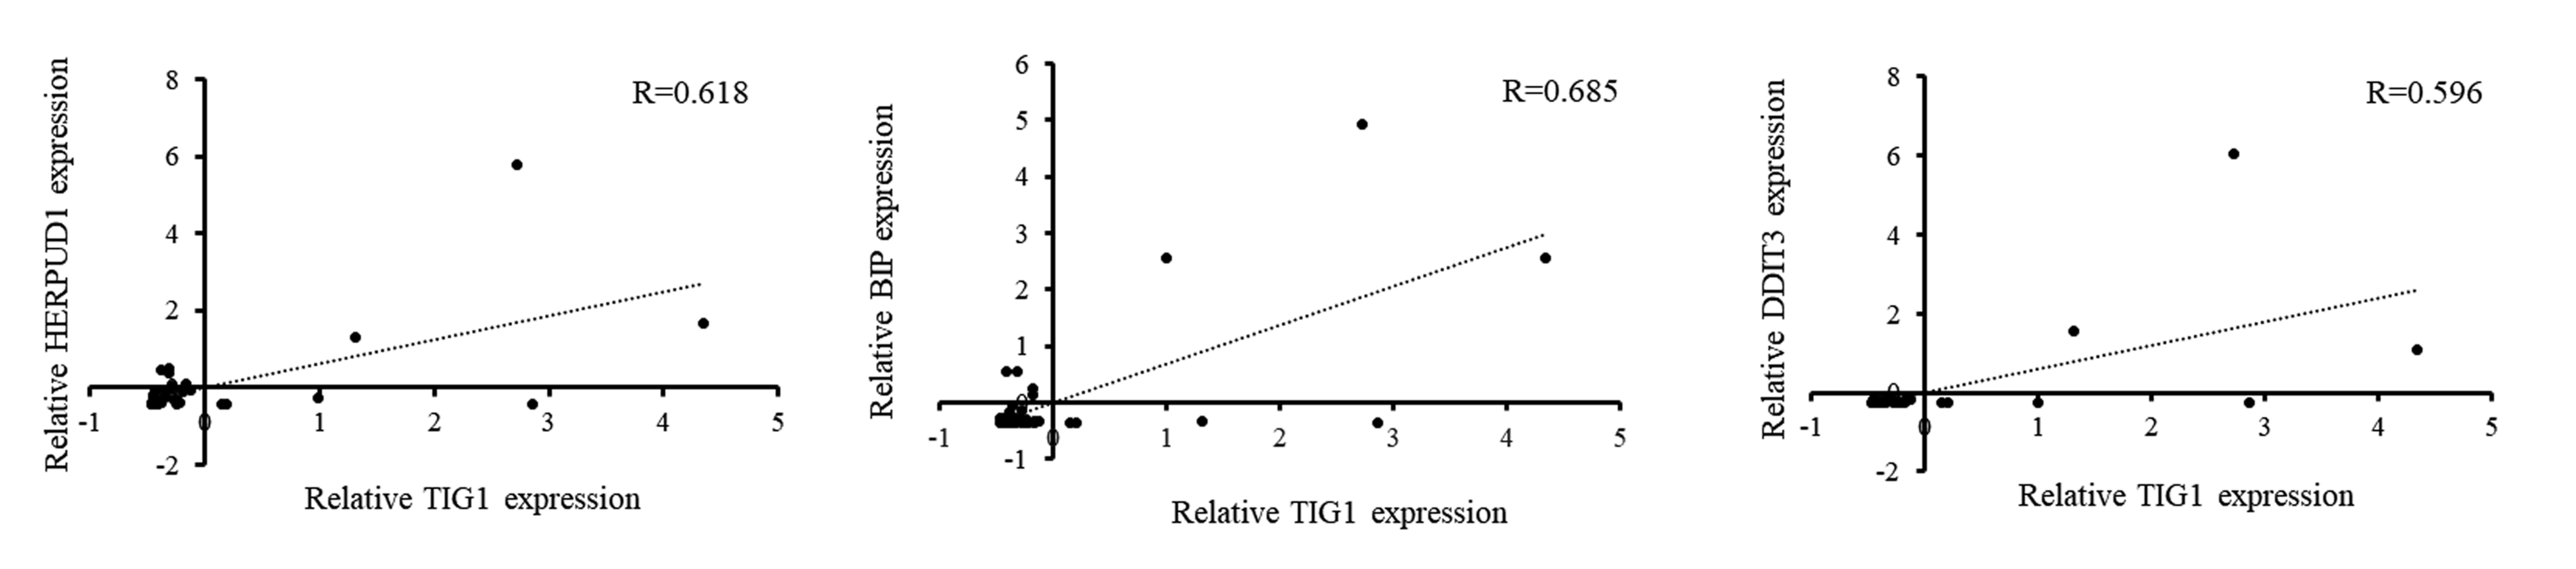 Fig. 6.
Correlation of TIG1 gene expression with HERPUD1, BIP and DDIT3 gene expression in melanoma tissues. Real-time PCR was used to determine the expression levels of TIG1, HERPUD1, BIP and DDIT3 in commercial melanoma cDNA tissue arrays (MERT301). Pearson correlation analysis was performed to correlate the expression of TIG1 with that of HERPUD1, BIP, and DDIT3.
We also investigated whether the commonly used chemical chaperone TUDCA could mitigate the upregulation of ER stress-related proteins induced by TIG1 [27, 28]. Treatment of A2058 cells with a high dose of TUDCA (500 µM) prevented the TIG1-induced upregulation of HERPUD1, BIP and DDIT3 (Fig. 7A). TUDCA exhibited a similar attenuating effect on the upregulation of ER stress-related proteins by TIG1 in A375 cells (Fig. 7B).
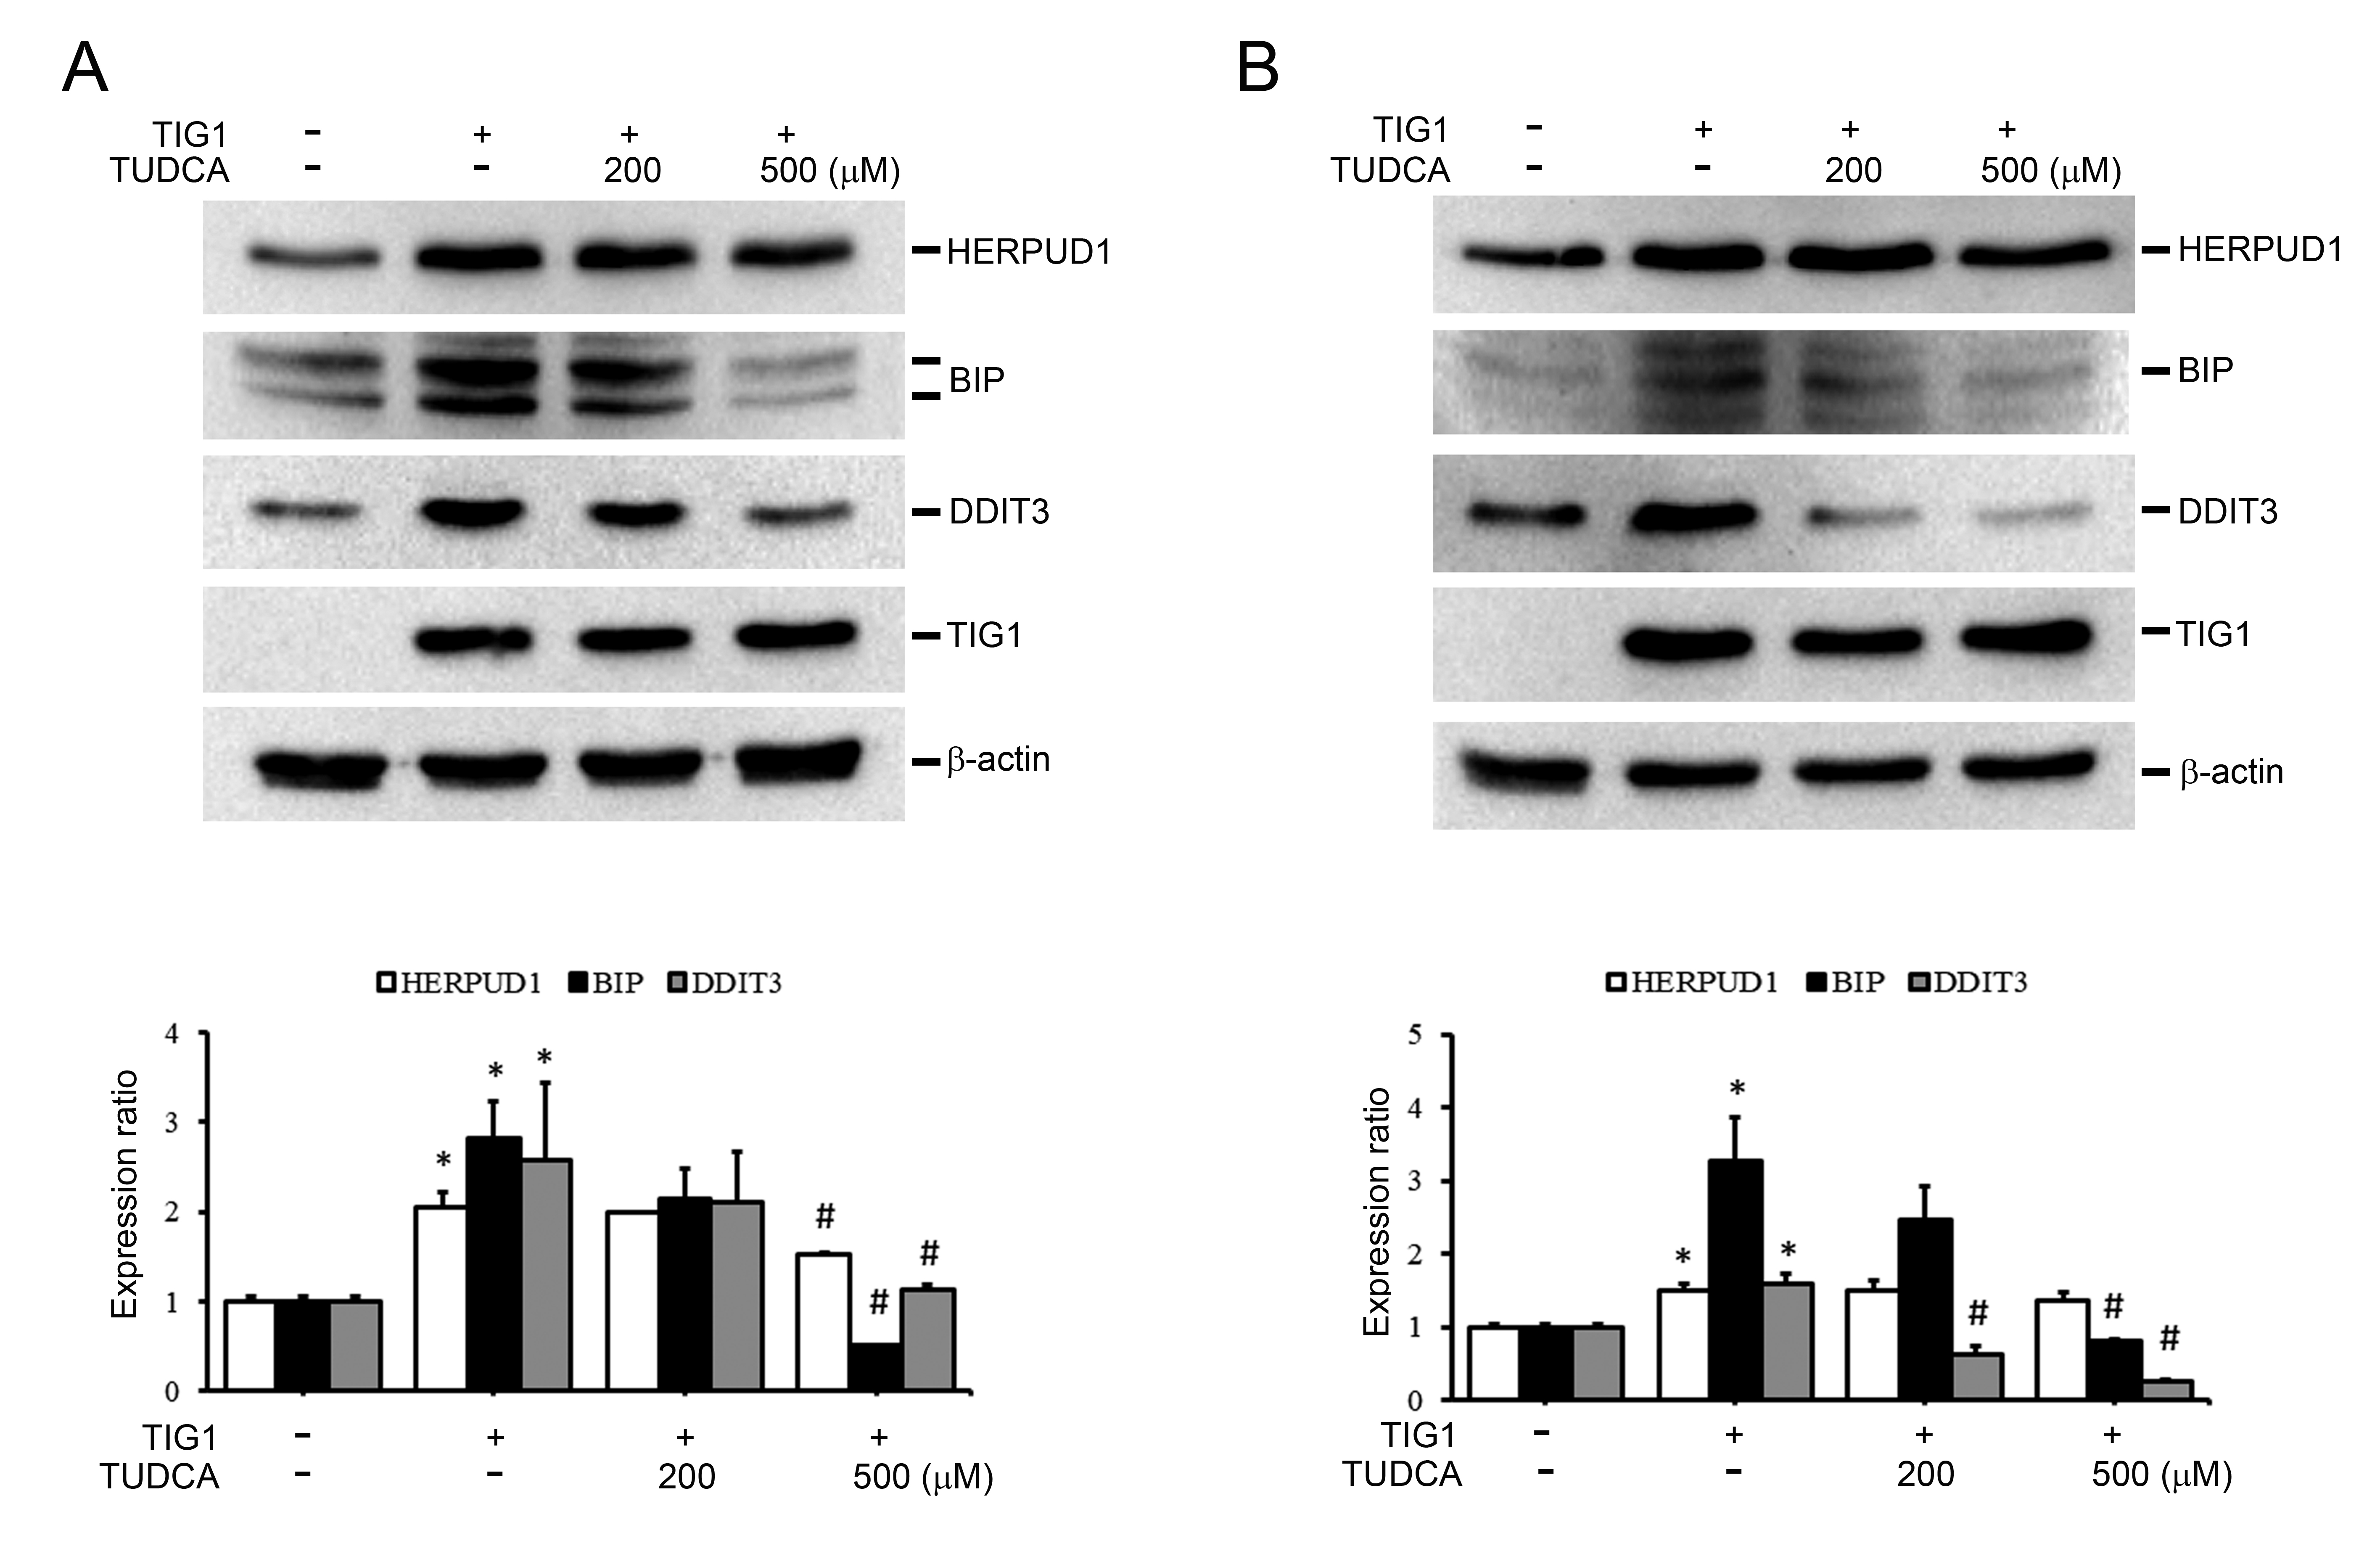 Fig. 7.
The effect of Tauroursodeoxycholic acid (TUDCA) on TIG1-induced ER stress response-related
protein expression in A2058 and A375 cells. A2058 cells (A) and A375 cells (B)
were transfected with empty vector or with TIG1-myc-his expression vector and
treated with different doses of TUDCA for 24 h. Cell lysates were then collected
and the protein levels of HERPUD1, BIP and DDIT3 were evaluated by immunoblotting
(A,B). The bar graphs quantify the indicated protein, with each sample normalized
to the level of
In addition to its effect on ER stress-related proteins, we also investigated whether TUDCA can alter the impact of TIG1 on cell growth. As shown in Fig. 8A, high-dose TUDCA treatment of A2058 cells attenuated the decrease in cell viability and increase in cell death caused by TIG1. Furthermore, TUDCA inhibited the increase in caspase-3 activity induced by TIG1 expression (Fig. 8B). The above results indicate that increased caspase-3 activity caused by TIG1 is associated with the TIG1 induction of ER stress-related proteins. Similar attenuation was observed in TUDCA-treated A375 cells (Fig. 8C,D). Taken together, these results indicate that TIG1 decreases the viability of melanoma cells and increases cell apoptotic death. These effects appear related to the upregulation of ER stress response proteins by TIG1.
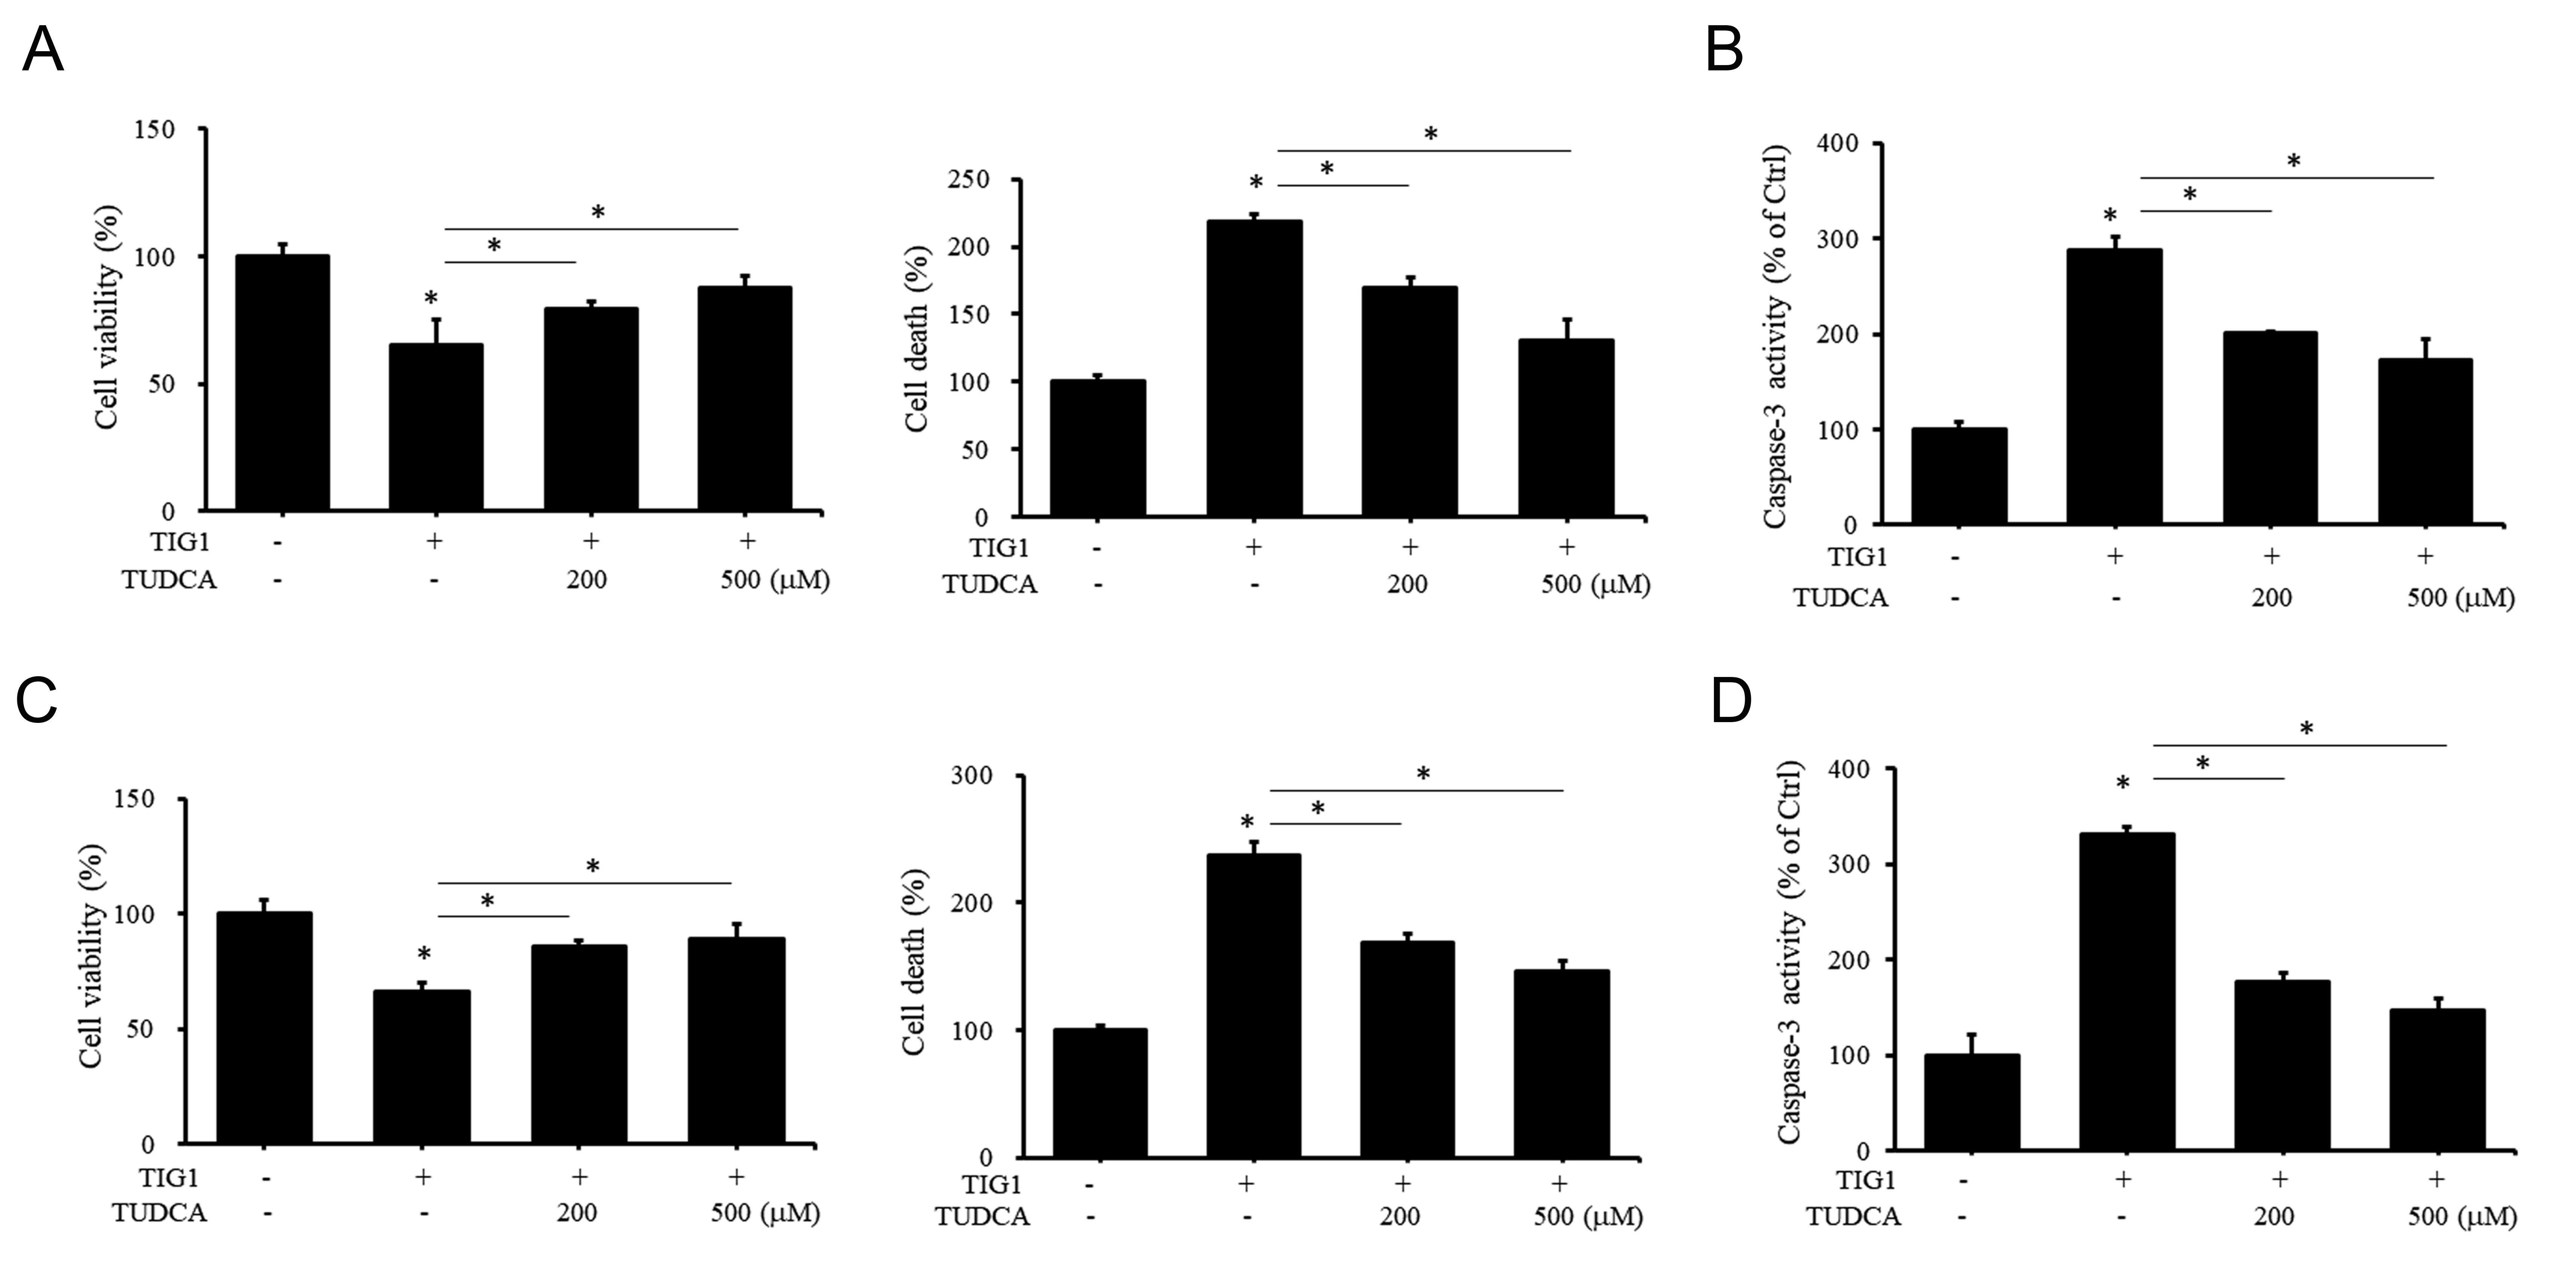 Fig. 8.
The effect of TUDCA on cell viability and death of A2058 and
A375 cells induced by TIG1. A2058 (A,B) or A375 (C,D) cells were transfected
with empty vector or with TIG1-myc-his expression vector and treated with
different doses of TUDCA for 24 h (B,D) or 48 h (A,C). Cell viability and death
were then measured by WST-1 and LDH release, respectively. Caspase-3 activity was
measured using a colorimetric substrate (B,D). *p
The TIG1 gene was first isolated following its induction in the skin by the vitamin A-derived compound tazarotene [29]. TIG1 is regulated by retinoic acid but lacks transcription factor ability. The TIG1 protein resides primarily in the cytoplasm and does not enter the nucleus [30], suggesting it regulates downstream gene expression through other cellular factors. Additionally, TUDCA attenuates the upregulation of ER stress response-related proteins by TIG1. This indicates that TIG1 indirectly induces ER stress response within cells. Further experimentation is needed to determine whether the upregulation of ER stress response-related genes by TIG1 occurs through the sequestration of transcription factors such as PKM2 [30], or via other signaling molecules leading to cellular autophagy, such as TMEM192 [1].
Previous studies in colorectal cancer (CRC) cells have shown that TIG1 can induce the expression of G protein-coupled receptor kinase 5 (GRK5) and inhibit prostaglandin E2-stimulated Wnt and cAMP signaling, thereby suppressing CRC cell growth [2, 31]. However, genes that are induced by TIG1 in CRC cells, such as WIG1, SUMO2, HOXB7 and EEF1E1, are not expressed in TIG1-expressing melanoma cells. Similarly, several ER stress response genes induced by TIG1 in melanoma cells are not present in TIG1-expressing CRC cells. Hence, TIG1 may have different functional roles in regulating various biological activities in different tissues. While TIG1 acts as a tumor suppressor gene to inhibit cancer cell growth in various tissues including the prostate [8], head, neck, nasopharyngeal tissue [32], and colon [7], it can promote tumor progression in inflammatory breast cancer [33]. Interestingly, TIG1 has been demonstrated to upregulate the expression of BIP/GRP78 and beclin, thereby inducing autophagy in prostate cancer cell lines [34]. Although this study investigated the effect of TIG1 on cellular autophagy, it does not exclude the possibility of TIG1 inducing ER stress, potentially influencing cell survival.
The role of ER stress response in cancer cell progression remains controversial. Generally, cancer cell formation occurs in environments of starvation or hypoxia, coupled with increased demand for protein secretion. This leads to sustained activation of ER stress and initiation of the unfolded protein response. The latter helps to fold proteins correctly, stabilize ER stress, and aid cell adaptation and survival [35, 36, 37]. However, if ER stress is not resolved in a timely manner, the unfolded protein response may promote cell death. Similarly, genetic mutations and metabolic dysregulation in melanoma cells can increase the demand for protein synthesis, disrupt protein homeostasis, activate ER stress, and correlate with melanoma chemoresistance [38]. Additionally, BRAF gene mutations in melanoma induce ER stress through different mechanisms such as the promotion of cell autophagy, resistance to apoptosis, or drug resistance [39]. Overall, these findings suggest that ER stress plays a crucial role in the progression of melanoma caused by genetic mutations, and is therefore a candidate target for melanoma treatment [38].
ER stress plays a dual role in determining cell fate. The activation of
different ER stress network branches can have various effects on cell fate. The
unfolded protein response can be divided into three important signaling branches:
protein kinase RNA-activated-like ER kinase (PERK), inositol-requiring enzyme
1
In this study, expression of the tumor suppressor gene TIG1 in melanoma cells was shown to upregulate the expression of ER stress response-related genes. Additionally, the expression of TIG1 in melanoma tissue was found to correlate positively with the expression of ER stress response-related genes. Treatment with the chemical chaperone TUDCA attenuated the upregulation of ER stress response-related genes by TIG1. Moreover, TUDCA inhibited TIG1-induced cell apoptosis, demonstrating the importance of ER stress response in TIG1-induced apoptosis in melanoma cells.
BIP, binding immunoglobulin protein; DDIT3, DNA damage-inducible transcript 3; DNAJB9, DnaJ homolog subfamily B member 9; ER, endoplasmic reticulum; HERPUD1, homocysteine-responsive endoplasmic reticulum-resident ubiquitin-like domain member 1; HSPA6, heat shock protein family A member 6; LOWESS, locally weighted scatter plot smoothing; MMP, matrix metalloproteinase; RARRES1, retinoic acid receptor responder protein 1; SLFN11, schlafen family member 11; TIG1, tazarotene-induced gene 1; TUDCA, tauroursodeoxycholic acid.
All data generated or analyzed during this study are included in the article, further inquiries can be directed to the corresponding author.
CHW, LKW, and FMT designed the research study. CHW performed the research. IST, LKW, and CCW did the bio-statistical analysis and analyzed the data. MLC, CYK, and RYS provided help and advice on methodology and supervision. CHW and FMT wrote the manuscript. All authors contributed to editorial changes in the manuscript. All authors read and approved the final manuscript. All authors have participated sufficiently in the work and agreed to be accountable for all aspects of the work.
Not applicable.
The authors thank the Core Laboratory of Taipei Tzu Chi Hospital for support.
This study was supported by grants by the Taipei Tzu Chi Hospital through grants from the Buddhist Tzu Chi Medical Foundation (Research project numbers: TCRD-TPE-111-23 (3/3) and TCRD-TPE-113-20).
Given their role as Guest Editors, Chan-Yen Kuo and I-Shiang Tzeng had no involvement in the peer review of this article and have no access to information regarding its peer review. Full responsibility for the editorial process for this article was delegated to Taeg Kyu Kwon and Natascia Tiso. The authors declare no conflict of interest.
References
Publisher’s Note: IMR Press stays neutral with regard to jurisdictional claims in published maps and institutional affiliations.