


 , Sung-Gon Kim 1,2,*
 , Ji-Hoon Kim 1,2, Hyeon-Kyeong Kim 3, Yeon-Sue Kim 1
1 Department of Psychiatry, Pusan National University Yangsan Hospital, 50612 Yangsan, Republic of Korea
2 Department of Psychiatry, Pusan National University School of Medicine, 46639 Yangsan, Republic of Korea
3 Medical Research Institute, Pusan National University, 50612 Yangsan, Republic of Korea
Abstract
Alcohol use disorder (AUD) is a common disease with a high economic cost. The glutamate cell signaling pathway associated with alcohol has been reported to be one of the main pathologies of AUD. Previous studies have suggested that FYN, which is known to control NMDA glutamate receptor function through phosphorylation, might be associated with AUD.
The present study included 354 subjects in the alcohol-dependent group and 139 subjects in the control group. The alcohol-dependent group was recruited from five university hospitals and a psychiatric hospital, and the control group was recruited from people who visited the university hospital for routine medical checkups in Korea. FYN gene single nucleotide polymorphism (SNPs) were selected based on SNP databases and previous studies of the FYN gene. Ten SNPs were genotyped using polymerase chain reaction-restriction fragment length polymorphism techniques.
GG genotypes and G allele frequencies of rs1058134 in male AUD patients were significantly lower than in controls (p = 0.003). AA genotypes and A allele frequencies of rs12191154 in female AUD patients were significantly lower than in controls (p < 0.001, p = 0.003). In female AUD patients, AA genotypes and A allele frequencies of rs9387025 were significantly higher than in controls (p = 0.003).
These findings suggest that the FYN gene may be a candidate gene for AUD. This may help for the planning of further studies to determine the function of each SNP and the exact relationship between the FYN gene and AUD.
Keywords
- FYN
- gender differences
- gene polymorphism
- alcohol dependence
• There were significant differences in FYN genotype and allele frequencies between the alcohol-dependent group and the normal control group.
• There were also significant differences in the genotype and allele frequencies of different SNPs between males and females.
• The FYN gene might be related to the occurrence of alcohol use disorder.
• This study suggests that consideration of sex differences is necessary when studying FYN gene polymorphisms.
Alcohol use disorder is caused by a variety of neurobiological, social, psychological, and environmental factors [1, 2]. Of these, glutamate and related neurotransmitters are considered to be major causes of alcohol use disorders. They are not only related to changes in the brain after alcohol consumption, but also related to brain damage caused by continuous alcohol use [3, 4]. Terranova et al. [5] suggested an association between polymorphism in the GAD67 (glutamate decarboxylase 67) gene and alcohol dependence in Italian men. Xia et al. [6] have found that polymorphism in the metabolite glutamate receptor GRM3 (glutamate receptor 3) gene is associated with the occurrence of alcohol dependence. Kranzler et al. [7] have also demonstrated that polymorphism in GRIK1 (GluR5 Kainate Receptor Subunit gene), a kainate receptor in the glutamate ion receptor family, contributes to the risk of alcohol dependence.
The N-methyl-D-aspartate (NMDA) receptor is an ionic glutamate receptor known to play an essential role in synaptic plasticity and learning memory [8, 9]. Previous studies have shown that the NMDA glutamate receptor is a major target when alcohol acts on the brain and that it is associated with alcohol tolerance, withdrawal, and sensitivity [10, 11]. The function of the NMDA glutamate receptor is balanced by the activities of serine/threonine kinase and phosphatase, and tyrosine kinase and phosphatase [12, 13]. FYN tyrosine kinase, a member of the Src family of kinases, is known to control NMDA glutamate receptor function through phosphorylation [14]. In particular, phosphorylation of NR2B (NMDA receptor 2b), a subunit of the NMDA receptor, upregulates the function of the ion channel [15] and reduces the inhibitory effect of ethanol, leading to differences in sensitivity to ethanol. According to Miyakawa et al. [16], FYN knockout mice show increased sensitivity to ethanol and decreased acute resistance response to ethanol compared with control mice. In addition, through a study using FYN kinase null mutant mice, Boehm et al. [17] have suggested that FYN kinase can regulate acute tolerance to ethanol and mediate the anti-anxiety effect and negative reinforcement of ethanol.
A study of FYN gene polymorphism in humans by Schumann et al. [18] has reported that T137346C (C risk allele, rs45490695), a single nucleotide polymorphism (SNP) in FYN, is associated with alcohol dependence in Spanish men. Pastor et al. [19] have also found that the same SNP can increase the risk of developing alcohol dependence compared with alcohol abuse in Spanish men. However, a study by Ishiguro et al. [20] on Japanese did not find a significant association between this SNP and alcohol dependence. These studies, however, only compared an alcohol-dependent group with a normal control group without comparing subjects by sex.
Previous studies have suggested that the mechanism for the occurrence of alcohol use disorder may differ depending on sex and that there might be genetic differences according to sex for the occurrence of alcohol use disorder [21, 22, 23]. In other words, it is widely known that alcohol metabolism differs between men and women and that these difference are affected by genetic factors [22, 24]. Previous studies have also shown that the risk for alcohol use disorder may differ between men and women [25, 26]. Prescott et al. [27] have also suggested that genetic factors play an important role in the development of alcohol use disorder and that genetic vulnerability is not the same in men and women. Taken together, it seems that the mechanism of occurrence of alcohol use disorder and the risk for alcohol use disorder may differ according to sex.
Based on results of previous studies, glutamate is an important neurotransmitter for the occurrence and maintenance of alcohol use disorder. The NMDA glutamate receptor is regulated by FYN tyrosine kinase. FYN kinase is sensitive to ethanol and associated with the development of an acute tolerance reaction to ethanol, which is thought to be directly or indirectly related to the development of alcohol use disorder. This suggests that alcohol use disorder might be associated with FYN tyrosine kinase gene polymorphism. However, there have been only three studies on genetic polymorphism of the FYN tyrosine kinase in humans (one in Caucasians, one in Spaniards, and one in Japanese) regardless of sex. Such studies on Koreans have not been reported yet. There are no such studies considering sex differences. Thus, the aim of this study was to investigate differences in the frequencies of FYN gene SNPs between alcohol-dependent patients and normal controls according to sex.
The patient group (alcohol dependence (AD) group) were diagnosed with alcohol dependence by psychiatrists using the Diagnostic and Statistical Manual of Mental Disorders, Fourth Edition (DSM-IV). Those who had other major psychiatric disorders (e.g., schizophrenia, affective disorder) or another substance use disorder (except nicotine use disorder or caffeine use disorder) were excluded. The alcohol dependence group comprised 354 subjects (279 males and 75 females). The AD group was recruited from seven university hospitals and a psychiatric hospital in Pusan and KyungNam in Korea from 1997 to 2017.
The normal control group were individuals who attended the university hospital for a routine health check-up in Pusan from 1995 to 2000. We defined the normal control group according to the method suggested by Town et al. [28]. We defined the normal control group as subjects who were exposed to sufficient alcohol but did not develop pathological drinking habits. We included subjects who were aged 50 years or older and consumed less than five standard drinks (SD) per month, which was considered sufficient exposure to alcohol. We excluded those who had never drunk alcohol. The normal control group comprised 139 subjects (males 80 and females 59). We collected the venous blood of subjects who fasted for more than 12 hours.
An EZNA Blood DNA kit (Omega Biotech Int., Norcross, GA, USA, SKU#D2492-03) was used to extract genomic DNA from blood samples. One milliliter of cell lysis buffer (320 mM sucrose, 1% (v/v) Triton X-100, 5 mM MgCl2, 10 mM Tris-HCl; pH 7.6) was added to 500 µL whole blood. The mixture was vortexed and centrifuged at 10,000 rpm for 1 minute. The pellet was washed with 250 µL phosphate-buffered saline (PBS) and vortex-mixed with 25 µL proteinase (20 mg/mL) and 250 µL buffer BL. The mixture was incubated at 70 °C for 10 minutes and vortex-mixed several times. Isopropanol (260 µL) was then added to the lysate and mixed. The lysate was transferred to a HiBind DNA Spin column and centrifuged at 10,000 rpm for 1 minute. The collected fluid was discarded and the column was washed twice with 750 µL 80% ethanol, followed by centrifugation at 13,000 rpm for 3 minutes and air dried. Finally, genomic DNA was eluted with 200 µL elution buffer at 70 °C from the column. The quantity and purity of extracted genomic DNA were estimated by resolving on a 1% agarose gel using EtBr staining. DNA samples were then stored at –20 °C.
FYN SNPs were identified from searching the NCBI SNP database and previous studies about the FYN gene which showed significant SNP frequencies in Asians [18, 19, 20]. Ten SNPs (rs559963242, rs376330544, rs12191154, rs9387025, rs3730353, rs752601385, rs1058134, rs11967460, rs9481198, and rs62413757) were selected. These SNPs were able to be typed using the polymerase chain reaction-restriction fragment length polymorphism (PCR-RFLP) technique. Table 1 shows the locations of these SNPs within the FYN gene. All were located in introns. The PCR reactions consisted of 1.5 mM MgCl2, 200 µM dNTP (dATP, dCTP, dGTP, and dTTP), and 0.4 µM of reverse and forward primers for each SNP (Table 2). The amplification products had the following sizes: rs559963242 and rs376330544, 203 bp; rs12191154 and rs9387025, 403 bp; rs3730353 and rs752601385, 463 bp; rs1058134, 280 bp; rs11967460, 306 bp; rs9481198, 300 bp; and rs62413757, 232 bp. The amplified FYN gene products were then subjected to the RFLP (restriction fragment length polymorphism) technique. The amount of missing data was small and did not affect the main results of this study. The rs1058134 (280 bp) amplified product was incubated with 2.5 units of PstI endonuclease at 37 °C for 3 hours. The band patterns were assessed after 2.5% agarose gel electrophoresis at 200 V for 2 hours. rs1058134 genotyping products were interpreted as follows: 117 bp and 107 bp, GG; 224 bp, 117 bp, and 107 bp, GT; and 224 bp, TT. We analyzed other SNPs using the same technique. Figs. 1,2,3 show examples of the electrophoresis patterns for three SNPs.
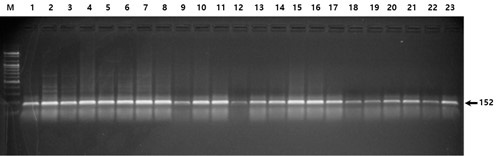 Fig. 1.
 Electrophoresis of the PCR products digested with the restriction enzyme DdeI (rs559963242). All lanes indicate homozygosity for the more common allele (TT); heterozygosity (TG) and homozygosity for the less common allele (GG) are not shown.
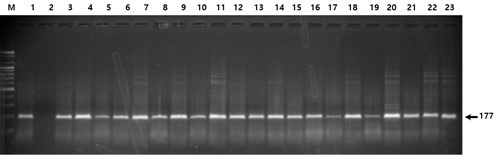 Fig. 2.
 Electrophoresis of the PCR products digested with the restriction enzyme BsmAI (rs376330544). All lanes indicate homozygosity for the more common allele (CC); heterozygosity (CT) and homozygosity for the less common allele (TT) are not shown.
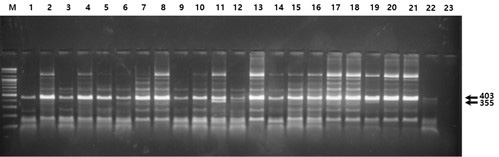 Fig. 3.
 Electrophoresis of the PCR products digested with the restriction enzyme Tsp45I (rs12191154). All lanes except lanes 3, 10, 11, 12, 19, and 22 indicate homozygosity for the more common allele (AA); lanes 3, 10, 11, 12, 19, and 22 indicate heterozygosity (AG); homozygosity for the less common allele (GG) is not shown.
| SNP ID | Chromosome position (GRCh38) | Region | Alleles |
| rs559963242 | 111661517 | 3′ Prime UTR | T |
| rs376330544 | 111661540 | 3′ Prime UTR | C |
| rs12191154 | 111663112 | Intron | A |
| rs9387025 | 111663197 | Intron | G |
| rs3730353 | 111674463 | Intron | A |
| rs752601385 | 111674583 | Exon | C |
| rs1058134 | 111700152 | Exon | G |
| rs11967460 | 111794545 | Intron | G |
| rs9481198 | 111871592 | Intron | T |
| rs62413757 | 111872133 | Intron | G |
GRCh38, Genome Reference Consortium Human Genome build 38; SNP, single nucleotide polymorphism; UTR, untranslated region.
| SNP ID | Primer | Primer Sequence | PCR Tm (°C) | PCR product size (bp) | Restriction enzyme |
| rs559963242 | Forward | AGTTGAATCAGGTGAAGACA | 54 | 203 | DdeI |
| Reverse | AATCCGAACCTCCTCTGT | ||||
| rs376330544 | Forward | AGTTGAATCAGGTGAAGACA | 54 | 203 | BsmAI |
| Reverse | AATCCGAACCTCCTCTGT | ||||
| rs12191154 | Forward | AACTACTGCCAGCCACTA | 54 | 403 | Tsp45I |
| Reverse | GTAACAACACAACCAAGAGG | ||||
| rs9387025 | Forward | AACTACTGCCAGCCACTA | 54 | 403 | BsrI |
| Reverse | GTAACAACACAACCAAGAGG | ||||
| rs3730353 | Forward | TGGCTGCTTGTCTACATAC | 54 | 463 | DpnI |
| Reverse | TTCCTGCTTCACCTCCTT | ||||
| rs752601385 | Forward | TGGCTGCTTGTCTACATAC | 54 | 463 | MspI |
| Reverse | TTCCTGCTTCACCTCCTT | ||||
| rs1058134 | Forward | CATCTTTGGTGTTTGGGAT | 52 | 280 | PstI |
| Reverse | ATGTGTTCTGCTCTTCTCT | ||||
| rs11967460 | Forward | ACACAGAGGAATCACAAGG | 54 | 306 | PstI |
| Reverse | TTTACTTACGGGCACTGAG | ||||
| rs9481198 | Forward | GGGTGGTGAGAAAGGAAG | 54 | 300 | RsaI |
| Reverse | GGTAGAGTAGATTGGTGTGG | ||||
| rs62413757 | Forward | GTCACACTCACACTCACA | 53 | 232 | MluCI |
| Reverse | GATTTCCTCTCTACTTCCCTA |
PCR, polymerase chain reaction; SNP, Single Nucleotide Polymorphism; Tm, temperature; bp, base pair.
Descriptive statistics were used to summarize baseline and clinical characteristics of patients. The normality test was performed on continuous variables and the Chi-squared test was used for categorical variables. Genotype distributions were tested for Hardy-Weinberg equilibrium (HWE) using the Chi-squared test.
SNP genotype and allele frequency (rs559963242, rs376330544, rs12191154, rs9387025, rs3730353, rs752601385, rs1058134, rs11967460, rs9481198, and rs62413757) distributions were compared between the patient group and the normal group using Fisher’s exact test or the Chi-squared test. Logistic regression analysis was performed on significant variables. Statistical significance was set at p
The patient group had a mean age of 47.24
| Total (N = 354) | Male (N = 279) | Female (N = 75) | t or | p-value | |
| Age (years) | 47.24 | 47.97 | 44.53 | 2.83 | 0.005 |
| Education (years) | 10.34 | 10.51 | 9.70 | 1.50 | 0.135 |
| First drinking age (years) | 20.78 | 19.53 | 25.40 | –5.21 | |
| Onset age of ARP (years) | 34.00 | 33.37 | 36.34 | –2.18 | 0.030 |
| First hospitalization age (years) | 41.85 | 41.80 | 42.04 | –0.19 | 0.852 |
| Number of hospitalization due to ARP | 4.90 | 5.35 | 3.24 | 3.92 | |
| Drinks/drinking day (SD)† | 12.75 | 13.08 | 11.51 | 1.67 | 0.108 |
| Drinking days/month‡ | 16.70 | 17.50 | 15.88 | 1.33 | 0.186 |
| Family history of ARP | 225 (63.6%) | 178 (63.8%) | 47 (62.7%) | 0.95 | 0.893 |
| History of severe alcohol withdrawal | 196 (55.4%) | 143 (51.3%) | 53 (70.7%) | 2.29 | 0.003 |
ARP, alcohol related problems (e.g., drunk driving, legal problems due to drinking, family troubles due to drinking); SD, standard drink; †, Average daily standard drinking amounts for 1 year prior to current admission; ‡, Average drinking days/month of 1 year prior to current admission; bold: p
No allele or genotype frequencies violated HWE. Table 4 shows the distribution of FYN gene SNP genotypes in the AD patient group and the normal control group. The major allele GG genotype and G allele frequencies of rs1058134 in the AD patient group were significantly lower than those in the normal control group (genotype frequency: p
| SNP | Sample | n | Distribution of Genotypes (%) | p-value ( | Genotype Frequency (%) | p-value ( | Allele Frequency (%) | p-value ( | ||||
| rs559963242 | TT | TT | f(T) | |||||||||
| AD | 346 | 346 | 0 | 0 | - | 346 | 0 | - | 692 | 0 | ||
| (100.0) | (0.0) | (0.0) | (100.0) | (0.0) | (100.0) | (0.0) | ||||||
| NC | 137 | 137 | 0 | 0 | 137 | 0 | 274 | 0 | ||||
| (100.0) | (0.0) | (0.0) | (100.0) | (0.0) | (100.0) | (0.0) | ||||||
| rs376330544 | CC | CC | f(C) | |||||||||
| AD | 346 | 346 | 0 | 0 | - | 346 | 0 | - | 692 | 0 | ||
| (100.0) | (0.0) | (0.0) | (100.0) | (0.0) | (100.0) | (0.0) | ||||||
| NC | 137 | 137 | 0 | 0 | 137 | 0 | 274 | 0 | ||||
| (100.0) | (0.0) | (0.0) | (100.0) | (0.0) | (100.0) | (0.0) | ||||||
| rs3730353 | AA | AA | f(A) | |||||||||
| AD | 337 | 337 | 0 | 0 | - | 337 | 0 | - | 674 | 0 | ||
| (100.0) | (0.0) | (0.0) | (100.0) | (0.0) | (100.0) | (0.0) | ||||||
| NC | 137 | 137 | 0 | 0 | 137 | 0 | 274 | 0 | ||||
| (100.0) | (0.0) | (0.0) | (100.0) | (0.0) | (100.0) | (0.0) | ||||||
| rs752601385 | CC | CC | f(C) | |||||||||
| AD | 337 | 337 | 0 | 0 | - | 337 | 0 | - | 674 | 0 | - | |
| (100.0) | (0.0) | (0.0) | (100.0) | (0.0) | (100.0) | (0.0) | ||||||
| NC | 137 | 137 | 0 | 0 | 137 | 0 | 274 | 0 | ||||
| (100.0) | (0.0) | (0.0) | (100.0) | (0.0) | (100.0) | (0.0) | ||||||
| rs62413757 | GG | GG | f(G) | |||||||||
| AD | 344 | 344 | 0 | 0 | - | 344 | 0 | - | 688 | 0 | - | |
| (100.0) | (0.0) | (0.0) | (100.0) | (0.0) | (100.0) | (0.0) | ||||||
| NC | 137 | 137 | 0 | 0 | 137 | 0 | 274 | 0 | ||||
| (100.0) | (0.0) | (0.0) | (100.0) | (0.0) | (100.0) | (0.0) | ||||||
| rs12191154 | AA | AG | GG | AA | AG+GG | f(A) | f(G) | |||||
| AD | 327 | 145 | 176 | 6 | 0.173 (3.32) | 145 | 182 | 0.078 (3.10) | 466 | 188 | 0.117 (2.46) | |
| (44.3) | (53.8) | (1.9) | (44.3) | (55.7) | (71.3) | (28.7) | ||||||
| NC | 137 | 73 | 63 | 1 | 73 | 64 | 209 | 65 | ||||
| (53.3) | (46.0) | (0.7) | (53.3) | (46.7) | (76.3) | (23.7) | ||||||
| rs9387025 | AA | GA | GG | AA | GA+GG | f(A) | f(G) | |||||
| AD | 336 | 219 | 111 | 6 | 0.273 (2.60) | 219 | 117 | 0.125 (2.36) | 549 | 123 | 0.128 (2.31) | |
| (65.2) | (33.0) | (1.8) | (65.2) | (34.8) | (81.7) | (18.3) | ||||||
| NC | 137 | 79 | 54 | 4 | 79 | 58 | 212 | 62 | ||||
| (57.7) | (39.4) | (2.9) | (57.7) | (42.3) | (77.4) | (22.6) | ||||||
| rs1058134 | GG | GT | TT | GG | GT+TT | f(G) | f(T) | |||||
| AD | 347 | 154 | 193 | 0 | 154 | 193 | 501 | 193 | 0.003 (8.81) | |||
| (44.4) | (55.6) | (0.0) | (44.4) | (55.6) | (72.2) | (27.8) | ||||||
| NC | 137 | 86 | 51 | 0 | 86 | 51 | 223 | 51 | ||||
| (62.8) | (37.2) | (0.0) | (62.8) | (37.2) | (81.4) | (18.6) | ||||||
| rs11967460 | GG | GA | AA | GG | GA+AA | f(G) | f(A) | |||||
| AD | 348 | 238 | 96 | 14 | 0.050 (6.01) | 238 | 110 | 0.962 (0.002) | 572 | 124 | 0.430 (0.62) | |
| (68.4) | (27.6) | (4.0) | (68.4) | (31.6) | (82.2) | (17.8) | ||||||
| NC | 137 | 94 | 43 | 0 | 94 | 43 | 231 | 43 | ||||
| (68.6) | (31.4) | (0.0) | (68.6) | (31.4) | (84.3) | (15.7) | ||||||
| rs9481198 | TT | TC | CC | TT | TC+CC | f(T) | f(C) | |||||
| AD | 350 | 107 | 187 | 56 | 0.259 (2.71) | 107 | 243 | 0.113 (2.51) | 401 | 299 | 0.304 (1.06) | |
| (30.6) | (53.4) | (16.0) | (30.6) | (69.4) | (57.3) | (42.7) | ||||||
| NC | 137 | 32 | 83 | 22 | 32 | 105 | 147 | 127 | ||||
| (23.4) | (60.6) | (16.0) | (23.4) | (76.6) | (53.6) | (46.4) | ||||||
bold: p
| Variable | Odds Ratio | (95% CI) | p-value | Wald | Estimate | SE | |
| Sex | Female | 1.000 | |||||
| Male | 2.38 | (1.53–3.70) | 14.834 | 0.867 | 0.225 | ||
| rs11967460 | GA+AA | 1.00 | |||||
| GG | 0.95 | (0.60–1.51) | 0.817 | 0.054 | –0.055 | 0.237 | |
| rs9481198 | TC+CC | 1.00 | |||||
| TT | 1.45 | (0.88–2.37) | 0.142 | 2.160 | 0.370 | 0.252 | |
| rs1058134 | GT+TT | 1.00 | |||||
| GG | 0.50 | (0.32–0.76) | 0.001 | 10.345 | –0.700 | 0.218 | |
| rs12191154 | AG+GG | 1.00 | |||||
| AA | 0.74 | (0.49–1.13) | 0.164 | 1.941 | –0.299 | 0.214 | |
| rs9387025 | GA+GG | 1.00 | |||||
| AA | 1.20 | (0.78–1.85) | 0.407 | 0.686 | 0.183 | 0.221 | |
SE, stand error.
Table 6 shows the distribution of SNP genotypes of the FYN gene in male and female subjects of patients and normal controls. The major AA genotype and A allele frequencies and of rs12191154 in female patients were significantly lower than in normal female controls (allele frequency: p = 0.003, genotype frequency: p
| SNP | Sample | n | Distribution of Genotypes (%) | p-value ( | Genotype Frequency (%) | p-value ( | Allele Frequency (%) | p-value ( | |||||
| rs12191154 | AA | AG | GG | AA | AG+GG | f(A) | f(G) | ||||||
| M | AD | 254 | 116 | 133 | 5 | 0.299§ (2.70) | 116 | 138 | 0.357 (0.85) | 365 | 143 | 0.632 (0.23) | |
| (45.7) | (52.3) | (2.0) | (45.7) | (54.3) | (71.9) | (28.1) | |||||||
| NC | 78 | 31 | 47 | 0 | 31 | 47 | 109 | 47 | |||||
| (39.7) | (60.3) | (0.0) | (39.7) | (60.3) | (69.9) | (30.1) | |||||||
| F | AD | 73 | 29 | 43 | 1 | 29 | 44 | 101 | 45 | 0.003 (8.71) | |||
| (39.7) | (58.9) | (1.4) | (39.7) | (60.3) | (69.2) | (30.8) | |||||||
| NC | 59 | 42 | 16 | 1 | 42 | 17 | 100 | 18 | |||||
| (71.2) | (27.1) | (1.7) | (71.2) | (28.8) | (84.7) | (15.3) | |||||||
| rs9387025 | AA | GA | GG | AA | GA+GG | f(A) | f(G) | ||||||
| M | AD | 263 | 166 | 94 | 3 | 0.682§ (2.53) | 166 | 97 | 0.434 (0.61) | 426 | 100 | 0.397 (0.72) | |
| (63.1) | (35.7) | (1.2) | (63.1) | (36.9) | (81.0) | (91.0) | |||||||
| NC | 78 | 53 | 25 | 0 | 53 | 25 | 131 | 25 | |||||
| (67.9) | (32.1) | (0.0) | (67.9) | (32.1) | (84.0) | (16.0) | |||||||
| F | AD | 62 | 53 | 17 | 3 | 0.003§ (11.15) | 53 | 20 | 0.001 (11.06) | 123 | 23 | 0.003 (9.05) | |
| (72.6) | (23.3) | (4.1) | (72.6) | (27.4) | (84.2) | (15.8) | |||||||
| NC | 59 | 26 | 29 | 4 | 26 | 33 | 81 | 37 | |||||
| (44.1) | (49.2) | (6.8) | (44.1) | (55.9) | (68.6) | (31.4) | |||||||
| rs1058134 | GG | GT | TT | GG | GT+TT | f(G) | f(T) | ||||||
| M | AD | 272 | 114 | 158 | 0 | 0.008 (7.11) | 114 | 158 | 0.008 (7.11) | 386 | 158 | 0.035 (4.46) | |
| (41.9) | (58.1) | (0.0) | (41.9) | (58.1) | (71.0) | (29.0) | |||||||
| NC | 78 | 46 | 32 | 0 | 46 | 32 | 124 | 32 | |||||
| (59.0) | (41.0) | (0.0) | (59.0) | (41.0) | (79.5) | (20.5) | |||||||
| F | AD | 75 | 40 | 35 | 0 | 0.090 (2.87) | 40 | 35 | 0.090 (2.87) | 115 | 35 | 0.143 (2.15) | |
| (53.3) | (46.7) | (0.0) | (53.3) | (46.7) | (76.7) | (23.3) | |||||||
| NC | 59 | 40 | 19 | 0 | 40 | 19 | 99 | 19 | |||||
| (67.8) | (32.2) | (0.0) | (67.8) | (32.2) | (83.9) | (16.1) | |||||||
| rs11967460 | GG | GA | AA | GG | GA+AA | f(G) | f(A) | ||||||
| M | AD | 274 | 185 | 79 | 10 | 0.230 (2.94) | 185 | 89 | 0.616 (0.25) | 449 | 99 | 0.333 (0.94) | |
| (67.5) | (28.8) | (36) | (67.5) | (32.5) | (81.9) | (18.1) | |||||||
| NC | 78 | 55 | 23 | 0 | 55 | 23 | 133 | 23 | |||||
| (70.5) | (29.5) | (0.0) | (70.5) | (29.5) | (85.3) | (14.7) | |||||||
| F | AD | 74 | 53 | 17 | 4 | 0.108 (4.74) | 53 | 32 | 0.493 (0.47) | 123 | 25 | 0.990 (0.00) | |
| (71.6) | (23.0) | (5.4) | (71.6) | (28.4) | (83.1) | (16.9) | |||||||
| NC | 59 | 39 | 20 | 0 | 39 | 20 | 98 | 20 | |||||
| (66.1) | (33.9) | (0.0) | (66.1) | (33.9) | (83.1) | (16.9) | |||||||
| rs9481198 | TT | TC | CC | TT | TC+CC | f(T) | f(C) | ||||||
| M | AD | 277 | 83 | 149 | 45 | 0.268 (2.63) | 83 | 194 | 0.234 (1.42) | 315 | 239 | 0.700 (0.15) | |
| (30.0) | (53.8) | (16.2) | (30.0) | (70.0) | (56.9) | (43.1) | |||||||
| NC | 78 | 18 | 50 | 10 | 18 | 60 | 86 | 70 | |||||
| (23.1) | (64.1) | (12.8) | (23.1) | (76.9) | (55.1) | (44.9) | |||||||
| F | AD | 73 | 24 | 38 | 11 | 0.458 (1.56) | 24 | 49 | 0.248 (1.33) | 86 | 60 | 0.241 (1.37) | |
| (32.9) | (52.0) | (15.1) | (32.9) | (67.1) | (58.9) | (41.1) | |||||||
| NC | 59 | 14 | 33 | 12 | 14 | 45 | 61 | 57 | |||||
| (23.7) | (55.9) | (20.3) | (23.7) | (76.3) | (51.7) | (48.3) | |||||||
§: Fisher’s exact test; M, male; F, female; bold: p
In the present study, allele frequencies and genotypes of FYN gene SNPs were compared between AD patients and normal controls. Allele frequencies and genotypes of rs1058134 showed significant differences between the AD group and the normal control group. In the second analysis, allele frequencies and genotypes of rs1058134 did not show significant differences between patients and normal controls in males, while allele frequencies and genotypes of rs12191154 and rs9387025 did not show significant differences between female patients and normal female controls. The major allele genotypes of rs1058134 showed significantly lower odds ratios for alcohol dependence than minor allele genotypes in a logistic regression analysis adjusted for sex.
Few studies have previously reported associations between polymorphisms in the FYN gene and alcohol dependence. In a study of Caucasian subjects by Schumann et al. [18], those with major allele genotypes of rs45490695 showed a high number of withdrawal symptoms, high amount of alcohol intake, and high maximum number of drinks than those with minor genotypes of alcohol dependence. showed a high number of withdrawal symptoms, high amount of alcohol intake, and high maximum number of drinks than those with minor genotypes of alcohol dependence. In a study of Spanish subjects by Pastor et al. [19], G allele carriers of rs45490695 were more common in those with alcohol dependence than in those with alcohol abuse. However, in a study of Japanese subjects by Ishiguro et al. [20], alcohol dependence showed no significant association with FYN gene SNPs such as rs45490695, rs3730353, or rs6916861. Previous studies have reported that there might be differences in sensitivity to alcohol and alcohol metabolism depending on race [29, 30, 31]. These factors could eventually affect the occurrence and risk of alcohol use disorders.
In two previous studies, there were racial differences between the Caucasian and Spanish subjects and Korean subjects. In a previous study of Japanese subjects, rs3730353, which failed to reveal a significant association, showed the same genotype in both the alcohol dependence group and the control group in this study. Although SNP rs45490695 showed significant association in previous studies, it could not be included in present study because there was no appropriate enzyme restriction site for genotyping. This was a limitation of the present study.
In addition, in the study of Ishiguro et al. [20], the control group was 29–75 years old (average 48.3 years). In the study of Schumann et al. [18], the control group was 44.5 years old on average. In both studies, there was no standard for alcohol consumption. However, subjects who were alcohol dependent might have been included in the present study, which could have affected the results. In a study by Schinka et al. [32], the frequency of A118G genotypes in OPRM1 (opioid acceptor Mu1) did not show a significant difference compared with those in the normal control group. However, results can differ depending on the control group, e.g., a super control group with an average monthly drinking rate of lower than 1 SD and less than 1 cigarette per week [32]. This supports the need for sufficient consideration of alcohol consumption standards and age when creating the control group.
In this study, referring to study by Town et al. [28], we defined the control group as those who did not develop alcohol dependence at age 50 years or older, who had sufficient exposure to alcohol, to exclude subjects with the potential to develop alcohol dependence. Compared with previous studies, this could be a strength of the present study.
SNPs such as rs1058134, rs12191152, and rs9387025 showed a significant difference in this study. However, they did not show associations with alcohol dependence in prior studies, although their associations with Alzheimer’s disease have been suggested by Zahratka et al. [33] and Anbarasu and Kundu [34]. Many previous studies have demonstrated the relationship between polymorphism in the FYN gene and phosphorylation of Tau protein, one important etiology for Alzheimer’s disease [35, 36, 37]. Although there are few studies on alcohol use disorder and phosphorylation of Tau protein, Saito et al. [38] have demonstrated that ethanol can induce phosphorylation of Tau protein which might be related to ethanol-induced neurodegeneration in the brain.
It is known that drinking patterns, drinking experiences, severity of alcohol withdrawal, and frequency of alcohol problems differ according to sex. Factors affecting the occurrence of alcohol use disorders are also different between men and women [39]. In female mice exposed to alcohol for a long time, the expression of NR1, an NMDA acceptor subreceptor, was increased in the cerebral envelope and hippocampus, whereas in male mice, the expression of NR1 was increased only in the hippocampus. In addition, in the case of NR2A, its expression was increased only in the hippocampus of male mice exposed to alcohol for a long time. In the case of NR2B, its expression was increased in the cerebral cortex of both males and females [40]. FYN kinase adjusts the NMDA-type glutamate receptor function through phosphorylation [14]. It can increase the function of ion passage through phosphorylation of NR2B, the subunit of the NMDA receptor [15], induce the integrity effect of ethanol, and cause a difference in alcohol sensitivity. Previous studies have not been conducted in humans, so it is difficult to consider them as sufficient evidence for the sex differences found in this study. However, this could be seen as evidence for suggesting that there may be sex differences when the FYN kinase regulates NMDA receptor function, and it could be helpful for future research plans on how the mechanism of alcohol use disorder in humans differs between males and females.
This study has some limitations. First, the number of women in the alcohol-dependent group was relatively small compared with the number of men in the same group. Second, in the SNP selection process, specific SNPs were selected and implemented based on previous studies rather than the whole genome sequencing method. In particular, rs45490695, a SNP used in previous studies, was not included in the analysis because there was no appropriate restriction site. Therefore, additional studies should be planned to verify results of this study with more SNPs, including outpatients and female patients with alcohol use disorder.
There were significant differences in genotype frequency and allele frequency of FYN gene SNPs between the alcohol dependence group and the normal control group. There were also significant differences in genotype frequency and allele frequency of different SNPs between males and females. The results of this study suggest that the FYN gene might be related to the occurrence of alcohol use disorder. Therefore, additional research is needed to confirm the relationship between the FYN gene and alcohol use disorder in each sex through an accurate study of the function of the meaningful SNPs described in this study.
The data sets generated and/or analyzed during the study are available at https://www.ncbi.nlm.nih.gov/snp/. The datasets used and/or analyzed during the study are available from the corresponding author on reasonable request.
Concept–SYH, S-GK, J-HK, H-KK, Y-SK; Design–SYH; Supervision–S-GK, J-HK; Materials–H-KK, Y-SK; Data collection–H-KK, Y-SK; Analysis–SYH, J-HK; Literature Search–SYH; Writing–SYH, H-KK, Critical Review–SYH, S-GK, J-HK, Y-SK. All authors read and approved the final manuscript. All authors have participated sufficiently in the work and agreed to be accountable for all aspects of the work.
The study was conducted in accordance with the Declaration of Helsinki, and this study received approval from the Institutional Review Board (IRB) of Pusan National University Yangsan Hospital (IRB No. 05-2020-171). Written informed consent was obtained from all participants or their guardians.
Not applicable.
This research received no external funding.
The authors declare no conflict of interest.
References
Publisher’s Note: IMR Press stays neutral with regard to jurisdictional claims in published maps and institutional affiliations.