1. Introduction
Under normal conditions, serum Na concentrations in the human body are
finely maintained within a narrow range of 135–145 mmol/L despite large
fluctuations in water or salt intake [1]. Nevertheless, hyponatremia and
hypernatremia are relatively common electrolyte disorders [1, 2]. Minor
abnormalities in Na levels are common and rarely of clinical significance;
however, more severe Na disorders are still relatively common and are very
frequently clinically significant [3, 4, 5]. Hypernatremia, which is much less
common than hyponatremia, is generally defined as serum Na levels 145
mmol/L [1]. The degree of hypernatremia is generally considered mild when serum
Na levels are between 145 and 155 mmol/L and severe when serum Na
levels are 155 mmol/L [2]. Somewhat surprisingly, the exact boundaries of what
is considered the normal range of serum Na levels vary from institution to
institution, as do the boundaries between mild and severe hypernatremia [2, 6, 7].
When serum Na levels exceed 190 mmol/L, the hypernatremia becomes extreme
[8, 9]. Case reports have reported Na levels ranging from 207 to 255 mmol/L
[10, 11, 12, 13, 14, 15].
It is well known that hypernatremia, especially when acute and severe, can
induce brain shrinkage that may cause vascular rupture and cerebral bleeding,
resulting in permanent neurologic damage or even death [10, 16, 17, 18]. Much less is
known about the effects of acute hypernatremia on the heart and the underlying
mechanisms. Data on the direct effects of acute hypernatremia on individual
membrane currents of cardiac myocytes are lacking. However, some data exist on
the changes in individual membrane currents of cardiac myocytes that are acutely
exposed to hyperosmotic solutions (induced by the addition of sucrose or mannitol
to the extracellular solution rather than hypernatremia). Such exposure is
associated with a rapid shrinkage of the cells through the loss of intracellular
water. This shrinkage occurs within 2–3 minutes and is fully reversible
[19, 20, 21, 22]. By exposing isolated guinea pig ventricular cardiomyocytes to
hyperosmotic Tyrode’s solution with a 1.5 times normal osmolarity, Ogura
et al. [21] observed decreases in cell volume of 19 2% (mean
standard error of the mean, SEM, n = 8) and of 20% [22]. A reduction of 19
2% (mean SEM, n = 8) was also observed by Missan
et al. [23], who also exposed isolated guinea pig ventricular
cardiomyocytes to hyperosmotic Tyrode’s solution with a 1.5 times normal
osmolarity. In isolated rat ventricular cardiomyocytes, 18% of the
cell volume is osmotically inactive [24]. In the rabbit, this is 34%
[19], and in the guinea pig it is 35% [21]. The decrease in cell
volume, without affecting membrane capacitance [22], may, by itself, affect
membrane currents by increasing the intracellular ion concentrations. However,
cell shrinkage may also have direct functional effects on the proteins embedded
in the cell membrane, including those of ion channels, pumps, and exchangers
[22, 25]. The available data on such direct functional effects of acute exposure
to a hyperosmotic solution on individual ion currents, as obtained in isolated
cardiomyocytes or an expression system, are summarized in Table 1 (Ref.
[20, 22, 23, 25, 26, 27, 28, 29]).
Table 1.Effects of an acute exposure to a hyperosmotic solution on
individual cardiac ion currents.
| Current |
Cell preparation |
Hyperosmolarity |
Observation |
Study |
| I |
Guinea pig ventricular cardiomyocytes |
30% |
No consistent change of I |
Sasaki et al. [26] |
|
Guinea pig ventricular cardiomyocytes |
50% |
≈28% decrease in amplitude; slightly slowed inactivation |
Ogura et al. [20] |
|
Rat ventricular cardiomyocytes |
30% |
≈27% increase in amplitude; slightly accelerated inactivation |
Luo et al. [27] |
| I |
Guinea pig ventricular cardiomyocytes |
30% |
≈44% decrease in amplitude |
Sasaki et al. [26] |
|
Guinea pig ventricular cardiomyocytes |
50% |
≈30% decrease in amplitude |
Ogura et al. [22] |
|
Chinese hamster ovary (CHO) cells stably expressing I channels |
40% |
≈57% decrease in amplitude; no major effects on voltage dependence |
Yabuuchi et al. [28] |
| I |
Guinea pig ventricular cardiomyocytes |
50% |
≈50% decrease in amplitude |
Ogura et al. [22] |
|
Guinea pig ventricular cardiomyocytes |
50% |
“Marked inhibition” |
Missan et al. [23] |
| I |
Guinea pig ventricular cardiomyocytes |
50% |
No effect on I |
Missan et al. [23] |
| I |
Guinea pig ventricular cardiomyocytes |
30% |
≈23% increase in amplitude |
Wright et al. [29] |
| I |
Guinea pig ventricular cardiomyocytes |
50% |
≈40% decrease in amplitude |
Whalley et al. [25] |
|
Guinea pig ventricular cardiomyocytes |
30% |
≈70% decrease in amplitude, although the decrease was only apparent in 15 of 29 experiments |
Sasaki et al. [26] |
I, L-type Ca current; I, rapid delayed rectifier K
current; I, slow delayed rectifier K current; I, inward
rectifier K current; I, Na–Ca exchange current;
I, Na–K pump current. Hyperosmosis induced by the
addition of sucrose or mannitol to the extracellular solution.
The experimental data in Table 1 are required to construct a model for use in
computer simulations of the effects of acute hypernatremia (and associated
hyperosmosis) on the electrophysiology of single human ventricular
cardiomyocytes, as detailed in the Materials and Methods section below. In the
case of the rapid delayed rectifier K current (I), the slow delayed
rectifier K current (I), and the Na–K pump current
(I), the data from the different studies are largely consistent (Table 1). However, the experimental data for the L-type calcium Ca current
(I) from three studies seem inconsistent, at least at first glance. In
the study by Ogura et al. [20], in which the intracellular Ca
concentration ([Ca]) was only moderately buffered, accompanying
experiments with indo-1-loaded cardiomyocytes suggested that the decrease in
I amplitude was due to a rapid increase in [Ca] rather than
a direct functional effect on the I channels. This is in line with the
observations of Sasaki et al. [26], who observed “no consistent change
in I” when using a pipette solution containing 5.0 mmol/L ethylene glycol-bis (-aminoethyl ether)-N,N,N’,N’-tetraacetic acid (EGTA) or 10
mmol/L 1,2-bis (2-aminophenoxy)ethane-N,N,N’,N’-tetraacetic acid (BAPTA), thereby strongly buffering [Ca]. Thus, the findings of
Ogura et al. [20] and Sasaki et al. [26] both suggest that
there is no direct effect from the hyperosmosis (osmolarity 1.5 times normal) on
the amplitude of I and that the apparent discrepancy in their
observations is largely due to the differences in the extent to which
[Ca] was buffered. However, Luo et al. [27], who used a
pipette solution containing 10 mmol/L EGTA, thus also strongly buffering
[Ca], still showed an 27% increase in I
amplitude (osmolarity 1.3 times normal).
In 2011, O’Hara et al. [30] published a comprehensive model of the
electrical activity of a single human ventricular cardiomyocyte, which has often
been considered the “gold standard” for such a model over the past decade [31].
This O’Hara–Rudy dynamic (ORd) cell model has since been widely used in computer
simulations of the electrical activity of a single human ventricular
cardiomyocyte in health and disease. However, starting from the ORd model, both
Tomek et al. [32] and Bartolucci et al. [31] developed novel,
very comprehensive models of the electrical activity of a single human
ventricular cardiomyocyte. These well-documented models were published in 2019
and 2020 and are known as the Tomek–Rodriguez model, following the ORd model
(ToR–ORd model) and the Bartolucci–Passini–Severi model as published in 2020
(BPS2020 model), respectively. Although both models can be considered major
updates of the ORd model, with many highly important improvements, they were
developed along different lines, which makes it useful to run simulations with
both models when, as we did in the present study, performing an in
silico study of the effects of acute hypernatremia on the electrophysiology of
single human ventricular cardiomyocytes.
3. Results
First, we carried out computer simulations that examined the effects of
different levels of hypernatremia on the electrical activity of the BPS2020 model
of a single human ventricular cardiomyocyte. APs were elicited at a rate of 50,
75, and 100 per minute, resulting in beating rates of 50, 75, and 100 beats per
minute (bpm), respectively. Hypernatremia was simulated by increasing the
extracellular concentration of sodium chloride by 10, 20, and 50%, corresponding
to mild, severe, and extreme hypernatremia, respectively. Next, these simulations
were repeated with the ToR–ORd model to assess to which extent the observed
effects were model-dependent.
3.1 Effects of Hypernatremia in the BPS2020 Model
Fig. 1A shows APs (membrane potential, V) obtained after a simulated
period of 10 min of stimulation at 50 min under control conditions
(‘baseline’, blue trace) and at 10, 20, and 50% hypernatremia (green, orange,
and purple traces, respectively). Such a 10-minute period is sufficient to obtain
steady-state or quasi-steady-state behavior at each level of hypernatremia and
each stimulation rate tested. Fig. 1B–D shows the associated intracellular
Na, K, and Ca concentrations (denoted by [Na],
[K], and [Ca], respectively). The cell shrinkage that is
caused by the hyperosmosis of the extracellular solution results in increased
levels of both [Na] and [K] (Fig. 1B,C). The diastolic
resting level of [Ca] is hardly affected by the hypernatremia, but
there is an increase in its systolic peak value with increasing levels of
hypernatremia (Fig. 1D).
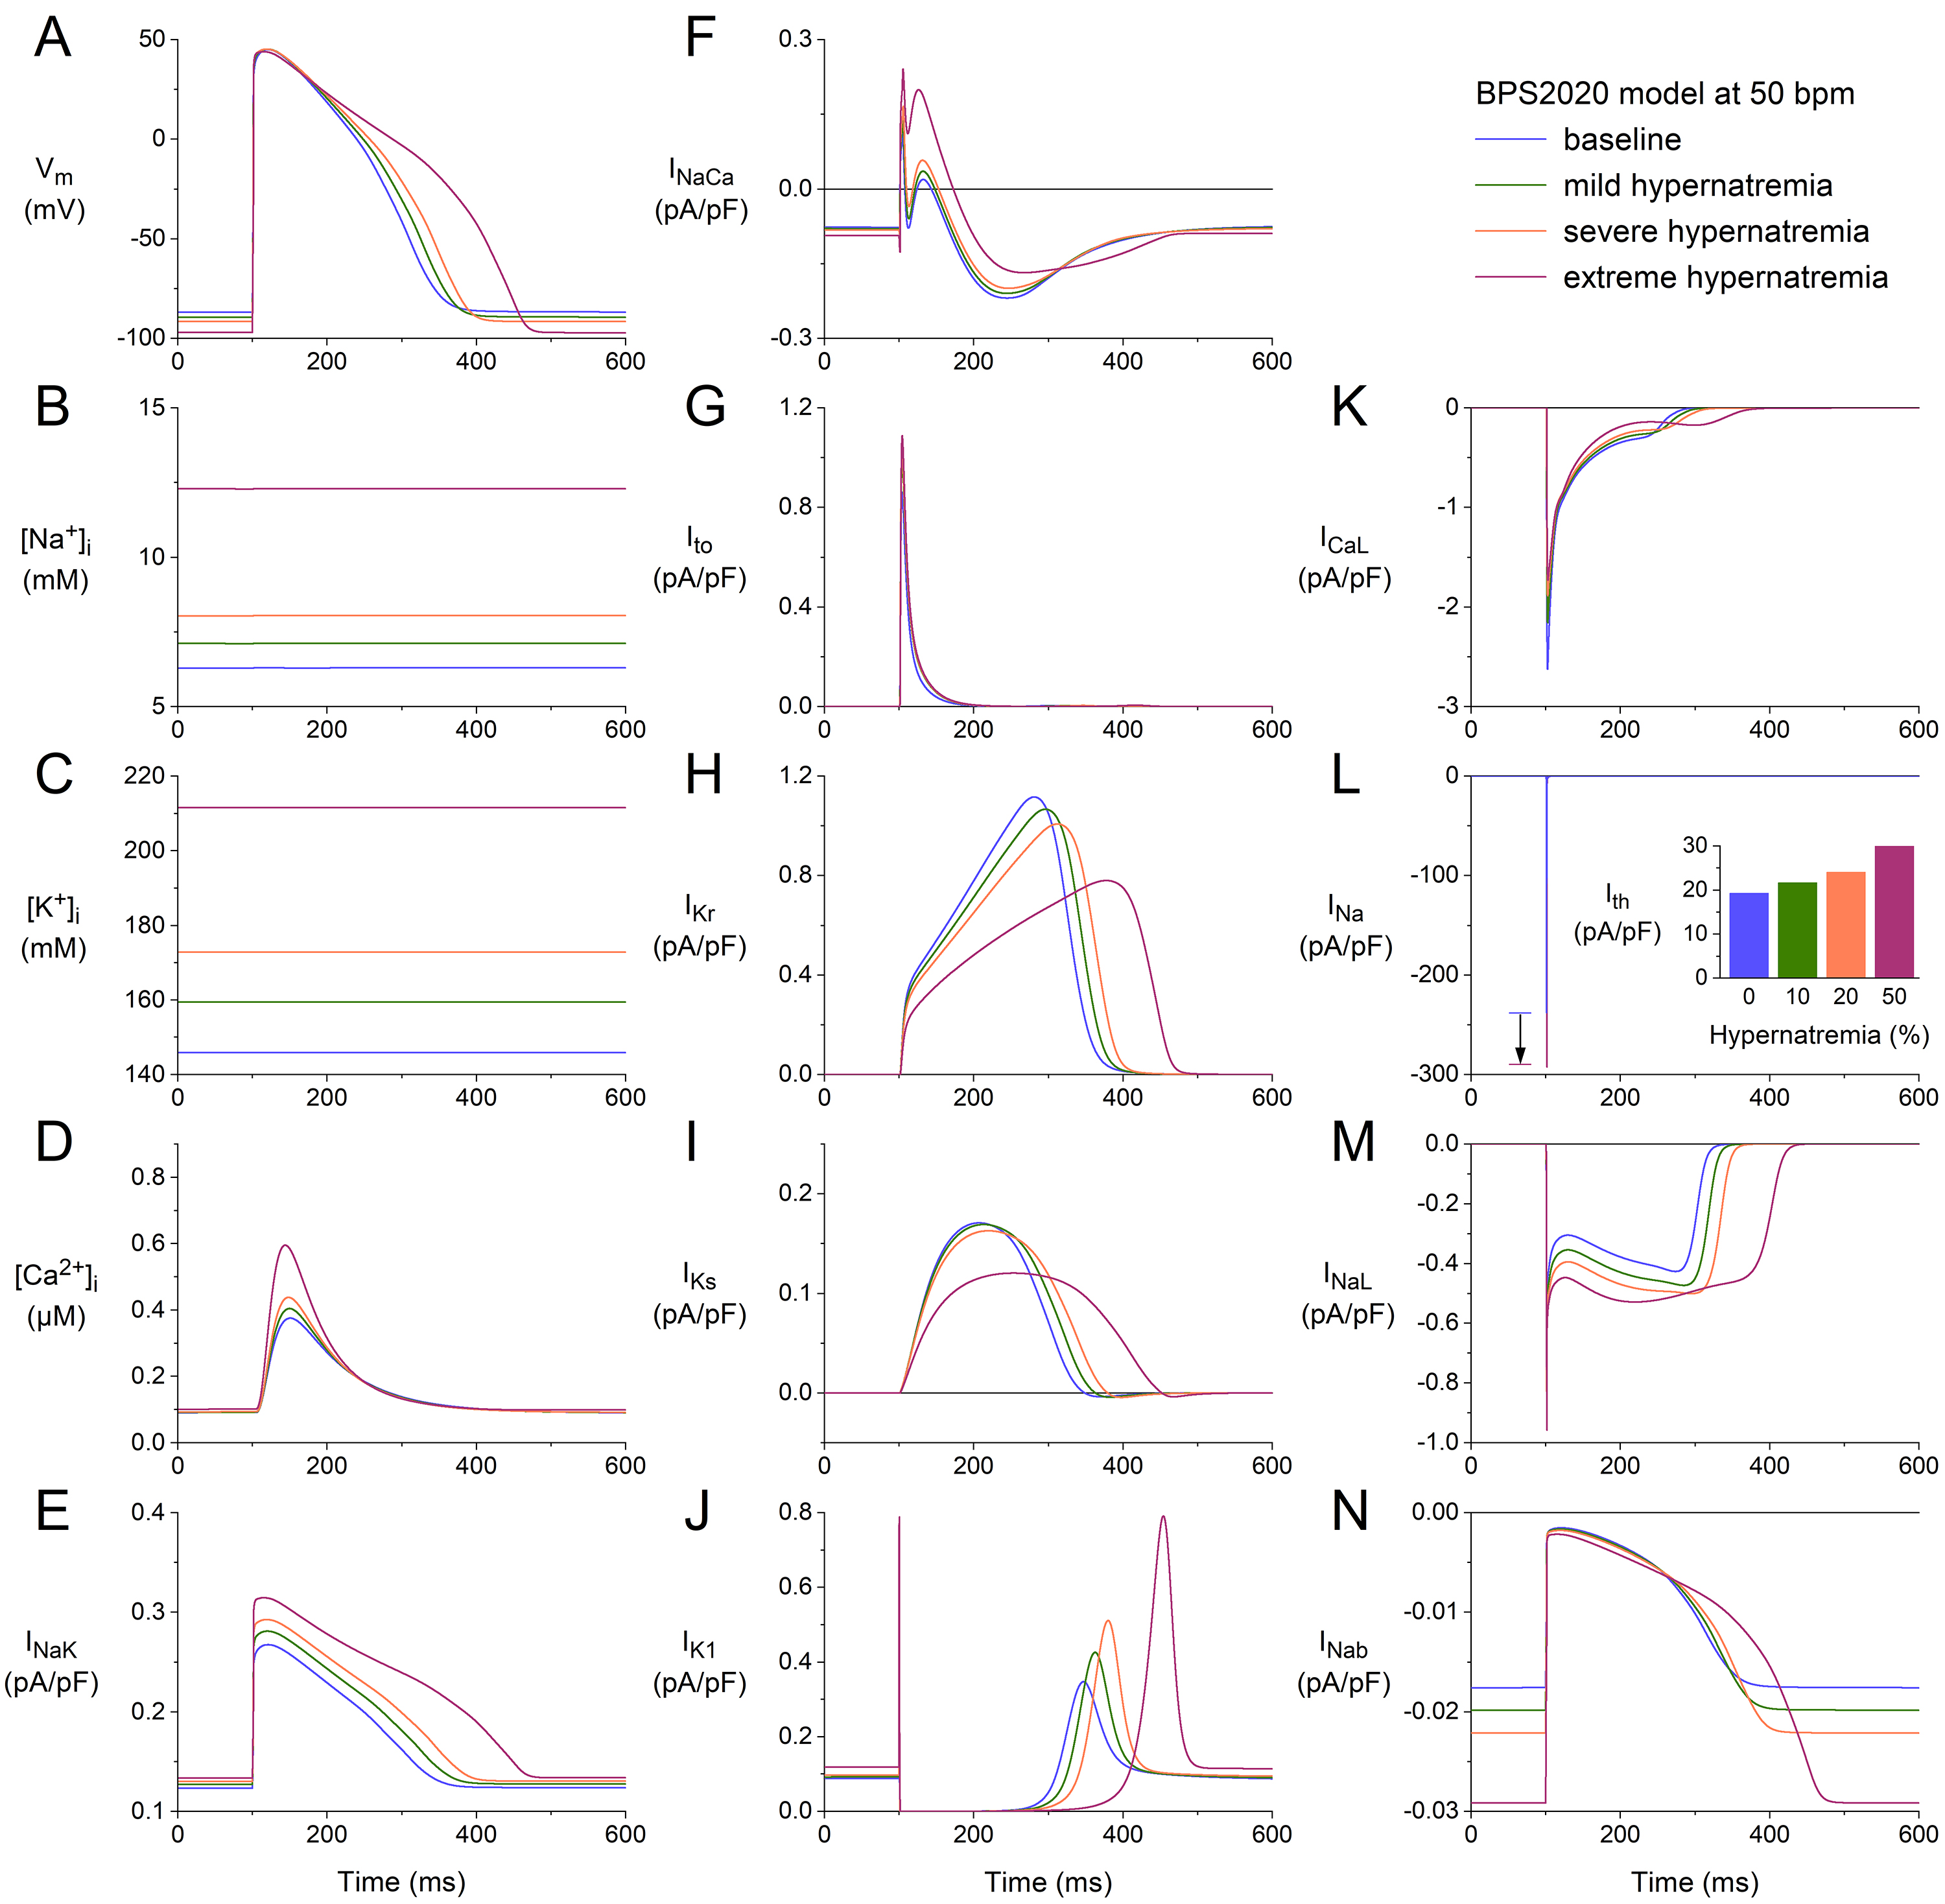 Fig. 1.
Effects of hypernatremia on the electrical activity of a single
human ventricular cardiomyocyte (BPS2020 model) at a beating rate of 50 bpm. (A)
Membrane potential (V). (B) Intracellular Na concentration
([Na]). (C) Intracellular K concentration ([K]).
(D) Intracellular Ca concentration ([Ca]). (E)
Na–K pump current (I). (F) Na–Ca exchange
current (I). (G) Transient outward K current (I). (H) Rapid
delayed rectifier K current (I). (I) Slow delayed rectifier K
current (I). (J) Inward rectifier K current (I). (K) L-type
Cacurrent (I). (L) Fast Na current (I). The vertical
arrow indicates the increase in I amplitude with increasing levels of
hypernatremia. (M) Late Na current (I). (N) Background Na
current (I). Note the differences in current scales. The inset to (L)
shows the threshold stimulus current (I) at the different levels of
hypernatremia. BPS2020, Bartolucci-Passini-Severi model as published in 2020; bpm, beats per minute.
The activity of the Na–K pump is, on the one hand, enhanced by the
increase in [Na], but on the other hand, reduced by the increase in
[K] as well as by the cell shrinkage per se (as observed
experimentally, as described in the Introduction section, and represented in the
model as set out in the Materials and Methods section). The net effect is an
increase in I (Fig. 1E), which is, however, insufficient to keep
[Na] at its baseline level. The activity of the Na–Ca
exchanger is not only enhanced by the increase in [Ca] but also by
the cell shrinkage per se (as observed experimentally, as described in
the Introduction section, and represented in the model as set out in the
Materials and Methods section). The net effect is an increase in I (Fig. 1F). The time course of the transient outward current (I; Fig. 1G), which
is a K current, is only slightly dependent on the level of hypernatremia.
This is because the activation of I is largely determined by the AP
upstroke and early repolarization phases, which do not show a marked change (Fig. 1A). Its amplitude increases with increasing hypernatremia, among other things,
due to the increase in its driving force by the hyperpolarization of the K
equilibrium potential (E) as a result of the increase in [K]
(Fig. 1C). The driving force of I and I is also increased. Yet,
both currents show a decreased amplitude with increasing hypernatremia (Fig. 1H,I). This is largely due to the cell shrinkage-induced decrease in their fully
activated conductance (as observed experimentally, as described in the
Introduction section, and represented in the model as set out in the Materials
and Methods section). I increases with increasing hypernatremia (Fig. 1J),
entirely due to its voltage dependence and the hypernatremia-induced
hyperpolarization of V (Fig. 1A).
I shows a complex dependence on intracellular and extracellular ion
concentrations and voltage. The net effect of the hypernatremia is a decrease in
its amplitude (Fig. 1K). The fast Na current (I), on the other hand,
shows an increase with increasing hypernatremia (Fig. 1L), which is largely due
to the reduction in its steady-state inactivation due to the hyperpolarization of
the resting membrane potential between consecutive APs (Fig. 1A). This increase
per se would result in a faster activation of neighboring cells and an
associated increase in conduction velocity. However, this is counteracted by
reduced excitability, as reflected by the increase in threshold stimulus current
(I; Fig. 1L, inset). The late I (I) also shows an increase
with increasing hypernatremia (Fig. 1M), which is also largely due to the
reduction of its steady-state inactivation due to the hyperpolarization of the
resting membrane potential between consecutive APs (Fig. 1A). The model cell has
several other inward and outward currents, in addition to those shown in Fig. 1E–M. These include the background Na, K, and Ca currents
(I, I, and I, respectively) and the sarcolemmal Ca
pump current (I). As illustrated in Fig. 1N for I, these other
currents also depend on the level of hypernatremia through their dependence on
ion concentrations and voltage. However, as illustrated in Fig. 1N, these
currents are so small that they hardly contribute to the net membrane current.
The net effect of the hypernatremia-induced changes in ion concentrations (Fig. 1B–D) and membrane currents (Fig. 1E–N) is hyperpolarization and prolongation
of the AP (Fig. 1A). The hyperpolarization amounts to 2.5, 4.8, and 10.3 mV under
conditions of mild, severe, and extreme hypernatremia, respectively, whereas the
AP duration (APD) at 90% repolarization (APD) is increased by 7, 14, and
46%, respectively. As a direct effect of the increase in I amplitude
(Fig. 1L), the maximum AP upstroke velocity ((dV/dt)) is increased
by 11, 18, and 23% under conditions of mild, severe, and extreme hypernatremia,
respectively. At the same time, I is increased by 12, 25, and 55%,
respectively (Fig. 1L, inset).
We repeated our simulations with the BPS2020 model at higher stimulation rates
of 75 and 100 min. The results obtained at these two rates (Figs. 2,3) are
qualitatively similar to those obtained at 50 min (Fig. 1). Rate-dependent
quantitative differences with respect to ion concentrations include a higher
level of [Na] (Figs. 2B,3B), higher peak amplitude of
[Ca] (Figs. 2D,3D), and a higher activity of the Na–K
pump (Figs. 2E,3E). Rate-dependent quantitative differences concerning individual
membrane currents include a decrease in I due to the smaller amount of
time available between consecutive APs for its relatively slow recovery from
inactivation and an increase in I due to the smaller amount of time
available between consecutive APs for its relatively slow deactivation. The
hypernatremia-induced AP hyperpolarization and prolongation observed at 50 bpm
(Fig. 1A) were also examined at 75 bpm (Fig. 2A) and 100 bpm (Fig. 3A). The same
holds for the hypernatremia-induced increase in I amplitude (Figs. 2L,3L)
and the associated increase in (dV/dt), and the
hypernatremia-induced increase in I (Fig. 2L, inset; Fig. 3L, inset).
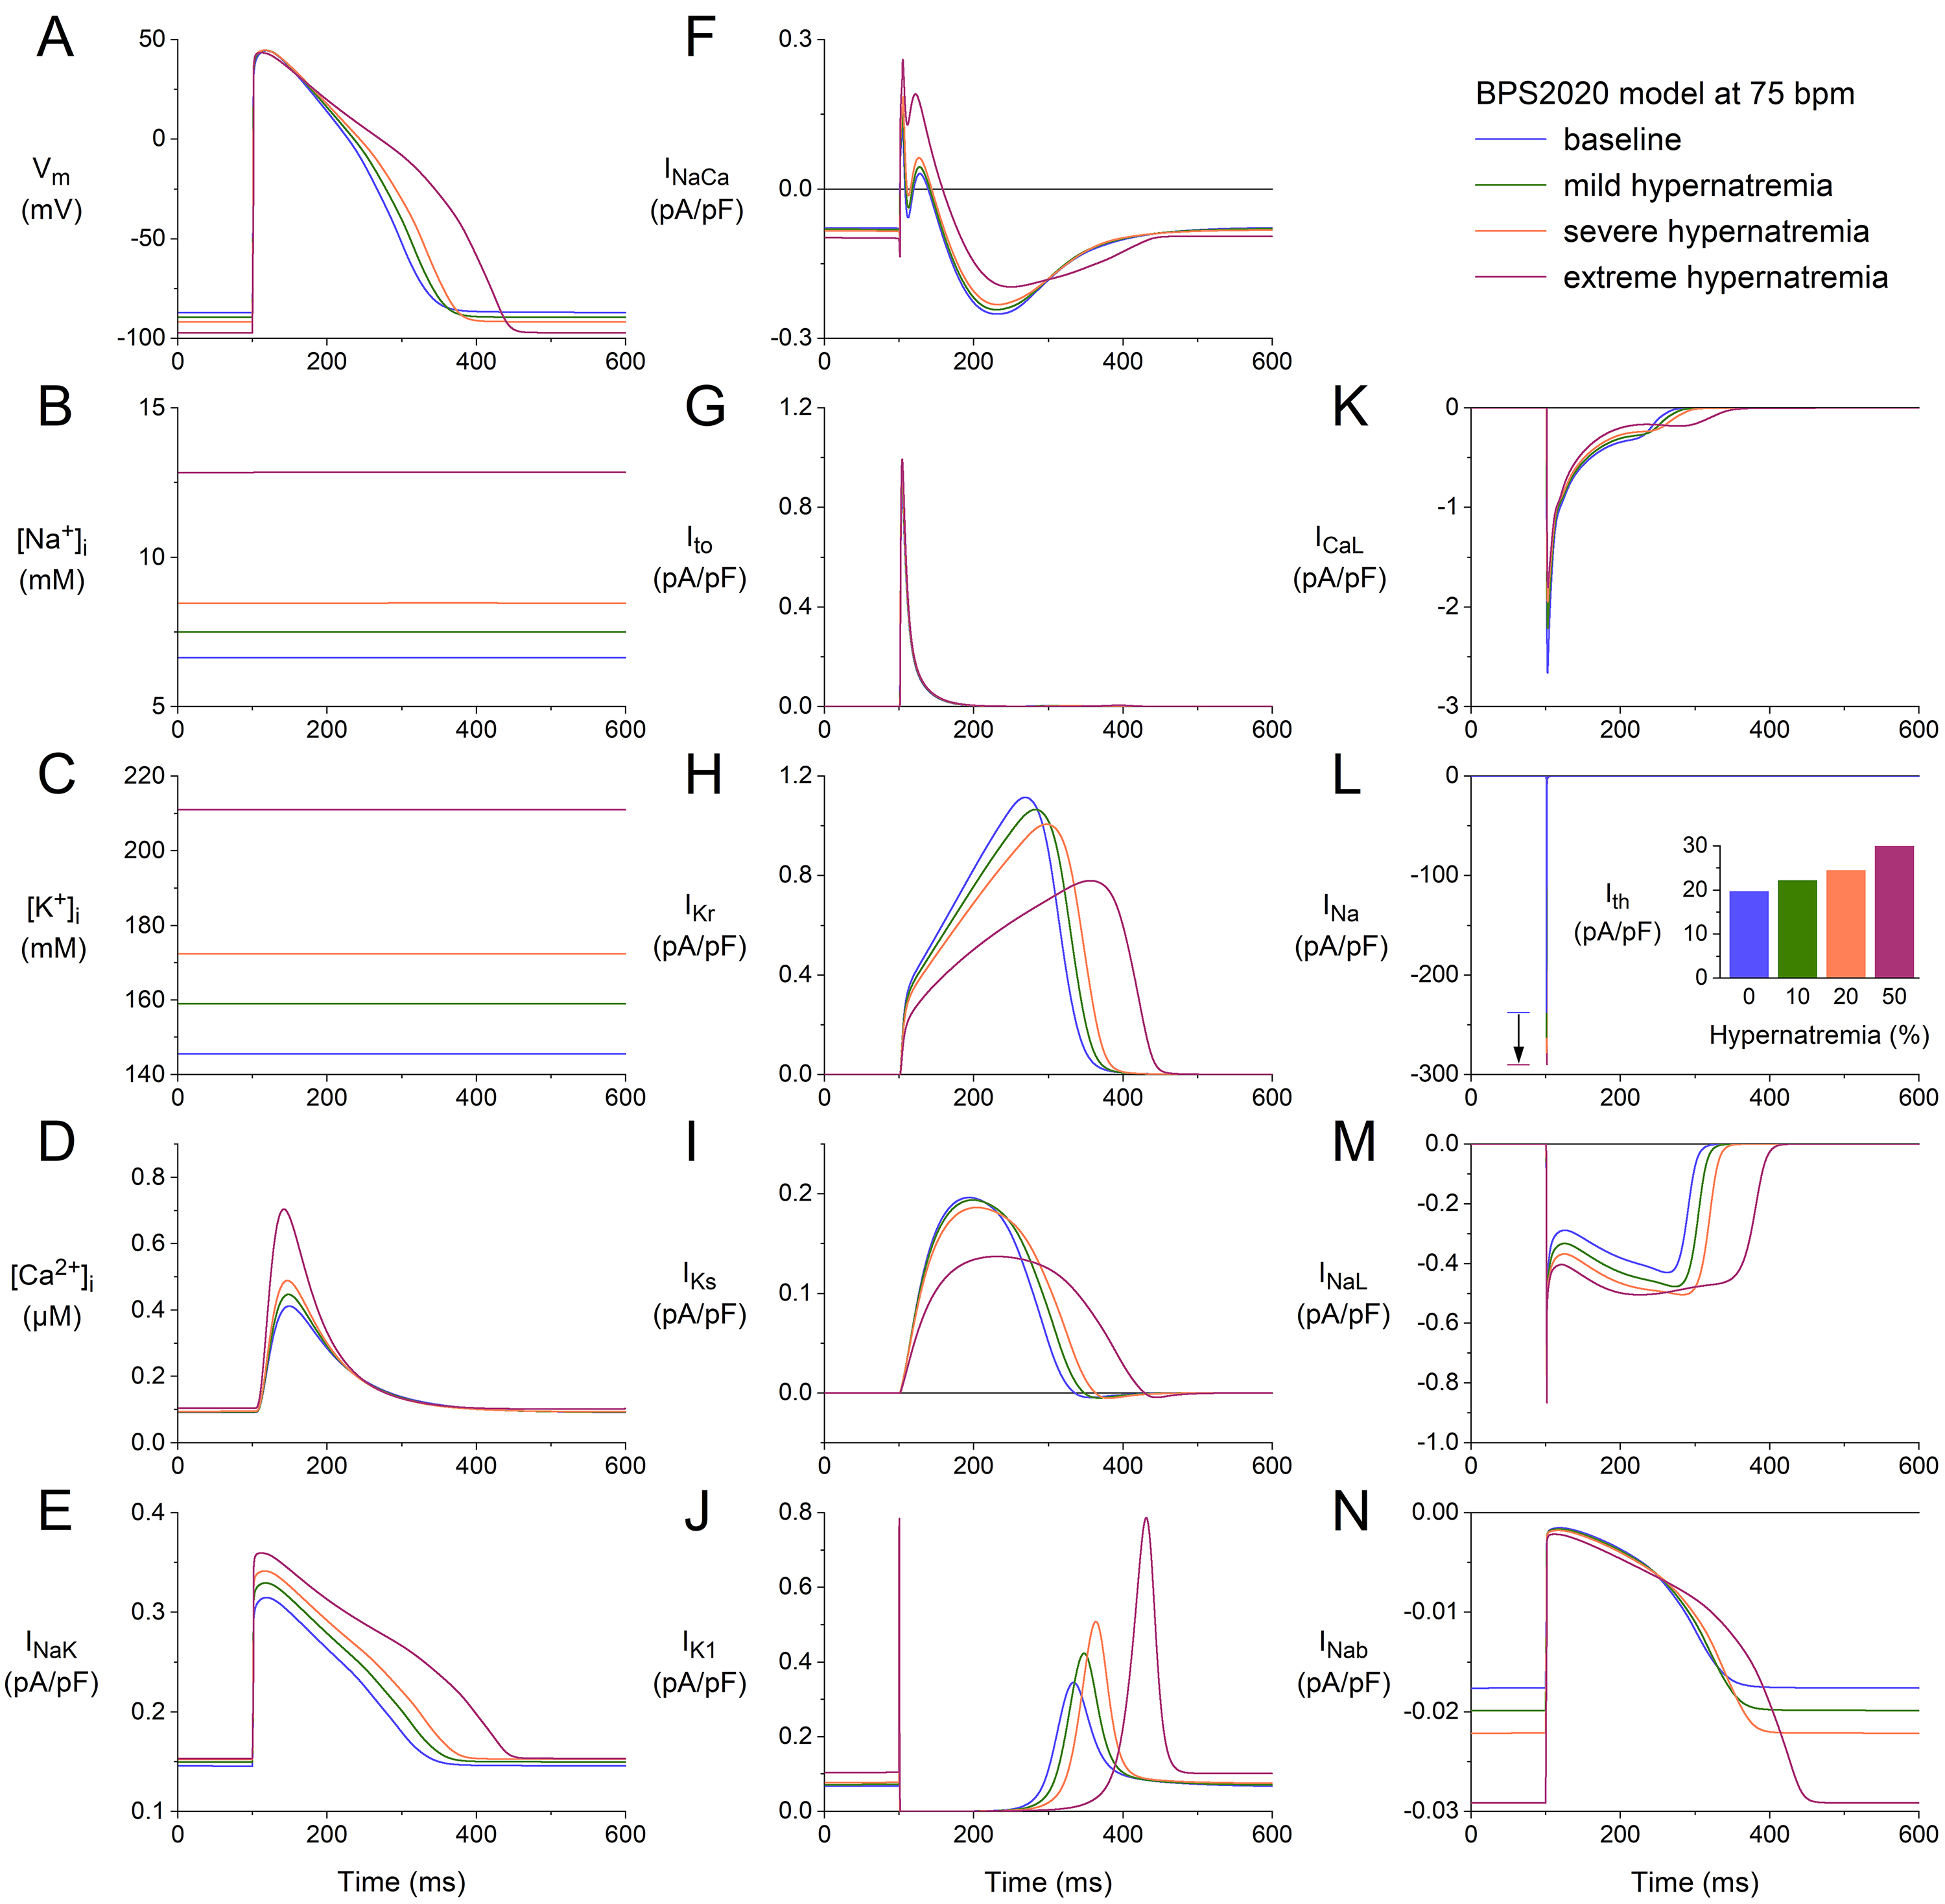 Fig. 2.
Effects of hypernatremia on the electrical activity of a single
human ventricular cardiomyocyte (BPS2020 model) at a beating rate of 75 bpm. (A)
V. (B) [Na]. (C) [K]. (D) [Ca]. (E)
I. (F) I. (G) I. (H) I. (I) I. (J)
I. (K) I. (L) I. The vertical arrow indicates the increase
in I amplitude with increasing levels of hypernatremia. (M) I. (N)
I. Axis scales are identical to those in Fig. 1. The inset to (L) shows
I at the different levels of hypernatremia. BPS2020, Bartolucci-Passini-Severi model as published in 2020; bpm, beats per minute.
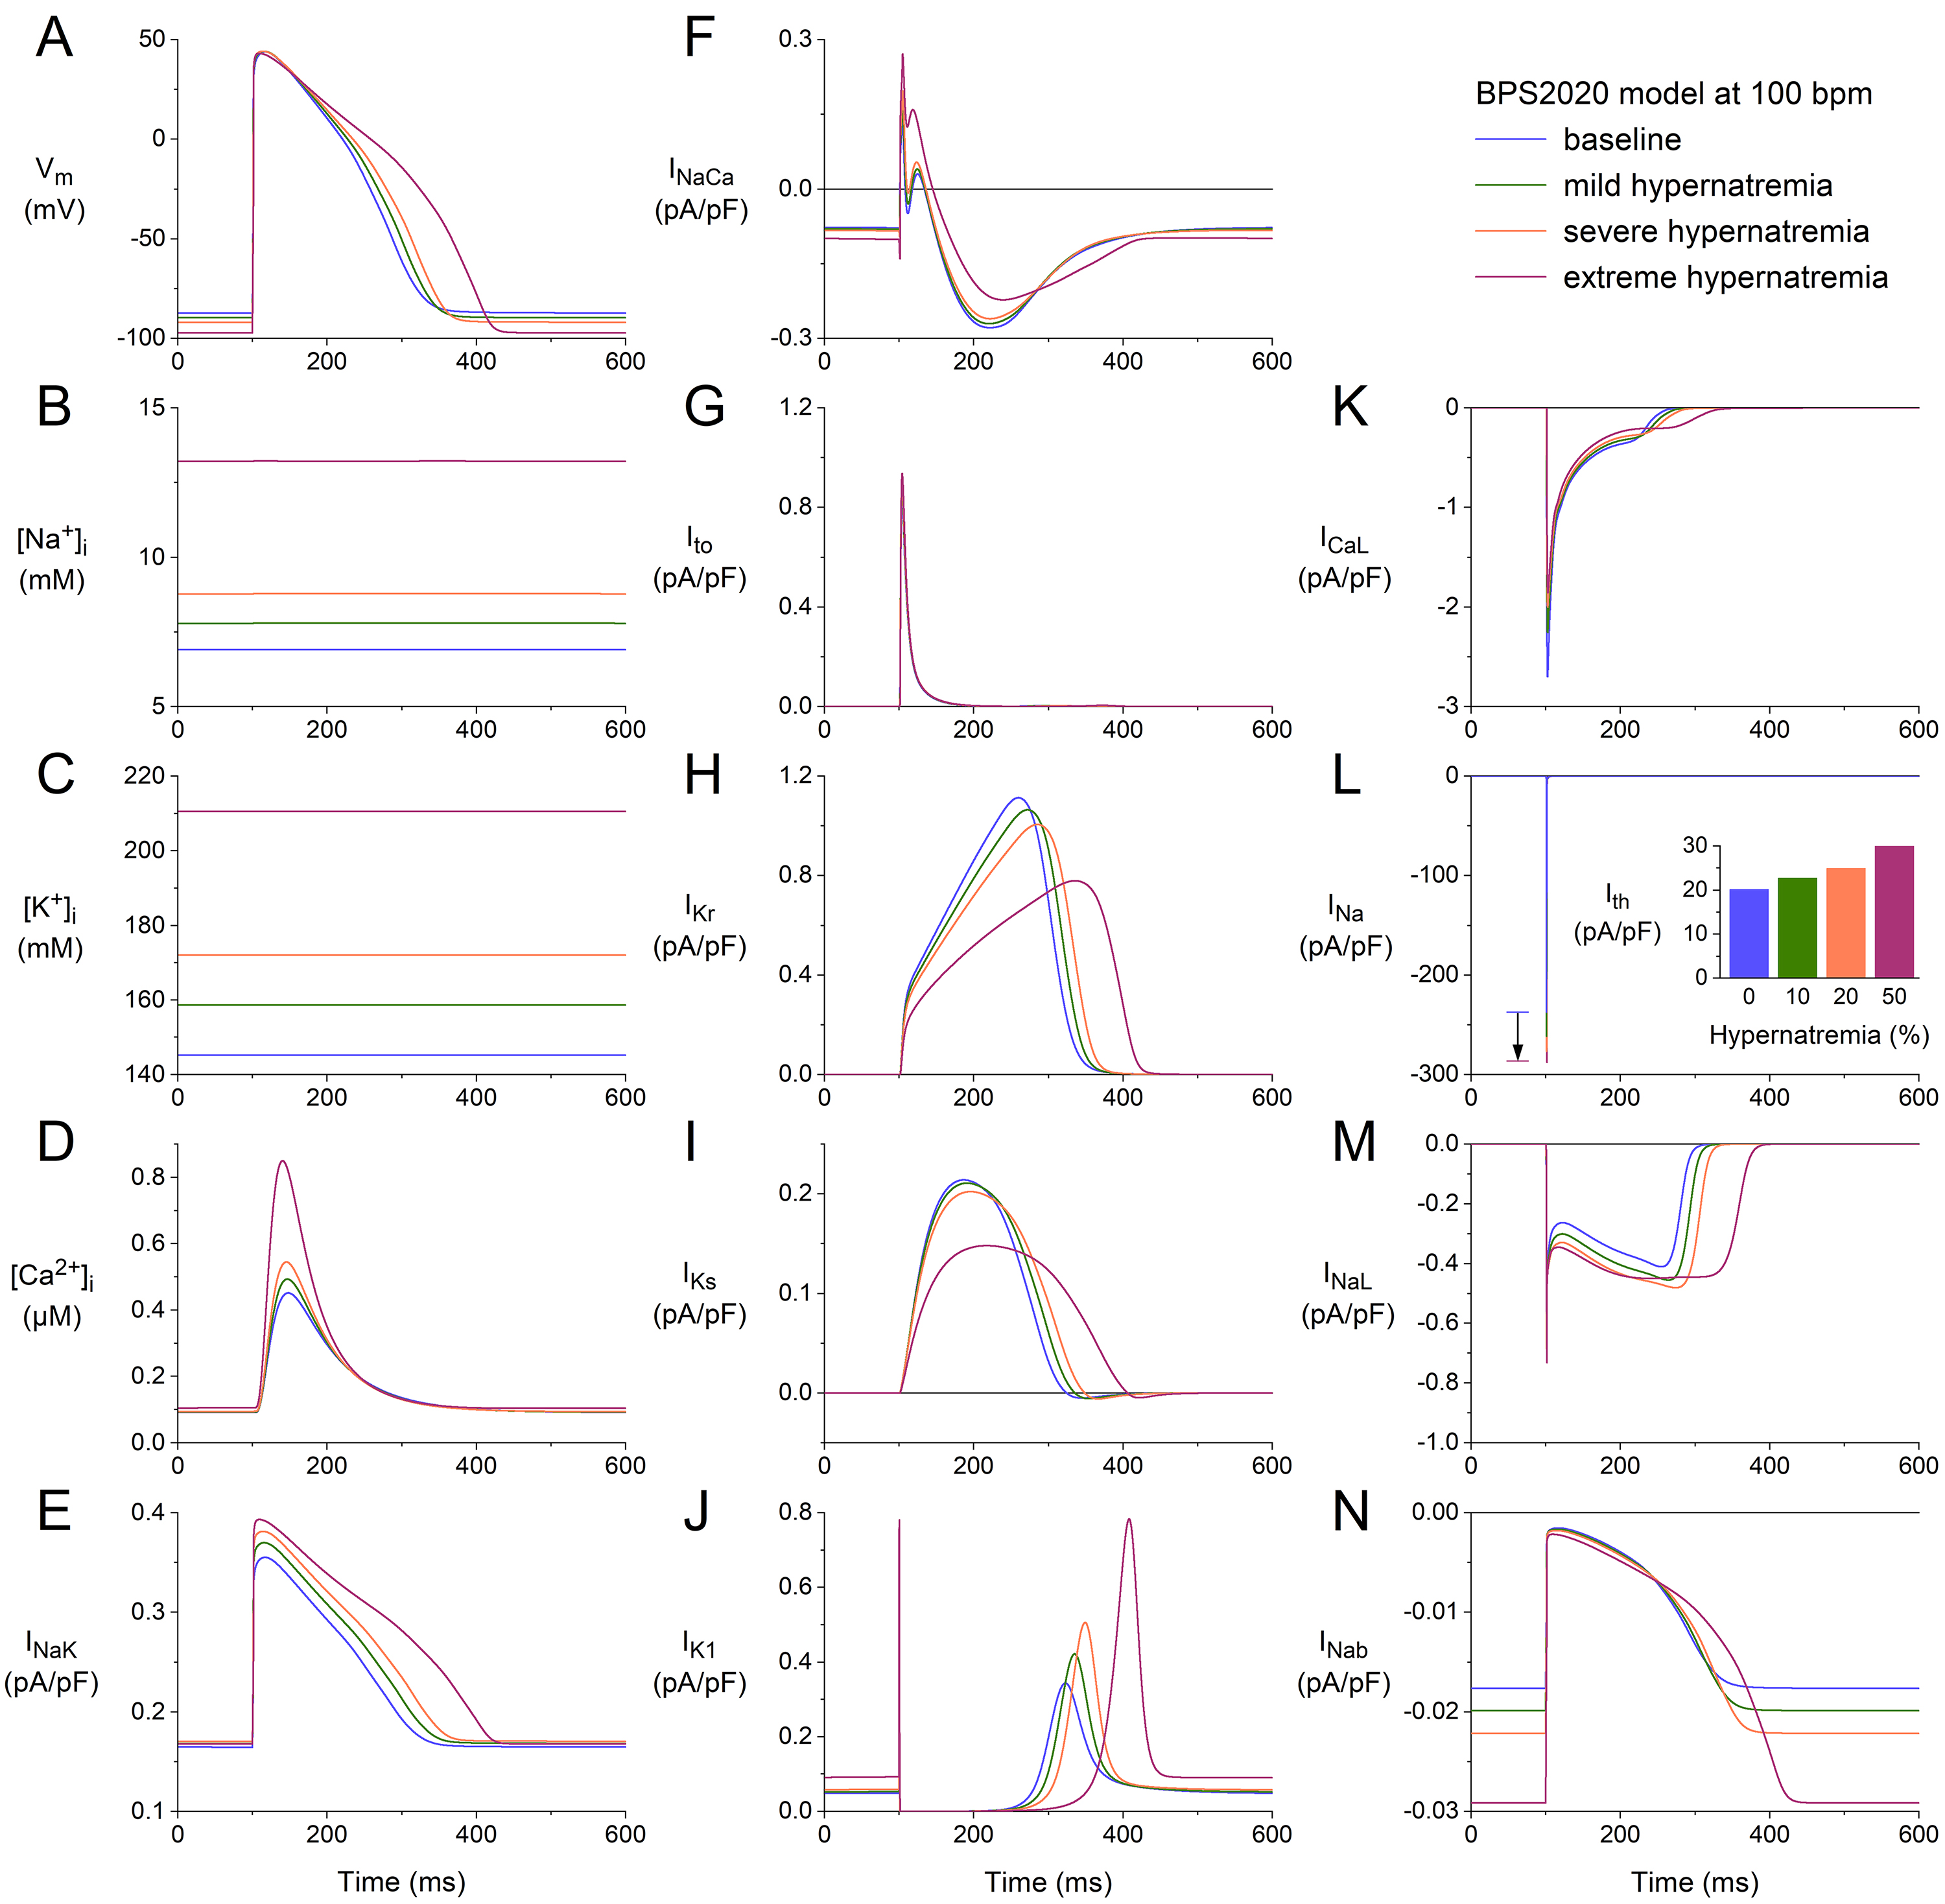 Fig. 3.
Effects of hypernatremia on the electrical activity of a single
human ventricular cardiomyocyte (BPS2020 model) at a beating rate of 100 bpm.
(A) V. (B) [Na]. (C) [K]. (D) [Ca].
(E) I. (F) I. (G) I. (H) I. (I) I. (J)
I. (K) I. (L) I. The vertical arrow indicates the increase
in I amplitude with increasing levels of hypernatremia. (M) I. (N)
I. Axis scales are identical to those in Figs. 1,2. The inset to (L)
shows I at the different levels of hypernatremia. BPS2020, Bartolucci-Passini-Severi model as published in 2020; bpm, beats per minute.
3.2 Effects of Hypernatremia in the ToR–ORd Model
As the Introduction mentions, the ToR–ORd and BPS2020 models can be considered
major updates of the O’Hara et al. [30] “ORd” model. Since the
ToR–ORd and BPS2020 models were developed largely independently and along
different lines, meaning the simulation results obtained with the two models are
not a priori highly similar, we repeated the above simulations using the
ToR–ORd model. This model has default values for the extracellular Na,
K, and Ca concentrations (denoted by [Na],
[K], and [Ca], respectively) of 140, 5.0, and 1.8
mmol/L, respectively, as opposed to 144, 5.4, and 2.7 mmol/L, respectively, in
the BPS2020 model. Furthermore, unlike the BPS2020 model, it includes a Cl
membrane current (I). However, the intracellular Cl concentration
cannot change dynamically, like [Na], [K], and
[Ca] can. The equations describing the time or voltage dependence of
individual membrane currents may differ between the two models. Moreover,
parameters in these equations, such as the fully activated conductance of a
specific current, may vary between the two models so that specific currents can
have larger or smaller amplitudes in the ToR–ORd model than in the BPS2020 model
and, thus, play a more or less important role in the ToR–ORd than in the BPS2020
model.
Fig. 4 shows the results obtained using the ToR–ORd model at a stimulation rate
of 50 min. The format and time scale are identical to those in Figs. 1,2,3.
However, not all of the ordinate scales are identical. Yet, without comparing the
ordinate scales, it is immediately clear that the APs from the ToR–ORd and
BPS2020 models differ in the presence of a notch. When comparing the ordinate
scales of Fig. 4G and Fig. 1G, it is clear that I is approximately five
times as large in the ToR–ORd model as in the BPS2020 model, giving way to a
faster early repolarization and associated AP notch. At the same time, a
comparison of the ordinate scales in Fig. 4I and Fig. 1I identifies that I
is almost one order of magnitude smaller in the ToR–ORd model than in the
BPS2020 model, which is important for our simulations because I is one of
the currents that is reduced by cell shrinkage per se. Other remarkable
differences are the [Na] level, which reaches 23.3 mmol/L in the
ToR–ORd model vs. 12.3 mmol/L in the BPS2020 model (Fig. 4B
vs. Fig. 1B), and the absence of an increase in the amplitude of
I with an increase in the level of hypernatremia (Fig. 4J vs.
Fig. 1J).
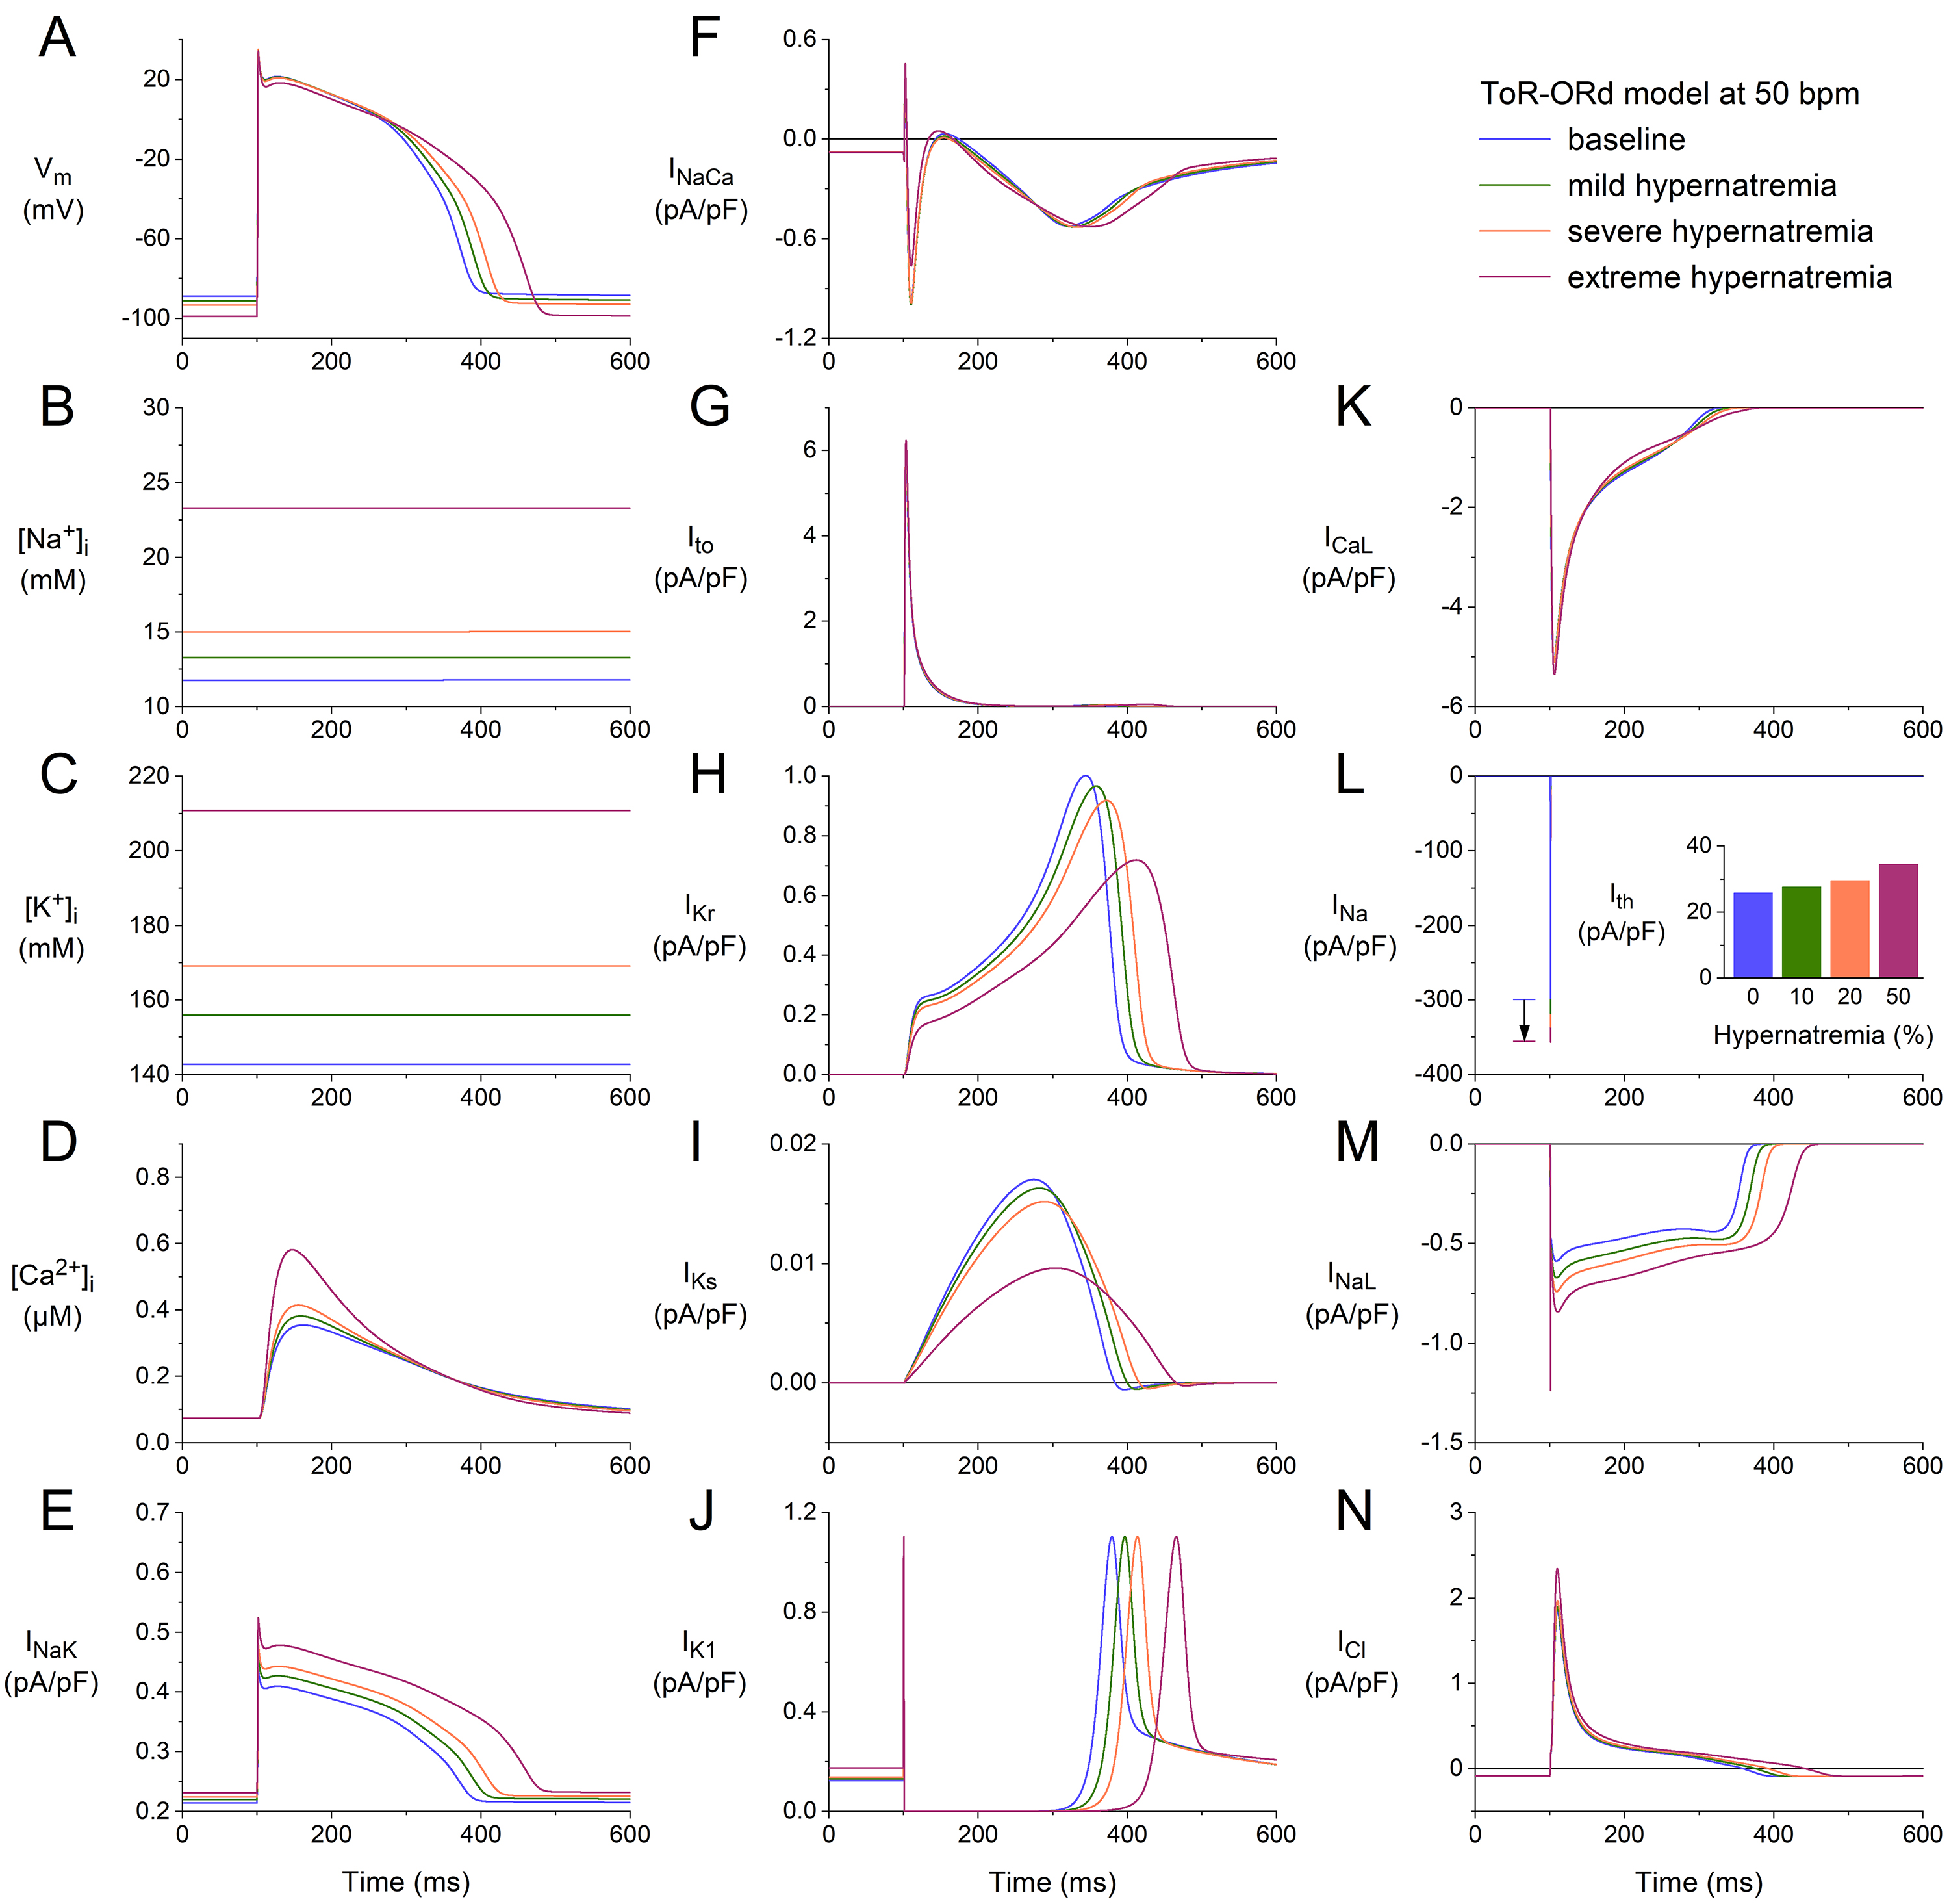 Fig. 4.
Effects of hypernatremia on the electrical activity of a single
human ventricular cardiomyocyte (ToR–ORd model) at a beating rate of 50 bpm.
(A) V. (B) [Na]. (C) [K]. (D) [Ca].
(E) I. (F) I. (G) I. (H) I. (I) I. (J)
I. (K) I. (L) I. The vertical arrow indicates the increase
in I amplitude with increasing levels of hypernatremia. (M) I. (N)
Chloride current (I). Note that the ordinate scales are not identical to
those in Figs. 1,2,3. The inset to (L) shows I at the different levels of
hypernatremia. ToR–ORd, Tomek–Rodriguez model following the O’Hara–Rudy dynamic model; bpm, beats per minute.
Despite the remarkable differences in [Na] level and some of the
individual membrane currents, the net effects of the hypernatremia on the AP
configuration are, at least qualitatively, quite similar to those observed using
the BPS2020 model. The hypernatremia-induced AP hyperpolarization amounts to 2.3,
4.4, and 10.1 mV under conditions of mild, severe, and extreme hypernatremia,
respectively, vs. values of 2.5, 4.8, and 10.3 mV in the BPS2020 model.
The APD was increased by 6, 12, and 30% under mild, severe, and extreme
hypernatremia conditions, whereas this prolongation amounted to 7, 14, and 46%,
respectively, in the BPS2020 model. The (dV/dt) was increased by 7,
11, and 12% under conditions of mild, severe, and extreme hypernatremia,
respectively, whereas this increase amounted to 11, 18, and 23%, respectively,
in the BPS2020 model. I showed an increase of 7, 15, and 34%,
respectively, which was 12, 25, and 55%, respectively, in the BPS2020 model.
We repeated our simulations using the ToR–ORd model at higher stimulation rates
of 75 and 100 min. The results obtained at these two rates (Figs. 5,6) are
qualitatively similar to those obtained at 50 min (Fig. 4). Rate-dependent
quantitative differences with respect to ion concentrations include a somewhat
higher level of [Na] (Figs. 4B,5B,6B), the substantially higher peak
amplitude of [Ca] (Figs. 4D,5D,6D), and a somewhat higher activity
by the Na–K pump (Figs. 4E,5E,6E). Rate-dependent quantitative
differences with respect to individual membrane currents include a slight
decrease in I, as observed with the BPS2020 model. However, the
rate-dependent increase in I is now only marginal (Figs. 4I,5I,6I). As
mentioned, there is no increase in I with increasing hypernatremia (Figs. 4J,5J,6J), in contrast to the BPS2020 model. This is due to differences in the
current-voltage relationship of this current between the two models. The
hypernatremia-induced AP hyperpolarization and prolongation observed at 50 bpm
(Fig. 4A) were also examined at 75 bpm (Fig. 5A) and 100 bpm (Fig. 6A). The same
holds for the hypernatremia-induced increase in I amplitude (Figs. 5L,6L)
and the associated increase in (dV/dt), and the
hypernatremia-induced increase in I (Fig. 5L, inset; Fig. 6L, inset).
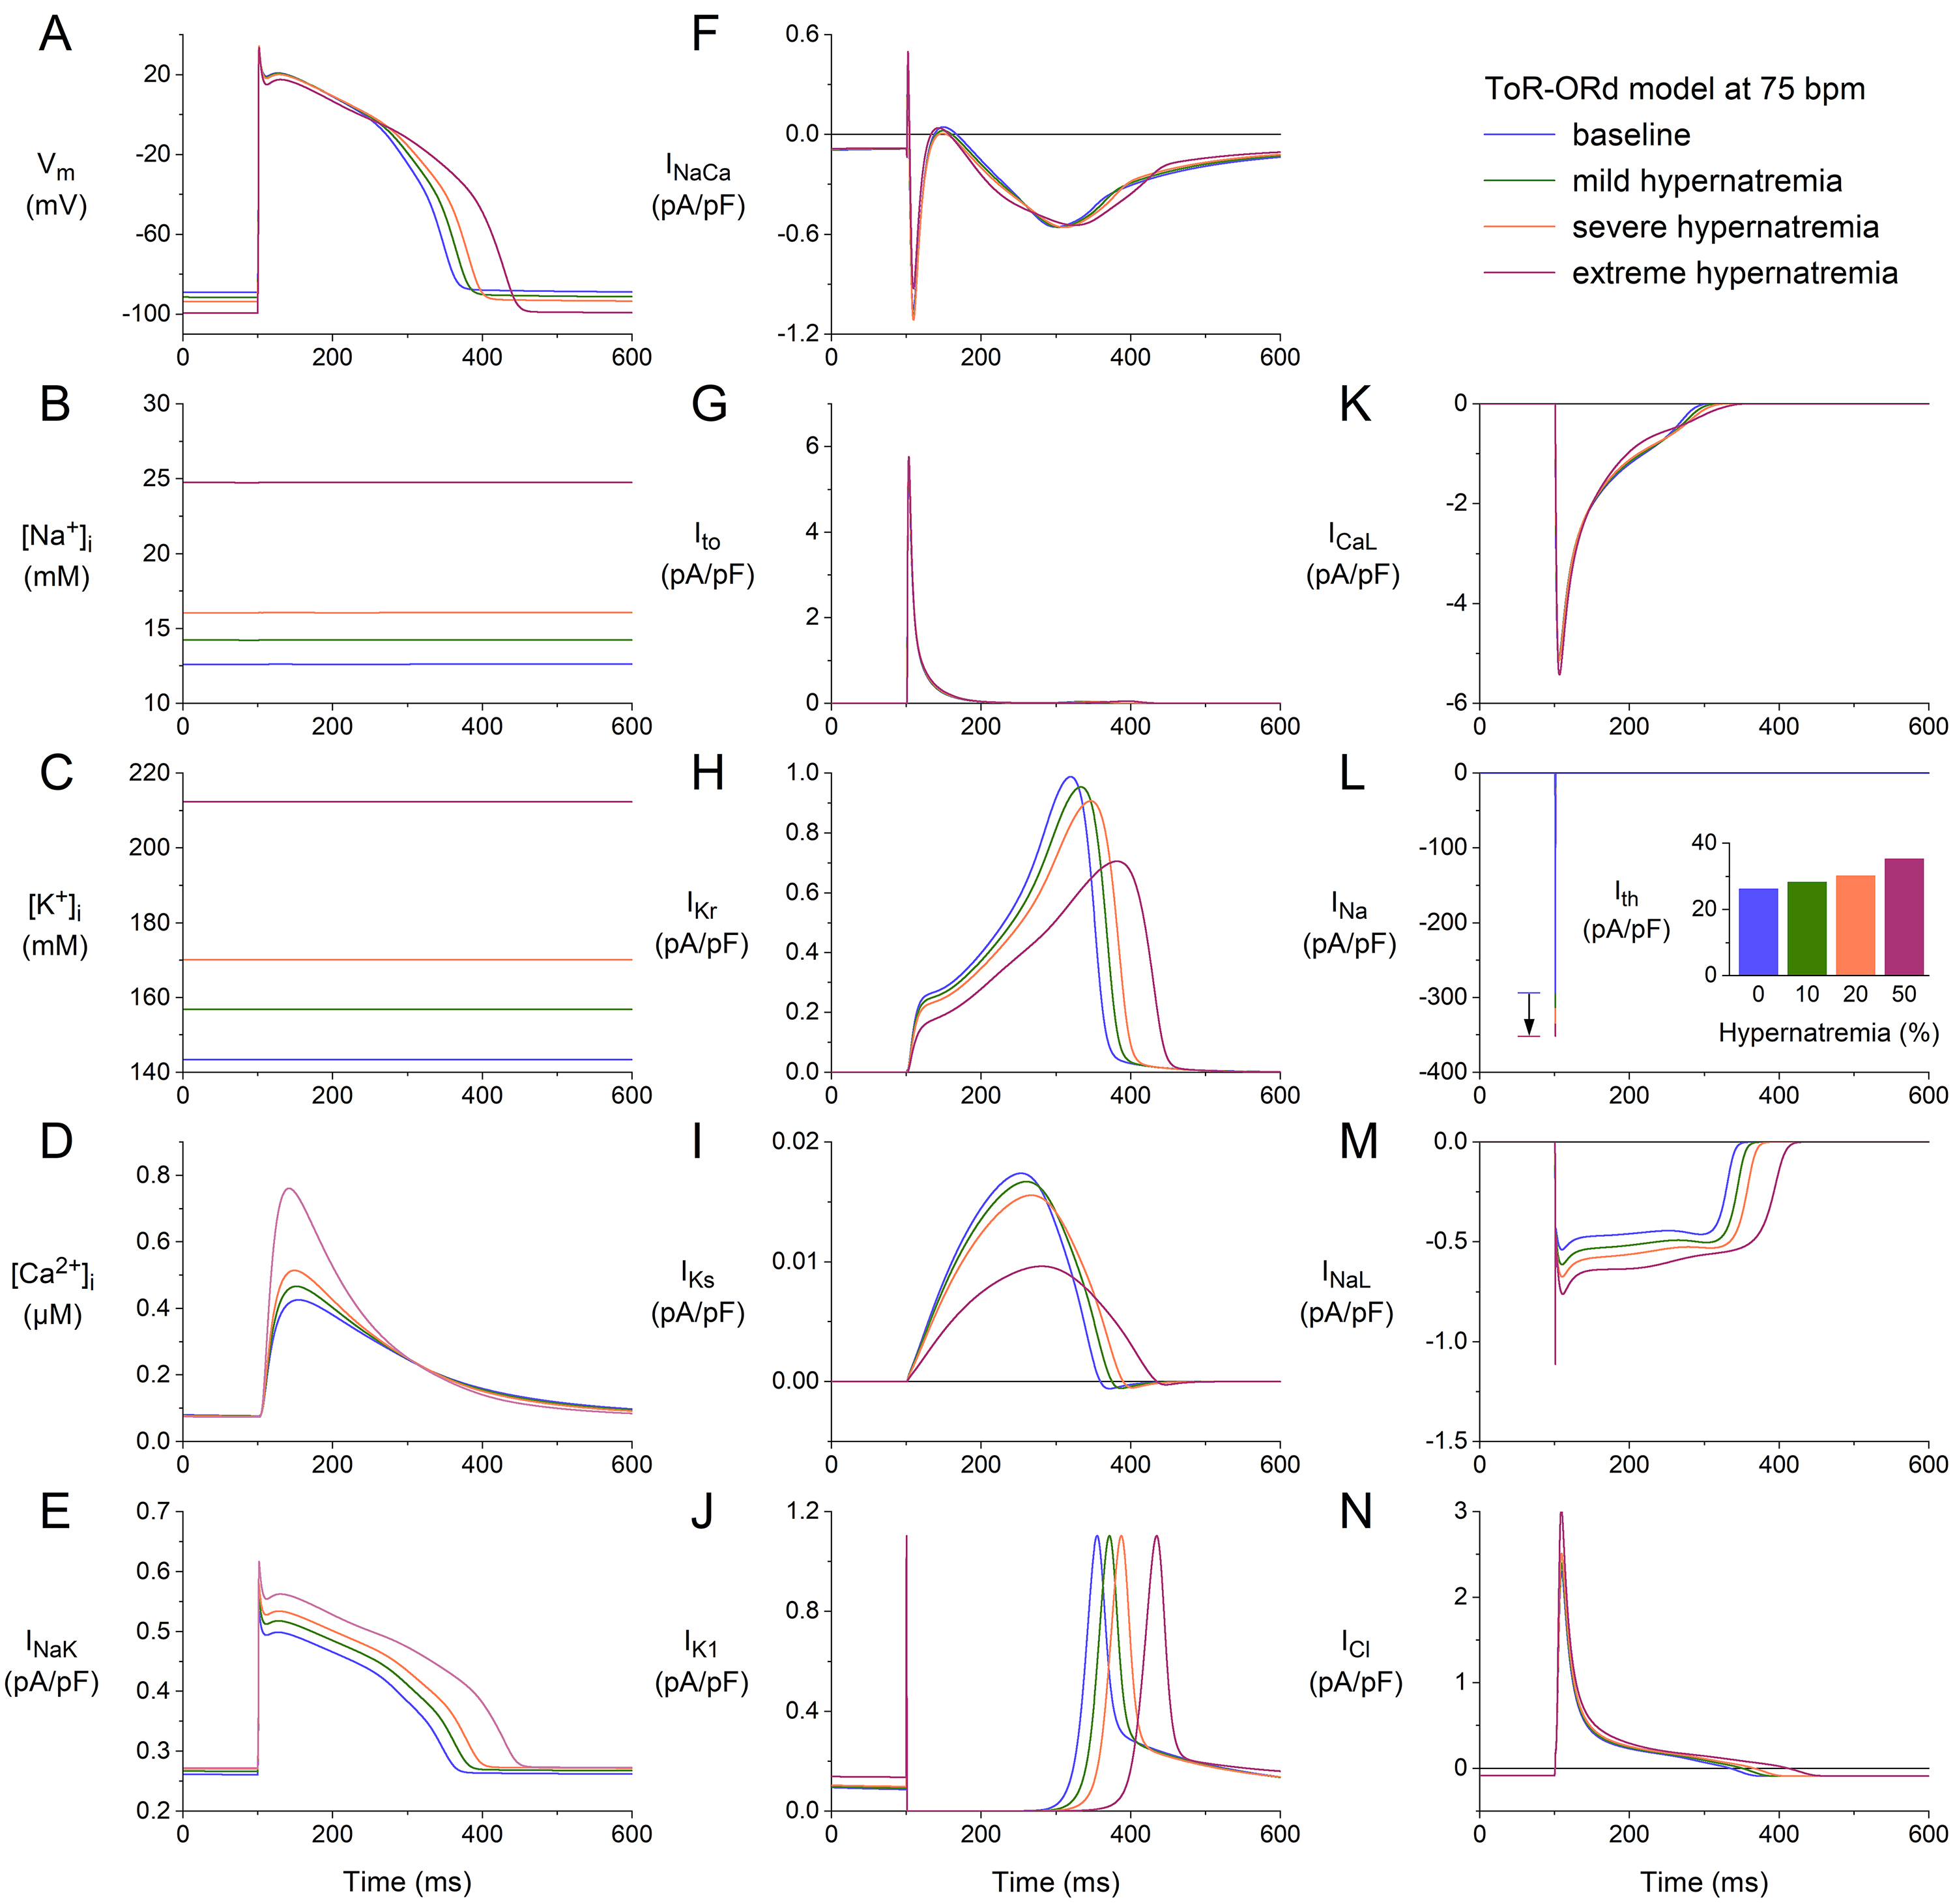 Fig. 5.
Effects of hypernatremia on the electrical activity of a single
human ventricular cardiomyocyte (ToR–ORd model) at a beating rate of 75 bpm.
(A) V. (B) [Na]. (C) [K]. (D) [Ca].
(E) I. (F) I. (G) I. (H) I. (I) I. (J)
I. (K) I. (L) I. The vertical arrow indicates the increase
in I amplitude with increasing levels of hypernatremia. (M) I. (N)
I. Axis scales are identical to those in Fig. 4. The inset to (L) shows
I at the different levels of hypernatremia. ToR–ORd, Tomek–Rodriguez model following the O’Hara–Rudy dynamic model; bpm, beats per minute.
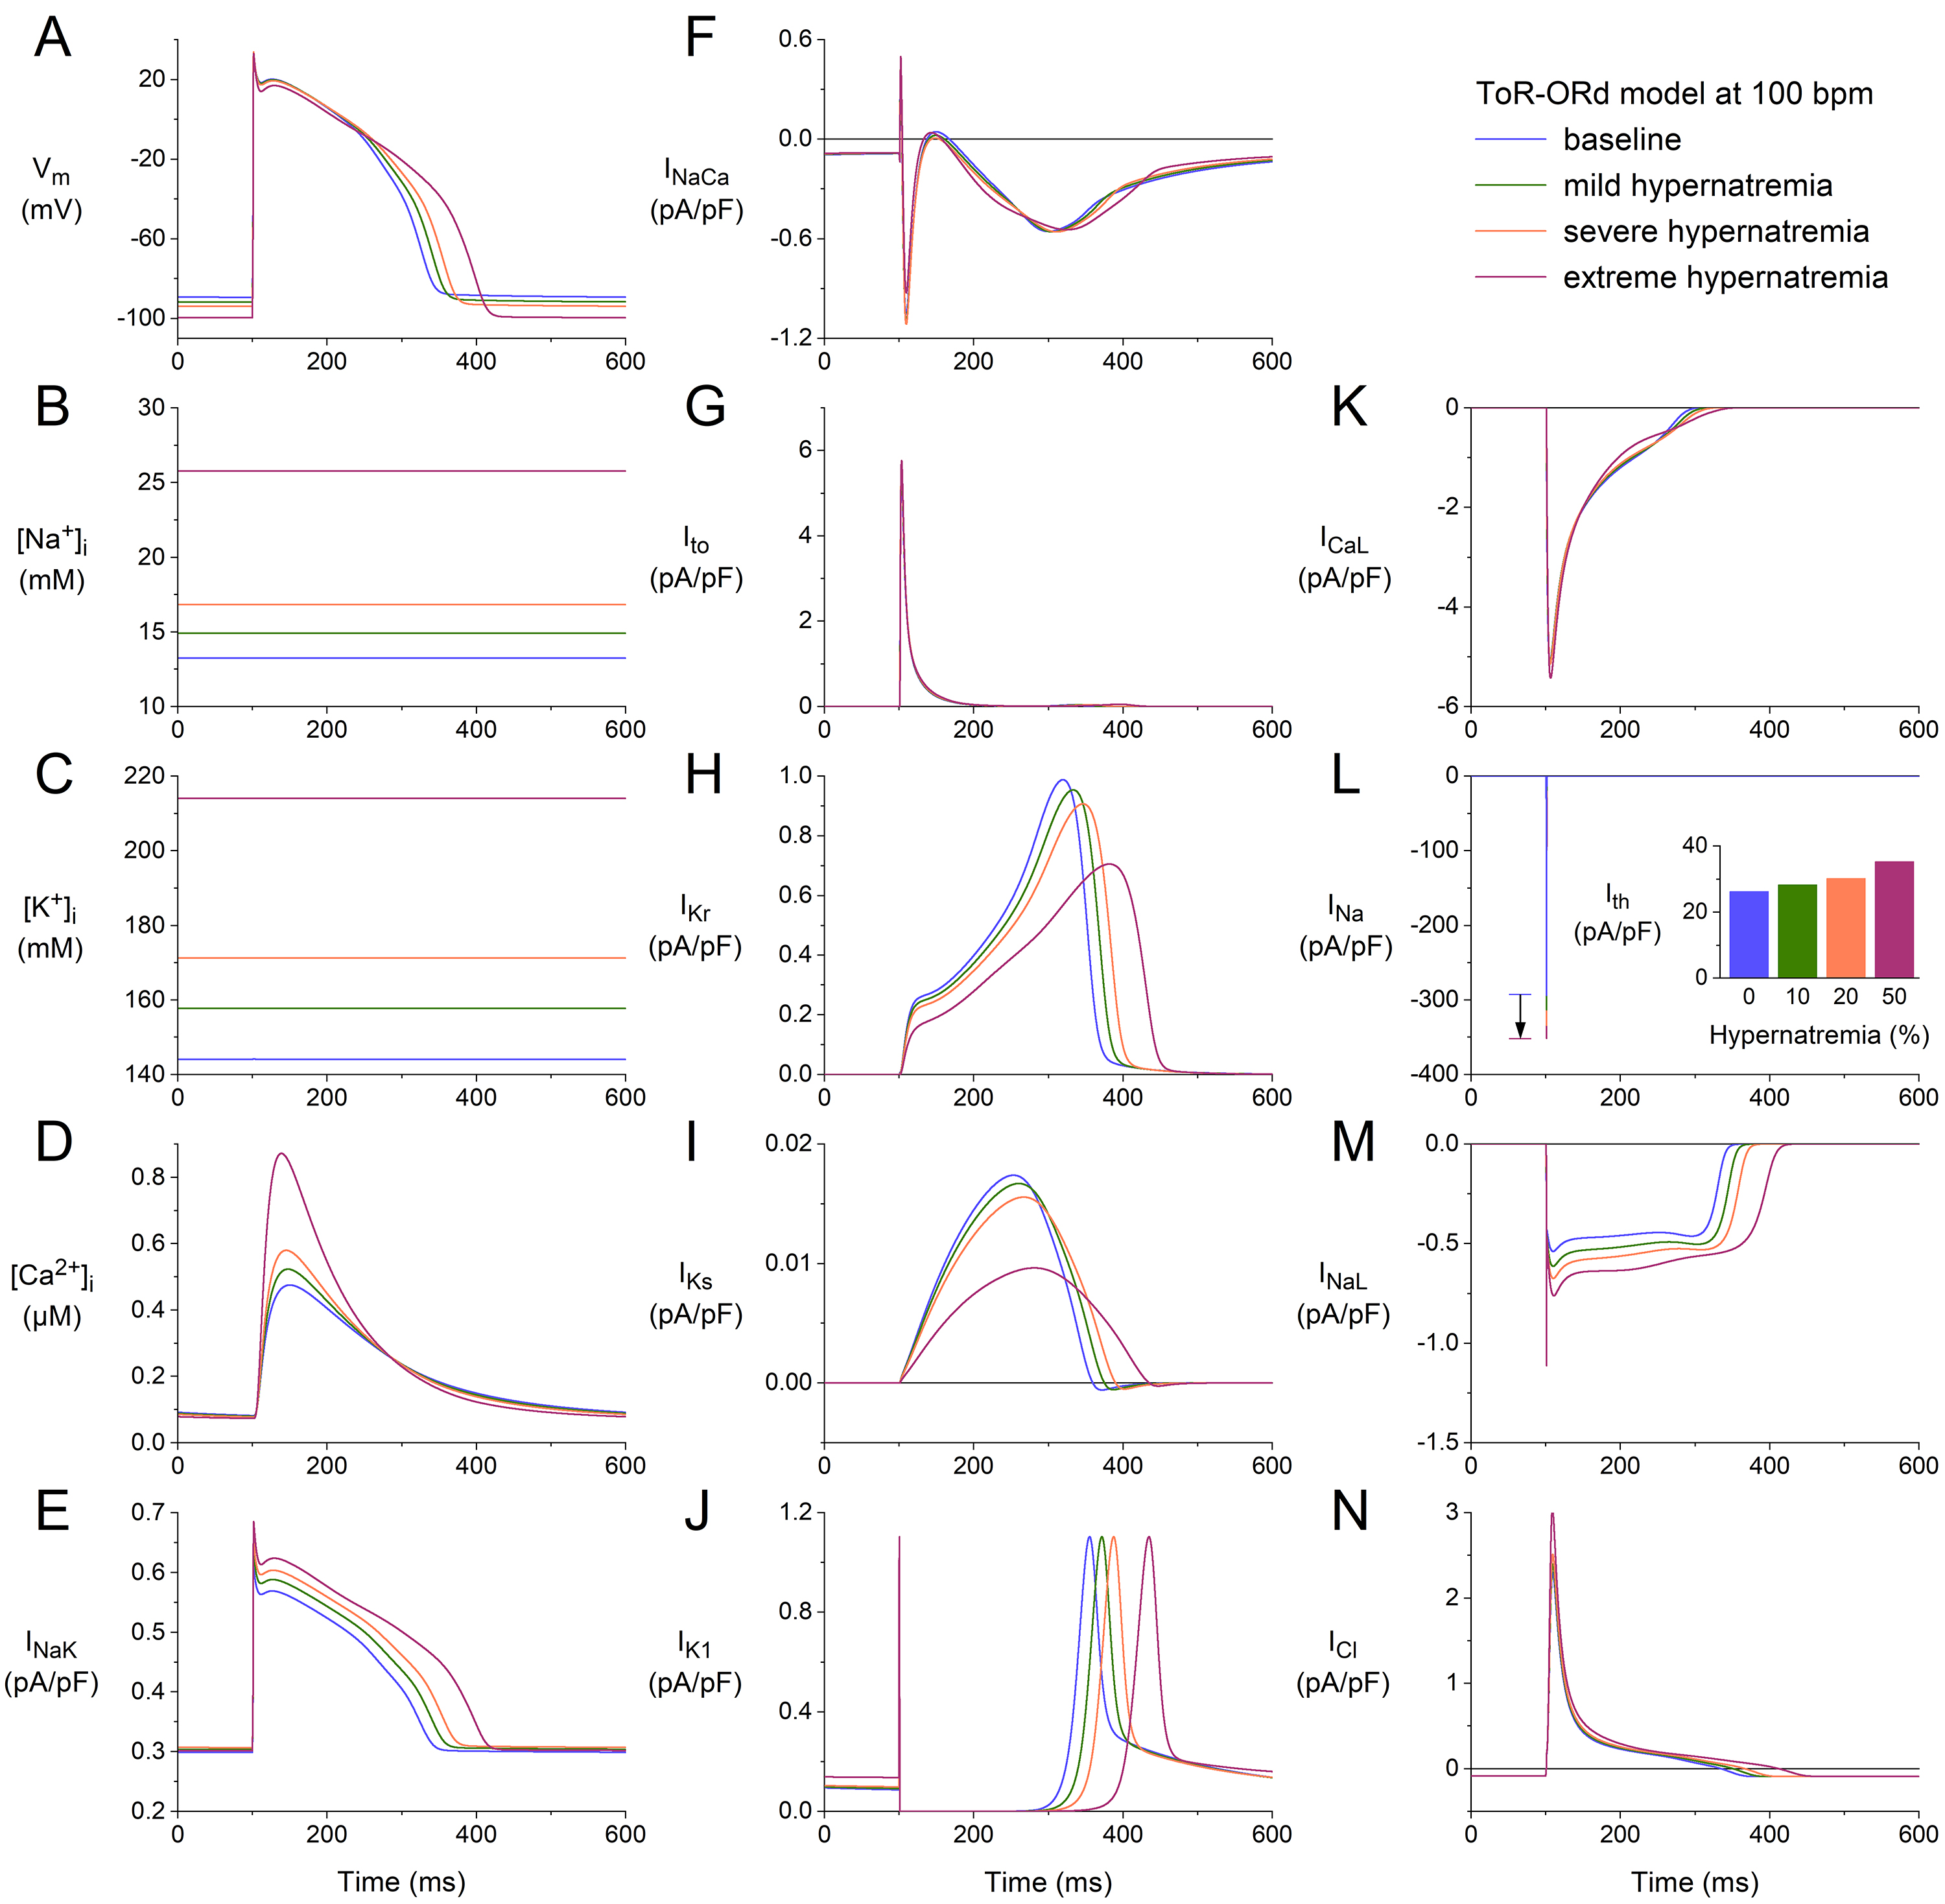 Fig. 6.
Effects of hypernatremia on the electrical activity of a single
human ventricular cardiomyocyte (ToR–ORd model) at a beating rate of 100 bpm.
(A) V. (B) [Na]. (C) [K]. (D) [Ca].
(E) I. (F) I. (G) I. (H) I. (I) I. (J)
I. (K) I. (L) I. The vertical arrow indicates the increase
in I amplitude with increasing levels of hypernatremia. (M) I. (N)
I. Axis scales are identical to those in Figs. 4,5. The inset to (L) shows
I at the different levels of hypernatremia. ToR–ORd, Tomek–Rodriguez model following the O’Hara–Rudy dynamic model; bpm, beats per minute.
3.3 Summary of the Effects of Hypernatremia
The effects of hypernatremia in the two models of a single human ventricular
cardiomyocyte are summarized in Figs. 7,8.
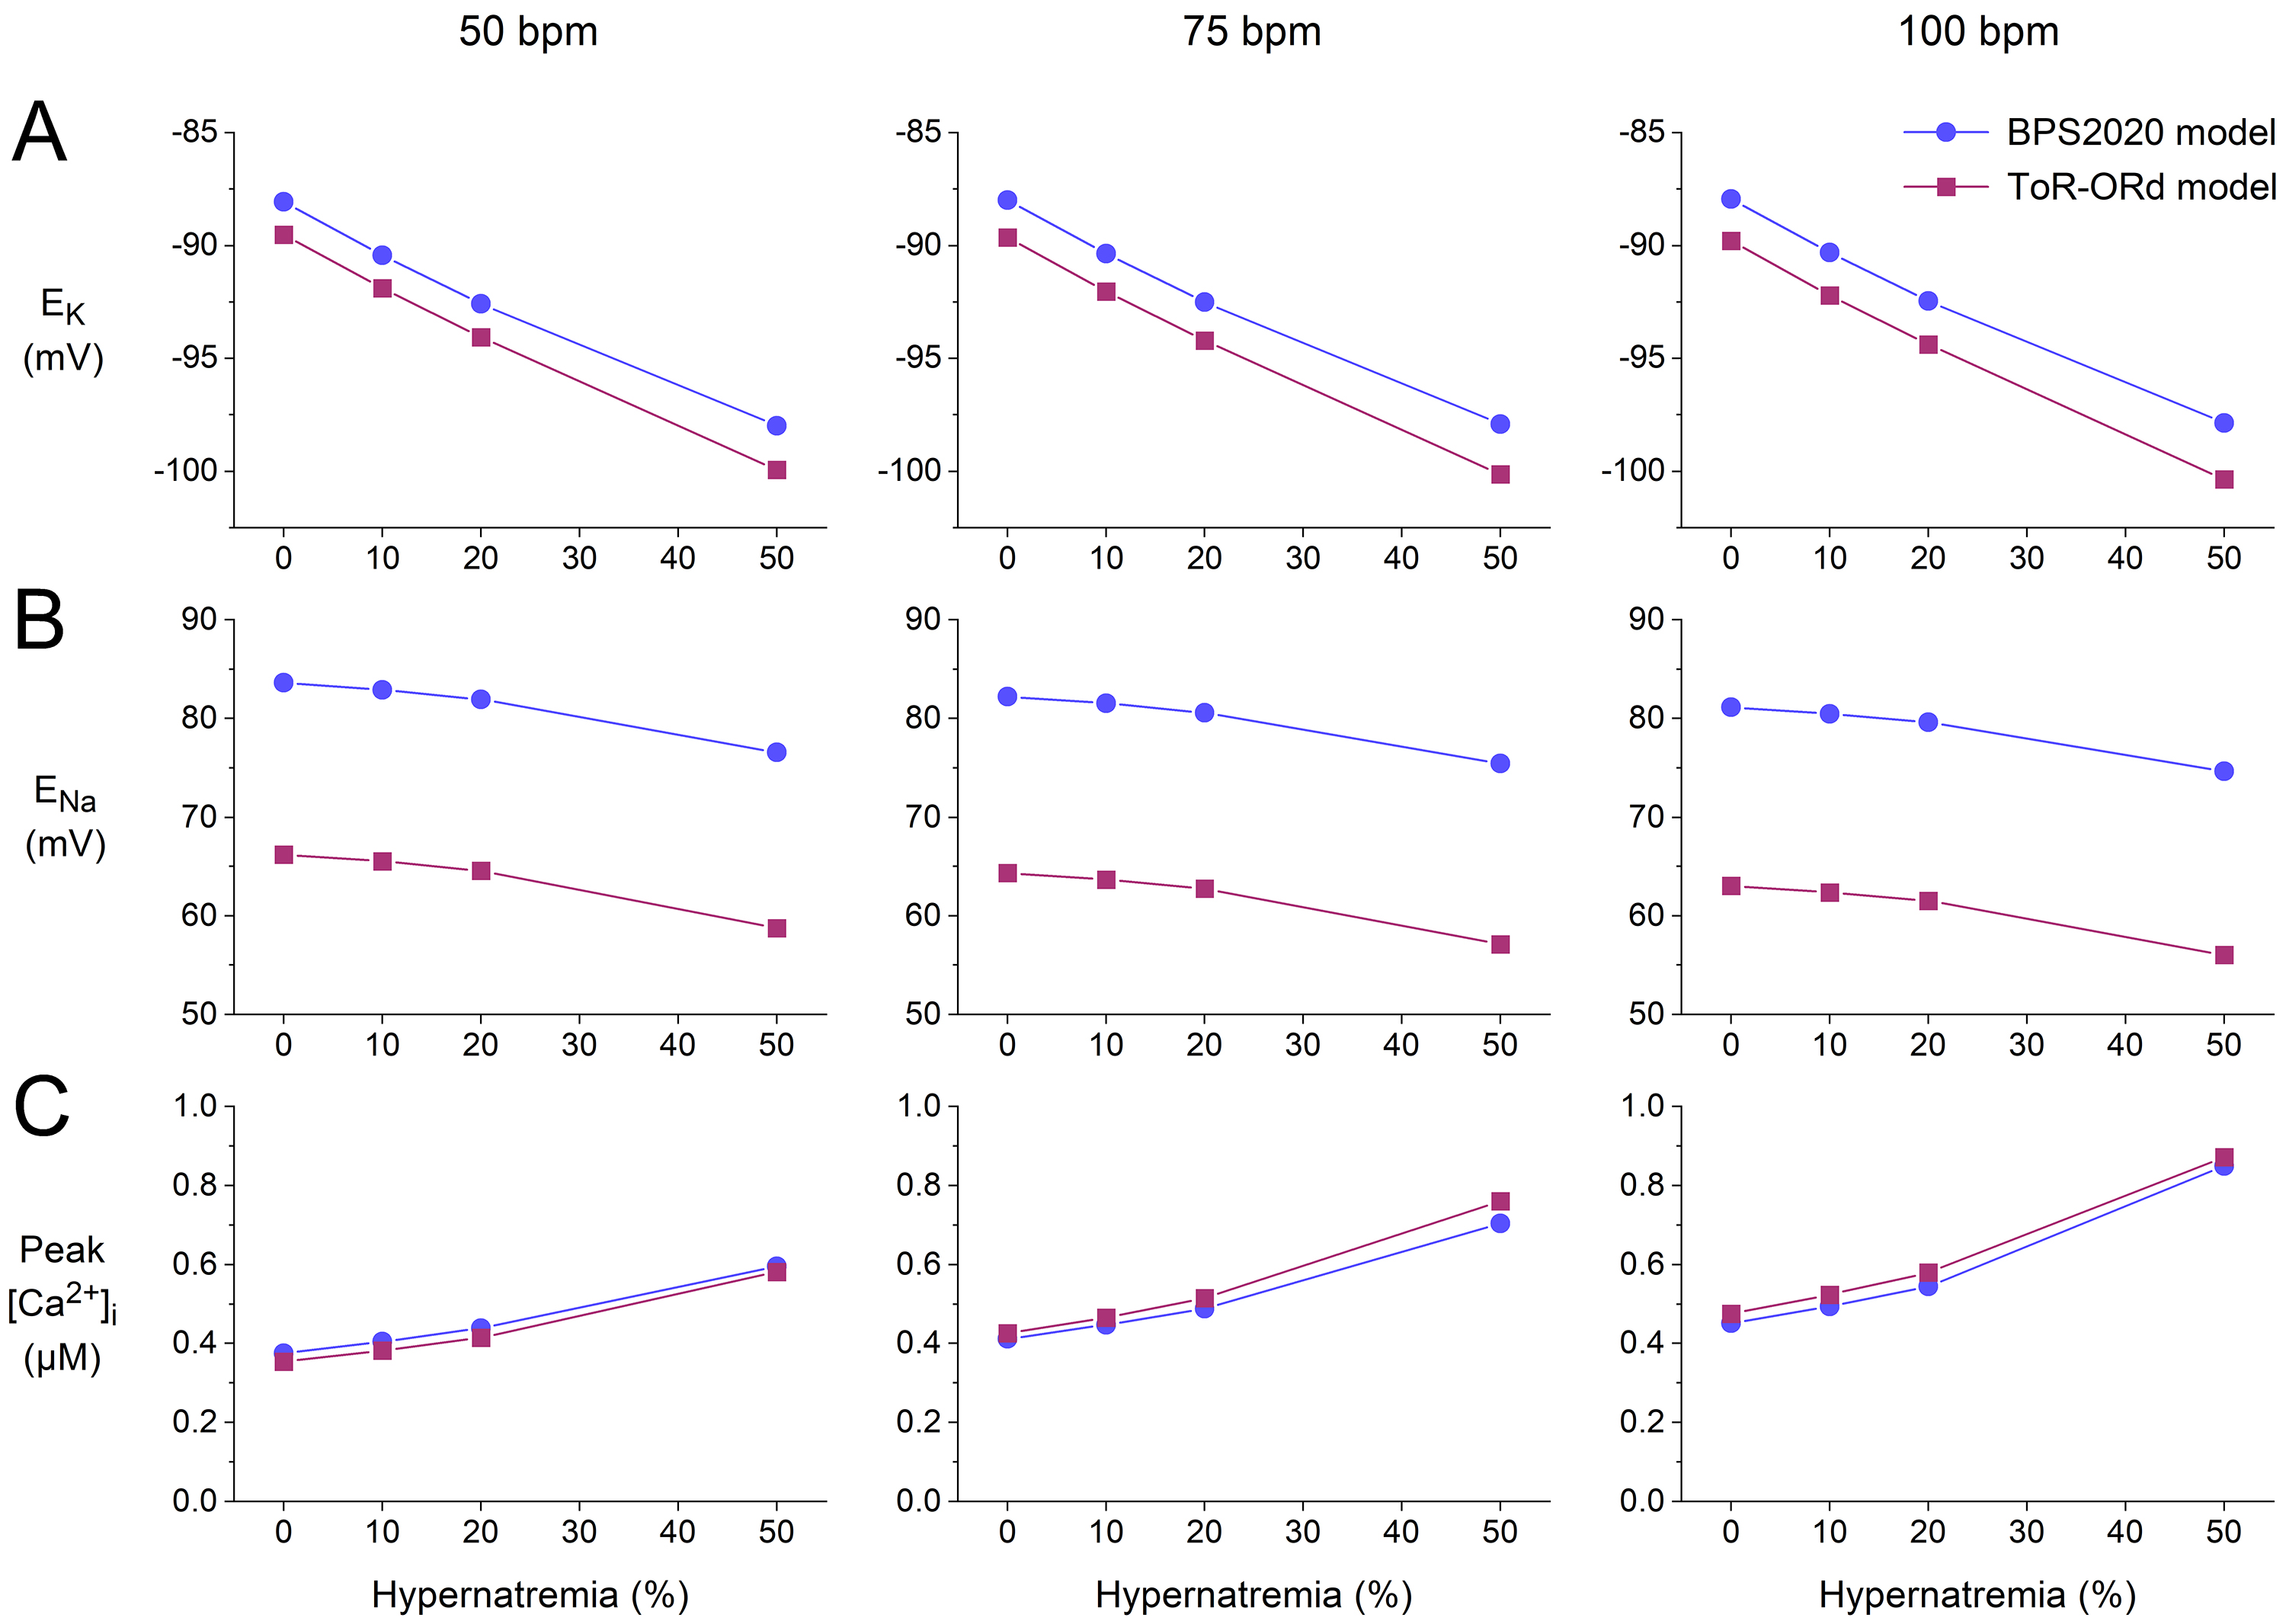 Fig. 7.
Effects of hypernatremia on the sodium and potassium equilibrium
potentials and the peak intracellular calcium concentration in the BPS2020 and
ToR–ORd models of a single human ventricular cardiomyocyte. (A) K
equilibrium potential (E) as a function of hypernatremia at stimulation
rates of, from left to right, 50, 75, and 100 min. (B) Na
equilibrium potential (E) as a function of hypernatremia at 50, 75, and
100 min stimulation rates. (C) The peak amplitude of [Ca] as
a function of hypernatremia at 50, 75, and 100 min stimulation rates. Data
from the BPS2020 and ToR–ORd models are shown by filled blue circles and filled
purple squares, respectively. ToR–ORd, Tomek–Rodriguez model following the O’Hara–Rudy dynamic model; BPS2020, Bartolucci-Passini-Severi model as published in 2020; bpm, beats per minute.
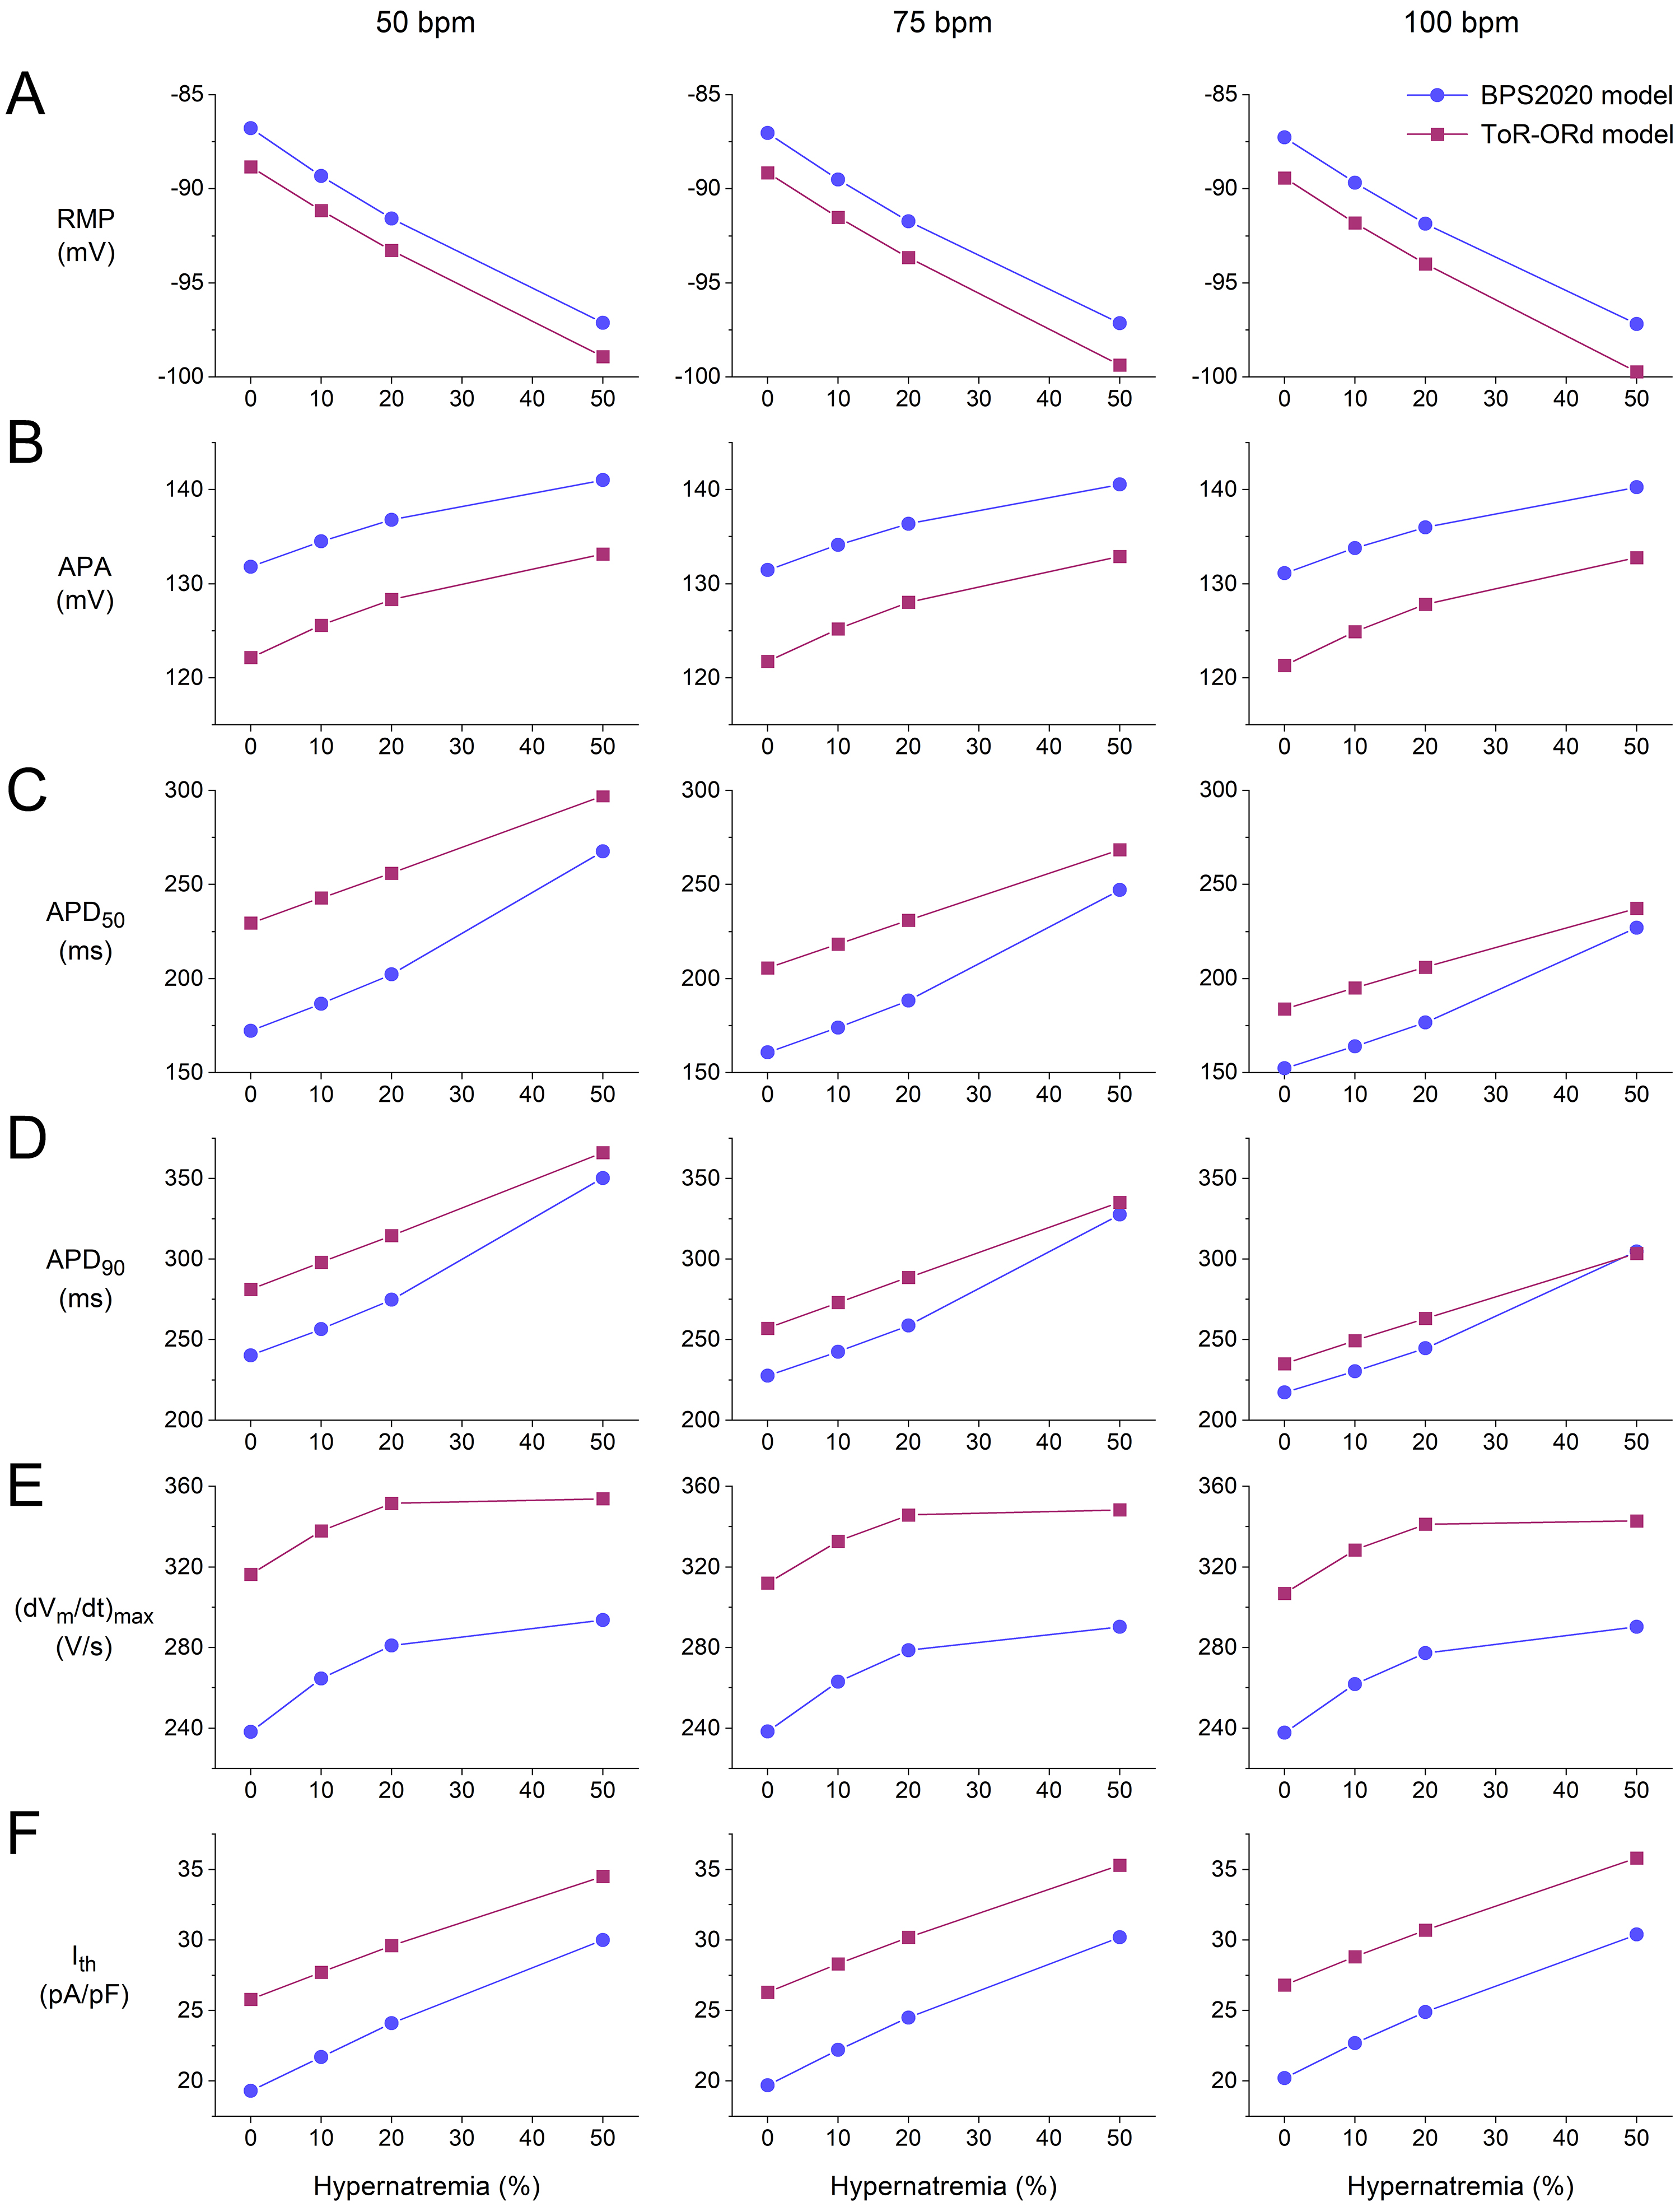 Fig. 8.
Action potential (AP) parameters and threshold stimulus current
of the BPS2020 and ToR–ORd models of a single human ventricular cardiomyocyte.
(A) Resting membrane potential (RMP) as a function of hypernatremia at left to
right, 50, 75, and 100 min stimulation rates. (B) AP amplitude (APA) as a
function of hypernatremia at stimulation rates of 50, 75, and 100 min. (C)
AP duration at 50% repolarization (APD) as a function of hypernatremia at
stimulation rates of 50, 75, and 100 min. (D) AP duration at 90%
repolarization (APD) as a function of hypernatremia at stimulation rates
of 50, 75, and 100 min. (E) Maximum AP upstroke velocity
((dV/dt)) as a function of hypernatremia at stimulation rates of
50, 75, and 100 min. (F) I as a function of hypernatremia at
stimulation rates of 50, 75, and 100 min. Data from the BPS2020 and
ToR–ORd models are shown by filled blue circles and filled purple squares,
respectively. ToR–ORd, Tomek–Rodriguez model following the O’Hara–Rudy dynamic model; BPS2020, Bartolucci-Passini-Severi model as published in 2020; bpm, beats per minute.
In both models, the K and Na equilibrium potentials (E and
E, respectively), as computed from the extracellular and intracellular
K and Na concentrations, show a hyperpolarization, with a similar
dependence on the level of hypernatremia at each of the stimulation rates tested
(Fig. 7A,B). The hyperpolarization of E underlies the hypernatremia-induced
hyperpolarization of the RMP in the two models. The hyperpolarization of E
and E is associated with changes in the driving force of individual
membrane currents, which should be considered when studying the effects of
hypernatremia on these currents, as performed in our simulations. Both models
show a substantial increase in the peak amplitude of [Ca] with
increasing levels of hypernatremia (Fig. 7C). At each of the beating rates
tested, the two models show a highly similar dependence of this [Ca]
peak amplitude on the level of hypernatremia.
Fig. 8 shows how the AP parameters and I of the BPS2020 and ToR–ORd
model cardiomyocytes depend on the level of hypernatremia at each of the
stimulation rates tested. As already noted, the resting membrane potential (RMP) shows a hyperpolarization
that increases with increasing hypernatremia (Fig. 8A). This hyperpolarization is
largely responsible for the observed increase in AP amplitude (APA; Fig. 8B). The
hypernatremia-induced AP prolongation does not only translate into a
hypernatremia-dependent increase in APD (Fig. 8D), as already noted in
Sections 3.1 and 3.2, but also into a hypernatremia-dependent increase in the APD
at 50% repolarization (APD; Fig. 8C).
Fig. 8E demonstrates how (dV/dt) increases with increasing
hypernatremia, reflecting the hypernatremia-induced increase in I
amplitude. This increase was only small between 20 and 50% of the
hypernatremia, particularly in the case of the ToR–ORd model, whereas I
shows an almost linear dependence on the level of hypernatremia over the entire
range of the hypernatremia tested. Consequently, AP conduction will be impaired
at 50% hypernatremia as compared to lower levels of hypernatremia, provided that
this high level of hypernatremia does not affect AP conduction in other ways,
e.g., by cell shrinkage-induced structural perturbations of the nanodomains at
the intercalated disks which are involved in cardiac conduction, and because of
the localization of Na channels in the intercalated disks [35, 36].
3.4 Effects of Scaling I
As noted in the Introduction, there is an apparent discrepancy in the
experimental data on the effects of acute exposure to a hyperosmotic solution on
I (Table 1). Therefore, we repeated some of our simulations using
I scaling factors other than the factor of 1.00, which was used in the
simulations presented in Figs. 1,2,3,4,5,6,7,8. We selected the extreme case of 50%
hypernatremia, where the effects are the most pronounced, and simulated both a
decrease in I with a scaling factor of 0.72 and an increase with a
scaling factor of 1.45. These scaling factors were derived from the experimental
data of Ogura et al. [20] and Luo et al. [27], respectively
(Table 1), disregarding our argument in the Introduction that the decrease in
I amplitude in the study of Ogura et al. [20] was due to a rapid
increase in [Ca] rather than a direct functional effect of the
hyperosmosis on the I channels.
The results of our simulations are shown in Fig. 9, focusing on the effects on
I and the associated effects on [Ca] and I. In both
models, increasing the I scaling factor from 1.00 to 1.45 resulted in an
increase in the inward peak of I (Fig. 9C,G), an increase in peak
[Ca] (Fig. 9B,F), and an increase in the activity of the
Na–Ca exchanger (Fig. 9D,H). As might be anticipated, decreasing
the I scaling factor from 1.00 to 0.72 had the opposite effects.
Interestingly, decreasing the I scaling factor from 1.00 to 0.72 still
results in a substantial increase in peak [Ca] as compared to
baseline in the BPS2020 model (Fig. 9B), but not in the ToR–ORd model, where
there is a small decrease (Fig. 9F). Thus, there would be a positive effect on
the contractile apparatus according to the BPS2020 model and a small negative
effect according to the ToR–ORd model. Apparently, the ‘crossover’ from a
positive to a negative effect has a different degree of decrease in the I
scaling factor in the two models. In this regard, it should be noted that an
increase in [Ca] compared to baseline, despite a decrease in the
I scaling factor to 0.72, is largely due to the reduction in cell volume
associated with the hypernatremia. Thus, even a substantially reduced amount of
Ca ions entering the cell or released from the sarcoplasmic reticulum can
still increase [Ca], as in the BPS2020 model, or cause only a small
decrease, as in the ToR–ORd model.
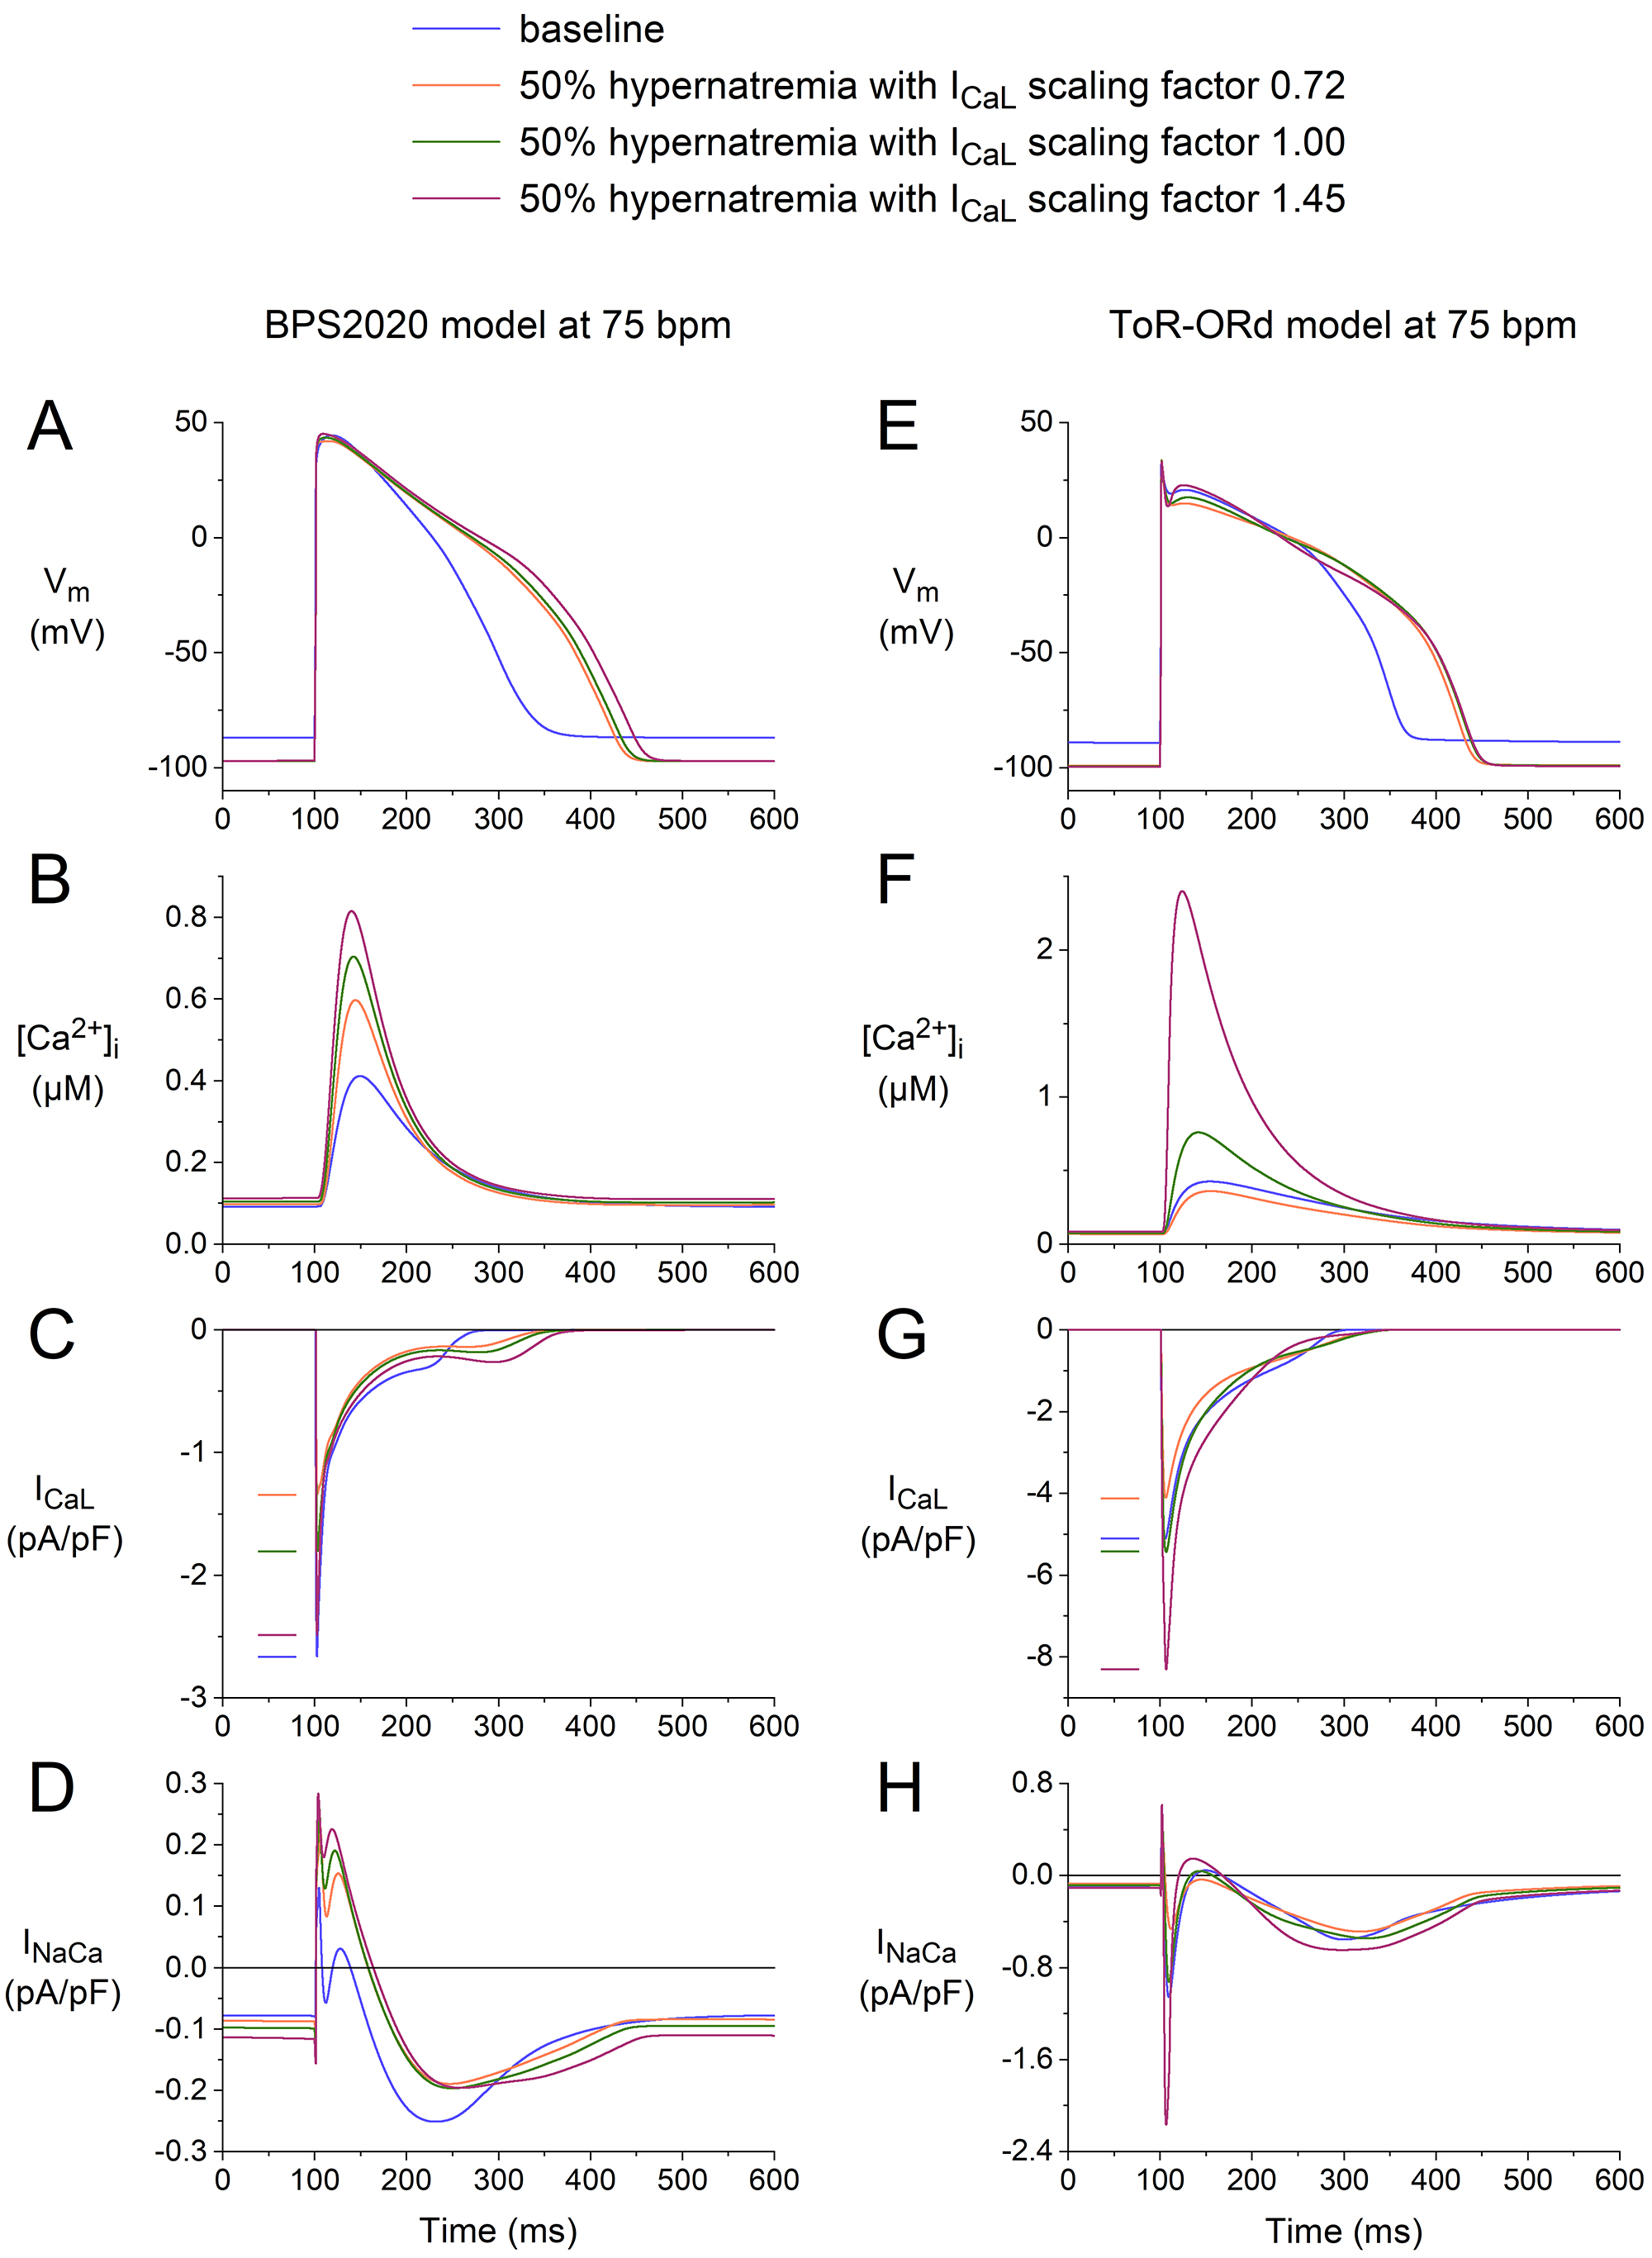 Fig. 9.
Effects of 50% hypernatremia and different scaling factors for I on the electrical activity of the BPS2020 and ToR–ORd models
for a single human ventricular cardiomyocyte at a beating rate of 75 bpm. (A)
V, (B) [Ca], (C) I, and (D) I in the BPS2020
model. (E) V, (F) [Ca], (G) I, and (H) I in
the ToR–ORd model. Note the differences in the ordinate scales. ToR–ORd, Tomek–Rodriguez model following the O’Hara–Rudy dynamic model; BPS2020, Bartolucci-Passini-Severi model as published in 2020; bpm, beats per minute.
3.5 Effects of Ion Current Scaling vs. Cell Shrinkage
When simulating hypernatremia, we incorporated both the hypernatremia-induced
cell shrinkage and the hypernatremia-induced changes in I, I,
I, and I using the scaling factors listed in Table 2. To test
the effects of cell shrinkage and ion current scaling per se, we
simulated two hypothetical cases of hypernatremia, one in the absence of cell
shrinkage and one in the absence of ion current scaling. As in the simulations
presented in Fig. 9, we selected the extreme 50% level of hypernatremia, where
the effects are the most pronounced. The results of our simulations are shown in
Fig. 10, focusing on [Na], [K], and [Ca],
and the associated I and I.
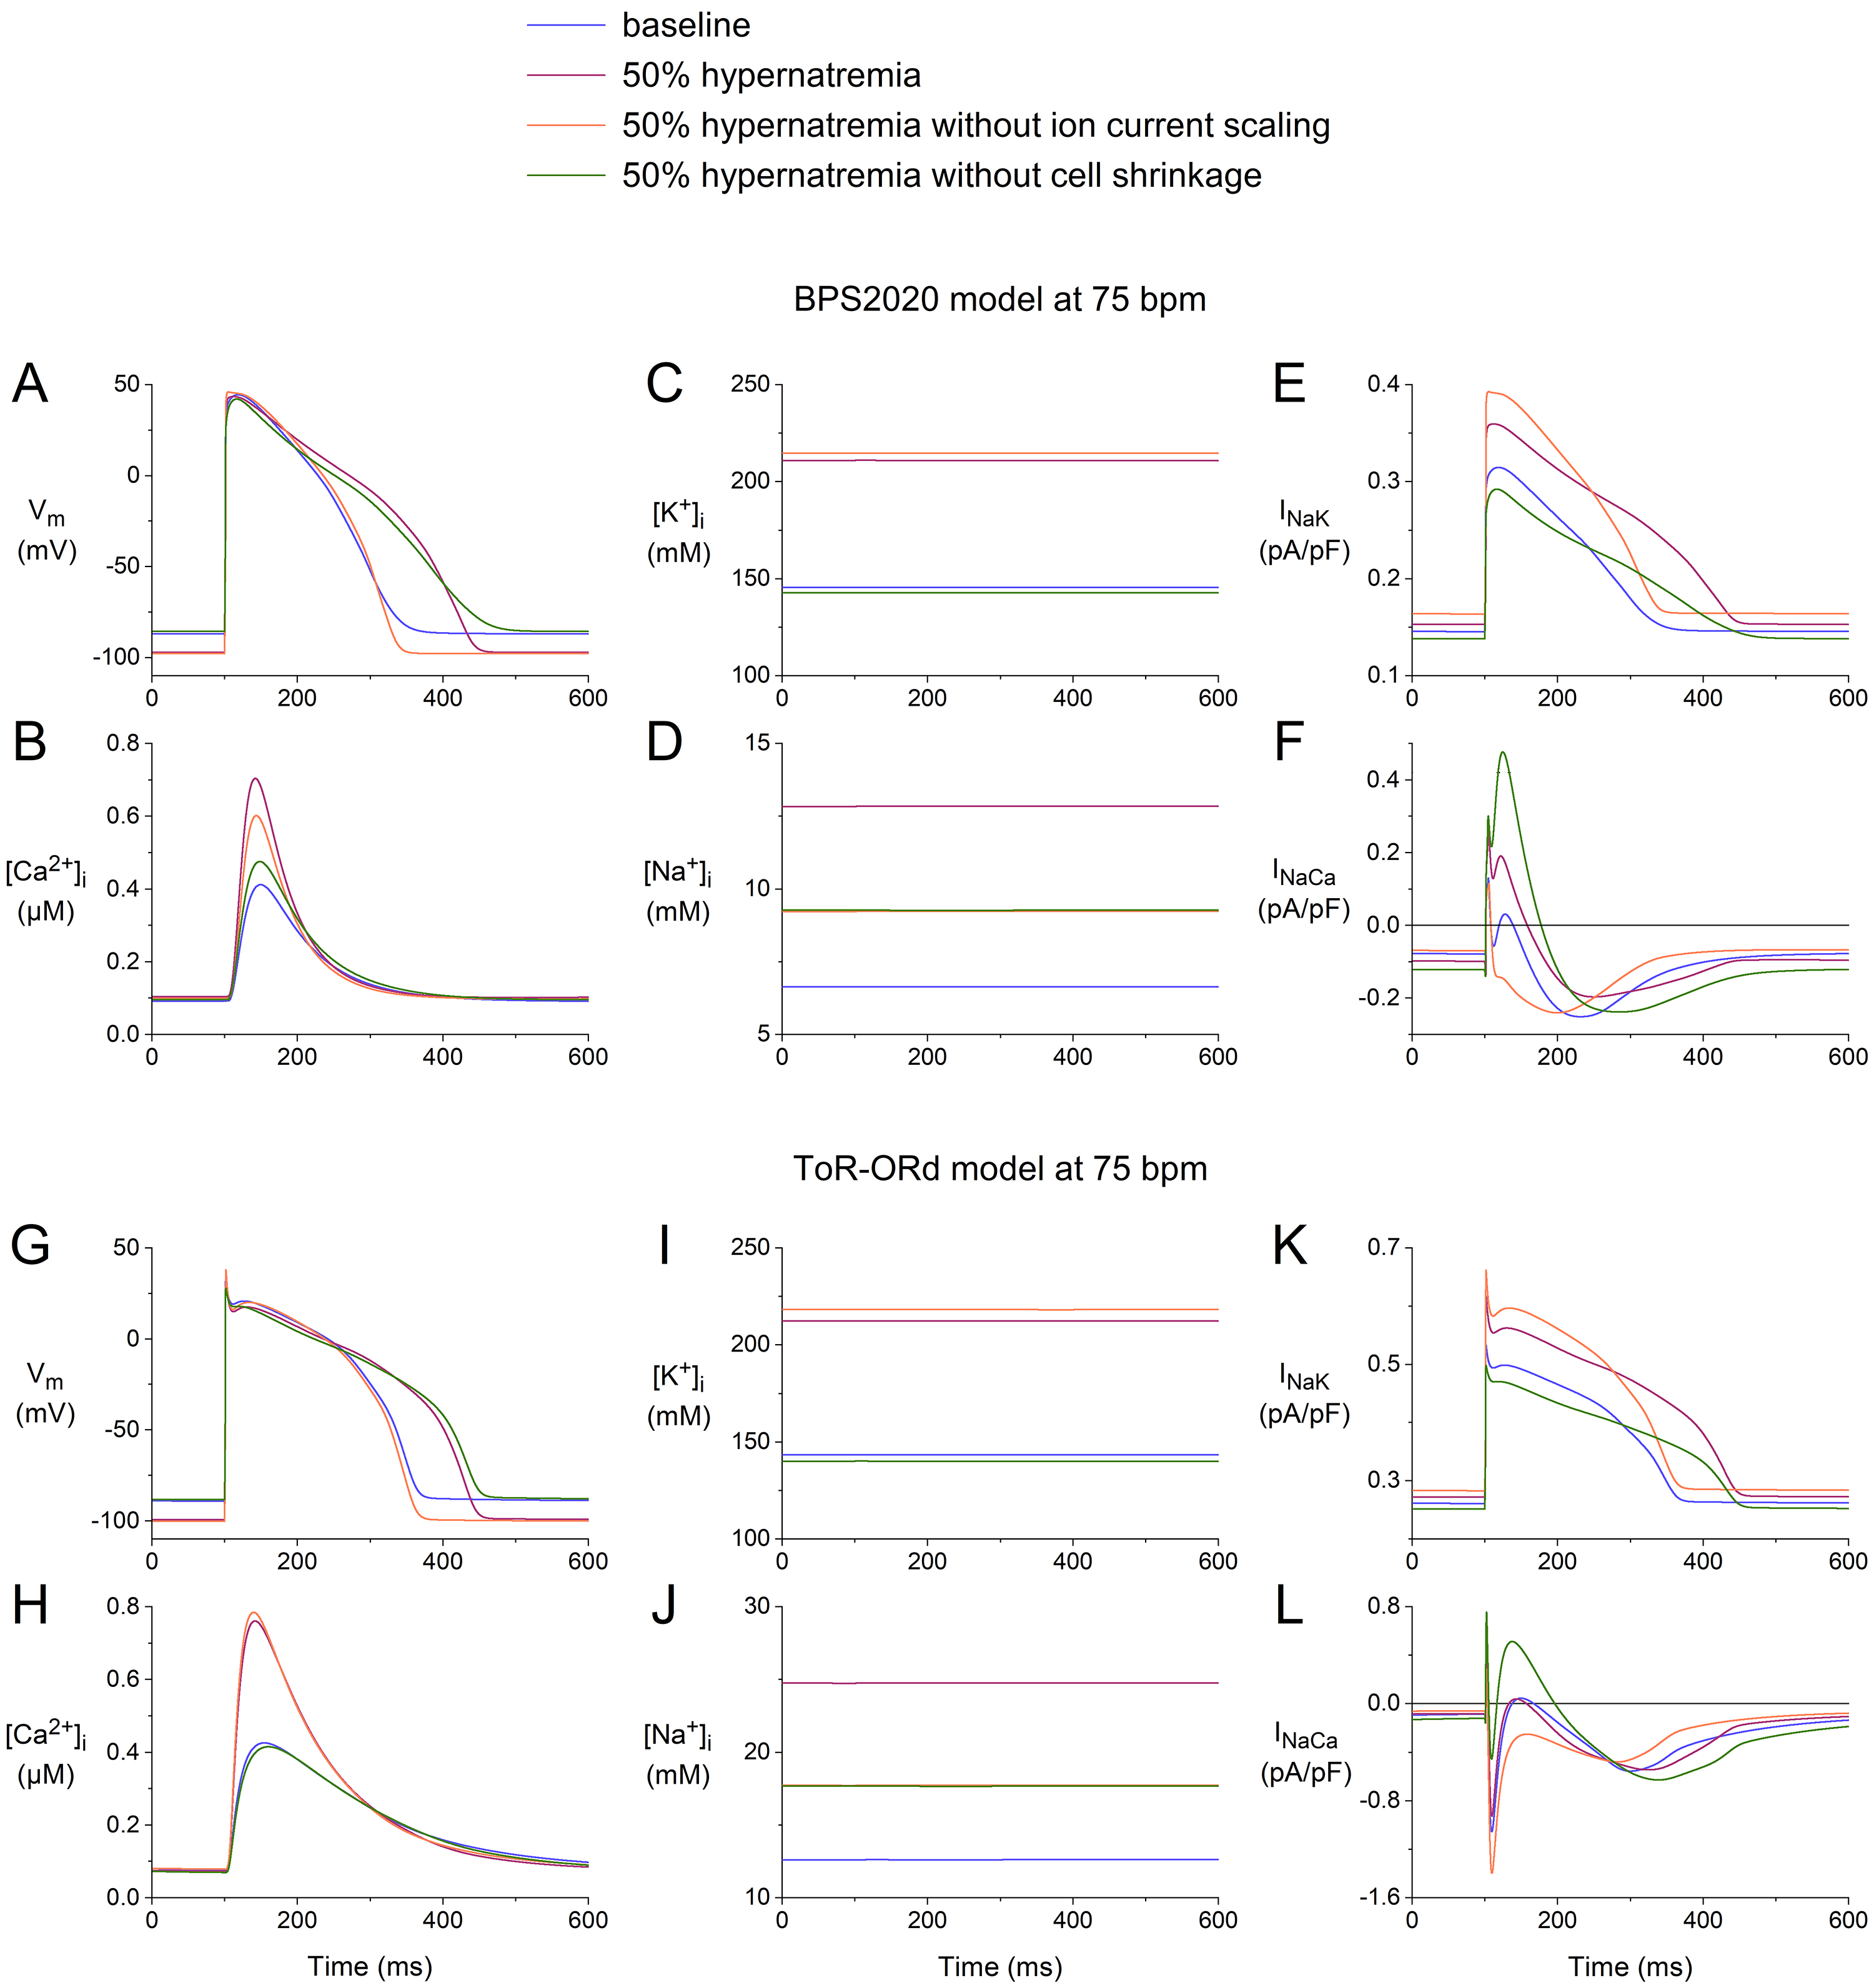 Fig. 10.
Effects of 50% hypernatremia in the presence and absence of
ion current scaling and the presence and absence of cell shrinkage on the
electrical activity of the BPS2020 and ToR–ORd models for a single human
ventricular cardiomyocyte at a beating rate of 75 bpm. (A) V, (B)
[Ca], (C) [K], (D) [Na], (E) I, and
(F) I in the BPS2020 model. (G) V, (H) [Ca], (I)
[K], (J) [Na], (K) I, and (L) I in the
ToR–ORd model. Note the differences in the ordinate scales. Note also that the
green and orange traces coincidentally overlap almost completely in both (D) and
(J). ToR–ORd, Tomek–Rodriguez model following the O’Hara–Rudy dynamic model; BPS2020, Bartolucci-Passini-Severi model as published in 2020; bpm, beats per minute.
Comparison of the APs obtained under baseline conditions and upon 50%
hypernatremia without ion current scaling with those obtained during 50%
hypernatremia with and without cell shrinkage (Fig. 10A,G) reveals that the
hypernatremia-induced AP prolongation is largely determined by the ion current
scaling, which includes scaling factors of 0.6, 0.5, and 0.333 for each of the
repolarizing currents I, I, and I, respectively (Table 2).
Similarly, a comparison of the intracellular ion concentrations obtained under
the different conditions (Fig. 10B–D,H–J) shows that the changes in
[Ca], [K], and [Na] are largely, but
certainly not completely, determined by the cell shrinkage. In particular, in the
case of [Na] (Fig. 10D,J), the ion current scaling has a strong
effect. For example, in the ToR–ORd model, the hypernatremia induces an increase
in [Na] from its baseline value of 12.6 mmol/L to 24.7 mmol/L in the
presence of the ion current scaling, which is a substantially smaller increase to
17.7 mmol/L in the absence of the ion current scaling (Fig. 10J). This effect is
not highly surprising, given the hypernatremia-induced decrease in I and
increase in I (Table 2), which correspond to a reduced activity of the
Na–K pump and an enhanced activity of the Na–Ca
exchanger, respectively, both of which tend to increase [Na], in the
presence of the ion current scaling. The hypernatremia-induced decrease in
I and increase in I are not immediately apparent from a direct
comparison of the I traces in Fig. 10E,K and the I traces in
Fig. 10F,L. However, it should be noted that I and I depend on
the intracellular ion concentrations, which reached different levels under the
four conditions tested.
4. Discussion
4.1 Effects of Acute Hypernatremia on the Cellular Action Potential
Owing to the many effects of acute hypernatremia and the associated cell
shrinkage and changes in intracellular ion concentrations on individual membrane
currents, it is difficult to predict, if not qualitatively, then at least
quantitatively, how acute hypernatremia will affect the ventricular AP. This is
where comprehensive computer models of the ventricular cardiomyocyte come into
play. With such models, it is possible to determine and understand the effects of
different levels of acute hypernatremia on the individual membrane currents and
their net effects on the ventricular AP. In the present study, we used two
different comprehensive computer models of an isolated human ventricular
cardiomyocyte to assess the effects of mild to extreme hypernatremia on the
electrophysiology of such a cardiomyocyte. We observed a hyperpolarization of the
RMP, a prolongation of the AP, an increase in (dV/dt), and an
increase in I at all levels of hypernatremia. The magnitude of these
effects increased with increasing levels of hypernatremia.
Experimental data on the cardiac effects of acute hypernatremia at the cellular
level are scarce. What we do know from the work of Bou-Abboud and Nattel [37] is
that canine Purkinje fibers show small but statistically highly significant
increases in their APD (+12.0%) and APD (+5.4%) and in their
(dV/dt) (+4.7%) when [Na] is increased from 141 to 161
mmol/L (14% hypernatremia). Our simulation results at 10–20% hypernatremia,
albeit for human ventricular cardiomyocytes rather than canine Purkinje fibers,
correlate well with these experimental observations. More experimental data have
been obtained on the effects of hyperosmotic extracellular solutions on the AP of
cardiac myocytes at the cellular level, although these were obtained with
sucrose-induced hyperosmosis rather than hypernatremia. From the 1997 study by
Ogura et al. [20], we know that guinea pig ventricular cardiomyocytes,
when stimulated at 1 Hz, show an increase in APD of 10 3% (mean
SEM, n = 4) and 11 2% (n = 5) in 20% and 50%
hyperosmotic solutions, respectively. In a more recent study, also using guinea
pig ventricular cardiomyocytes stimulated at 1 Hz, Ogura et al. [22]
observed a 16.7 2.4% increase in APD (mean SEM,
n = 5) in a 50% hyperosmotic solution as well as a 6.6 0.2 mV
hyperpolarization of the RMP. Qualitatively, such an increase in [K]
is supported by the –2.8 0.3 and –7.3 0.7 mV (mean SEM,
n = 9) hyperpolarizing shifts in the I reversal potential for
30% and 80% hyperosmotic solutions [23]. Although obtained with guinea pig
rather than human ventricular cardiomyocytes and with a sucrose-induced
hyperosmotic extracellular solution rather than a hypernatremic one, these
experimental data on AP prolongation and RMP hyperpolarization correlate well
with our simulation results. One would expect hyperosmosis and hypoosmosis to
have opposite effects on APD, and this is indeed the case. Both Groh et
al. [38] and Kocic et al. [39] found a decrease in APD in guinea
pig ventricular cardiomyocytes upon hypoosmosis.
Ogura et al. [22] attributed the hyperpolarization of the RMP to an
increase in [K] in the osmotically shrunken cardiomyocytes, as also
proposed by Missan et al. [23]. This is supported by our simulation
results, which show an increase in both models. The increase in [K]
is even quantitatively very similar in the two models, which is, however, less
the case for the absolute increase in [Na]. In this regard, we have
to note that there is already a substantial difference in [Na]
between the two models at baseline, in contrast to the baseline level of
[K]. For example, at 75 bpm, [Na] is 12.6 mmol/L in the
ToR–ORd model and 6.6 mmol/L in the BPS2020 model. These values increase to 24.7
and 12.8 mmol/L, respectively, with 50% hypernatremia. Thus, a near doubling of
[Na] can be observed in both models.
4.2 Experimental Data on the Effects of Acute Hypernatremia on
Individual Ion Currents
As mentioned in the Introduction, data on the direct effects of acute
hypernatremia on individual membrane currents of cardiac myocytes are lacking.
Data on changes in individual membrane currents of single cardiac myocytes that
are acutely exposed to hyperosmotic solutions induced by the addition of sucrose
or mannitol rather than hypernatremia are not equivocal, particularly in the case
of I. This is even more the case when data on hypoosmosis are considered.
One would expect hyperosmosis and hypoosmosis to have opposite effects on
individual ion currents, yet this is not always the case. From the data
summarized in Table 1, one would expect an increase in both I and I
upon hypoosmosis, while I is unaffected. Groh et al. [38]
reported no significant changes in I or I in guinea pig ventricular
cardiomyocytes exposed to a 20% hypoosmotic solution, whereas I increased
(as expected) by 40%. Kocic et al. [39] also observed an
increase in I. The application of a 70% hypoosmolar bath solution by
Sasaki et al. [26] increased I (as expected), whereas no
noticeable change in I was observed, which was in agreement with their
observations with a 130% hyperosmolar solution. Furthermore, Rees et
al. [40] provided evidence that cell swelling enhanced I (as expected)
while inhibiting (rather than increasing) I. Thus, these data on I
and I in response to hypoosmosis are entirely consistent with the data in
response to hyperosmosis. However, the data on I are not: I is
either increased, decreased, or unaffected by hypoosmosis.
From the data summarized in Table 1, one would also expect a decrease in
I and an increase in I in response to hypoosmosis. In about half
of their cells, Sasaki et al. [26] observed a large increase in
I upon superfusion with a hypoosmolar bath solution, consistent with
their observations with a 130% hyperosmolar solution. Whalley et al.
[25] also observed stimulation of the Na–K pump during exposure to
hypoosmolar solutions, consistent with their observations with hyperosmolar
solutions. Wright et al. [29] showed a decrease in I in
response to 1.3-fold hypoosmotic treatment, consistent with their observations
with hyperosmolar solutions. Thus, all of these data on I and I
in response to hypoosmosis are consistent with the data in response to
hyperosmosis.
There are also some data on I in response to hypoosmosis. Groh
et al. [38] reported no significant changes in I (measured with
10 mmol/L EGTA in the pipette solution) in guinea pig ventricular cardiomyocytes
exposed to a 20% hypoosmotic solution. Similarly, Sasaki et al. [26]
observed no apparent change in I (measured with 5.0 mmol/L EGTA or 10
mmol/L BAPTA) upon application of a 70% hypoosmolar bath solution, in agreement
with their observations with a 130% hyperosmolar solution. Thus, these data on
I in response to hypoosmosis support the hyperosmosis data of Ogura
et al. [20] and Sasaki et al. [26] rather than those of Luo
et al. [27].
Unfortunately, experimental data on the effects of hyperosmosis, let alone
hypernatremia, on individual membrane currents are limited to the currents listed
in Tables 1,2. Most importantly, there are no data on the effects of
hyperosmosis on I and I. If such data had been available, we would
have incorporated these into our models. Experimental data on the effects of
hyperosmosis on intercellular coupling are also lacking, making conduction
studies in strand or tissue models uncertain.
4.3 Experimental Data on the Effects of Acute Hypernatremia on the
Electrocardiogram (ECG)
There are not many systematic studies of the effects of acute hypernatremia on
the ECG. In a study of seven anesthetized dogs, Eliakim et al. [41]
regularly observed bradycardia, a decrease in P wave amplitude, an increase in
QRS complex amplitude, and QT prolongation after intravenous administration of
hypertonic saline to induce acute hypernatremia. Gibson et al. [42]
studied ECG changes in 14 anesthetized dogs upon intravenous infusion of sodium
chloride (increase in serum Na levels of 28–56%, averaging 41%) and
consistently observed an increase in the rate-corrected QT interval (3–26%,
averaging 11%) and a decrease in the amplitude of the P wave and the QRS
complex, without QRS prolongation, and with variable minor changes in rate and
negligible changes in PR interval. Importantly, these ECG changes occurred with
only a 5–15% increase in serum Na levels, and only one dog presented an
arrhythmia, which was transient and occurred at the start of the infusion. In a
study of 20 rabbits subjected to extreme acute hypernatremia,
electrocardiographic tracings remained normal until respiratory arrest, “except
in a few instances in which peaked T waves were observed in the terminal stages”
[43]. Overall, these in vivo data from laboratory animals are
inconsistent, except perhaps for increased QT prolongation. The inconsistencies
may be related, at least in part, to the level of hypernatremia and a reduction
in P and QRS amplitude due to alterations in blood conductivity with a
short-circuiting effect on myocardial potentials, as discussed by Gibson
et al. [42], although this cannot fully explain the conflicting data. An
increase in QT prolongation is consistent not only with the increase in APD that
was observed in vitro (see Section 4.1) and that we observed in
silico (Fig. 8C,D) but also with clinical and experimental ECG data in case
reports of the effects of (often extreme) acute hypernatremia, including a
prolonged rate-corrected Q-U interval in a 12-year-old girl [44], QT prolongation
in an 11-year-old girl [9], and QT prolongation in a 29-year-old woman [8].
4.4 Intracellular Ca Concentration And Contractile
(dys)function
Hypernatremia may also lead to left ventricular (LV) contractile dysfunction. In
a prospective cohort study of subarachnoid hemorrhage patients, Fisher et
al. [6] observed that hypernatremia was an independent predictor of a reduced LV
ejection fraction of 50%. In line with this observation, King et al.
[45] demonstrated that elevating [Na] from 145 to 155 mmol/L in
Langendorff-perfused isolated rat heart preparations decreased LV developed
pressure (LVdP). Fisher et al. [6] hypothesized that the elevated
[Na] causes more Ca to exit the cell via the sarcolemmal
Na–Ca exchanger, which then results in reduced levels of
[Ca] available for cardiac myocyte contraction, thus causing a
negative inotropic effect. On the other hand, hypernatremia ranging from 163 to
218 mmol/L in 10 anesthetized dogs resulted in statistically significant
increases in cardiac output, heart rate, and maximum rate of rise in LVdP in the
study by Goodyer et al. [46].
The increase in the systolic peak amplitude of [Ca] that we found
in our simulations is consistent with the findings of Goodyer et al.
[46], especially when we compare the peak amplitude of [Ca] obtained
at 20–50% hypernatremia and a beating rate of 75–100 bpm with the baseline
peak [Ca] at 50 bpm to account for the increase in heart rate that
accompanies the hypernatremia. At 10% hypernatremia, which best reflects mild
hypernatremia, our simulations still predict an increase in peak
[Ca], although less pronounced, which seems to contradict the
observations of Fisher et al. [6] and King et al. [45] that
mild hypernatremia impairs LVdP. This may indicate a shortcoming in our models;
however, it may also point to a negative effect on the contractile apparatus that
requires a higher increase in peak [Ca], as obtained at 20–50%
hypernatremia, to be compensated. Notably, the hypothesis of Fisher et
al. [6] regarding a hypernatremia-induced reduction in the level of
[Ca] available for cardiac myocyte contraction is not supported by
our simulations.
In our simulations, there is an increase in peak [Ca] at all levels
of hypernatremia, yet it is most prominent at 50% hypernatremia. For example, in
the BPS2020 model, with a beating rate of 75 bpm, the peak [Ca] is
0.704 µmol/L at 50% hypernatremia compared to 0.412
µmol/L at baseline (+71%; Fig. 2D). Yet, the associated changes in
I and I do not seem to be large enough to explain this increase
in [Ca] fully. Early in the AP, there is an increase in reverse mode
I, making more Ca ions enter the cell, but on the other hand,
there is a decrease in peak I (Fig. 2F,K). In this regard, it should be
noted that the increase in [Ca] with increasing levels of
hypernatremia is largely due to the associated decrease in cell volume. The free
Ca ions reside in a 32% smaller myoplasmic volume compared to baseline,
which per se results in a 47% increase in [Ca]. Thus, even
a reduced amount of Ca ions entering the cell or released from the
sarcoplasmic reticulum can still increase [Ca].
4.5 Clinical Settings
It should be noted that in all of the above, the focus is on acute
hypernatremia, with the associated abrupt cell shrinkage; however, the more
common hypernatremia in the clinic is a more gradually developing and chronic
hypernatremia. In this context, the changes in intracellular volume and
osmolarity and those in individual membrane currents will be much smaller. It is
likely that, as a consequence, the effects of this type of hypernatremia will be
much less pronounced than in our simulations. Unfortunately, there are no
cellular electrophysiological data on this type of hypernatremia to support this
hypothesis. Furthermore, in the clinical management of the more gradually
developing hypernatremia, it is important to consider not only the absolute level
of the serum Na concentration but also the time of development of the
hypernatremia because too slow or too rapid corrections of the hypernatremia are
both associated with a poor patient prognosis [47, 48].
Another point of attention is the extreme 50% hypernatremia we used in our
simulations. Such a high level of hypernatremia is clinically limited to a few
cases reported worldwide [10, 11, 12, 13, 14, 15] and some of the cases in the commonly
referenced study by Finberg et al. [49], in which they describe the
dramatic mix-up of salt and sugar in the preparation of feedings that were
received by 14 hospitalized infants, six of whom died. The highest level of
Na observed in the latter study was as high as 274 mmol/L (with a non-fatal
outcome).
4.6 Limitations
Our computer simulations were performed using the default versions of the
ToR–ORd and BPS2020 models. It should be noted that both models represent
endocardial cardiomyocytes with their default settings. However, epicardial and
mid-myocardial versions of each model are also available. In both models,
changing the cell type affects the kinetics and the amplitude of I, the
amplitude of I, I, I, I, I, I,
I, and I, and parameters related to the uptake and release of
Ca ions by the sarcoplasmic reticulum. Given the highly similar simulation
data obtained using the two models, despite differences in the amplitude and
kinetics of individual ion currents, it is highly unlikely that substantially
different simulation results will be obtained when repeating our simulations with
the epicardial or mid-myocardial versions of each model.
It should be recognized that experimental data on the effects of acute exposure
to a hyperosmotic solution on individual cardiac ion currents are scarce and
obtained at different levels of hyperosmolarity (Table 1), so we had to estimate
several of the values for use in our simulations (Table 2). We did this using
linear interpolation and extrapolation, which we considered the best possible
option. However, there is no evidence that the observed changes in individual ion
currents are actually linearly dependent on the level of hyperosmolarity over the
range studied.
One might anticipate cell shrinkage to affect the membrane capacitance. However,
Ogura et al. [22] carried out specific experiments on this issue in
which the membrane capacitance of seven guinea pig ventricular cardiomyocytes was
monitored during sequential superfusion with control, 50% hyperosmotic, and 50%
hypoosmotic solutions (varying sucrose levels). The superfusion with the
anisosmotic solutions caused cell shrinkage and swelling but did not affect the
membrane capacitance. Based on the experimental data of Ogura et al.
[22], we did not change the membrane capacitance in our simulations of
hypernatremia. However, it may well be that human ventricular cardiomyocytes show
a change in membrane capacitance upon acute hypernatremia that we have not
accounted for in our simulations.
It should be noted that our study is limited to the electrophysiological effects
of acute hypernatremia on a single ventricular cardiomyocyte (for which
experimental data on the effects of the hyperosmolarity are available, as
summarized in Table 1). As such, it is difficult to predict the effects of acute
hypernatremia on the tissue or whole-heart level from our simulations. For that,
data are required on the effects of acute hypernatremia on other cell types
(sinoatrial, atrial, atrioventricular, Purkinje) and intercellular coupling.
It can be argued that hypernatremia-induced cell shrinkage affects
stretch-activated ion channels in the cell membrane, thereby affecting the AP and
ion flow across the cell membrane. However, although very comprehensive, the two
models we used do not include stretch-activated channels. To overcome this
limitation, we should have implemented the various stretch-activated ion channels
in the two models and calibrated the resulting extended models to experimental
data, as was recently performed for the ToR–ORd model by Buonocunto et
al. [50].
Both hypoosmotic and hyperosmotic stress can induce the cardiac T-tubules to
seal, which could dramatically alter the Ca handling and AP propagation
[51], although this was not considered in our study. However, this sealing is a
threshold-dependent process, as observed by Uchida et al. [52] in a
study on isolated mouse left ventricular cardiomyocytes. In the case of
hyperosmolarity induced by the addition of extra NaCl to the extracellular
Tyrode’s solution, the threshold for the sealing effect is at a hyperosmolarity
of 65 mOsm/L [52], i.e., at 22% hypernatremia.
This suggests that our simulation results obtained at hypernatremia levels
20% should be considered with some caution regarding the potential role of
T-tubular sealing.


