


 , Vladan Vukcevic 1,2, Sinisa Stojkovic 1,2, Branko Beleslin 1,2, Dejan Orlic 1,2, Miloje Tomasevic 1,3, Miodrag Dikic 1, Milorad Tesic 1,2, Dejan Milasinovic 1,2, Srdjan Aleksandric 1,2, Vladimir Dedovic 1,2, Milorad Zivkovic 1, Stefan Juricic 1, Dario Jelic 1, Djordje Mladenovic 1, Goran Stankovic 1,2,*
1 Department of Cardiology, University Clinical Center of Serbia, 11000 Belgrade, Serbia
2 Faculty of Medicine, University of Belgrade, 11000 Belgrade, Serbia
3 Faculty of Medical Sciences, University of Kragujevac, 34000 Kragujevac, Serbia
Abstract
Elective unprotected left main (ULM) percutaneous coronary intervention (PCI) has long-term mortality rates comparable to surgical revascularization, thanks to advances in drug-eluting stent (DES) design, improved PCI techniques, and frequent use of intravascular imaging. However, urgent PCI of ULM culprit lesions remains associated with high in-hospital mortality and unfavourable long-term outcomes, including DES restenosis and stent thrombosis (ST). This analysis aimed to examine the long-term outcomes and healing of DES implanted in ULM during primary PCI using high-resolution optical coherence tomography (OCT) imaging.
A total of 15 consecutive patients undergoing long-term OCT follow-up of ULM primary PCI from a high-volume center were included in this analysis. During the index primary PCI all subjects underwent angio-guided DES implantation, and follow-up was uneventful in all but one subject who had a non-target PCI lesion. The primary endpoint was the percentage of covered, uncovered, and malappossed stent struts at long-term follow-up. Secondary endpoints included quantitative and qualitative OCT measurements. For the left main bifurcation, a separate analysis was performed for three different segments: left main (LM), polygon of confluence (POC) and distal main branch (dMB), in all cases.
The average follow-up interval until OCT was 1580 ± 1260 days. Despite aorto-ostial stent protrusions in 40% of patients, optimal image quality was achieved in 93.3% of cases. There were higher rates of malapposed (11.4 ± 16.6 vs. 13.1 ± 8.3 vs. 0.3 ± 0.5%; p < 0.001) and lower rates of covered struts (81.7 ± 16.8 vs. 83.7 ± 9.2 vs. 92.4 ± 6.8%; p = 0.041) observed for the LM and POC segment compared to the dMB. Significantly malapposed stent struts (>400 μm) were less likely to be covered at follow-up, than struts with a measured strut to vessel wall distance of <400 μm (15.4 ± 21.6 vs. 24.8 ± 23.9%; p = 0.011). Neoatherosclerosis was observed in 5 (33.3%) and restenotic neointimal hyperplasia (NIH) in 2 (13.3%) patients, requiring PCI in 33.3% of patients.
Long-term OCT examination of DES implanted during primary PCI for culprit ULM lesions demonstrated high rates of incomplete strut coverage, late malapposition, and high subclinical DES failure rates. These negative OCT results highlight the need for image optimization strategies during primary PCI to improve DES-related long-term outcomes.
Keywords
- OCT
- unprotected left main
- primary PCI
- long-term follow-up
- strut endothelization
- stent malapposition
Elective percutaneous coronary interventions (PCI) on the unprotected left main (ULM) are increasing in popularity thanks to improved stent design, optimization of PCI techniques and increasing use of intravascular imaging (IVI), and have long-term mortality comparable to surgical revascularization [1]. On the other hand, Urgent PCI of the culprit lesion in the ULM segment still has high in-hospital mortality rates despite immediate reperfusion, mainly due to a large amount of myocardium at risk [2, 3]. Furthermore, the long-term outcomes of these patients after hospital discharge are still not comparable to those of patients undergoing elective ULM PCI, with higher rates of restenosis and thrombosis [4, 5]. To ensure favourable long-term outcomes after drug-eluting stent (DES) implantation, procedural IVI guidance is recommended to optimize stent implantation, particularly stent expansion and good vessel wall opposition, thereby promoting endothelialization and long-term device patency [6]. Angiographically undetectable stent malapposition occurs more frequently in large coronary anatomies, e.g., the left main bifurcation segment, and after PCI with complex two-stent techniques [7, 8, 9, 10, 11]. Despite its recognized benefit, reported rates of imaging during primary PCI-ULM procedures are low, particularly due to the clinical circumstances with impending circulatory collapse that mandate prompt stent implantation and rapid restoration of flow [3]. Consequently, reports on short- and long-term IVI evaluations of angio-guided ULM stenting during primary PCI are lacking. Therefore, we performed long-term optical coherence tomography (OCT) to investigate long-term DES healing in patients with uneventful clinical follow-up, who underwent angio-guided ULM primary PCI.
A total of 15 consecutive patients who underwent primary PCI for a culprit ULM
lesion (from November 2012 to August 2023) in a high-volume tertiary center
(University Clinical Center of Serbia, Belgrade, Serbia) and who had long-term
follow-up OCT imaging were included in this analysis (Fig. 1). All patients
underwent angio-guided DES implantation during primary PCI. Exclusion criteria
for OCT follow-up included heart failure with left ventricular ejection fraction
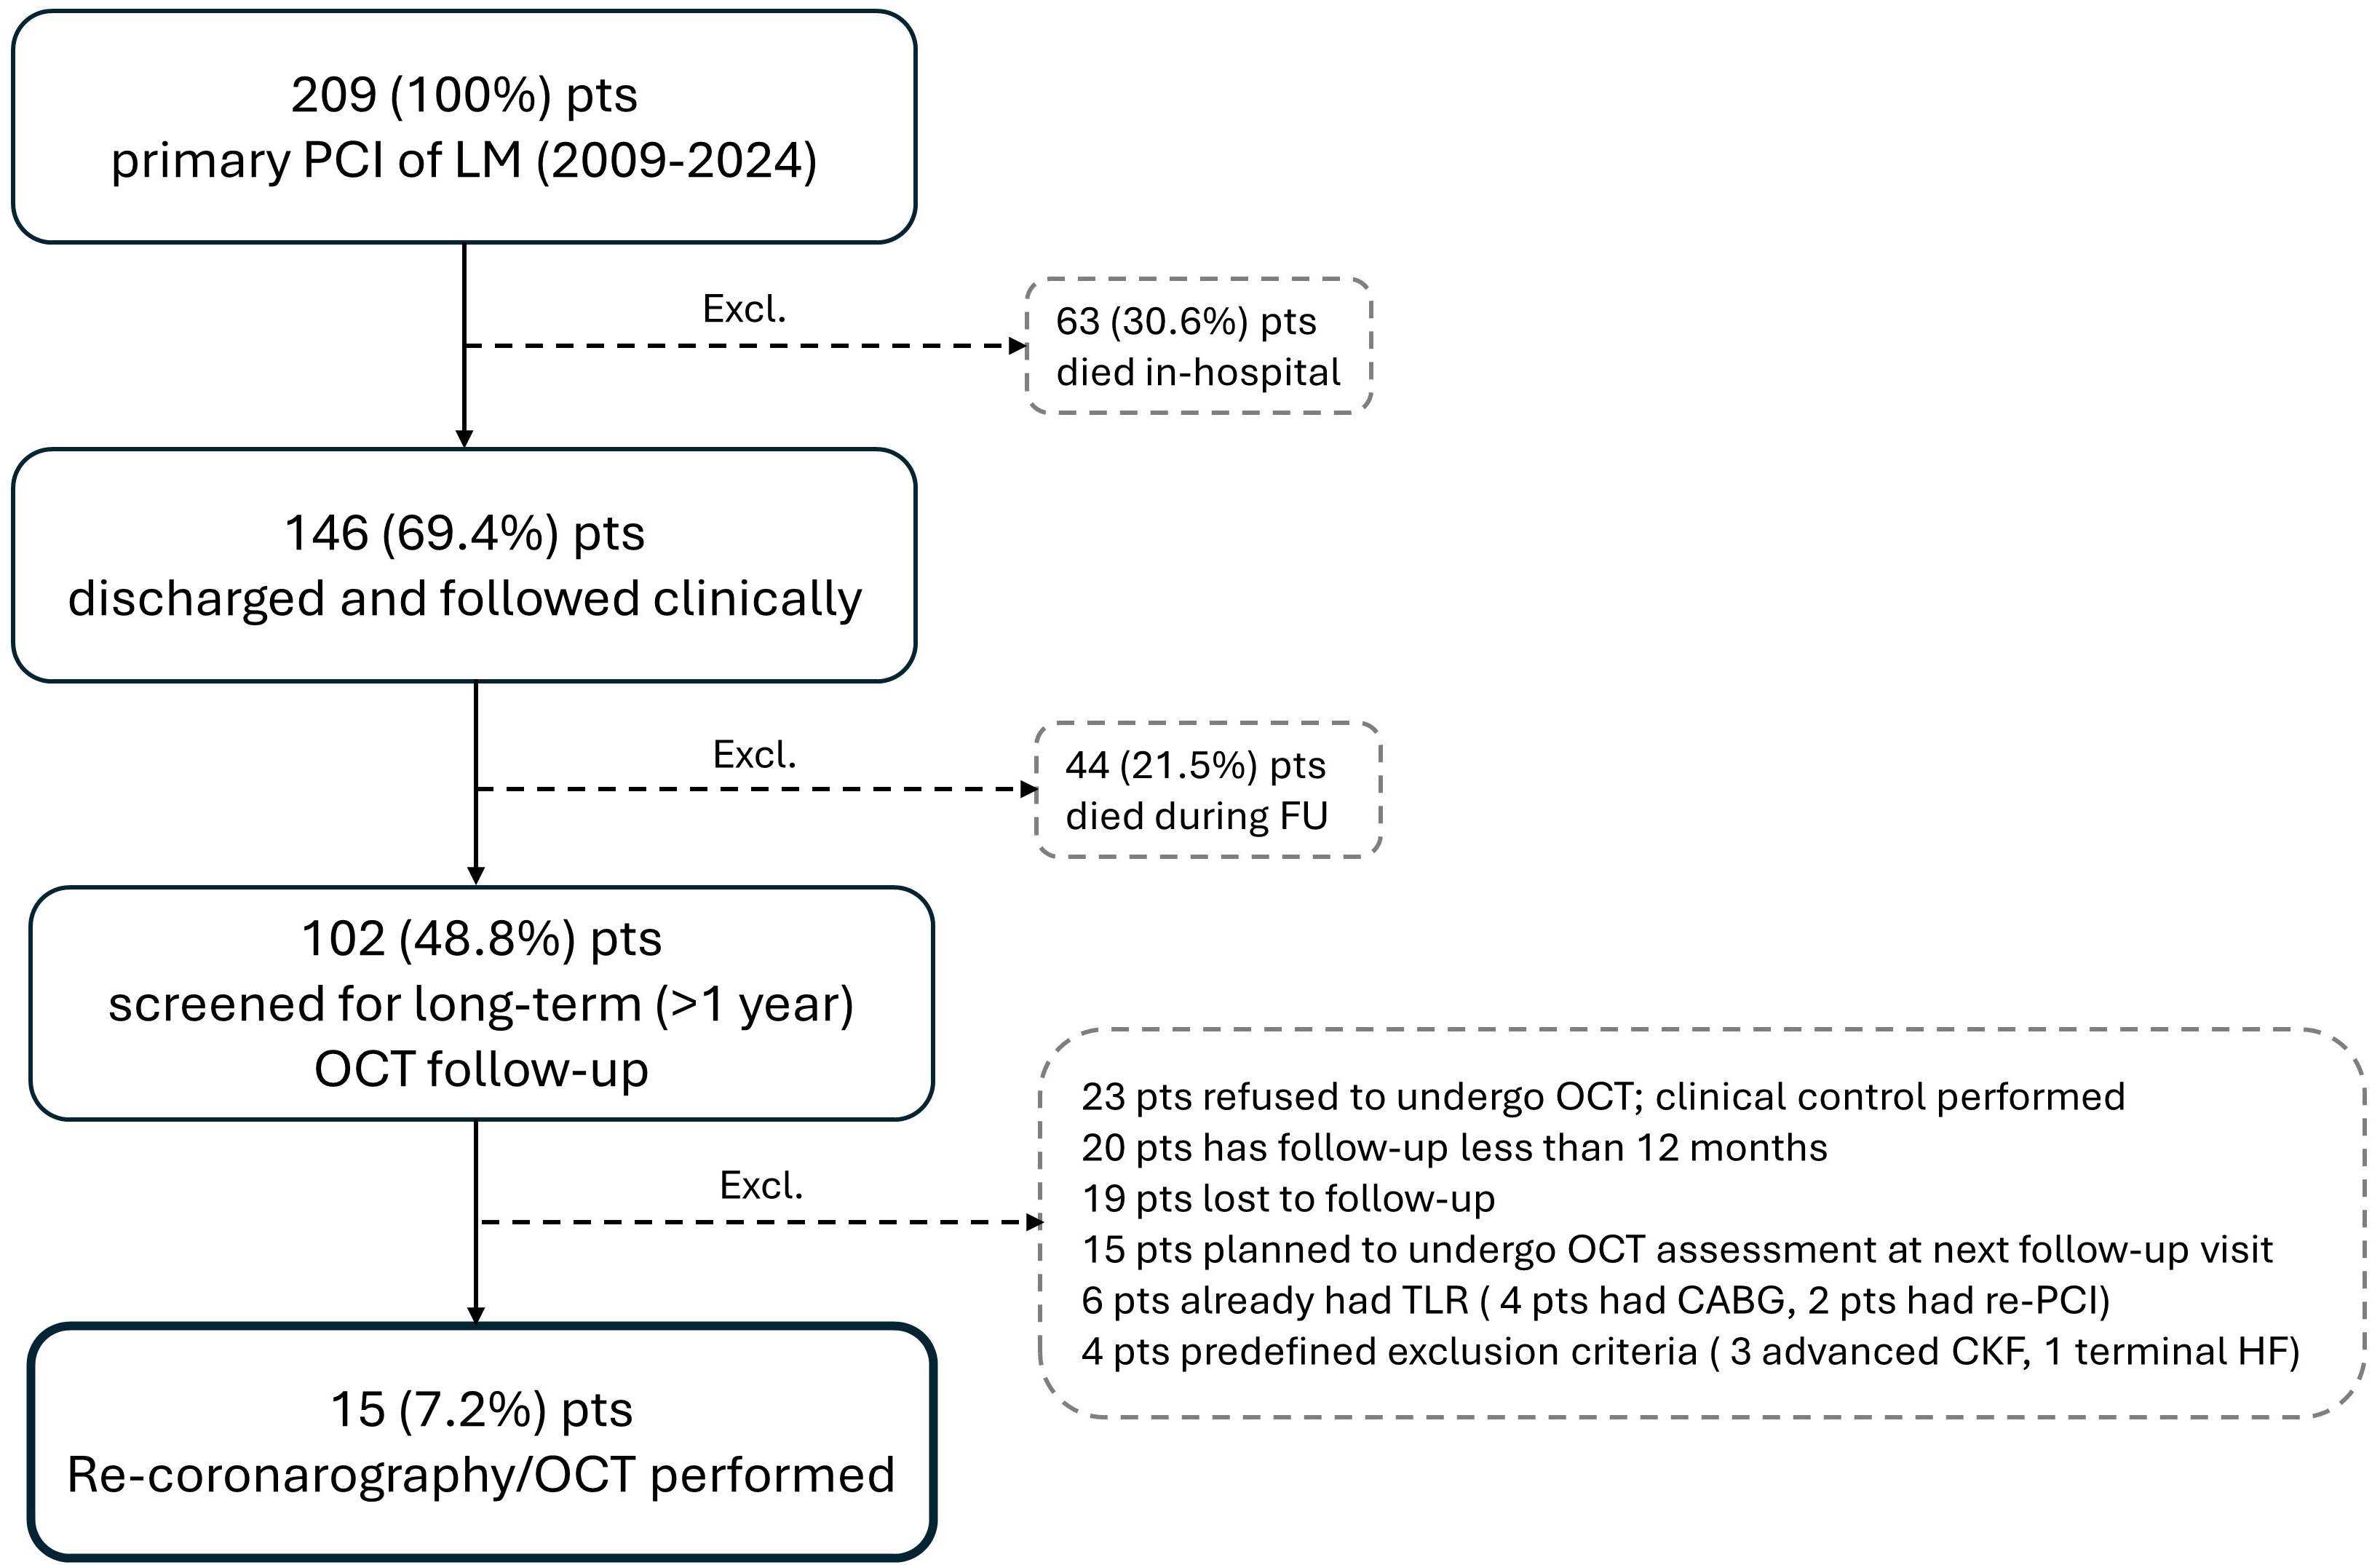 Fig. 1.
Patient flow chart. CABG, coronary artery bypass graft; CKF, chronic kidney failure; Excl., excluded patients; FU, follow-up; LM, left main; HF, heart failure; OCT, optical coherence tomography; PCI, percutanous coronary intervention; pts, patients; TLR, target lesion revascularization.
A conventional angioplasty guidewire (0.014 inch) was advanced distally to the region of interest, then the OCT catheter (Dragonfly Optis, Abbott, Santa Clara, CA, USA) was advanced over the guidewire at least 10 mm beyond the region of interest. The images were calibrated by automatic adjustment of the Z-offset and the automatic pullback was set to 20 mm, or 10 mm/s. Data were acquired and digitally stored using a commercially available OCT system (C7-XR, OCT Imaging System, Abbott, Santa Clara, CA, USA) after intracoronary administration of 50 to 200 mm of nitroglycerin via conventional guiding catheters. During image acquisition, blood was displaced by injecting a hypo- or iso-osmolar contrast agent using a power injector or hand injection. OCT pullbacks were performed from the distal main branch to the ostial part of the left main (LM). OCT analyses were performed using the dedicated software CASS Intravascular, service pack 2.1 (PIE Medical, Maastricht, The Netherlands) with semi-automatic contour and strut detection functions. Quantitative and qualitative OCT analysis of the lumen, stent, and strut was performed along the entire stented segment for each recorded cross section at 0.2 mm slices. All cross-sectional images were initially quality screened and assessed, and sections with any portion of the stent beyond the image field of view, or if the image had poor quality caused by residual blood, artefacts, or reverberations, were excluded from the analysis. Any strut with an ambiguous appearance was also not included in the qualitative analysis [10].
The analysis was stratified according to the underlying bifurcation anatomy and arbitrary identification of three subsegments as recommended by consensus papers: LM segment (LM), polygon of confluence (POC), and distal main branch (dMB) (Fig. 2) [12].
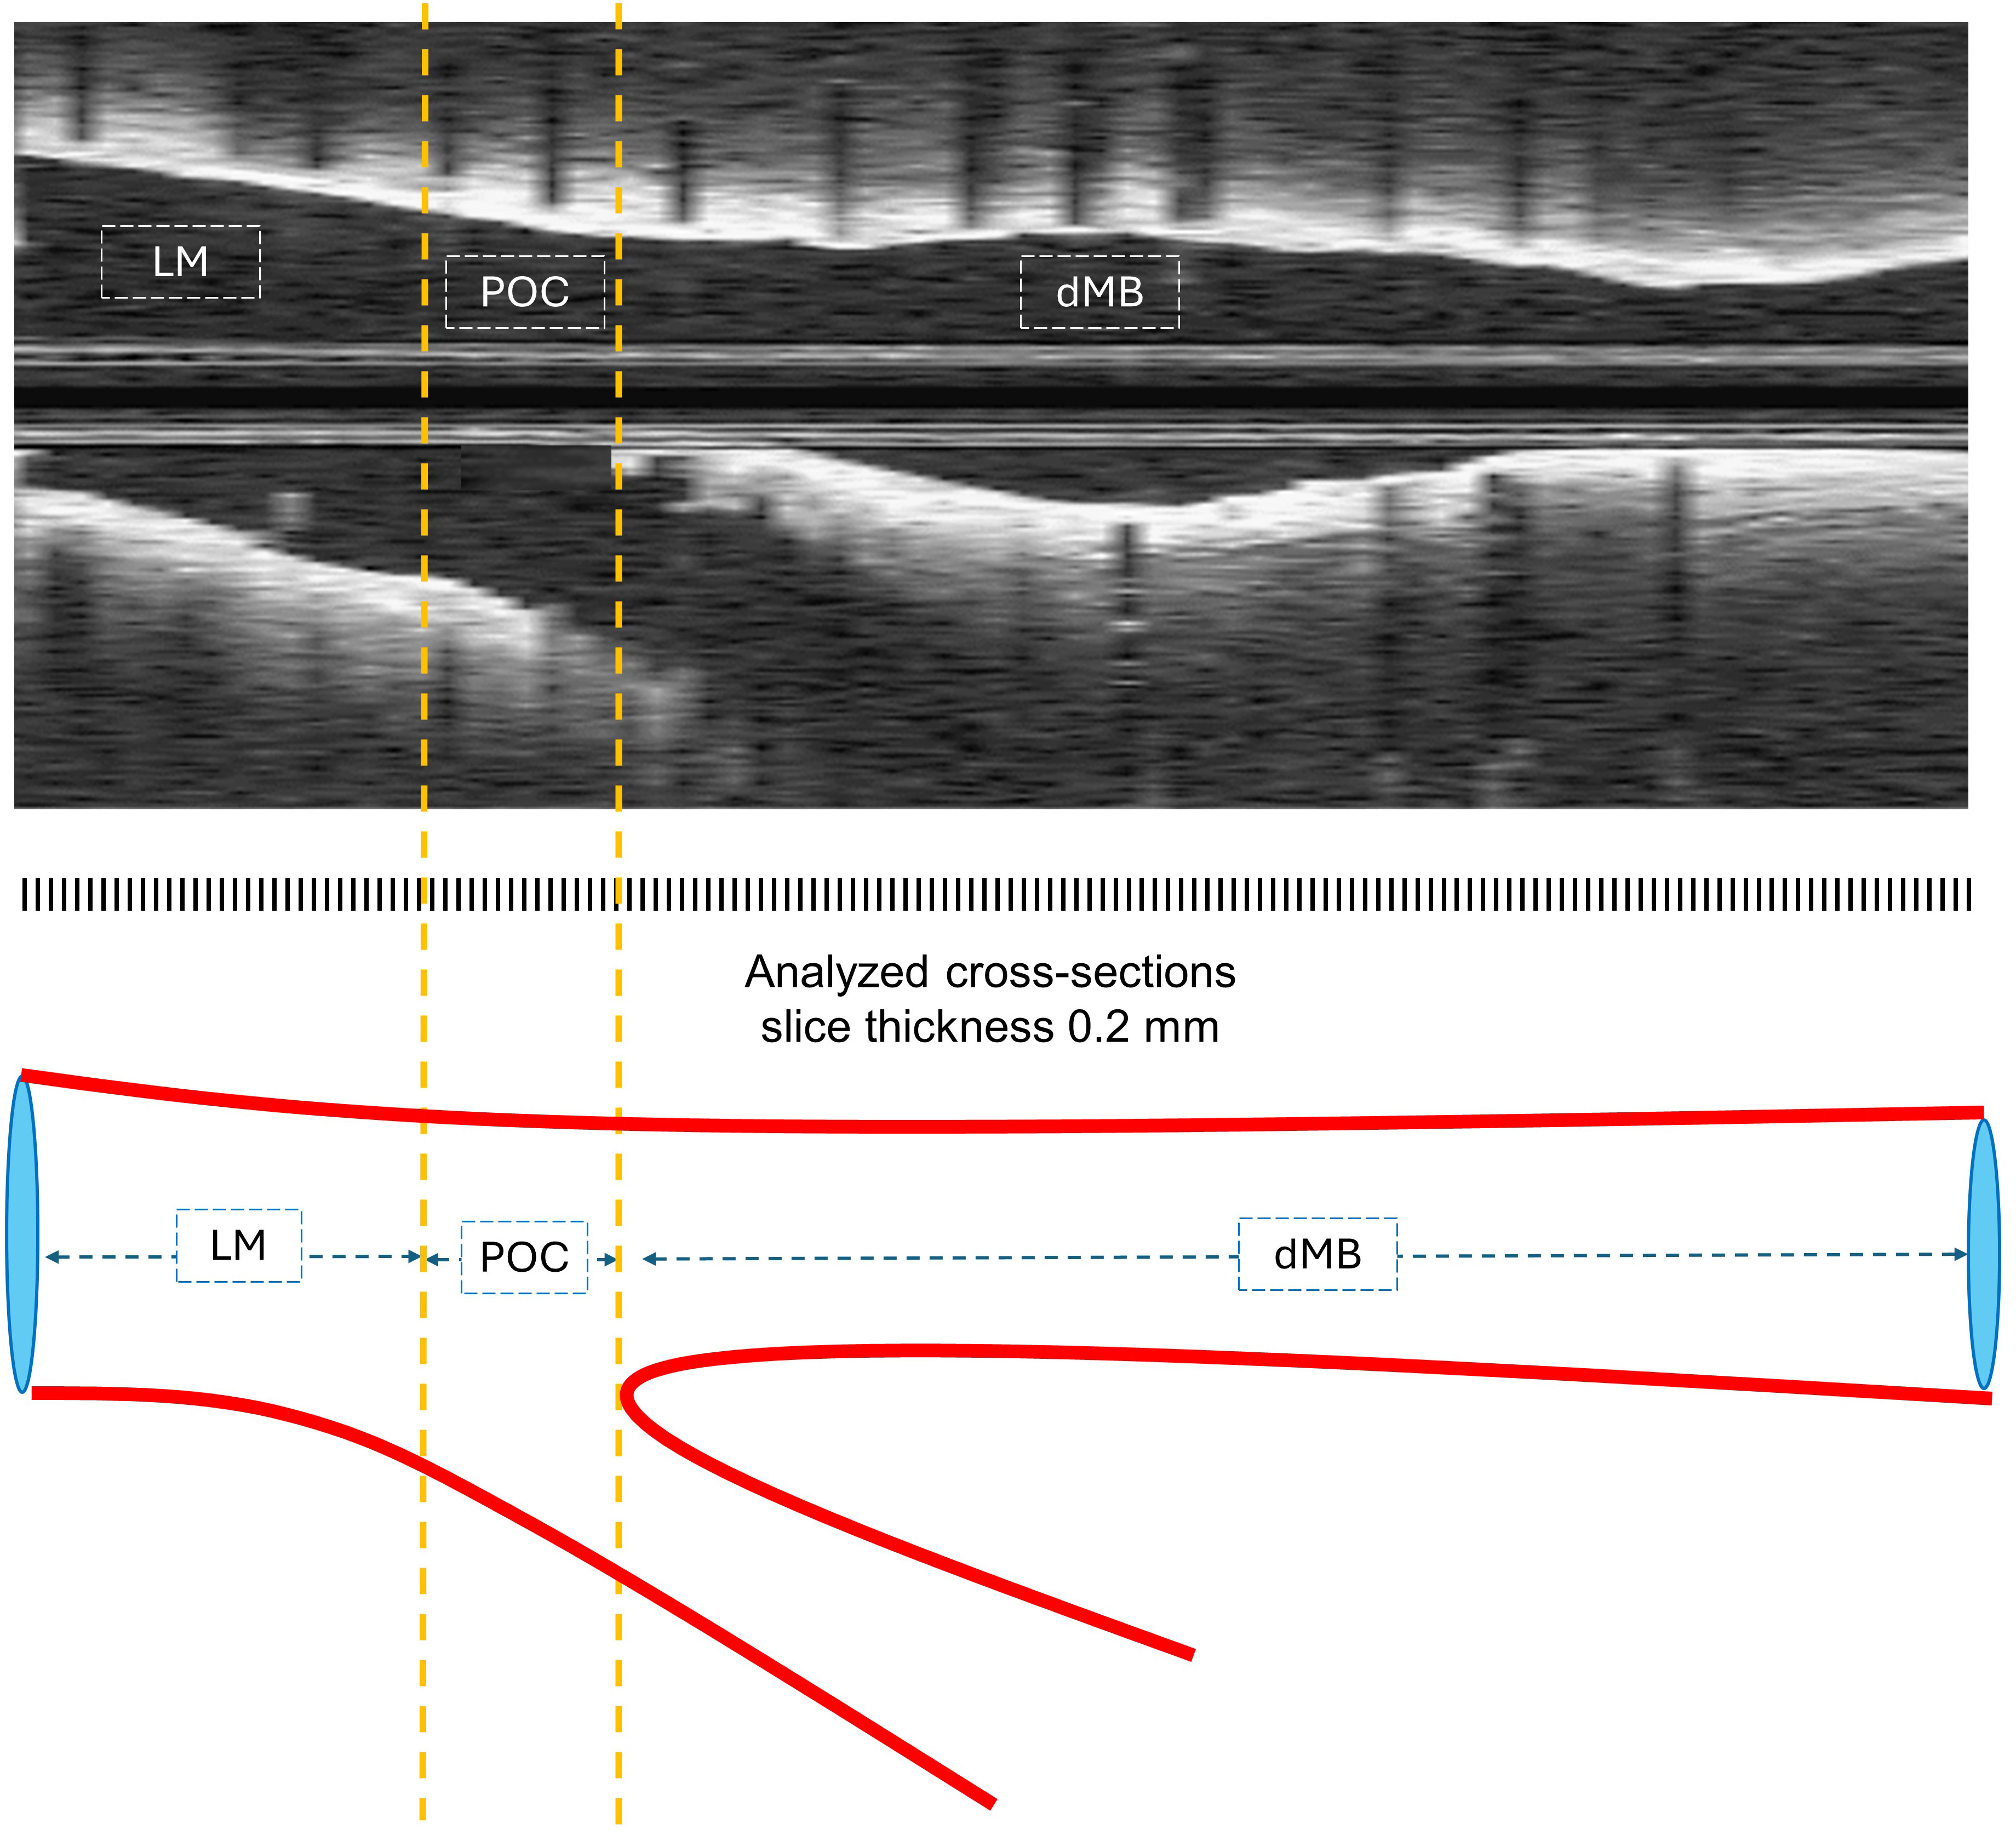 Fig. 2.
OCT longitudinal pullback and corresponding illustration of 3 segments of anatomical differentiation. dMB, distal main branch; LM, left main; OCT, optical coherence tomography; POC, polygon of confluence.
For two patients who underwent double stenting, side branch pullbacks were also
performed, but were not included in this analysis. All cross-sectional images
were initially reviewed for quality assessment and excluded from analysis if any
part of the stent was off-screen or if the image was of poor quality due to
residual blood, artifacts, or reverberation. Struts were defined as covered, only
if they were completely covered by neointimal tissue, while partially covered
struts were considered uncovered according to previous histological reports [13].
Malapposed struts were defined as all struts that were not in contact with the
lumen with measured malapposition distance greater than strut thickness + polymer
thickness [10]. Struts were considered to be significantly malapposed if measured
malapposition distance was
OCT recording and on-line analysis was performed according to a prespecified protocol, as shown in Fig. 3.
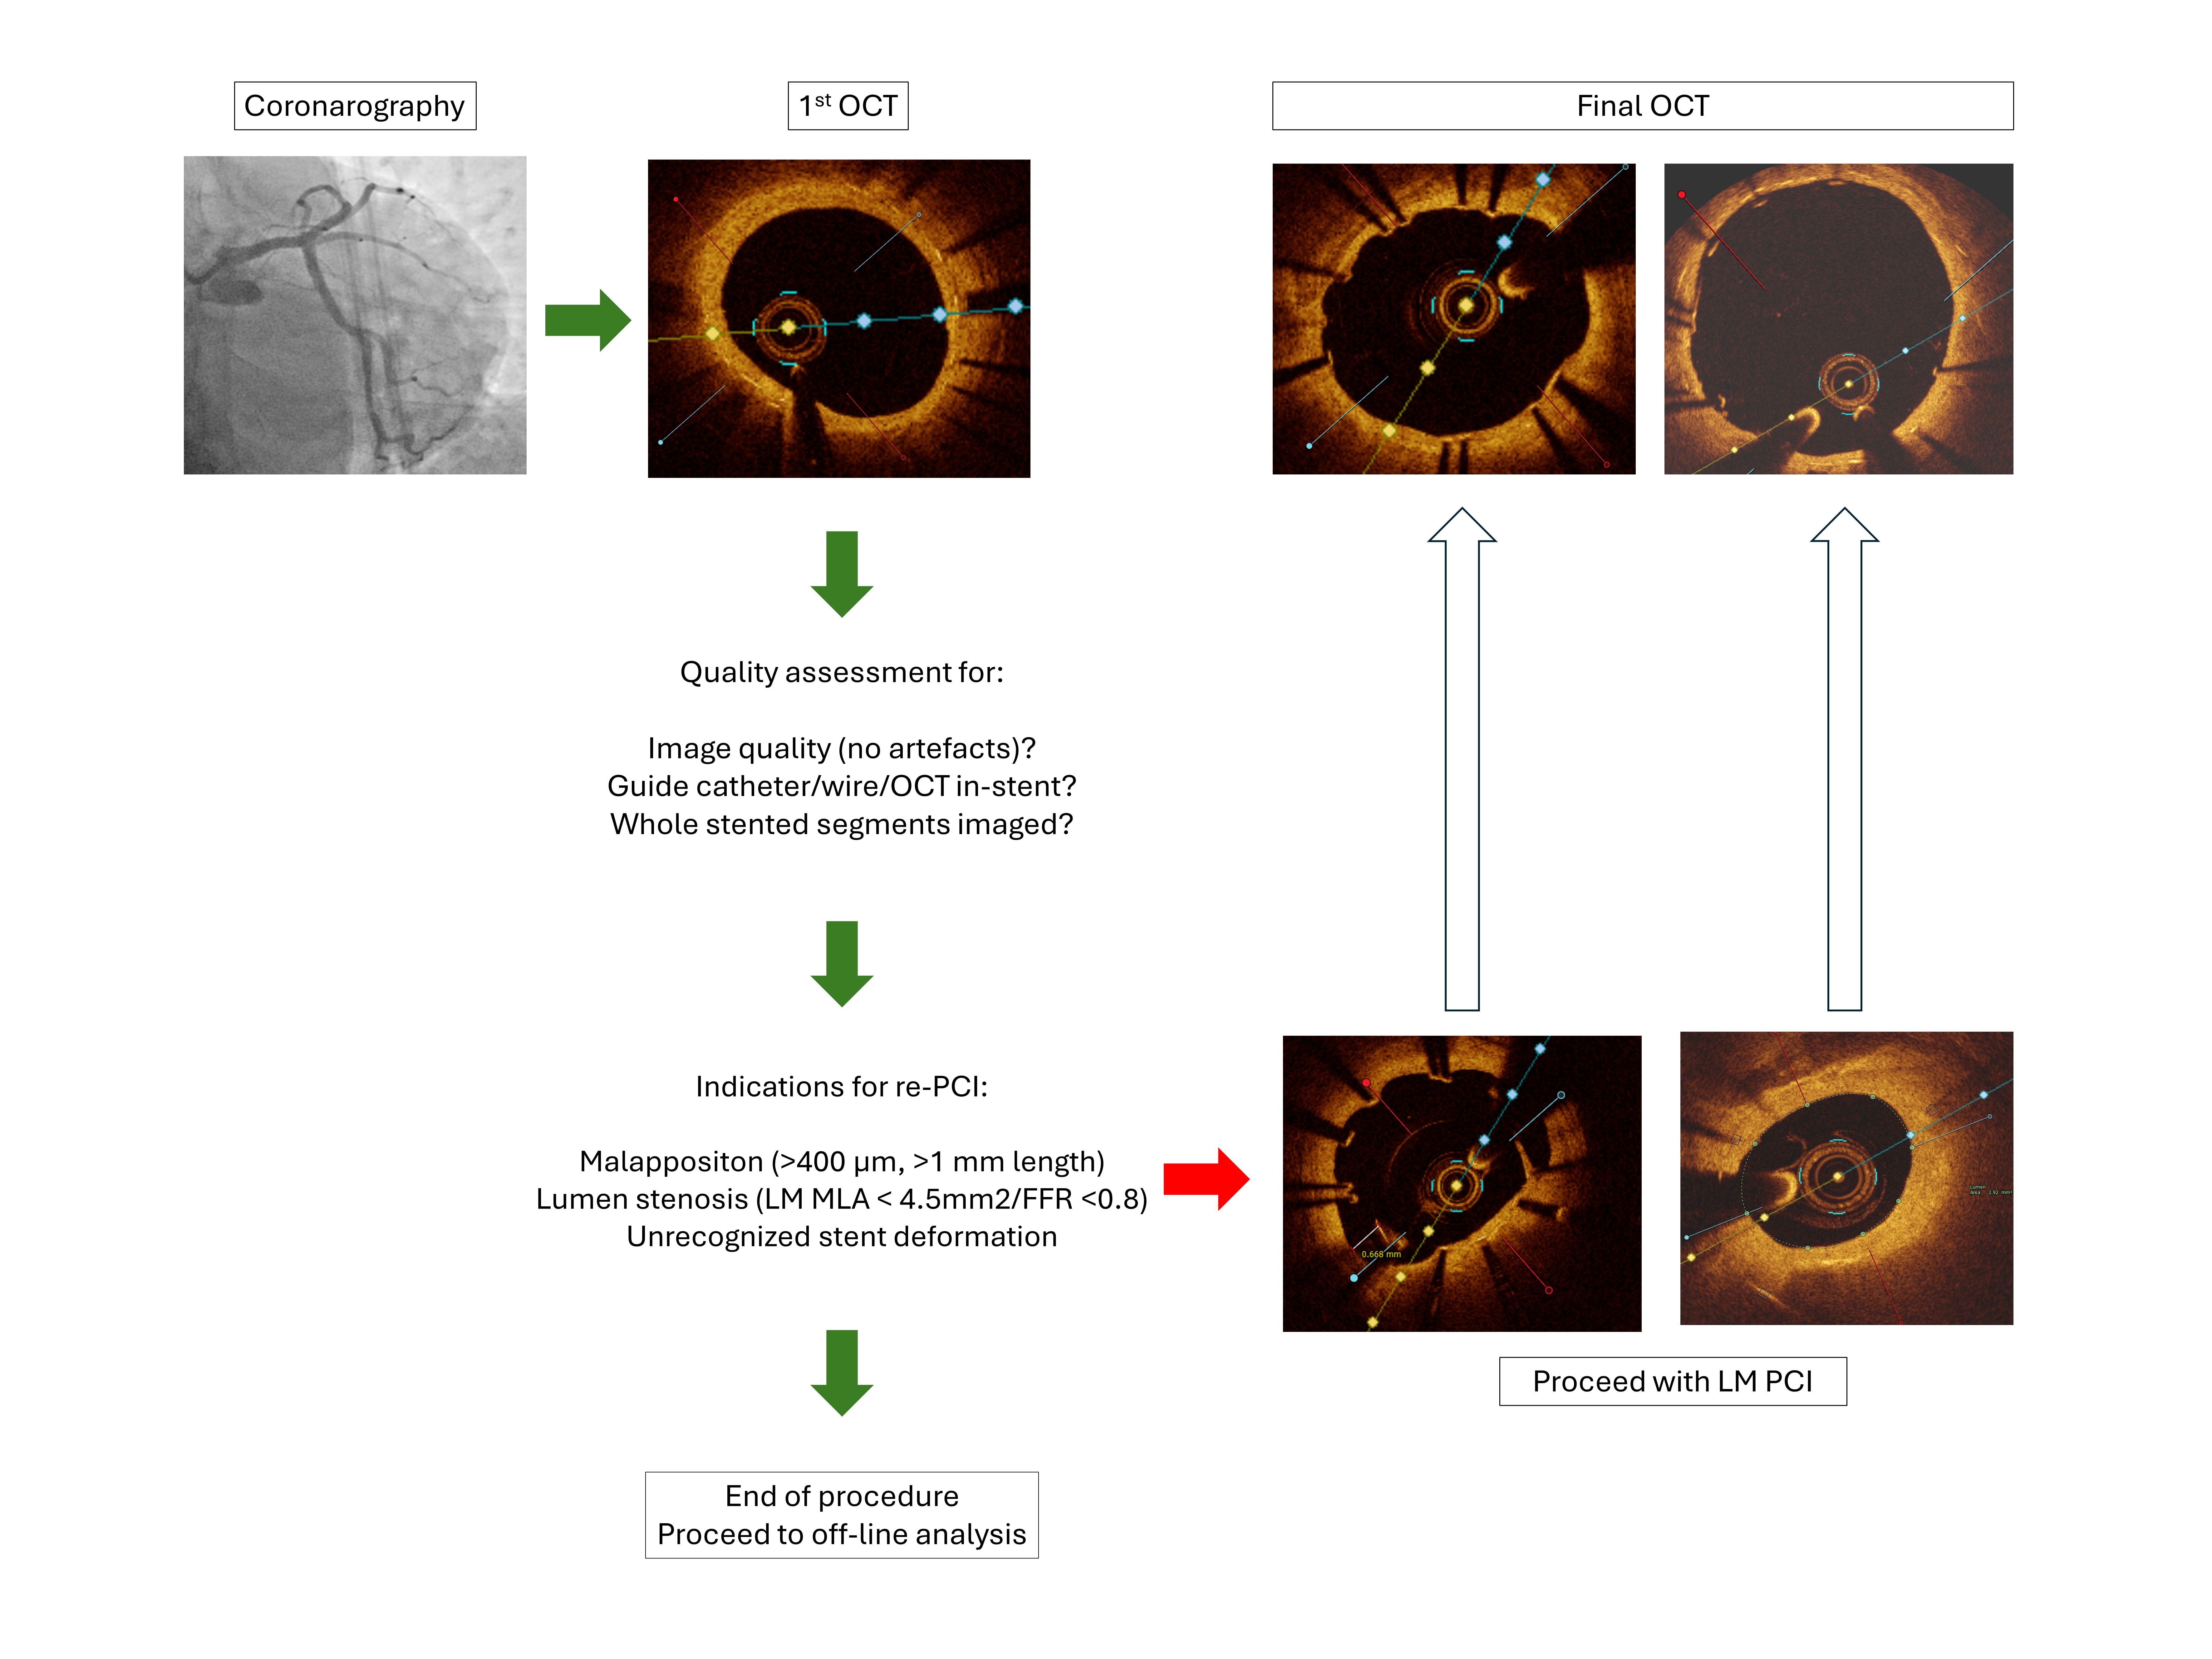 Fig. 3.
OCT follow-up protocol. LM, left main; MLA, minimal lumen area; OCT, optical coherence tomography; PCI, percutaneous coronary intervention; FFR, fractional flow reserve.
The primary OCT endpoints were the percentage of covered, uncovered, and malapposed stent struts assessed by OCT at long-term follow-up by segment (LM/POC/dMB). The main secondary endpoint was the impact of malapposition distance on vascular response and strut coverage. Additional secondary endpoints included feasibility of OCT imaging, lumen, stent measurements, cross-sectional and volumetric measurements, extent of neointimal hyperplasia (NIH), incidence of neoatherosclerosis, and impact of stent optimization techniques, performance of proximal optimization technique (POT) and kissing balloons inflation (KBI). For a complete list of OCT endpoints and definitions, see the OCT Supplementary Material (OCT variable and endpoints definitions).
Statistical analysis was performed using SPSS software version 26.0 (IBM Corp.,
Armonk, NY, USA). Continuous data were expressed as mean
Baseline clinical, angiographic, primary PCI procedural, and hospitalization characteristics of 15 patients that underwent urgent angiography with primary PCI of the ULM are reported in Table 1.
| Baseline and angiographic characteristics | N = 15 | Procedural and post-PCI characteristics | N = 15 | |
| Age (mean |
59.7 |
Mechanical circulatory support (N, %) | 0 (0.0) | |
| Male (N, %) | 12 (80.0) | “MADS” stenting classification (N, %) | ||
| STEMI (N, %) | 9 (60.0) | A | 14 (93.3) | |
| Admission KILLIP class (N, %) | S | 1 (6.7) | ||
| 1 | 14 (93.3) | Single stent | 13 (86.7) | |
| 4 | 1 (6.7) | |||
| Total ischemic time (mean |
365.6 |
Two stents | 2 (13.3) | |
| FMC to PCI time (mean |
186.1 |
TAP | 1 (6.7) | |
| Procedure time (mean |
54.8 |
Double-kissing crush | 1 (6.7) | |
| Femoral access (N, %) | 5 (33.3) | Immediate PCI of other lesions (N, %) | 2 | |
| Catheter |
3 (20.0) | No of stents implanted (mean |
1.5 | |
| Coronary left dominance (N, %) | 3 (20.0) | No of wires used (mean |
2.3 | |
| Collaterals |
1 (6.7) | No of balloons used (mean |
3.8 | |
| Diseased vessels (N, %) | TIMI 3 final post PCI (N, %) | |||
| Isolated LM disease | 8 (53.3) | LM | 15 (100.0) | |
| LM + 1 vessel | 4 (26.7) | distal MB | 15 (100.0) | |
| LM + 2 vessels | 1 (6.7) | SB | 15 (100.0) | |
| LM + 3 vessels | 2 (13.3) | Bifurcation lesion success (N, %) | ||
| “MEDINA” classification (N, %) | Overall | 14 (93.3) | ||
| 1.1.0 | 4 (26.7) | MB success | 15 (100.0) | |
| 1.1.1 | 4 (26.7) | SB success | 14 (93.3) | |
| 1.0.0 | 3 (20.0) | Post PCI EF (mean |
45.1 | |
| 0.1.0 | 2 (13.3) | Mechanical ventilatory support (N, %) | 1 (6.7) | |
| 0.1.1 | 1 (6.7) | KILLIP 4 class during hospitalization (N, %) | 3 (20.0) | |
| 1.1.0.1 | 1 (6.7) | Days of ICU stay (mean |
8.3 | |
| TIMI flow 0–1 pre-PCI (N, %) | Discharge P2Y12 inhibitor (N, %) | |||
| LM | 3 (20.0) | Clopidogrel | 3 (20.0) | |
| distal MB | 5 (33.3) | Ticagrelor | 11 (73.3) | |
| SB | 4 (26.7) | Prasugrel | 1 (6.7) | |
PCI, percutaneous coronary intervention; STEMI, ST-elevation myocardial infarction; FMC, first medical contact; LM, left main; EF, ejection fraction; ICU, intensive care unit; MADS, M-main, A-across, D-distal, S-side; MB, main branch; TIMI, thrombolysis in myocardial infarction; SB, side branch; SD, standard deviation; TAP, T-And Protrusion.
Most patients had a diagnosis of ST-elevation myocardial infarction (STEMI) as the indication for the PCI, had no signs of acute heart failure before the primary PCI (93.3%), underwent a simple, provisional stenting strategy in 86.7% of patients. In two cases, complex bifurcation stenting T-And Protrusion (TAP), and Double-Kissing Crush (DKC) were performed. The bifurcation procedure was successful in 14 patients (93.3%). All procedures were angiographically guided and without mechanical circulatory support. All subjects had an uncomplicated post-procedural intensive unit stay and were discharged with potent P2Y12 inhibitors in 80% of cases. After the initial discharge, only one subject had a myocardial infarction and underwent a PCI with non-target lesion revascularization (non-TLR), while the other subjects had an uneventful follow-up.
Follow-up angiography and OCT were performed 1580.5
| N = 15 | ||
| Days from baseline PCI (N, mean |
1580.5 | |
| OCT image quality optimal for analysis (N, %) | 14 (93.3) | |
| Amount of contrast dye used for follow-up procedure (mL, |
240.7 | |
| Difficult guide catheter selective LM canulation (N, %) | 3 (20.0) | |
| OCT/wire inadvertent abluminal stent side crossing (N, %) | 4 (26.6) | |
| Left main ostial segment visible (N, %) | 7 (46.7) | |
| Stent aortal protrusion (N, %) | 6 (40.0) | |
| Major | 3 (20.0) | |
| Minor | 3 (20.0) | |
| Unanalysable ostial stent segment (N, %) | 5 (33.3) | |
| Unanalysable stent measurable length (mm, mean |
1.7 | |
| Longitudinal stent deformation (N, %) | 1 (6.7) | |
| SB overhanging struts (N, %) | 14 (93.3) | |
| Neointimal proliferation on overhanging struts (N, %) | 10 (66.7) | |
| Obstruction of SB ostium, maximal neointimal proliferation distance ratio to SB opening (%, mean |
63.9 | |
| Thrombus (N, %) | 2 (13.4) | |
| White (N, %) | 0 (0.0) | |
| Red (N, %) | 0 (0.0) | |
| Organized (N, %) | 2 (13.4) | |
| Neoatherosclerosis (N, %) | 5 (33.3) | |
| Calcific neoatherosclerosis (N, %) | 2 (13.4) | |
| PCI following OCT/coronarography (N, %) | 7 (46.7) | |
| TLR only (N, %) | 2 (13.4) | |
| Non-TLR (N, %) | 2 (13.4) | |
| TLR and Non-TLR (N, %) | 3 (20.0) | |
OCT, optical coherence tomography; PCI, percutaneous coronary intervention; LM, left main; SB, side branch; SD, standard deviation; TLR, target lesion revascularization.
Despite stent protrusion following initial ostial stenting (40%), and abluminal
wire and/or OCT catheter placement (26.6%) (Fig. 4A), optimal image quality runs
were obtained in 93.3% (one subject had moderate quality due to residual blood
swirling artefacts), with an unanalysable measured stent length of 1.7
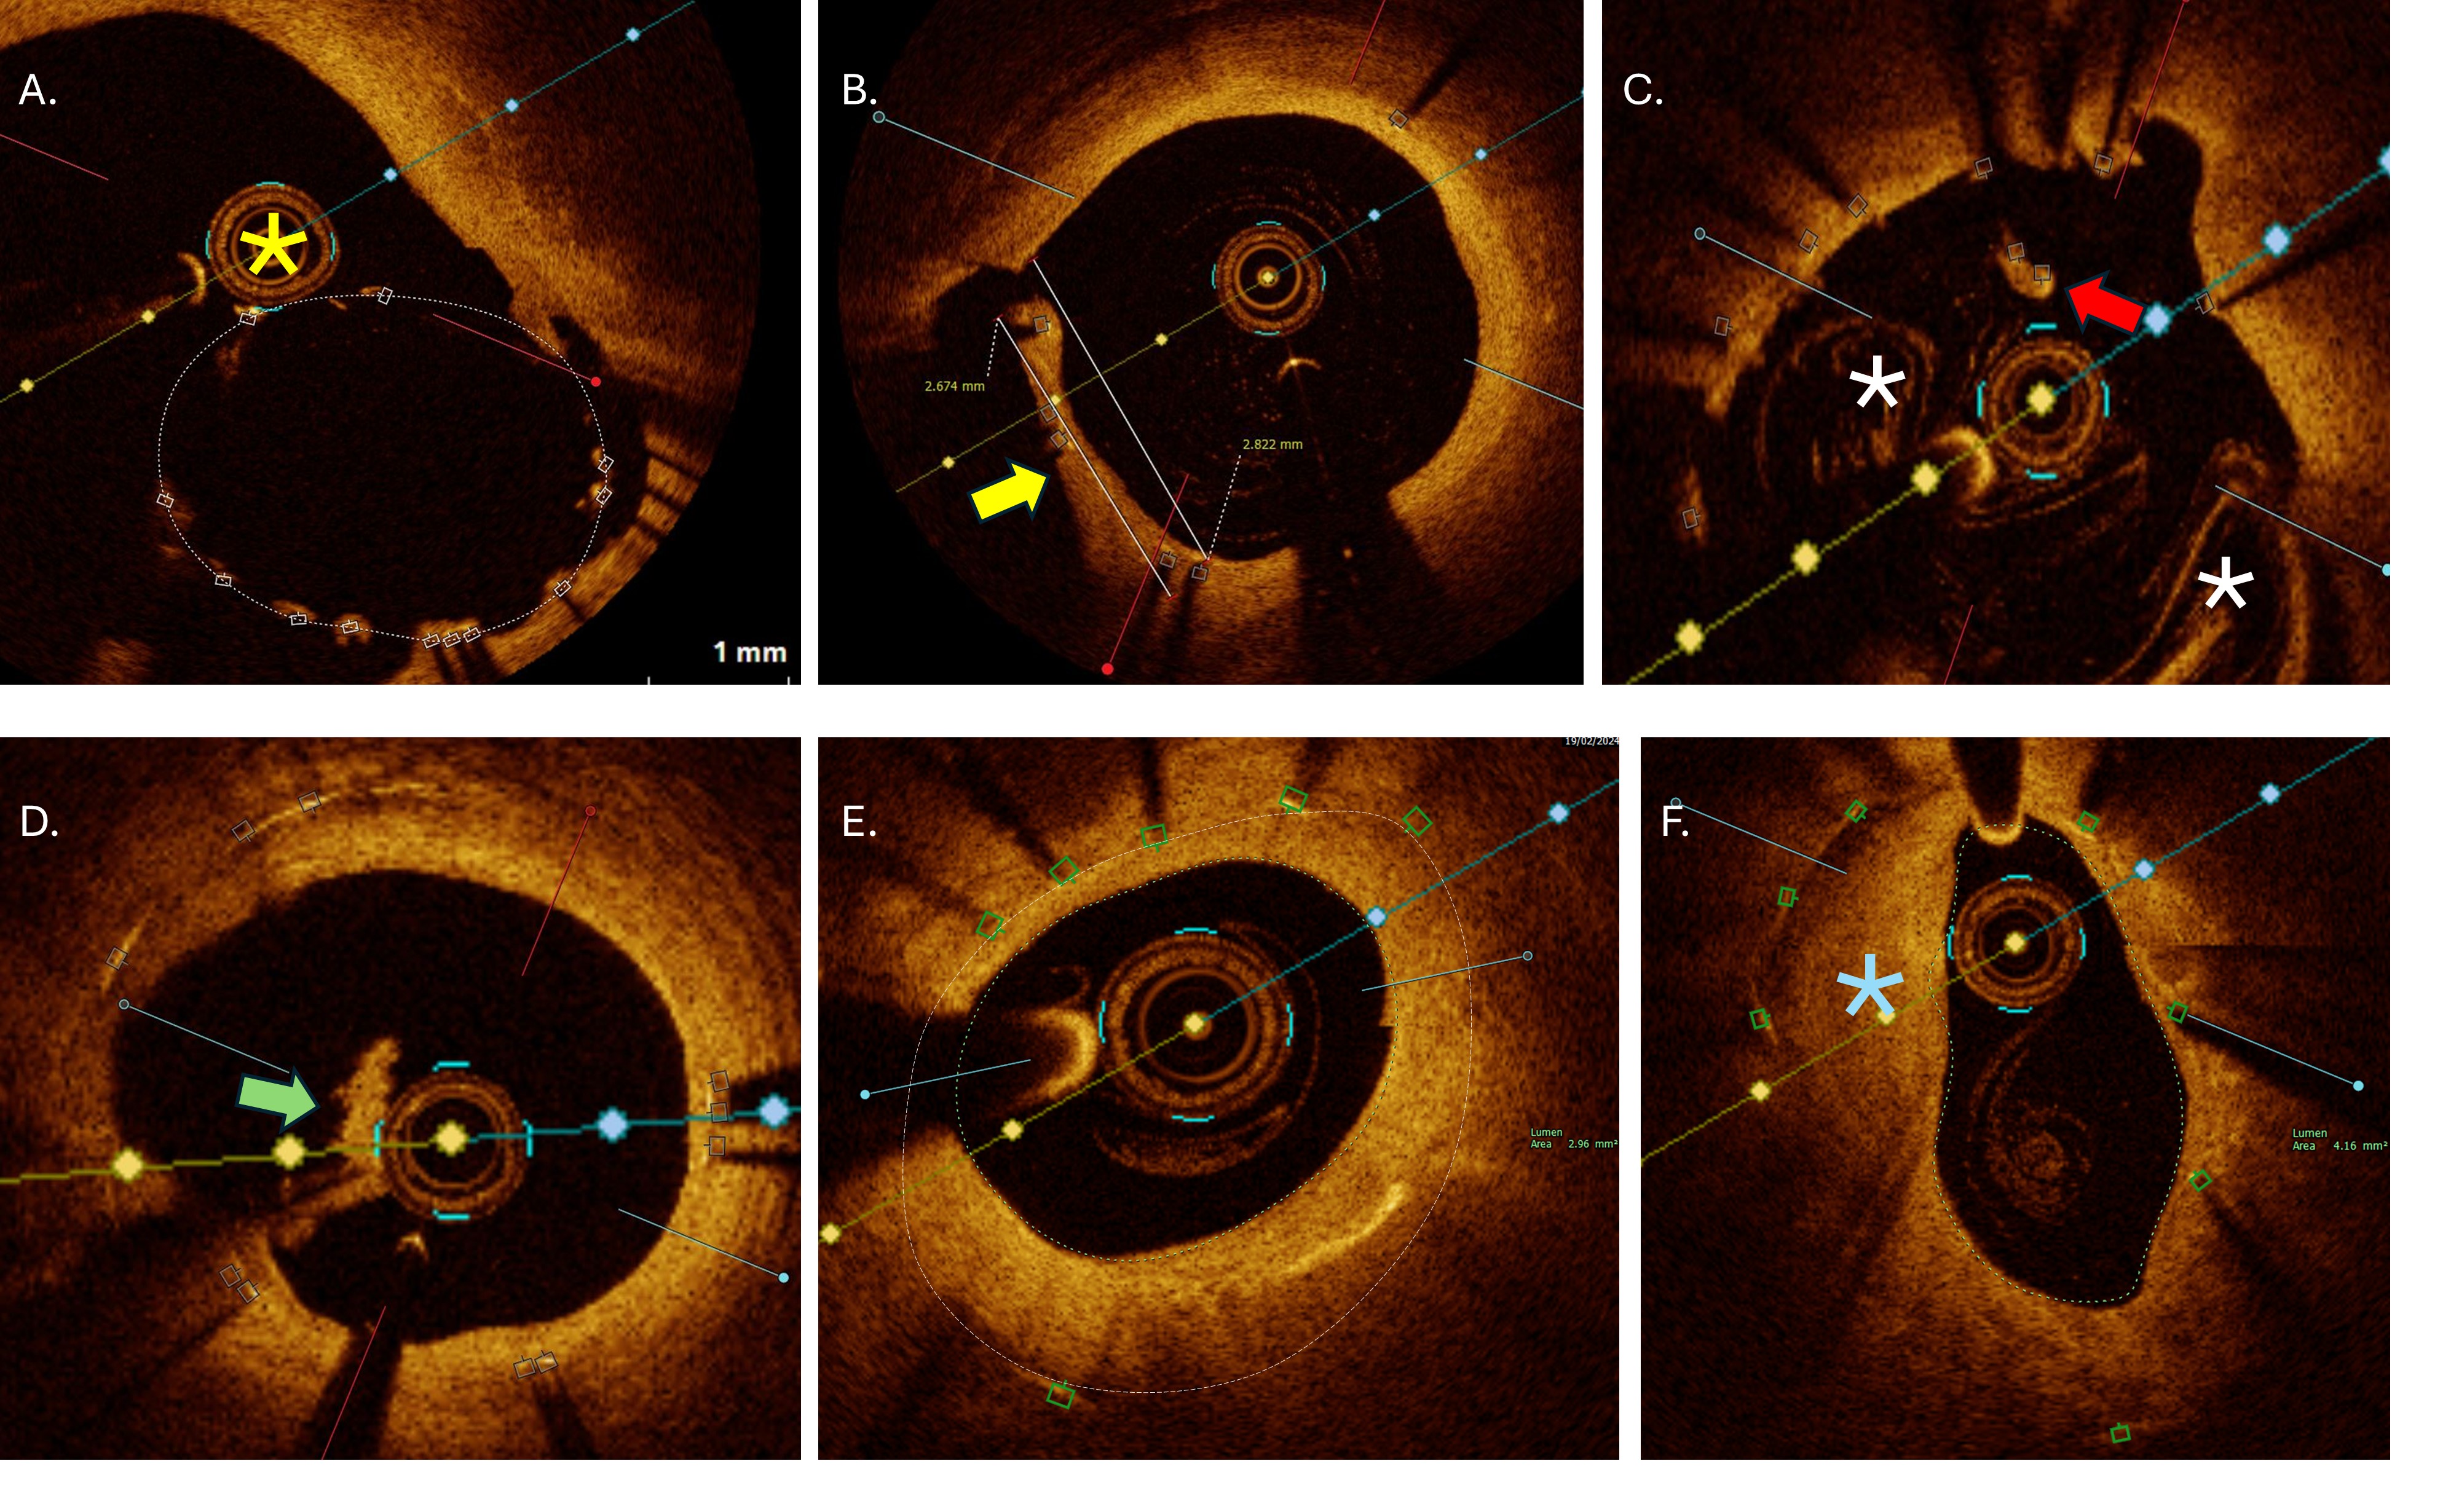 Fig. 4.
OCT exemplary images of analysed qualitative endpoints. (A) Passage of OCT catheter (yellow asterix) outside the stent in large polygon of confluence region due to suboptimal baseline balloon proximal optimization. (B) Obstruction of side branch orifice by overhanging struts neointimal hyperplasia (yellow arrow) with measurements. (C) Longitudinal stent deformation at the level of proximal stent edge with covered floating struts (red arrow). Residual blood artefacts (white asterix) characteristic for ostial cross-sections. (D) Organized thrombi (green arrow) attached on uncovered struts belonging to metallic neocarina following T and protrusion bifurcation stenting. (E) Significant neointimal hyperplasia with minimal lumen area of 2.96 mm2 within under-expanded stent (area 5.2 mm2) located at mid shaft of left main. (F) In-stent neoatherosclerosis (blue asterisk) with peri-strut low intensity area, located in distal left main with minimal lumen area 4.16 mm2. OCT, optical coherence tomography.
A total of 1944 cross-sections (frames) and 16,520 individual struts was
analysed. Larger mean lumen (12.8
Detailed strut-level analysis showed overall strut coverage of 89.5
| All segments | LM | POC | dMB | p | |
| Number of analysed cross sections (N, mean |
129.6 |
31.1 |
11.3 |
64.0 |
|
| Total region of interest length (cm, mean |
25.8 |
NA | NA | NA | NA |
| Analysed stent length (cm, mean |
21.0 |
6.6 |
2.4 |
12.4 |
|
| Reference area (mm2, mean |
NA | 16.4 |
16.4 |
7.3 |
|
| MLA (mm2, mean |
5.3 |
10.3 |
9.8 |
5.9 |
|
| Minimal lumen diameter at MLA (mm, mean |
2.2 |
2.9 |
2.9 |
2.4 |
0.051 |
| Mean lumen area (mm2, mean |
9.4 |
12.8 |
12.7 |
7.6 |
|
| Mean minimal lumen diameter (mm, mean |
2.9 |
3.5 |
2.8 |
2.8 |
0.024 |
| Lumen area stenosis (%, mean |
NA | 39.1 |
36.3 |
16.4 |
0.034 |
| Lumen volume (mm3, mean |
198 |
75.3 |
31.0 |
95.1 |
0.001 |
| Stent volume (mm3, mean |
210.3 |
79.4 |
27.3 |
10.8 |
|
| In-stent NIH volume (mm3, mean |
30.0 |
10.5 |
3.6 |
17.6 |
0.002 |
| NIH area at MLA (mm2, mean |
2.5 |
1.9 |
1.9 |
1.9 |
0.961 |
| Mean NIH area (mm2, mean |
1.5 |
1.6 |
1.6 |
1.4 |
0.779 |
| Malapposition volume (mm3, mean |
11.6 |
3.5 |
5.8 |
0.7 |
|
| Mean malapposition area (mm2, mean |
0.4 |
1.7 |
1.9 |
0.2 |
0.037 |
| Mean stent area (mm2, mean |
10.3 |
13.2 |
11.8 |
9.0 |
0.004 |
| Stent area at MLA (mm2, mean |
8.0 |
11.5 |
11.1 |
8.1 |
0.016 |
| Minimal stent area (mm2, mean |
7.0 |
10.3 |
8.7 |
7.1 |
0.006 |
| Minimal stent expansion (%, mean |
NA | 63.8 |
56.9 |
100.9 |
|
| Mean stent expansion (%, mean |
NA | 81.6 |
74.7 |
128.4 |
|
| Difference reference area - mean stent area (mm2, mean |
NA | 3.9 |
4.5 |
–1.7 |
|
| Total number of analysed struts (N, mean |
1101.3 |
289.1 |
100.1 |
756.3 |
0.001 |
| Analyzed struts per cross section (N, mean |
10.1 |
9.1 |
9.3 |
11.2 |
0.043 |
| Covered (%, mean |
86.9 |
78.9 |
79.8 |
92.3 |
0.015 |
| Uncovered (%, mean |
8.7 |
9.7 |
7.0 |
7.3 |
0.526 |
| Malapposed (%, mean |
4.4 |
11.4 |
13.1 |
0.3 |
0.005 |
| Malapposed and uncovered (%, mean |
2.6 |
8.6 |
9.3 |
0.2 |
0.01 |
| Malapposition |
1.7 |
5.6 |
8.1 |
0.0 |
0.011 |
| Malapposition |
1.2 |
4.4 |
5.9 |
0.0 |
0.013 |
| Total covered (covered + malapposed covered) (%, mean |
89.5 |
81.7 |
83.7 |
92.4 |
0.041 |
| Cross sections with |
7.9 |
9.9 |
3.8 |
5.5 |
0.204 |
| Maximum consecutive length with uncovered struts (%, mean |
2.8 |
1.3 |
0.8 |
1.6 |
0.311 |
| Cross sections with |
7.3 |
20.6 |
19.9 |
0.0 |
0.018 |
| Maximum consecutive length with malapposed struts (%, mean |
1.9 |
1.2 |
1.6 |
0.2 |
0.024 |
OCT, optical coherence tomography; LM, left main; POC, polygon of confluence; dMB, distal main branch; MLA, minimal lumen area; NA, not applicable; NIH, neointimal hyperplasia; SD, standard deviation.
Absolute difference in reference area and mean stent area correlated with
percentage of covered and malapposed
| LM | POC | dMB | R2 | p | |
| Reference area (mm2, mean |
16.4 |
16.4 |
7.3 |
NA | |
| Mean stent area (mm2, mean |
13.2 |
11.8 |
9.0 |
NA | 0.004 |
| Difference reference area - mean stent area (mm2, mean |
3.9 |
4.5 |
–1.7 |
NA | |
| Total covered (%, mean |
78.9 |
79.8 |
92.3 |
0.268 | 0.000 |
| Malapposed (N, mean |
25.2 |
13.1 |
19.3 |
0.355 | 0.241 |
| Malapposed (%, mean |
11.4 |
13.1 |
0.3 |
0.265 | 0.008 |
| Malapposed and uncovered (N, mean |
20.0 |
9.4 |
0.0 |
0.316 | 0.429 |
| Malapposed and uncovered (%, mean |
8.6 |
9.3 |
0.2 |
0.252 | 0.161 |
| Malapposed |
8.4 |
7.9 |
8.1 |
0.421 | 0.028 |
| Malapposed |
5.6 |
8.1 |
0.0 |
0.189 | 0.028 |
| Malapposed |
6.7 |
5.9 |
6.3 |
0.425 | 0.030 |
| Malapposed |
4.4 |
5.9 |
0.0 |
0.176 | 0.005 |
dMB, distal main branch; LM, left main; POC, polygon of confluence; SD, standard deviation; NA, not applicable.
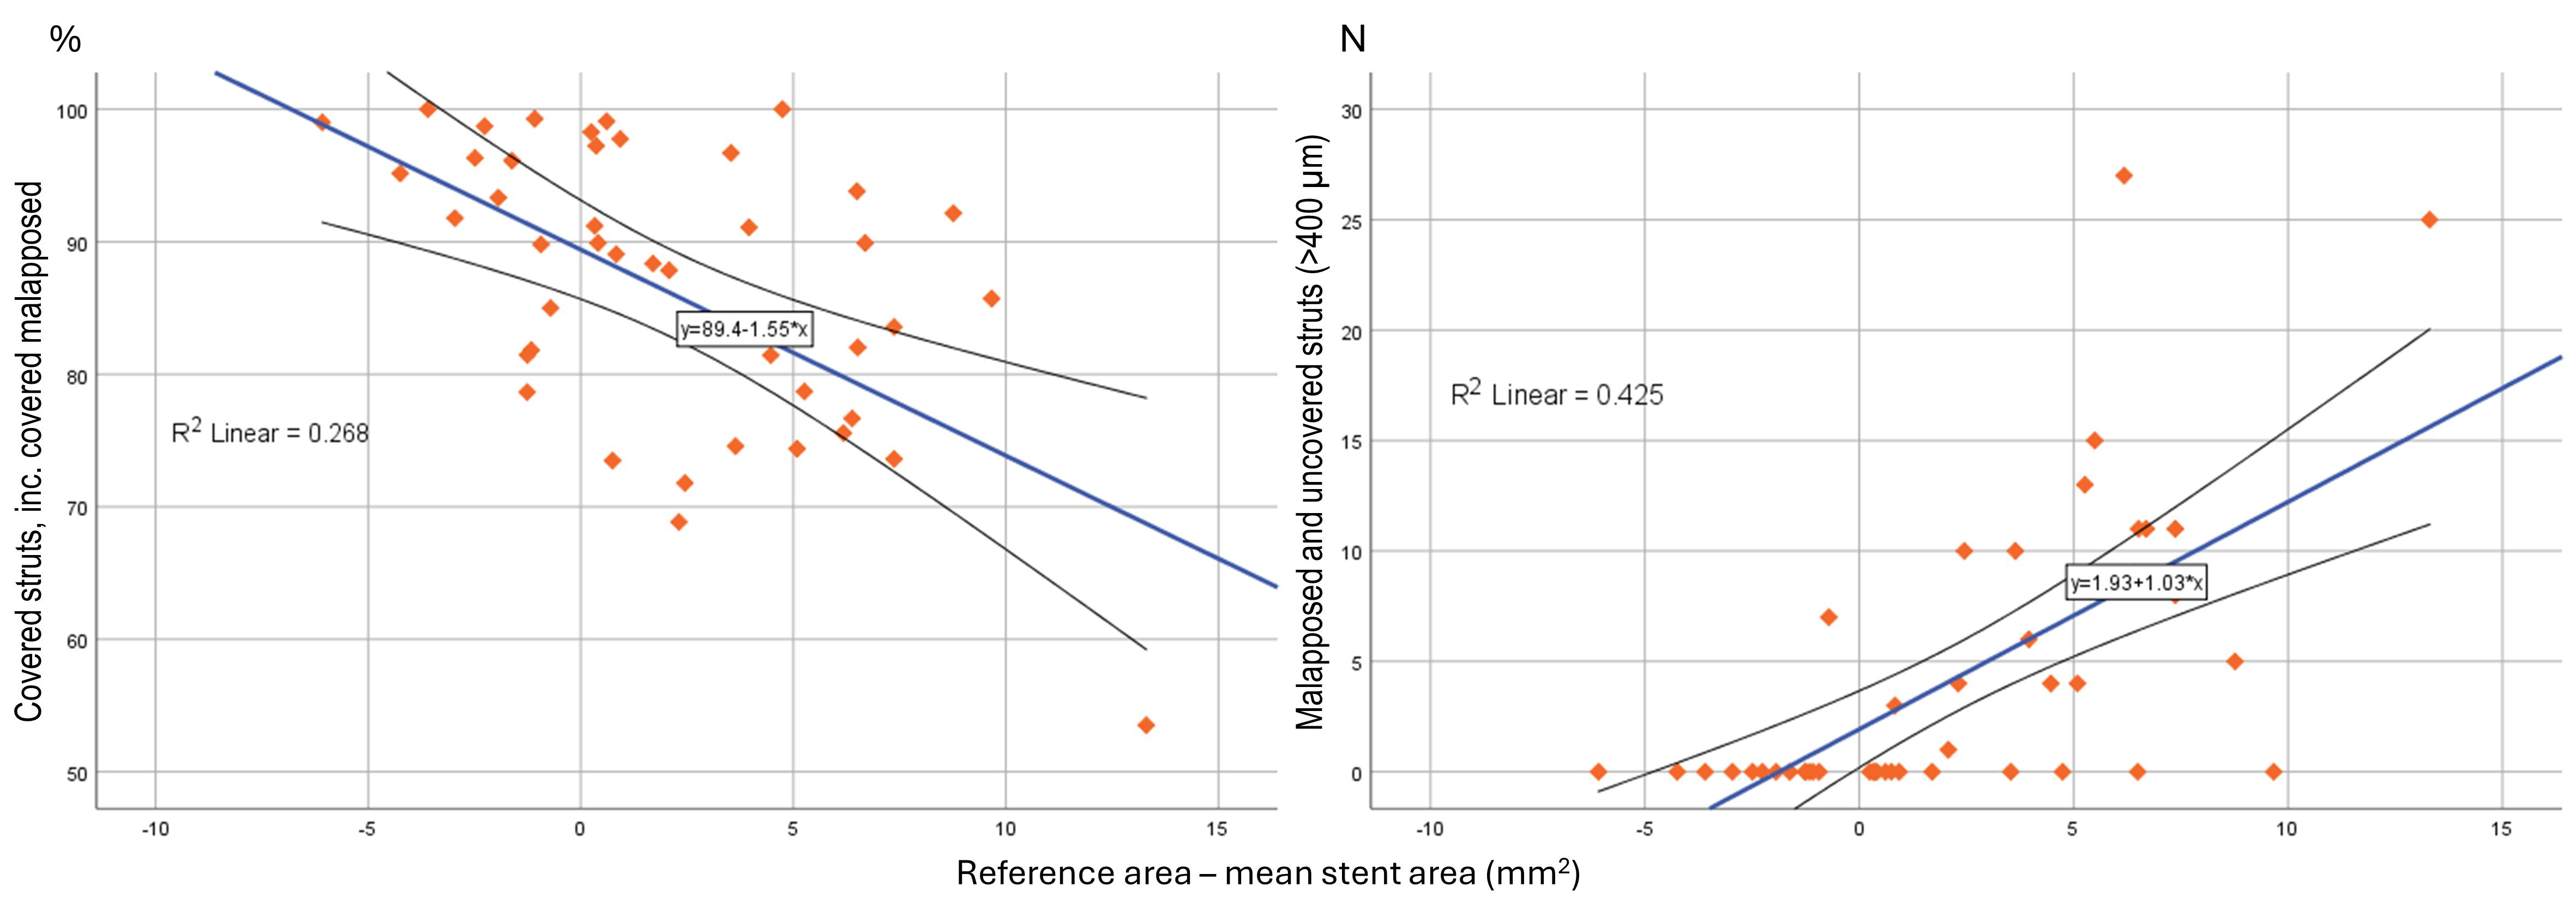 Fig. 5.
Scatter-dot matrix showing and correlation analysis between absolute difference, reference - mean stent area, to strut coverage and malapposition.
Malapposed struts with distance
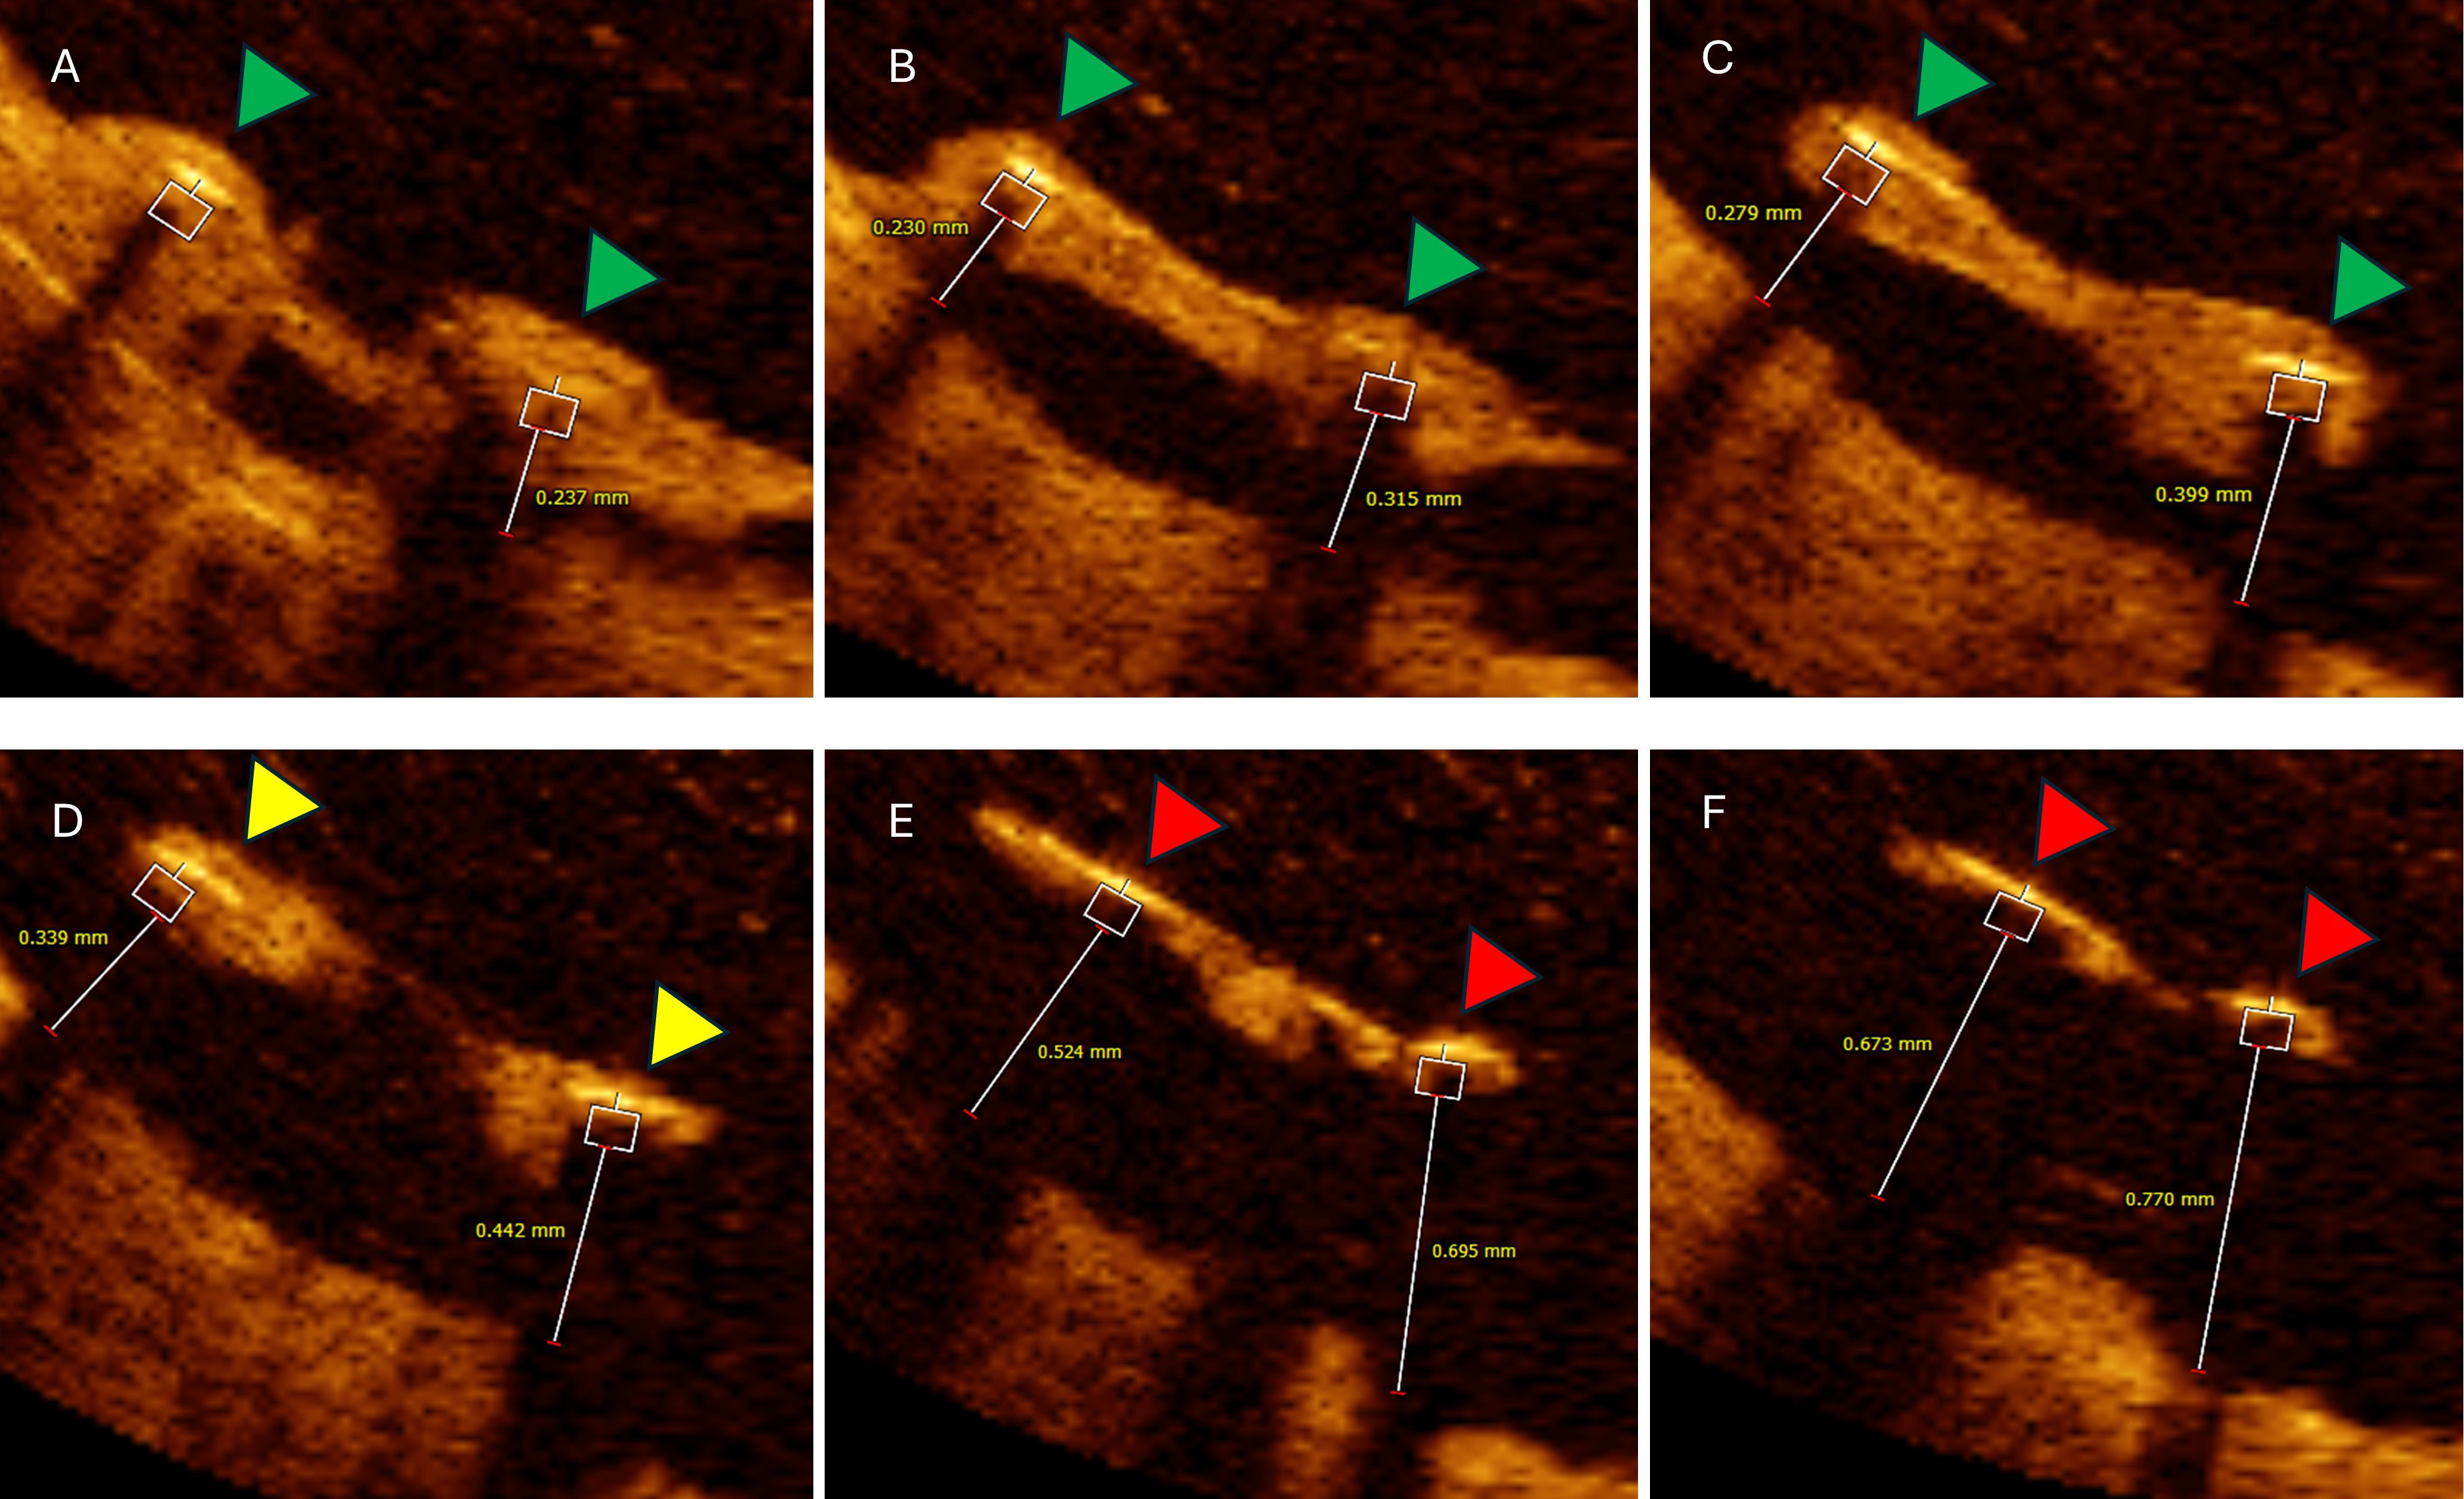 Fig. 6.
Six consecutive OCT cross-sections illustrating impact of
malapposed distance on follow-up neointimal coverage. Analysed cross-section
distance 0.2 mm. (A–C) Two malapposed but completely covered struts (green
triangles) with hyperplastic tissue extensions from adjacent vessel wall with
maximal malapposition distance bellow 400 µm. (D) Same malapposed
but partially covered struts (yellow triangles). (E,F) Same malapposed and
uncovered struts with measured malapposition distance
Mean proximal reference diameter was 4.6
| LM segment | POC segment | |||||||
| POT only | POT+KBI | No optimization | p | POT only | POT+KBI | No optimization | p | |
| N = 6 | N = 6 | N = 3 | N = 6 | N = 6 | N = 3 | |||
| Reference area (mm2, mean |
17.2 |
17.1 |
13.1 |
0.207 | 17.2 |
17.1 |
13.1 |
0.207 |
| MLA (mm2, mean |
10.1 |
12.3 |
6.9 |
0.376 | 10.1 |
10.4 |
7.9 |
0.682 |
| Mean lumen area (mm2, mean |
12.9 |
14.9 |
8.1 |
0.136 | 13.1 |
13.2 |
10.8 |
0.662 |
| Mean minimal lumen diameter (mm, mean |
3.5 |
3.8 |
2.9 |
0.131 | 3.0 |
2.7 |
2.7 |
0.436 |
| Lumen area stenosis (%, mean |
41.6 |
26.7 |
59.2 |
0.131 | 39.5 |
34.1 |
35.7 |
0.944 |
| Lumen volume (mm3, mean |
75.8 |
75.2 |
74.3 |
0.999 | 33.9 |
27.4 |
33.5 |
0.747 |
| Stent volume (mm3, mean |
83.3 |
78.3 |
75.6 |
0.964 | 27.8 |
26.4 |
28.3 |
0.977 |
| In-stent NIH volume (mm3, mean |
14.3 |
8.9 |
7.2 |
0.555 | 4.6 |
2.9 |
3.1 |
0.311 |
| NIH area at MLA (mm2, mean |
2.5 |
1.4 |
1.6 |
0.236 | 2.2 |
1.9 |
1.1 |
0.204 |
| Mean NIH area (mm2, mean |
2.0 |
1.5 |
0.9 |
0.123 | 2.1 |
1.6 |
1.0 |
0.189 |
| Malapposition volume (mm3, mean |
3.5 |
3.0 |
4.1 |
0.937 | 8.3 |
2.9 |
7.1 |
0.050 |
| Mean malapposition area (mm2, mean |
2.4 |
1.6 |
0.3 |
0.613 | 3.2 |
0.8 |
2.1 |
0.013 |
| Mean stent area (mm2, mean |
13.9 |
14.8 |
8.5 |
0.030 | 11.9 |
12.8 |
9.6 |
0.564 |
| Stent area at MLA (mm2, mean |
11.7 |
12.8 |
8.3 |
0.317 | 11.6 |
12.0 |
8.6 |
0.394 |
| Minimal stent area (mm2, mean |
10.9 |
10.9 |
7.5 |
0.341 | 9.9 |
7.9 |
8.1 |
0.682 |
| Minimal stent expansion (%, mean |
64.0 |
72.8 |
45.3 |
0.340 | 58.9 |
50.1 |
67.1 |
0.293 |
| Difference reference area - mean stent area (mm2, mean |
3.1 |
2.3 |
8.8 |
0.067 | 5.3 |
4.4 |
3.5 |
0.648 |
| Covered (%, mean |
14.9 |
75.9 |
78.3 |
0.863 | 73.9 |
84.2 |
80.5 |
0.289 |
| Uncovered (%, mean |
6.0 |
10.7 |
14.9 |
0.349 | 6.7 |
7.3 |
7.1 |
0.754 |
| Malapposed (N, mean |
19.8 |
14.3 |
57.7 |
0.405 | 21.7 |
6.5 |
12.0 |
0.140 |
| Malapposed (%, mean |
11.6 |
11.3 |
6.7 |
0.871 | 19.3 |
8.5 |
12.4 |
0.085 |
| Malapposed and uncovered (%, mean |
7.4 |
10.8 |
6.4 |
0.879 | 10.1 |
6.9 |
12.4 |
0.479 |
| Malapposition |
19.8 |
14.3 |
57.6 |
0.972 | 9.0 |
3.3 |
6.0 |
0.007 |
| Malapposition |
4.7 |
8.8 |
0.9 |
0.571 | 13.6 |
4.9 |
5.6 |
0.066 |
| Malapposition |
4.1 |
7.1 |
0.9 |
0.596 | 8.4 |
4.5 |
5.6 |
0.392 |
| Total covered (covered + malapposed covered) (%, mean |
86.5 |
78.4 |
78.6 |
0.700 | 83.1 |
85.8 |
80.5 |
0.746 |
LM, left main; POC, polygon of confluence; POT, proximal optimization technique; KBI, kissing balloon inflation; MLA, minimal lumen area; NIH, neointimal hyperplasia; OCT, optical coherence tomography; SD, standard deviation.
The present analysis provides OCT insights into the late imaging results of DES implantation during the primary PCI of culprit ULM bifurcation lesions. The key findings are: (1) Regarding the primary endpoint, the strut coverage is not optimal in proximal bifurcation segments; (2) Although contemporary stent optimization procedures were performed, late malapposition and stent under-expansion were common because of the disproportionately larger proximal bifurcation segments compared to the DES used; (3) Strut malapposition distance affects strut endothelization during long-term follow-up; (4) Invasive imaging revealed a high incidence of subclinical de-novo atherosclerosis and restenotic intimal hyperplasia, necessitating late optimization and additional treatment.
PCI of bifurcation lesions is more likely to result in death, myocardial infarction, and repeat revascularization compared to non-bifurcation PCI [17]. During bifurcation PCI, complex stent implantation techniques are often required, in which the stent must be specifically adapted to the underlying anatomy [18, 19]. Early pathological post-mortem analyses indicated that bifurcation stenting is a significant risk factor for ST due to the presence of uncovered and malapposed struts [20]. However, these analyses didn’t identify the extent or pattern of strut coverage for stents deployed at the bifurcation. In our patient population, we demonstrated a persistent suboptimal level of strut coverage in left main bifurcation lesions, particularly in large proximal portions (78.9 and 79.8% for LM and POC, respectively).
Our findings are in line with previous reports that demonstrated, albeit at
earlier time points, higher rates of incomplete endothelialization, also limited
to the proximal bifurcation segments [10, 12, 21]. In the largest reported serial
OCT analysis of 33 patients undergoing elective ULM PCI with DES, Fujino
et al. [10] reported relatively high rates of uncovered and malapposed
struts (18.7% and 5.3%, respectively) in the LM region at 9 months. Although,
the percentage of malapposed struts decreased in follow-up compared to baseline (5.3% vs. 13.9%; p
If acute stent malapposition is not corrected, it decreases over time as a result of neointimal proliferation, and the distance of the strut to the vessel wall [25]. Serial OCT evaluations showed that endothelialization progresses rapidly in the early period after DES implantation reaching more than 90% at three months [26]. In our later analysis (average 1580 days), the time interval to follow-up OCT did not correlate with the percentage of struts covered (p = 0.343). Since this was not an imaging analysis with serial assessments of the same devices but only a very late observational evaluation, we could not investigate the relationship between strut coverage and the post-PCI time interval.
In our analysis, significantly malapposed struts
All baseline primary PCI procedures were performed by experienced operators in a
high-volume primary PCI center (around 800 primary PCIs and 100 ULM PCIs annually
during the study period). POT was performed with angiographically, 1:1 sized,
non-compliant or semi-compliant balloons at high pressures. However, high rates
of late malapposition were still noted in the LM and POC regions due to the
disproportionately larger proximal reference size, highlighting the importance of
balloon sizing according to IVI measurements and achieving a larger stent area,
in contrast to the results of angiographic balloon sizing reported in this study.
We found that larger reference area to mean stent area mismatch, was associated
with the percentage of total covered struts (R2 = 0.268, p
Finally, five patients (33.3%) underwent ad hoc OCT-guided ULM reintervention due to subclinical DES failure. According to the collected data, DES is effective in preventing early and mid-term restenosis, but are unable to absolutely prevent proliferative neointimal hyperplasia and the development of neo-atherosclerosis, especially if not properly expanded or adequately sized [33, 34]. Specifically, for the ULM PCI, Kang et al. [34] showed that stent underexpansion detected by IVI, results in lower event-free survival at 9 months. The minimal stent area (MSA) cutoffs that best predicted restenosis was 5.0 mm2 for ostial left circumflex, 6.3 mm2 for ostial left anterior descending (LAD), 7.2 mm2 for the POC, and 8.2 mm2 for the LM segment. Although measured MSA in our population was above the specified criteria (10.3 mm2 for LM and 7.1 mm2 for LAD), neoatheroslerosis was detected in 33.3% of cases at long-term follow-up. According to the published data, neoatherosclerosis is one of the leading underlying reasons for very-late ST, reported to be present in 22–31% of late events [24, 35]. It is well known that coronary bifurcation lesions have a higher risk of developing in-stent restenosis than non-bifurcation lesions [17]. This is partially due to distinct flow patterns and areas of low shear stress [36]. Finally, there is insufficient evidence regarding the optimal treatment strategy for stent failure in ULM, as surgical revascularization is usually considered due to the unique challenges associated with a failed PCI in ULM lesions [37]. Further research is necessary to confirm our findings.
There are several limitations of this study. The main limitation is the observational design and small sample size, therefore, no definitive conclusions regarding the impact of the observed OCT findings on clinical outcomes is possible. This is a pilot study, and findings should be considered hypothesis-generating and need to be investigated in future larger studies. However, this study illustrates for the first time a very late vascular response after angio-guided implantation of DES during ULM primary PCI using high-resolution imaging and unintended stent deformation, which resulted in reinterventions in 33.3% of patients. Since IVI was not performed at baseline, it is not possible to compare very late follow-up imaging findings with the results of the index procedure. In addition, incomplete blood clearance at the LM ostium impaired adequate OCT assessment of the ostial segment. The current study population included only subjects who did not experience any clinical events and TLR during the follow-up, and excluded patients without severe renal and heart failure, which reduces the generalizability of our results.
Long-term OCT evaluation of coronary stents implanted during primary PCI for ULM lesions demonstrates high rates of incomplete strut coverage, late malapposition, de novo atherosclerosis, and restenotic neointimal hyperplasia. The unfavourable OCT results of angio-guided DES implantations advocate for attention and greater implementation of image optimization strategies during primary PCI. Further research is needed to validate these results and improve the percutaneous treatment of ULM lesions during primary PCI.
DES, drug-eluting stents; DKC, double kissing crush; CABG, coronary artery bypass graft; CKF, chronic kidney failure; EF, ejection fraction; FMC, first medical contact; HF, heart failure; IVI, intravascular imaging; KBI, kissing balloon inflation; LAD, left anterior descending; LM, left main; MADS, Main, Across, Distal, Side; MB, main branch; MSA, minimal stent area; NIH, neointimal hyperplasia; Non-TLR, non-target lesion revascularization; OCT, optical coherence tomography; PCI, percutaneous coronary intervention; POC, polygon of confluence; POT, proximal optimization technique; SB, side branch; SD, standard deviation; ST, stent thrombosis; STEMI, ST-elevation myocardial infarction; TAP, T-And Protrusion; TLR, target lesion revascularization; ULM, unprotected left main.
The datasets used and/or analyzed during the current study are available from the corresponding author on reasonable request.
Conceptualization, methodology, article writing ZM and GS; Project supervision – GS; ZM, DJ analysed and performed OCT analysis. ZM, VV, SS, BB, DO, MTom, MD, MTes, DMil, SA, VD, MZ, SJ, DJ, DMla, GS performed either baseline primary PCI or were involved in follow-up invasive angiography or OCT recordings. All authors were involved in drafting or in critical revision of the manuscript. All authors read and approved the final manuscript. All authors have participated sufficiently in the work and agreed to be accountable for all aspects of the work.
The research protocol was approved by the Council of Scientific Field of Medical Sciences, of the Faculty of Medicine, University of Belgrade (61206-4744/2-21), and the Research Board of the Department of cardiology of the University Clinical Center of Serbia (review No: 1883), and all of the participants provided signed informed consent.
Not applicable.
This research was funded and supported by: Ministry of Education, Science and Technological Development of Republic of Serbia, Research project No. 175082; Science Fund of the Republic of Serbia, grant No. 7558, SINERGY-ACUTE project; Serbian Academy of Sciences and Arts, project F-42.
The authors declare no conflict of interest.
Supplementary material associated with this article can be found, in the online version, at https://doi.org/10.31083/j.rcm2512445.
References
Publisher’s Note: IMR Press stays neutral with regard to jurisdictional claims in published maps and institutional affiliations.