


 , Cong Zhou 2,5,*
1 Department of Psychiatry, Shandong Daizhuang Hospital, 272075 Jining, Shandong, China
2 School of Mental Health, Jining Medical University, 272002 Jining, Shandong, China
3 Department of Psychiatry, Xiamen Xianyue Hospital, 361012 Xiamen, Fujian, China
4 Department of Psychiatry, The First Affiliated Hospital of Kunming Medical University, 650032 Kunming, Yunnan, China
5 Department of Psychology, Affiliated Hospital of Jining Medical University, 272067 Jining, Shandong, China
Abstract
Identifying white matter (WM) microstructural similarities and differences between major depressive disorder (MDD) and bipolar disorder (BD) is an important way to understand the potential neuropathological mechanism in emotional disorders. Numerous diffusion tensor imaging (DTI) studies over recent decades have confirmed the presence of WM anomalies in these two affective disorders, but the results were inconsistent. This study aimed to determine the statistical consistency of DTI findings for BD and MDD by using the coordinate-based meta-analysis (CBMA) approach.
We performed a systematic search of tract-based spatial statistics (TBSS) studies comparing MDD or BD with healthy controls (HC) as of June 30, 2024. The seed-based d-mapping (SDM) was applied to investigate fractional anisotropy (FA) changes. Meta-regression was then used to analyze the potential correlations between demographics and neuroimaging alterations.
Regional FA reductions in the body of the corpus callosum (CC) were identified in both of these two diseases. Besides, MDD patients also exhibited decreased FA in the genu and splenium of the CC, as well as the left anterior thalamic projections (ATP), while BD patients showed FA reduction in the left median network, and cingulum in addition to the CC.
The results highlighted that altered integrity in the body of CC served as the shared basis of MDD and BD, and distinct microstructural WM abnormalities also existed, which might induce the various clinical manifestations of these two affective disorders. The study was registered on PROSPERO (http://www.crd.york.ac.uk/PROSPERO), registration number: CRD42022301929.
Keywords
- major depressive disorder
- bipolar disorder
- diffusion tensor imaging
- white matter
- tract-based spatial statistics
- SDM
Major depressive disorder (MDD) and bipolar disorder (BD) are disabling mood disorders with unclear neuropathological mechanisms [1]. These conditions significantly affect quality of life and impose a heavy burden on patients and society [2, 3, 4]. Both common and distinct genetic, molecular, and neuroimaging mechanisms play crucial roles in MDD and BD [5, 6]. This leads to the complexity of the clinical manifestations of these two emotional disorders and presents large challenges to timely diagnosis and effective treatments of the diseases [7]. MDD often occurs early during mood disorders that eventually meet the diagnostic criteria for BD [8, 9]. Nearly 60% of BD patients are initially diagnosed with unipolar depression [10, 11]. Besides, during a depressive episode, only 20% of BD patients receive a correct diagnosis of BD within the first year of seeking treatment, and the incubation period from onset to diagnosis and appropriate treatment averages 5 to 10 years [11]. Many BD patients themselves do not recognize hypomania as pathological or as needing clinical help, although typically seek help for depression [9]. Thus, a deeper understanding of the pathological mechanism as well as seeking objective and reliable diagnostic biomarkers of MDD and BD are an urgent need.
Advances in magnetic resonance imaging (MRI) could help to investigate the neurobiological characteristics of psychiatric diseases. Structural MRI (sMRI) studies have identified common and distinct brain abnormalities in MDD and BD, most frequently in gray matter (GM) regions involved in mood regulation, decision-making, and reward circuitry such as the frontal lobe, the hippocampus, and limbic system [1, 12, 13]. Functional MRI (fMRI) studies also demonstrated extensive emotional instability in these two disorders that might be underpinned by abnormal connectivity between frontal and limbic regions [14, 15]. Especially, excessive emotional reactivity and difficulty in regulating emotions in BD might result from an imbalance between a functionally hyperactive ventral limbic pathway, and a functionally hypoactive cortical-cognitive pathway, involving the orbitofrontal cortex (OFC), the cingulate cortex, the amygdala, and the hippocampus [16]. Apart from these, diffusion tensor imaging (DTI) can explore white matter (WM) characteristics at a microstructural level in noninvasive ways [17]. Fractional anisotropy (FA) is the most widely used index to assess integrity by reflecting fiber density, axonal diameter, and myelination [18]. Any alteration in WM anisotropy suggests a change in the degree of tissue order or integrity [19]. Widespread disorganization of white matter architecture has been reported in MDD and BD, the most commonly mentioned brain regions including the corpus callosum (CC), the cingulum, the superior longitudinal fasciculus (SLF), and the anterior thalamic radiation (ATR) [20, 21, 22, 23]. Whole-brain analyses such as voxel-based analysis (VBA) and tract-based spatial statistics (TBSS) served as the most frequently applied approaches to identify microstructures within specific regions of WM in neuropsychiatric disorders [24]. However, inconsistent results might be drawn with VBA and TBSS, resulting from methodological heterogeneity [25]. In comparison, VBA directly involves normalizing the high-resolution image space of all subjects into the same stereotactic space [26], while TBSS was specifically developed to restrict analysis within the center of the major WM tracts [27, 28], and is to some extent considered more sensitive than VBA in detecting WM structures [21].
Nowadays, DTI findings remain highly diverse and heterogenous in both MDD and BD due to small sample sizes, as well as differences in analytical techniques between studies [21, 29], which limited the authority and reliability of the findings. To address this issue, the MDD Working Group and Bipolar Disorder Working Group within the Enhancing Neuro Imaging Genetics through Meta-Analysis (ENIGMA) consortium (http://enigma.usc.edu/) initiated the largest coordinated meta-analyses to explore the most robust and consistent findings across large samples worldwide [22, 29]. Lower FA in the anterior corona radiata (ACR), corona radiata (CR), genu of the CC, body of the CC, anterior limb of the internal capsule (ALIC), cingulum as well as several other nerve tracts were observed in adult MDD patients, while no significant differences were detected for FA between adolescent MDD patients and healthy controls (HC) [29]. Significantly decreased FA in patients with BD was also identified, with the highest effect sizes lying within the CC, cingulum, fornix, and posterior thalamic radiation (PTR) [22]. Nevertheless, one lately published mega-analysis study across several major psychiatric disorders revealed FA reduction only in the cingulum in BD patients, while no significant difference was found in MDD whatever kind of DTI indicator [6].
The coordinate-based meta-analysis (CBMA) approach is able to provide evidence-based perspectives to examine the most prominent and robust neuroimaging findings in these two diseases and has been applied in the investigation of WM microstructure in MDD and BD [22, 23, 30, 31, 32], and achieved some meaningful discoveries. Only one meta-analysis of DTI study analyzed structural disconnectivity in MDD and BD simultaneously and detected common and distinct WM abnormalities [21], and studies that adopted TBSS methodology showed more pronounced changes compared with voxel-based analyses [21, 25]. Considering this aforementioned research was conducted about eight years ago and included both TBSS and VBA studies, an updated CBMA focusing on TBSS findings in MDD and BD is in need. Our goal is to identify the most consistent and robust DTI findings of BD and MDD based on TBSS studies. Based on previous findings, we inferred that MDD and BD patients would exhibit shared and distinct Microstructural WM alterations in major tracts such as the CC and the cingulum.
The protocol of this CBMA has been registered at PROSPERO (http://www.crd.york.ac.uk/PROSPERO) (registration number: CRD42022301929). This meta-analysis was guided by the Preferred Reporting Items for Systematic Reviews and Meta-Analyses (PRISMA) guidelines [33, 34, 35] and the rules for neuroimaging meta-analysis [36] (Supplementary Materials-PRISMA_2020_checklist). We retrieved relevant literature from PubMed (https://www.ncbi.nlm.nih.gov/pubmed) and Web of Science databases (https://webofknowledge.com), and the last search date is June 30, 2024. To ensure the comprehensiveness of the acquired literature, the following relatively broad search terms were used: ((“depression” or “depressive disorder” or “MDD” or “unipolar depression” or “depress”) or (“bipolar” or “bipolar disorder” or “mania”)) and ((“diffusion tensor imaging” or “diffusion tensor” or “DTI”) or (“fractional anisotropy” or “FA”) or (“tract-based spatial statistics” or “TBSS”) or (“white matter”)). In addition, we manually checked the reference list of the included studies to avoid omission.
The articles included in this meta-analysis met the following inclusion criteria: (1) original investigation written in the English language and published in peer-reviewed journals; (2) applied the TBSS approach to explore FA differences; (3) compared between-group FA differences between MDD patients and HC or BD patients and HC with whole-brain approaches; (4) the significance threshold was used; (5) the results were reported in Montreal Neurological Institute (MNI) or Talairach coordinates. Exclusion criteria were: (1) the article type was a case report, review, meta-analysis, or tractography-based study; (2) cadaver studies, or animal experiments; (3) studies with no direct between-group comparison; (4) studies that peak coordinates or parametric maps could not be obtained; (5) studies with the largest sample size or the latest research studies were selected when the samples were overlapped.
Two authors (Y.X and X.C) independently searched the literature, assessed the quality of the retrieved studies, and extracted and cross-referenced data from articles that met the criteria according to the guidelines for neuroimaging meta-analyses [37]. Relevant data was discussed when inconsistencies existed until a consensus was reached. We extracted the following data from each of the selected articles: first author, sample characteristics (sample size, sex composition, average age, disease type, illness duration, emotional state), imaging parameters, statistical threshold (Z-statistics, t-statistics, and p value), and three-dimensional peak coordinates.
Using the seed-based d-mapping (SDM) software v5.15 (http://www.sdmproject.com) [38, 39], FA
alterations in patient cohorts were performed based on standard procedures of SDM
tutorials and prior meta-analyses. The SDM algorithm creates effect sizes based
on the peak coordinates reported in the studies and reconstructs maps of the
effect sizes of FA between patients and controls, rather than simply assessing
the probability of peak occurrence [40]. Particularly, a TBSS template based on
the FMRIB58 FA skeleton (http://www.fmrib.ox.ac.uk/fsl) was adopted to restrict
the analysis to the same WM tracts that were available in the TBSS studies. The
detailed SDM procedures have been described in our previous study [41, 42].
According to the developers of SDM software [40], an uncorrected p = 0.005 is approximately equivalent to a corrected p = 0.025. Here, we
used more stringent thresholds as follows: uncorrected p value
To evaluate the robustness of the findings, we performed a whole-brain jackknife
sensitivity analysis. The process uses an iterative repeated analysis,
eliminating a different dataset at a time to determine the reliability of the
results. If all or most of the data combinations were analyzed and the brain
region abnormalities were still significant, then we considered the results
highly reproducible [38]. For each significant cluster from the patient-control
comparison, the I2 statistic was used to assess heterogeneity in
each significant peak [43], as researchers usually consider I2
We initially planned to perform subgroup meta-analyses of the patients’ samples including adults versus youths. Especially, for BD patients, we intended to conduct subgroup meta-analyses in different subtypes and different mood states.
The potential effect of relevant clinical variables is examined by means of
simple linear regression. To minimize the detection of potential correlations
between demographics and neuroimaging, a more stringent threshold of p
Fig. 1 shows the literature selection process for this study. By searching MDD and BD studies, respectively, by corresponding keywords, 575 literatures related to BD and 2075 research literature related to MDD were found. Forty-six MDD studies were included in this CBMA, combining 2064 patients with 2000 HC. Twenty-six studies in BD were included in our study, comprising 1066 patients and 1132 HC Only three of these articles included both BD and MDD cohorts. Table 1 (Ref. [47, 48, 49, 50, 51, 52, 53, 54, 55, 56, 57, 58, 59, 60, 61, 62, 63, 64, 65, 66, 67, 68, 69, 70, 71, 72, 73, 74, 75, 76, 77, 78, 79, 80, 81, 82, 83, 84, 85, 86, 87, 88, 89, 90, 91, 92]) summarized the demographic and clinical characteristics of MDD studies, and the sample characteristics of BD studies were shown in Table 2 (Ref. [83, 93, 94, 95, 96, 97, 98, 99, 100, 101, 102, 103, 104, 105, 106, 107, 108, 109, 110, 111, 112, 113, 114, 115, 116, 117]). More details about the scanning methods and the FA alterations for the BD and MDD studies included in this meta-analysis could be obtained in Supplementary Table 1 and Supplementary Table 2 in the Supplementary Material.
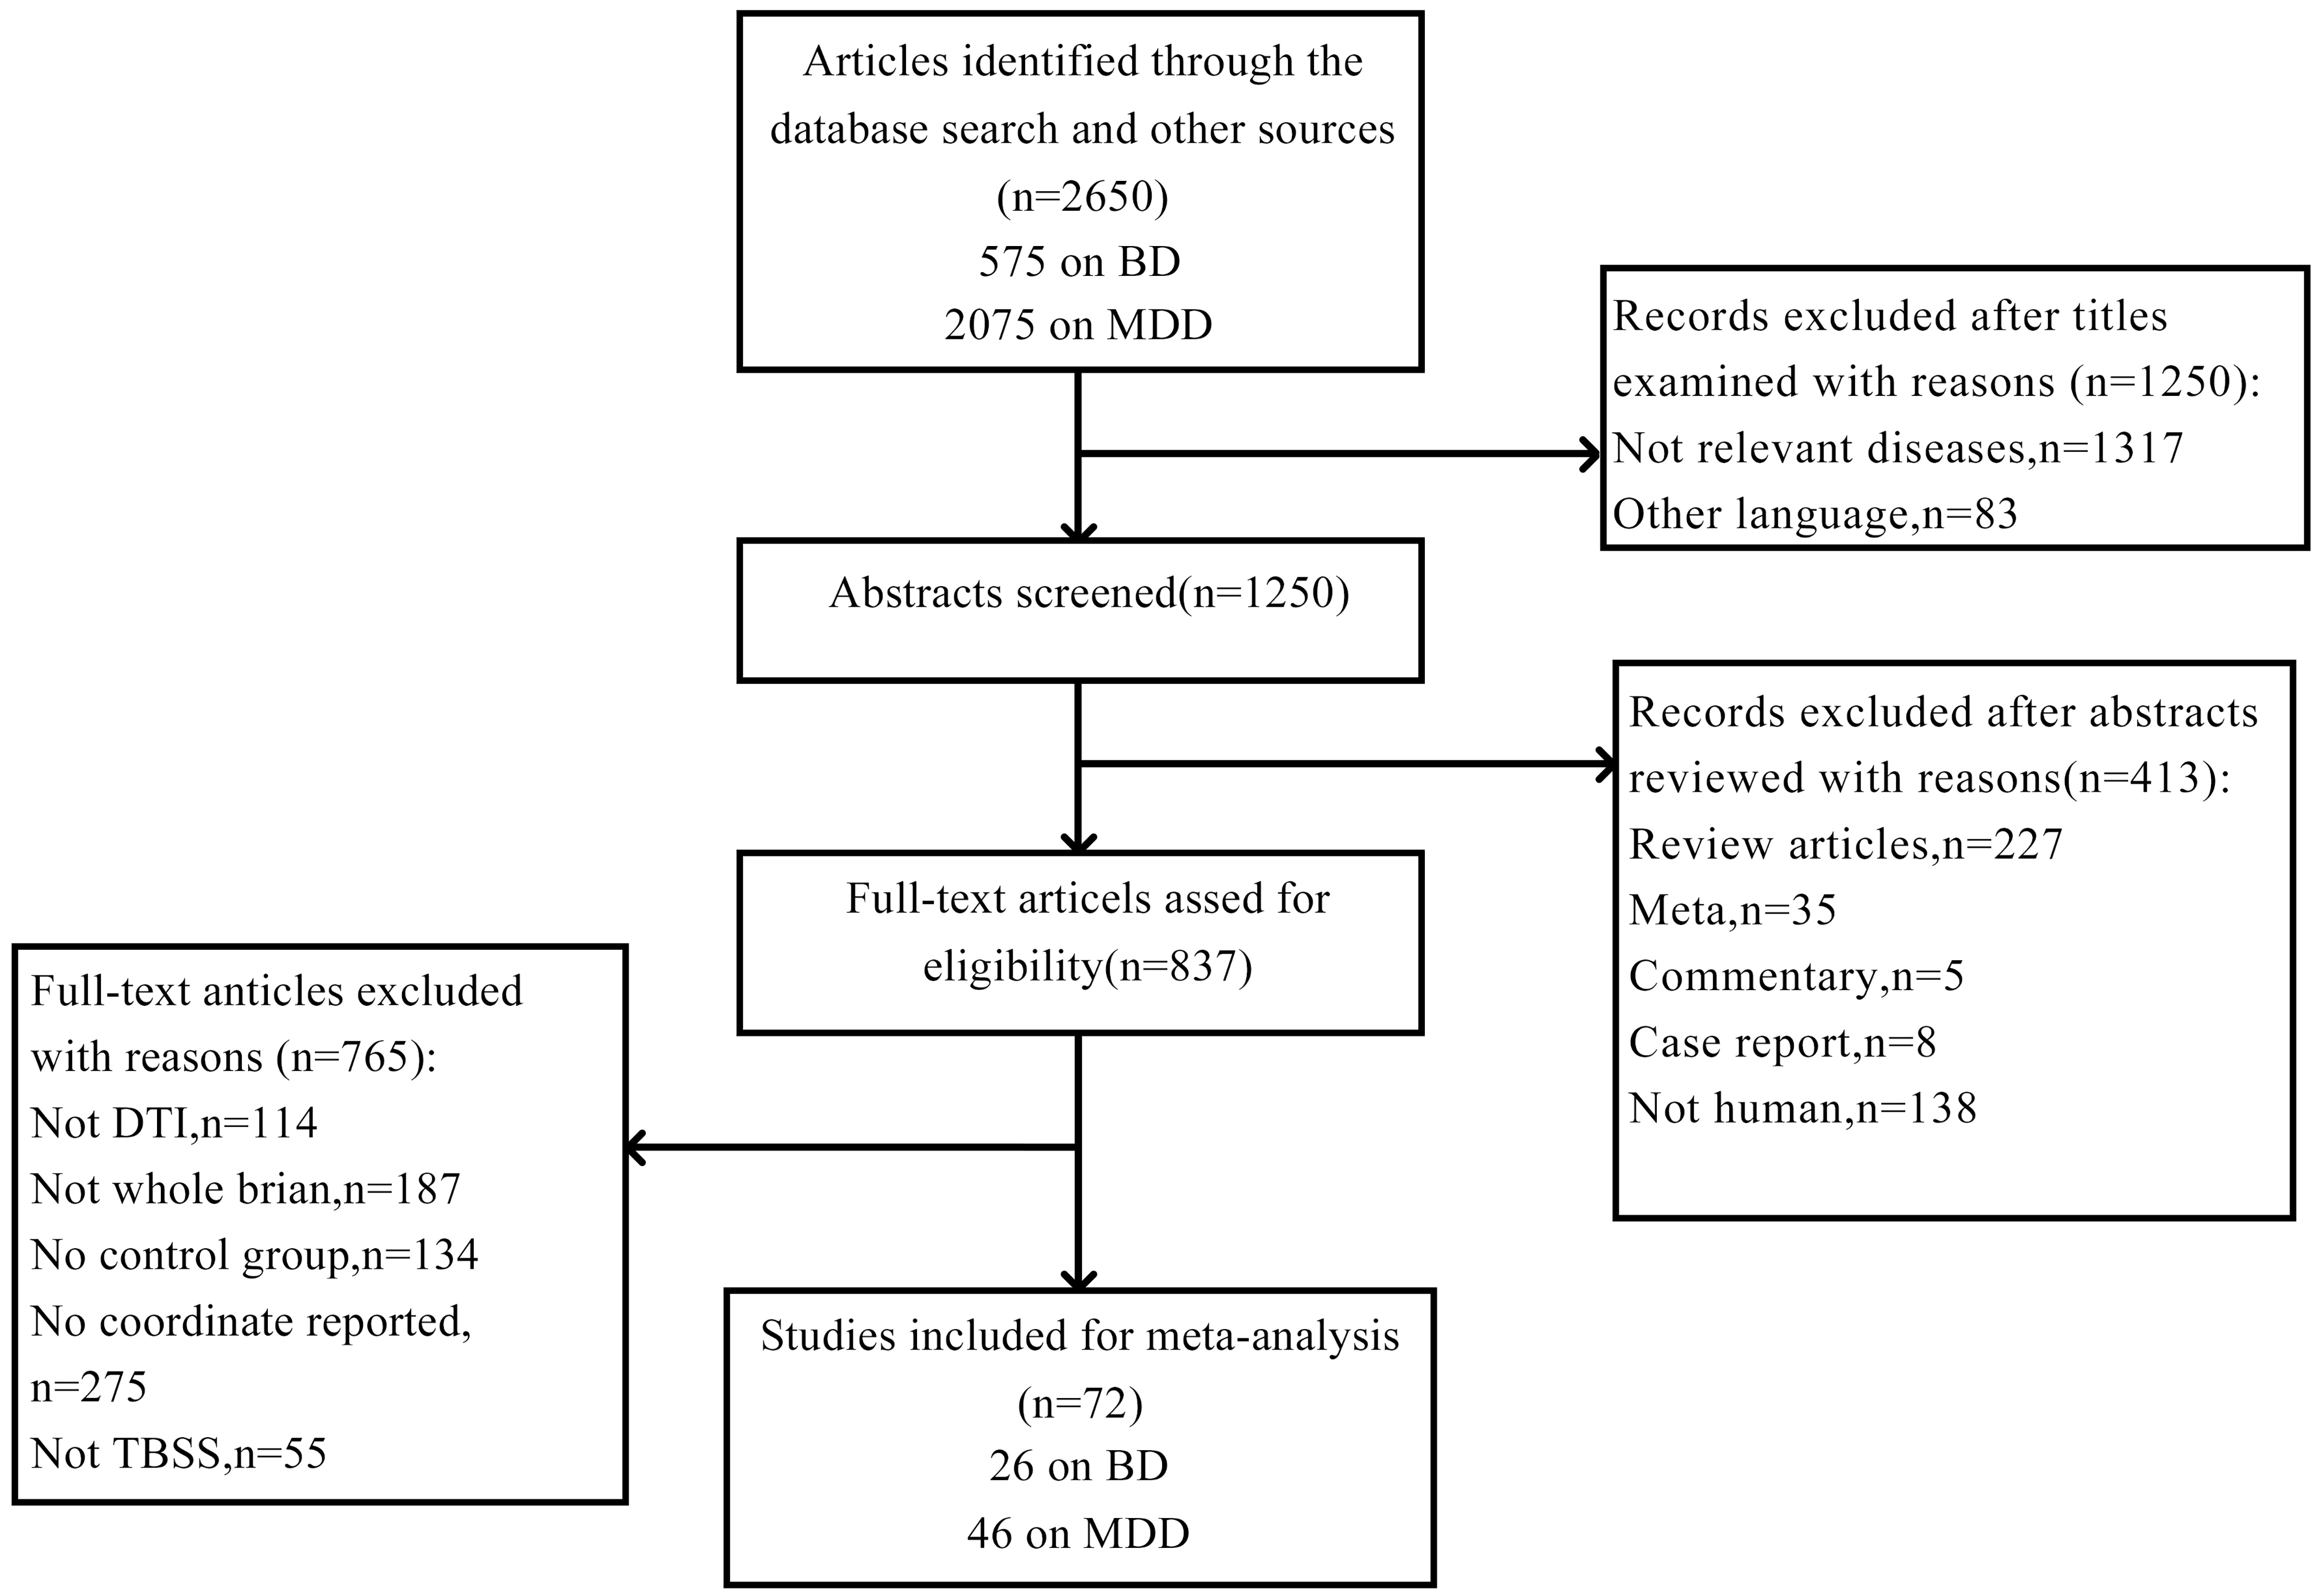 Fig. 1.
Flow diagram for the identification and exclusion of studies. BD, bipolar disorder; MDD, major depressive disorder; DTI, diffusion tensor imaging; TBSS, tract-based spatial statistics.
| Study | Major Depression Patients | Healthy Control Subjects | |||||||
| n | Sex (M, F) | Age (Mean) | HAMD (Mean) | HAMA (Mean) | Illness Duration (Years) | n | Sex (M, F) | Age (Mean) | |
| Bergamino et al. (2015) [49] | 16 | 16F | 40.01 | NA | NA | NA | 16 | 16F | 34.8 |
| Bezerra et al. (2012) [50] | 47 | 11, 36 | 70.94 | NA | NA | NA | 36 | 9, 27 | 69.39 |
| Chen et al. (2022) [51] | 29 | 5, 24 | 34.48 | 22.79 | NA | 3.06 | 25 | 2, 23 | 35.00 |
| Cullen et al. (2010) [52] | 14 | 4, 10 | 16.79 | NA | NA | 2.83 | 14 | 6, 8 | 16.81 |
| Dong et al. (2020) [53] | 127 | 58, 69 | 35.39 | 31.48 | NA | NA | 118 | 53, 65 | 35.01 |
| Guo et al. (2012) [55] | 22 | 12, 10 | 28.09 | 25.89 | NA | 0.25 | 19 | 10, 9 | 24.37 |
| Guo et al. (2012) [56] | 23 | 11, 12 | 27.39 | 27.39 | 20.09 | 2.29 | 19 | 10, 9 | 24.37 |
| Guo et al. (2014) [54] | 15 | 6, 9 | 67.53 | 21.60 | NA | 0.49 | 15 | 6, 9 | 64.87 |
| Guo et al. (2023) [57] | 33 | 7, 26 | 25.61 | 23.27 | 17.42 | 1.40 | 34 | 9, 25 | 28.85 |
| Han et al. (2014) [58] | 20 | 5, 15 | 42.70 | 19.05 | NA | 0.37 | 22 | 7, 15 | 43.73 |
| Hayashi et al. (2014) [59] | 30 | 17, 13 | 44 | NA | NA | NA | 30 | 17, 13 | 44 |
| Henderson et al. (2013) [48] | 17 | 9, 8 | 16.8 | NA | NA | 2.03 | 16 | 6, 10 | 16.4 |
| Bessette et al. (2014) [60] | 31 | 7, 24 | 17.1 | NA | NA | NA | 31 | 12, 19 | 17.0 |
| Kieseppä et al. (2010) [61] | 16 | 2, 14 | 48.4 | NA | NA | 14.1 | 20 | 10, 10 | 42.0 |
| Kieseppä et al. (2022) [62] | 6 | 1, 5 | 50.9 | NA | NA | NA | 19 | 8, 11 | 49.6 |
| Korgaonkar et al. (2011) [63] | 29 | 12, 17 | 40.5 | 19.1 | NA | NA | 39 | 18, 21 | 29.6 |
| Lai et al. (2014) [47] | 44 | 21, 23 | 36.91 | 22.07 | 2.32 | 0.39 | 27 | 12, 15 | 38.29 |
| Lai et al. (2016) [64] | 53 | 25, 28 | 40.07 | 22.43 | 2.20 | 0.42 | 54 | 25, 29 | 40.38 |
| Lamar et al. (2013) [65] | 34 | 9, 25 | 62.5 | NA | NA | NA | 45 | 19, 26 | 66.3 |
| Lee et al. (2021) [66] | 31 | 12, 19 | 15.03 | NA | NA | NA | 27 | 5, 22 | 15.96 |
| Li et al. (2020) [67] | 50 | 13, 37 | 67.15 | 19.32 | 17.46 | NA | 40 | 15, 25 | 66.14 |
| Li et al. (2022) [68] | 47 | 17, 30 | 26.12 | 14.66 | 10.55 | NA | 43 | 13, 30 | 26.27 |
| Liu et al. (2016) [69] | 29 | 17, 12 | 45.7 | 21.4 | NA | NA | 47 | 37, 10 | 41.8 |
| Ma et al. (2023) [70] | 32 | 15, 17 | 27.09 | 20.79 | 21.42 | 2.90 | 24 | 14, 10 | 32.58 |
| Ming et al. (2022) [71] | 101 | 50, 51 | 21.79 | 14.70 | NA | 0.74 | 62 | 31, 31 | 21.81 |
| Murphy et al. (2012) [72] | 45 | 16, 29 | NA | NA | NA | NA | 45 | 17, 28 | NA |
| Ping et al. (2019) [73] | 118 | 37, 81 | 33.37 | 23.73 | 22.69 | 1.01 | 118 | 39, 79 | 31.65 |
| Repple et al. (2019) [74] | 57 | 30, 27 | 34.68 | NA | NA | NA | 47 | 22, 25 | 37.38 |
| Sammer et al. (2022) [75] | 24 | 9, 15 | 31.88 | NA | NA | NA | 25 | 10, 15 | 26.80 |
| Shuster et al. (2023) [76] | 14 | 2, 12 | 68.07 | NA | NA | NA | 17 | 10, 17 | 68.82 |
| Seok et al. (2013) [77] | 86 | 18, 68 | NA | 14.6 | NA | NA | 62 | 21, 41 | NA |
| Sohn et al. (2018) [78] | 32 | 7, 25 | 41.06 | 18.31 | NA | NA | 23 | 11, 12 | 38.91 |
| Sugimoto et al. (2018) [79] | 35 | 18, 17 | 46.3 | 21.0 | NA | NA | 35 | 22, 13 | 44.0 |
| Taylor et al. (2015) [80] | NS53 | NS12, 41 | NS37.5 | NA | NA | NA | 91 | 35, 56 | 29.9 |
| SI21 | SI10, 11 | SI33.5 | |||||||
| Vai et al. (2020) [81] | 74 | 21, 53 | 49.62 | 24.96 | NA | 13.61 | 74 | 19, 55 | 36.38 |
| Vandeloo et al. (2023) [82] | 39 | 23, 16 | 45.48 | NA | NA | NA | 25 | 15, 10 | 43.00 |
| Versace et al. (2010) [83] | 16 | 4, 12 | 32.9 | 25.1 | NA | 14.7 | 24 | 9, 15 | 27.7 |
| Wang et al. (2014) [84] | 41 | 21, 20 | 32.35 | NA | NA | NA | 41 | 21, 20 | 32.58 |
| Winter et al. (2023) [85] | 266 | 59, 207 | 30.96 | NA | NA | NA | 262 | 68, 194 | 31.62 |
| Wu et al. (2023) [86] | 30 | 13, 17 | 35.67 | NA | NA | 2.96 | 31 | 13, 18 | 36.53 |
| Xiao et al. (2015) [87] | 22 | 12, 10 | 20.14 | NA | NA | NA | 22 | 12, 10 | 20.77 |
| Yang et al. (2017) [88] | 30 | 16, 14 | 29.33 | 27.77 | NA | 6.20 | 28 | 15, 13 | 28.61 |
| Zhang et al. (2022) [89] | 53 | 22, 31 | 31.90 | 33.59 | NA | NA | 47 | 20, 27 | 28.93 |
| Zhao et al. (2024) [90] | 71 | 12, 59 | 25.94 | 35.95 | 23.25 | 6.40 | 97 | 33, 64 | 16.19 |
| Zhu et al. (2011) [91] | 25 | 11, 14 | 20.55 | NA | NA | 0.86 | 25 | 11, 14 | 20.33 |
| Zuo et al. (2012) [92] | 16 | 3, 13 | 37 | 30.3 | NA | NA | 19 | 7, 12 | 36.6 |
M, male; F, female; HAMD, Hamilton Depression Rating Scale; HAMA, Hamilton Rating Scale for Anxiety; NA, not applicable; NS, no suicidality or thoughts of death; SI, with suicidality or thoughts of death.
| Study | Bipolar Disorder Patients | Healthy Control Subjects | ||||||||||
| n | Sex (M, F) | Age (Mean) | HAMD-17 (Mean) | YMRS (Mean) | Subtype | State | Lithium (%) | Illness Duration (Years) | n | Sex (M, F) | Age (Mean) | |
| Ambrosi et al. (2016) [95] | 50 | 26, 24 | 48.5 | 11.85 | 3.35 | BD I 25, BD II 25 | NA | 52 | 22.1 | 50 | 26, 24 | 48.3 |
| Benedetti et al. (2011) [96] | 40 | 10, 30 | NA | NA | NA | BD I 40 | Depression 40 | 35 | NA | 21 | 11, 10 | 39.86 |
| Canales-Rodríguez et al. (2014) [97] | 40 | 25, 15 | 40.6 | 2.5 | 1.4 | BD I 40 | Euthymia 40 | 75 | 15.9 | 40 | 25, 15 | 40.4 |
| Chan et al. (2010) [98] | 16 | 4, 12 | 36.9 | NA | 3.8 | NA | NA | 37.5 | 0.2 | 16 | 4, 12 | 37.3 |
| Chang et al. (2018) [94] | 86 | 35, 51 | 21.97 | 8.33 (n = 77) | 9.68 (n = 78) | NA | NA | NA | 1.72 | 156 | 63, 83 | 22.25 |
| Gao et al. (2013) [99] | 18 | 6, 12 | 15.1 | NA | 33.4 | BD I 14, BD II 4 | Mania 18 | 38.9 | 1.3 | 18 | 6, 12 | 14.1 |
| Haarman et al. (2016) [100] | 21 | 9, 12 | 44.7 | NA | NA | BD I 21 | NA | 57 | 25.2 | 22 | 11, 11 | 38.2 |
| Ishida et al. (2017) [101] | 22 | 13, 9 | 41.9 | 5.00 | 1.86 | NA | NA | NA | NA | 24 | 12, 12 | 36.0 |
| Ishida et al. (2017) [102] | 25 | NA | NA | NA | NA | NA | NA | NA | NA | 24 | NA | NA |
| Kumar et al. (2015) [103] | 22 | 15, 7 | 34.72 | NA | NA | NA | NA | NA | 10.68 | 41 | 30, 11 | 33.24 |
| Lagopoulos et al. (2013) [104] | 58 | NA | 23.03 | NA | NA | BD I 18, BD II 27, Bipolar spectrum 13 | NA | NA | NA | 40 | NA | 24.05 |
| Lan et al. (2020) [105] | 32 | 17, 15 | 35.9 | 16.9 | NA | NA | NA | 3.2 | NA | 41 | 12, 29 | 31.7 |
| Lee et al. (2020) [106] | 65 | 29, 36 | 35.06 | NA | NA | NA | NA | 35.4 | 13.45 | 65 | 28, 37 | 34.52 |
| Linke et al. (2020) [107] | 36 | 19, 17 | 17.2 | NA | 6.1 | BD I 22, BD II 14 | Euthymia 26, Hypomania 5, Depressed 4, Mixed state1 | 36.2 | NA | 38 | 17, 21 | 16.0 |
| Mahon et al. (2013) [108] | 26 | 11, 15 | 40.6 | NA | NA | BD I 20, BD II 6 | NA | NA | NA | 27 | 15, 12 | 40.8 |
| Mahon et al. (2012) [109] | NS 15; SI 14 | NS 9, 6; SI 9, 5 | NS 36.5; SI 33.3 | NS 5.4; SI 6.8 | NA | NA | NA | NA | NA | 15 | 8, 7 | 33.7 |
| Mallas et al. (2016) [110] | 43 | 18, 25 | 41.07 | NA | NA | NA | NA | NA | NA | 124 | 67, 57 | 35.79 |
| Sprooten et al. (2013) [111] | 64 | 18, 46 | 31.69 | 2.0 | 1.0 | BD I 64 | NA | 18.75 | 10.00 | 46 | 15, 31 | 30.07 |
| Singh et al. (2023) [112] | 20 | 15, 5 | 14.10 | NA | 10.20 | NA | NA | NA | NA | 20 | 17, 3 | 14.45 |
| Thiel et al. (2023) [113] | 136 | 61, 75 | 41.17 | NA | 3.73 | NA | NA | 27.94 | NA | 136 | 59, 77 | 42.46 |
| Tian et al. (2021) [93] | NS 32; SI 19 | NS 10, 22; SI 14, 5 | NS 32; SI 33 | NS 8.7; SI 10.7 | NS 5; SI 8.1 | BD I 38, BD II 13 | Euthymia 25, Depression18, Mania/hypomania 8, Mixed state 1 | NS 18.8; SI 26.3 | NS 7.9; SI 9.2 | 43 | 23, 20 | 32 |
| Verkooijen et al. (2017) [114] | 51 | 28, 23 | 49.5 | NA | NA | BD I 51 | NA | NA | 16.5 | 55 | 25, 30 | 45.5 |
| Versace et al. (2008) [115] | 31 | 11, 20 | 35.9 | NA | NA | NA | Euthymia 17, Depressed 14 | 35.48 | NA | 25 | 11, 14 | 29.48 |
| Versace et al. (2010) [83] | 15 | 1, 14 | 36.3 | NA | NA | NA | NA | NA | 14.7 | 24 | 9, 15 | 27.7 |
| Wessa et al. (2009) [116] | 22 | 11, 11 | 45.41 | 1.55 | 0.87 | BD I 14, BD II 8 | NA | 45.45 | 22 | 21 | 12, 9 | 42.95 |
| Yang et al. (2021) [117] | 47 | 17, 30 | 26.21 | 9.02 | 5.02 | NA | NA | NA | 4.37 | 49 | 19, 30 | 27.43 |
M, male; F, female; HAMD-17, Hamilton Depression Rating Scale 17-Item; YMRS, Young Mania Rating Scale; BD I, bipolar disorder type I; BD II, bipolar disorder type II; NA, not applicable; NS, no suicidality or thoughts of death; SI, with suicidality or thoughts of death.
MDD patients showed significant FA reduction in five clusters compared with HC, lying in the genu, body, and splenium of the CC, as well as the left anterior thalamic projection (ATP), see Fig. 2a and Table 3. No regions exhibited increased FA in the current meta-analysis. Significantly decreased FA was found in BD patients compared to HC, mainly including the body of the CC and the left median network cingulum (Fig. 2b and Table 3).
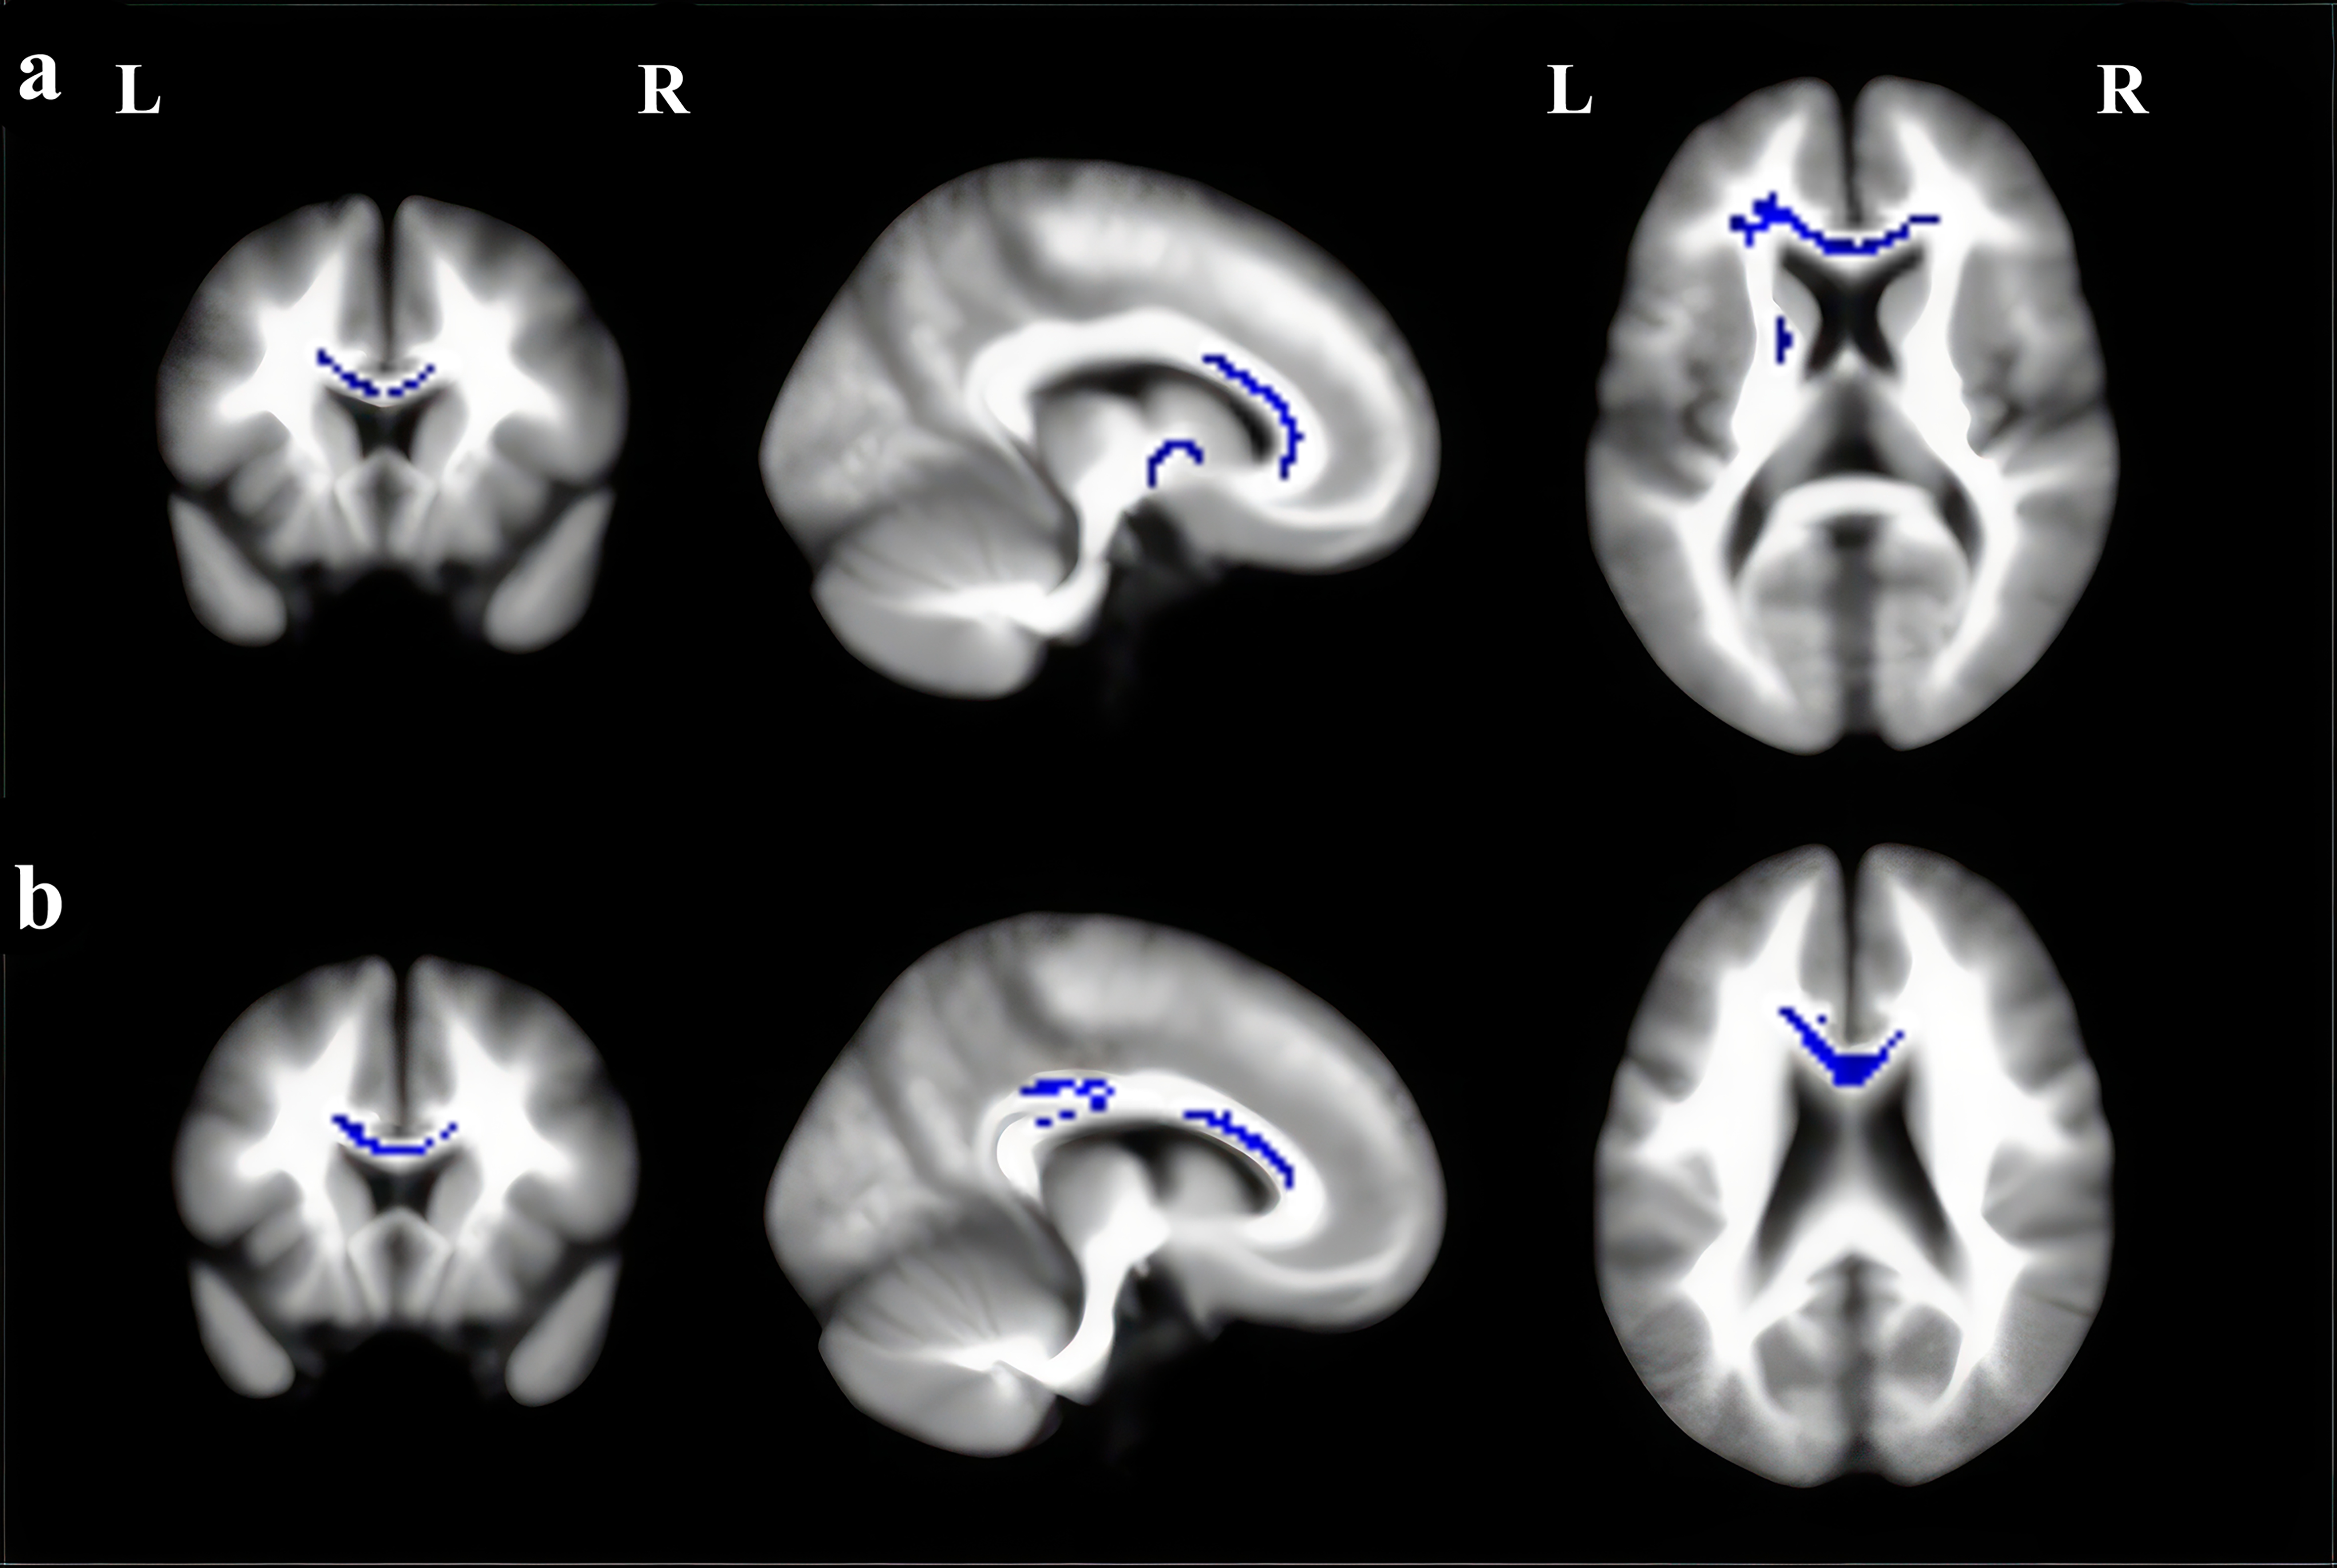 Fig. 2.
Regions showing fractional anisotropy (FA) reductions in (a) MDD and (b) BD in axial, sagittal, and coronal views. Significant clusters are overlaid on MRIcron template for Windows for display purposes only. MRI, magnetic resonance imaging.
| Regions | Maximum | Cluster Number of voxels | Breakdown (number of voxels) | Jackknife sensitivity analysis | |||||
| MNI coordinates | SDM value | p value | |||||||
| X | Y | Z | |||||||
| MDD vs HC | |||||||||
| Genu of corpus callosum | –16 | 32 | 12 | –2.350 | 584 | Corpus callosum (481) | 46/47 | ||
| Left inferior network, inferior fronto-occipital fasciculus (40) | |||||||||
| Left striatum (35) | |||||||||
| Left anterior thalamic projections (21) | |||||||||
| Left superior longitudinal fasciculus III (7) | |||||||||
| Left anterior thalamic projections | –12 | 4 | 4 | –1.523 | 64 | Left anterior thalamic projections (47) | 47/47 | ||
| Left pons (17) | |||||||||
| Body of corpus callosum | 0 | –14 | 24 | –1.376 | 41 | Corpus callosum (41) | 45/47 | ||
| Body of corpus callosum | 0 | –14 | 20 | –1.298 | 39 | Corpus callosum (17) | 46/47 | ||
| Left thalamus (13) | |||||||||
| Left anterior thalamic projections (6) | |||||||||
| Right anterior thalamic projections (3) | |||||||||
| Splenium of the corpus callosum | 26 | –58 | 26 | –1.436 | 16 | Corpus callosum (16) | 45/47 | ||
| BD vs HC | |||||||||
| Body of corpus callosum | –6 | 22 | 14 | –2.090 | 259 | Corpus callosum (258) | 27/28 | ||
| Left median network, cingulum (1) | |||||||||
| Left median network, cingulum | –10 | –30 | 32 | –2.047 | 86 | Corpus callosum (54) | 27/28 | ||
| Left median network, cingulum (30) | |||||||||
| Left superior longitudinal fasciculus I (2) | |||||||||
| Body of corpus callosum | 4 | –22 | 18 | –1.379 | 0.000294387 | 15 | Corpus callosum (8) | 22/28 | |
| Right anterior thalamic projections (7) | |||||||||
HC, healthy control; MNI, montreal neurological institute; SDM, seed-based d-mapping.
As shown in Table 3, the jackknife sensitivity analysis revealed that the results in MDD patients were highly reproducible in all clusters. The most robust cluster lied in the left ATP, as the result was retained in all datasets. All but one combination remained significant in the genus of CC and one cluster in the body of CC, the results in the splenium of CC and the other cluster in the body of CC remained detectable in all but two dataset combinations. The results of BD were also highly stable. The findings in the left median network, and cingulum was significant in all except for one combination. The results in the body of the CC remained significant in 27/28 and 22/28 combinations, respectively.
Neither results in MDD nor BD patients showed study heterogeneity. Egger tests and funnel plots also showed no significant publishing bias. Detailed information could be obtained in Supplementary Table 3 and Supplementary Fig. 1 in the Supplementary Material.
Meta-analysis of TBSS studies in adult MDD patients revealed twoclusters with decreased FA, including the gene, body, and splenium of the CC, the left superior longitudinal fasciculus and the left ATP, which was consistent with the pooled meta-analysis results. Additionally, despite the smaller number of datasets (a minimum of 10 datasets is recommended for SDM meta-analyses [37, 118, 119]), we still conducted subgroup analyses for the BD I type group, adult BD group, BD in remission, and BD during depressive episodes. The analysis results can be found in Supplementary Tables 4–8 in the Supplementary Material.
Meta-regression analysis showed that under a strict threshold of p
| Anatomic label | MNI coordinates | SDM value | p | Number of voxels | ||
| X | Y | Z | ||||
| Genu of corpus callosum | –16 | 32 | 12 | –1.789 | 187 | |
| Left anterior thalamic projections | –12 | 2 | 4 | –1.871 | 62 | |
| Left thalamus | –6 | –18 | 16 | –1.257 | 0.000147164 | 37 |
FA, fractional anisotropy; MNI, Montreal Neurological Institute; SDM, seed-based d mapping; MDD, major depressive disorder.
This current research focused on the shared and distinct WM changes in MDD and BD by conducting CBMA of DTI studies using TBSS. Regional FA alterations in the body of the CC were identified in both of these two diseases. Besides, MDD patients also exhibited decreased FA in the genu and splenium of the CC, as well as the left ATP, while BD patients showed FA reduction in the left cingulum in addition to the CC. The results highlighted that altered integrity in the body of CC served as the shared basis of MDD and BD, and various microstructural abnormalities existed, which might induce distinct clinical manifestations of these two affective disorders.
Decreased FA usually reflected defects in regional myelination levels, the degree of intra-voxel fiber crossing, axonal density, and average axonal diameter [19]. However, it is important to note that the observed reductions in FA can be attributed to complex interactions among these factors. For instance, lower FA may be due to demyelination, but it could also arise from increased fiber crossing within a voxel, which complicates the diffusion signal. Furthermore, variations in axonal density and diameter can also affect FA values. Therefore, it is crucial to interpret DTI findings within the broader context of neurobiological research, incorporating complementary methods such as histological analysis or advanced imaging techniques to elucidate the specific contributions of different microstructural properties to changes in FA.
FA reductions in CC were demonstrated as the most prominent manifestations of both MDD and BD, suggesting disrupted WM integrity in this vital WM region. This was in accord with previous meta-analyses and most existing studies [20, 21, 23, 30]. As the largest fiber bundle connecting the bilateral hemispheres, CC plays an important role in integrating information, transferring excitatory and inhibitory signals, as well as perceptual, motor, and affective information between the two hemispheres [120]. The body of the CC connects wide neocortical homotopic regions of the cerebral hemispheres, including the premotor, supplementary motor, somesthetic, and posterior parietal regions [121]. As the shared neuropathological changes of both MDD and BD revealed by this current meta-analysis, disruption of the body of CC could interfere with the interhemispheric circuit as well as callosal fibers, which might be the basis of the emotional disturbance and cognitive decline symptoms of these two affective disorders. In addition to the body of CC, lower FA was also found in the genu and splenium of the CC, especially in MDD patients, indicating disorganization of the whole callosal fibers. Considering the genu (anterior portion) connects the prefrontal and orbitofrontal regions, while the splenium (posterior portion) connects the occipital lobes and temporal lobes [30], microstructural abnormalities of the CC could also disturb the function of adjacent brain areas. This might account for the impaired motor, perceptual, and cognitive functions in patients with MDD. Additionally, the anterior regions of the CC integrate the right and left prefrontal cortex, anterior cingulate, and insula regions, which are implicated in emotional deregulation, a core symptom of BD. Therefore, abnormalities in the CC suggest a shared pathophysiological feature in both MDD and BD that may be related to disruptions in the white matter tracts responsible for emotional and cognitive processing.
The ATP connects the thalamus to the anterior limb of the internal capsule with the prefrontal cortex, playing important roles in controlling the expression of emotions, executive function, and planning complex behaviors [47, 122]. Especially, ATP mediates major brain reward-seeking and punishment functions and maintains the balance between positive and negative affective states in human mood regulation [123]. ATP also projects into the limbic system which can regulate negative emotions such as grief through the panic system [123]. A previous neuroimaging study also identified depression severity-related WM integrity changes in ATP in MDD patients [48]. Reduced WM integrity in the ATP was also reported in a recent voxel-based meta-analysis of adolescents and young adults with MDD, including both VBA and TBSS study [23], which confirmed the reliability of this finding. Taken together, the aforementioned evidence suggests that the WM microarchitecture of ATP may be significantly related to the neurobiological mechanisms of MDD, warranting further investigation in the future.
The left cingulum exhibited FA reduction in patients with BD. The cingulum bundle is a prominent WM tract that interconnects the frontal, parietal, and medial temporal sites, while also linking the subcortical nuclei to the cingulate gyrus [124]. The cingulate cortex has been closely related to emotion regulation and mood stability [93, 125]. One recent DTI study found individuals with BD showed significantly lower FA in the left cingulum bundle middle cluster, right cingulum bundle anterior cluster, and right uncinate fasciculus frontal cluster [126]. Besides, lower FA in the left cingulum bundle could also predict the worsening of subthreshold hypomania severity in non-BD individuals. Microstructural abnormalities and functional alterations of the cingulum have also been reported in BD by sMRI [127] and fMRI studies [128]. These highlighted the crucial role of the cingulum in the pathogenesis of BD.
Our meta-regression analysis showed that the FA reduction in the genu of CC and left ATP was more pronounced with age in MDD patients, which reflected a neurodegenerative process. With the increase of age, the deterioration of the WM microstructures would be further aggravated in MDD patients. This reminds us of the importance of early detection and intervention of this disease. We did not find associations between FA changes and clinical variables in the BD group. This might be due to the complexity of the BD samples. Meta-regressions should be interpreted with caution as they do not directly test relations within original samples [1, 21].
It is noteworthy that FA abnormalities were more substantial and significant in MDD than in BD revealed by this current study. This does not necessarily mean that brain changes in MDD are worse than in BD. The results might be related to the sample heterogeneity. Sample characteristics such as the average age of patients, age of onset, duration of illness, number of episodes, medication status, mental state at the time of scanning, comorbid conditions, as well as the diversity of DTI techniques including differences in data acquisition, or statistical analyses could account for this finding. A similar neuroimaging manifestation was also drawn in the previous meta-analysis of voxel-based morphometry study [1]. Scholars inferred that this might be due to the neuroprotective effects of lithium, which could counteract volume loss in BD [1, 129].
Previous evidence suggested that common structural and functional neurobiology existed in various psychiatric disorders [6, 130, 131], especially across MDD and BD [94, 132, 133, 134, 135]. Disrupted WM integrity in the CC is one of the most predominant findings characterized by both conditions [6, 21, 94]. The presence of core nerve tract disruptions might underlie the neuropathology of different emotional disturbances. TBSS served as a more sensitive technique to detect WM alterations in these regions compared with VBA [21]. Our CBMA of TBSS deeply confirmed the above theory based on evidence-based medicine.
Several limitations of this study should be noted. Firstly, peak-based meta-analysis requires the coordinates of published studies rather than the original brain map, which would weaken its accuracy. Secondly, the imaging parameters, clinical data, and demographic characteristics included in our study were heterogeneous. The statistical methods of SDM are unlikely to eliminate these differences. Thirdly, due to the insufficient number of studies on each emotional state of BD, subgroup analyses of the effects of emotional states were hampered. Fourthly, other diffusion parameters (Mean Diffusivity (MD), Axial Diffusivity (AD), and Radial Diffusivity (RD)) are meaningful in explaining the WM microstructures of these affective disorders. Finally, limited by the algorithm shortcomings of the analytical means, this study lacked a direct comparison between MDD and BD, which should be overcome by neuroscientists and programmers in the future.
In conclusion, we conducted a CBMA of published TBSS studies in MDD and BD patients. Disrupted integrity in the body of CC might serve as the shared basis of these two diseases. Various and complex microstructural abnormalities also existed, which may be associated with the distinct clinical manifestations of MDD and BD. These findings enhanced our knowledge of the neuropathological mechanism of these two affective disorders. Future research should focus on the exact underlying causes of these WM alterations, and combining neuroimaging with genetics, environment, and neuropsychology will help us further understand the pathological mechanism of MDD and BD.
This article contains all the data generated or analyzed during this study. For any further inquiries, please contact the corresponding author.
CZ and JC designed the study and revised the article. YX wrote the draft of the manuscript. YX, XC, YL, HS, YW, LP, HY analyzed the data. YC and XX conceptualized and designed the study, and also conducted the review for critical intellectual content. All authors contributed to editorial changes in the manuscript. All authors read and approved the final manuscript. All authors have participated sufficiently in the work and agreed to be accountable for all aspects of the work.
Not applicable.
Not applicable.
This study was supported by the Ministry of Education Industry-University Cooperative Education Project (220900242232529), the Medical and Health Science and Technology Development Plan of Shandong Province (202003061210, 202203090679, 202304011343), the Key Research and Development Plan of Jining City (2021YXNS024), the Cultivation Plan of High-level Scientific Research Projects of Jining Medical University (JYGC2021KJ006), and the Supporting Fund for Teachers’ Research of Jining Medical University (600903001).
The authors declare no conflict of interest.
Supplementary material associated with this article can be found, in the online version, at https://doi.org/10.31083/j.jin2309170.
References
Publisher’s Note: IMR Press stays neutral with regard to jurisdictional claims in published maps and institutional affiliations.