


 , Youliang Wen 2,*
1 Neurorehabilitation Department of Ningbo Rehabilitation Hospital, 315040 Ningbo, Zhejiang, China
2 School of Rehabilitation Medicine, Gannan Medical University, 341000 Ganzhou, Jiangxi, China
†These authors contributed equally.
Abstract
The aim of this preliminary study was to investigate the similarities and differences in cortical activation patterns during the swallowing of water, acetic acid solution and salt solution in healthy adults using functional near-infrared spectroscopy (fNIRS).
Eighteen right-handed healthy adults were recruited and fNIRS was used to measure changes in concentrations of oxygenated hemoglobin (HbO2) and deoxygenated hemoglobin (HbR) in 35 channels during the swallowing of water, acetic acid solution and salt solution. The task-based experiment used a block-design in which participants alternated between resting blocks of 30 s and task blocks (swallowing water, acetic acid solution, or salt solution) of 30 s, repeated six times. Participants remained still during the resting blocks and performed a swallowing action every 6 s during the task blocks. Data preprocessing was conducted using NirSpark software and statistical analyses were performed using either one-sample or paired t-tests to compare differences in cortical activation in healthy participants between swallowing a water and acetic acid solution, as well as swallowing a water and salt solution.
Compared to the resting state, nine brain regions, including primary somatosensory cortex (S1), primary motor cortex (M1), dorsolateral prefrontal cortex (DLPFC), Wernicke's area, premotor cortex (PMC), supplementary motor area (SMA), inferior frontal cortex (IFC), orbitofrontal cortex (OFC) and frontopolar area, were commonly activated during the process of swallowing water, acetic acid solution, and salt solution. The DLPFC, Broca's area, PMC and SMA showed higher activation levels during the swallowing of acetic acid solution when compared to swallowing water, with statistically significant differences (p < 0.05). The frontopolar area and OFC exhibited higher activation during the swallowing of salt solution when compared to water, also with statistically significant differences (p < 0.05).
Multiple brain regions were activated during the swallowing of water, acetic acid solution and salt solution in healthy adults. Moreover, swallowing acetic acid solution leads to stronger activation of DLPFC, Broca's area, PMC and SMA, while swallowing salt solution leads to stronger activation of the frontopolar area and OFC.
Keywords
- swallow
- functional near-infrared spectroscopy
- water
- acetic acid solution
- salt solution
Taste perception is a critical sensory function in humans and plays a vital role as one of the fundamental functions specific to the oral cavity. It is of utmost importance in the process of swallowing. Swallowing refers to the complex behavior of transporting food from the oral cavity through the pharynx and esophagus to the stomach, requiring coordinated sensory input and muscular activity from the central nervous system [1, 2]. Swallowing disorders encompass a group of clinical syndromes in which one or more stages of swallowing are impaired due to damage to the swallowing-related nerves and organ tissues, leading to various symptoms [3]. Swallowing disorders can occur in various diseases and are clinically manifested as coughing or choking during eating, difficulty in swallowing and increased risk of aspiration, pneumonia, malnutrition and dehydration. They significantly impact the quality of life of patients and in severe cases even result in death [4, 5]. Therefore, a comprehensive understanding of the central physiological and pathological mechanisms related to swallowing is essential.
Recently, functional near-infrared spectroscope (fNIRS) has been widely used in
neuroscientific research as a non-invasive neuroimaging technique that measures
changes in the concentration of both oxygenated hemoglobin (HbO
Previous studies initially considered swallowing as a reflexive behavior regulated at the brainstem level, involving automatic processes [11]. However, subsequent research on the neurophysiological control of swallowing has revealed that voluntary swallowing in humans requires control or regulation at the cortical, brainstem and peripheral levels [12, 13, 14]. Currently, there is limited research on swallowing-related fNIRS studies, but some studies have found changes in cerebral hemodynamic signals during the swallowing of different liquids [15, 16, 17].
Taste stimulation, as a rehabilitative treatment method for post-stroke swallowing disorders in clinical practice, is believed to enhance cortical activity in sensory and motor areas related to swallowing and has shown good therapeutic effects. For instance, acid stimulation can increase salivary secretion and swallowing frequency, aiding in the recovery of swallowing sensation in patients with swallowing disorders [18]. However, while salt is a commonly encountered taste stimulus in the human diet, there have been fewer research reports on salt stimulation and previous studies have mainly focused on the use of taste stimulation for training in swallowing disorders, while central mechanisms of action remain unclear. Therefore, in this study multi-channel fNIRS was used to measure cerebral hemodynamic changes in healthy adults during voluntary swallowing of water, acetic acid solution and salt solution. The aim was to investigate the changes in brain cortical blood flow during the swallowing of these different liquids, providing a theoretical basis for the future application of fNIRS in the diagnosis and intervention of central swallowing disorders.
The study flow is given below (Fig. 1). The study recruited a total of 18 healthy right-handed adults (nine male, nine female) from the Department of Neurorehabilitation Clinical Trials at the Ningbo Rehabilitation Hospital. Participants had an average age of 24.81 years (Standard Error (SE) = 0.52). The study was conducted in accordance with ethical guidelines and regulations and was approved by the Ethics Committee of the Ningbo Rehabilitation Hospital (approval number 2023-24). All participants were fully informed about the study procedures and provided signed informed consent.
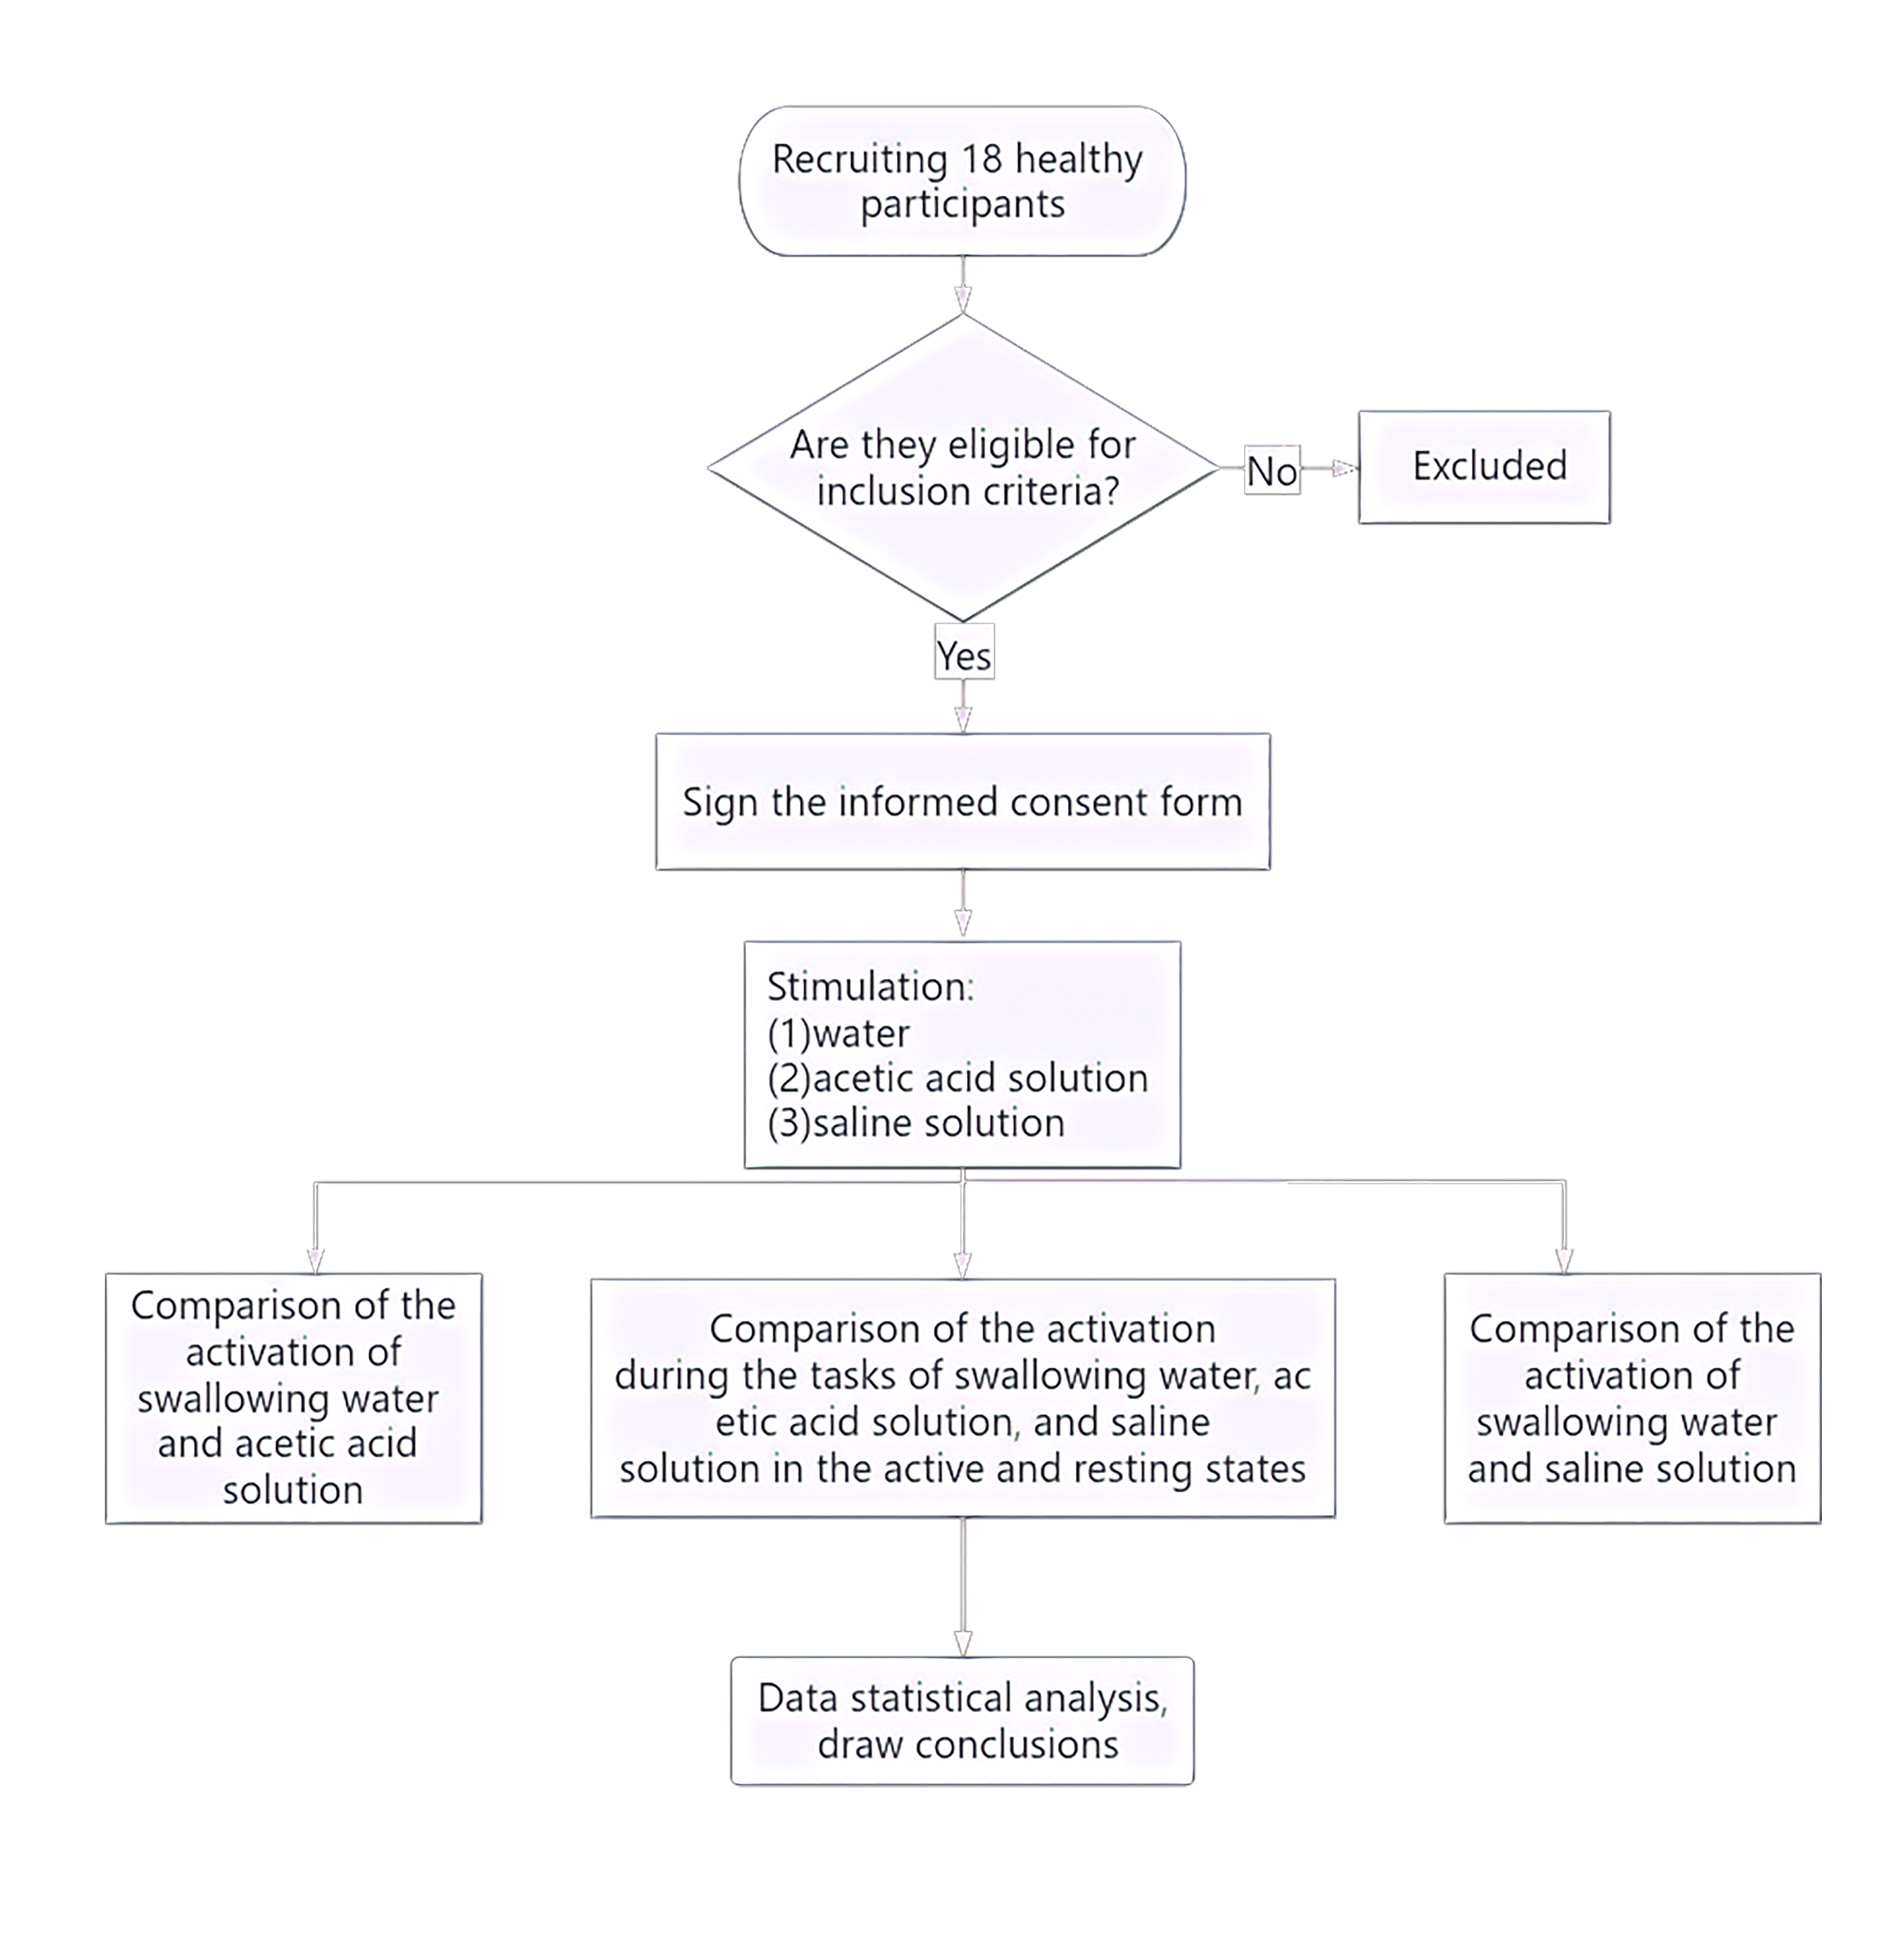 Fig. 1.
Experimental flowchart.
The inclusion criteria were as follows: No history of neurological, psychiatric, respiratory, or swallowing function disorders; no past or current diagnosis of gastroesophageal reflux, abnormal throat sensation, swallowing disorders, oral motor function disorders, or neurological disorders; no clear history of epilepsy or family history of epilepsy.
Three solutions were used: (1) Acetic acid solution as the sour taste stimulus, which is an organic acid belonging to the carboxylic acid class of compounds; preparation method: Mixing edible grade white vinegar (Zhenjiang Hengshun 6° white vinegar) with distilled water to prepare a 0.08 M acetic acid solution. (2) Salt solution as the salty taste stimulus, the salt solution mainly consisted of sodium chloride and water, belonging to the chloride class; preparation method Mixing edible salt (Lu Jing iodized natural sun-dried salt) with distilled water to prepare a 0.1 M salt solution. (3) Distilled water was used as the plain control condition. All solutions were room temperature.
The swallowing task procedure was conducted using a block-design, as illustrated (Fig. 2). In the evaluation process, baseline data was collected from the first 10 s, followed by swallowing. The evaluation process consisted of six blocks, each block included a 30 s swallowing phase and a 30 s rest phase, resulting in a total scan duration of six minutes. Prior to scan initiation, the experimenter placed one end of a plastic tube, approximately 20 cm in length and 0.3 cm in inner diameter, into the participant’s oral cavity, positioned 3 cm from the midline between the incisors. The tube was secured to the participant’s face with tape to ensure it would not fall out during swallowing. The other end of the tube was connected to a 50 mL syringe. During the rest blocks, participants were instructed to remain still, keep their eyes open and refrain from any conscious thinking or swallowing actions. Participants were asked to fast for two hours prior to the experiment, with normal water intake until an hour prior to the experiment. They were also instructed to refrain from drinking water in the hour preceding the experiment. Additionally, participants received training on the experimental procedures prior to the actual experiment.
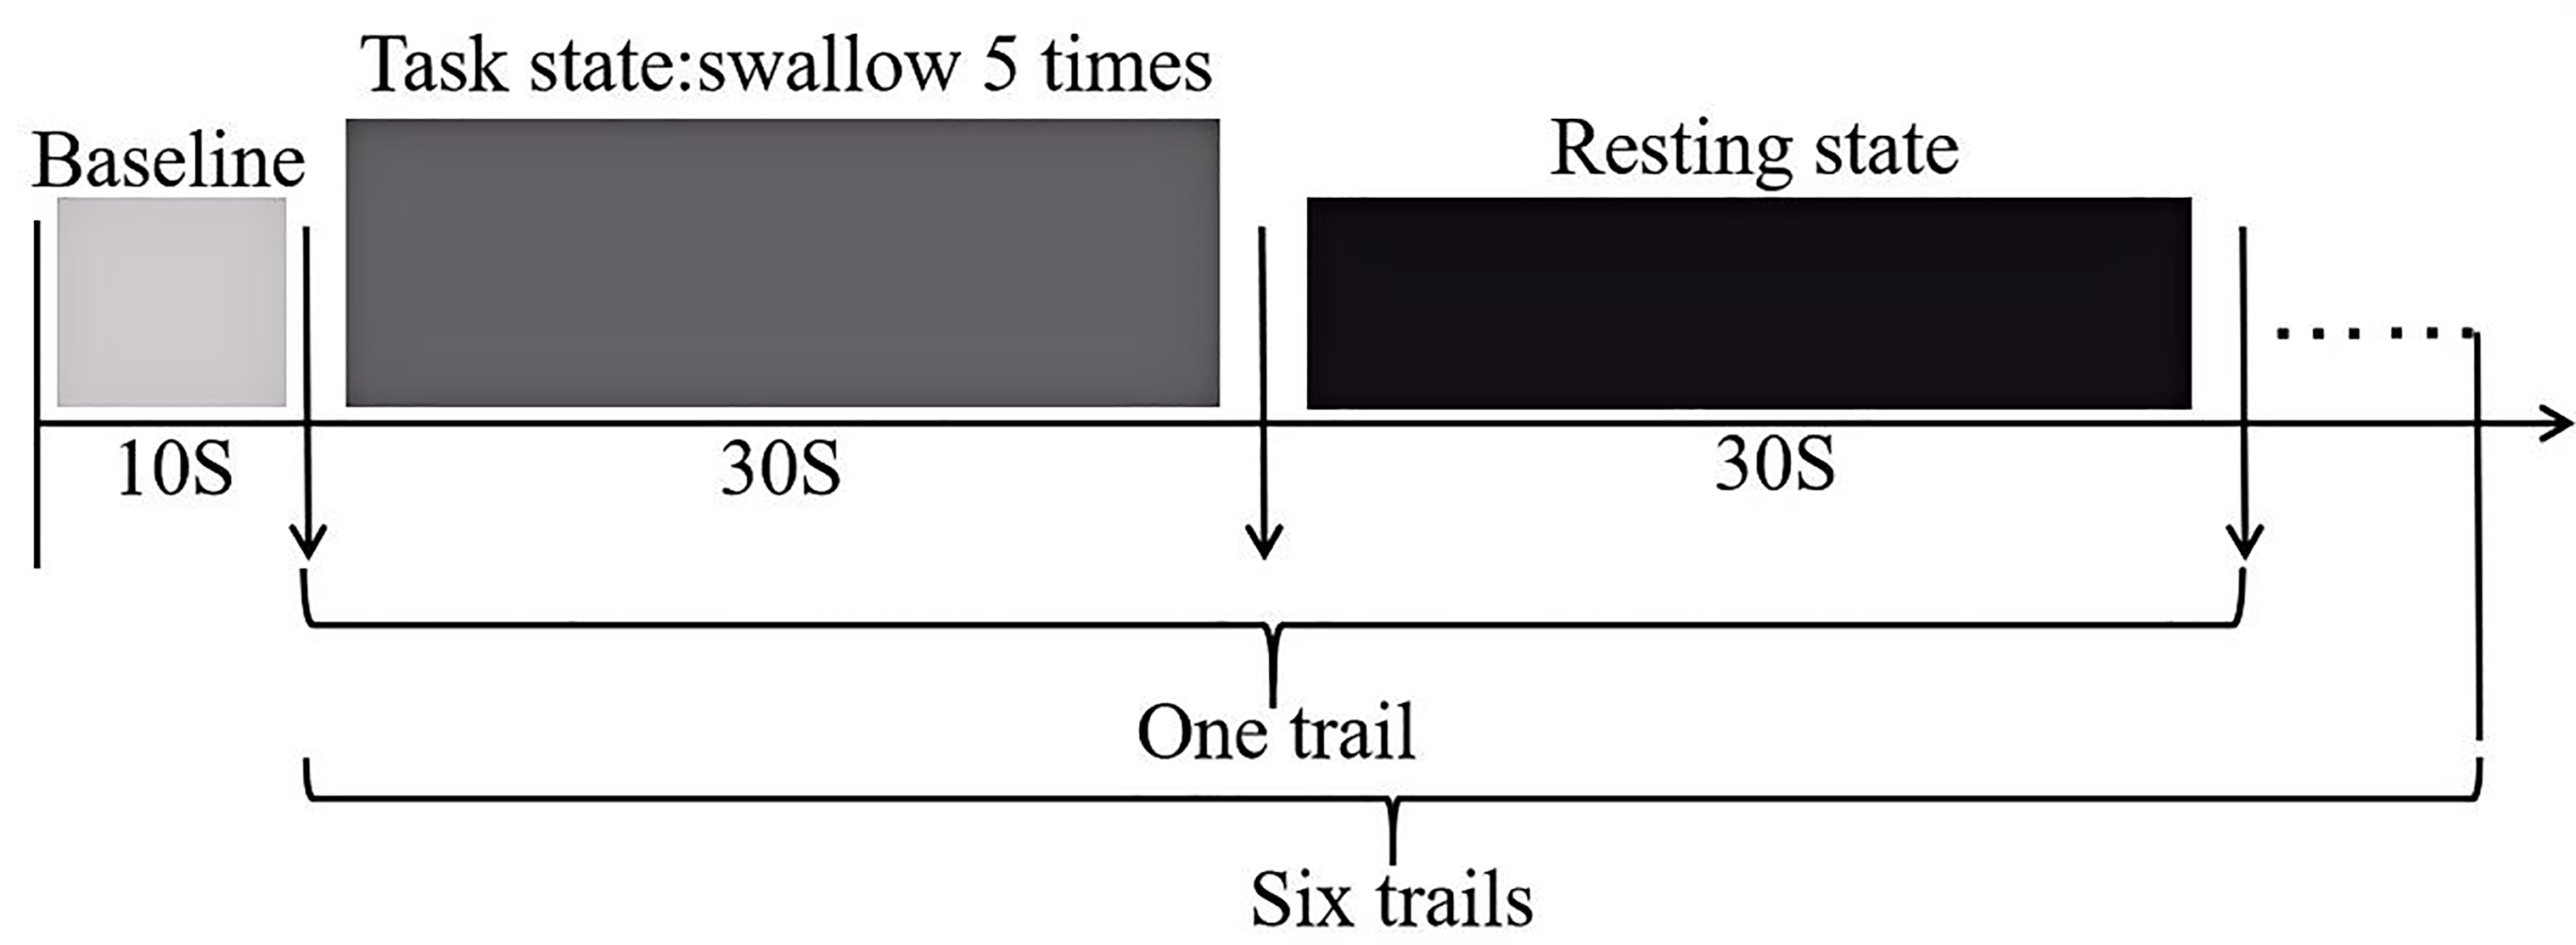 Fig. 2.
Schematic diagram of the swallowing evaluation task paradigm.
The experimenters injected distilled water, acetic acid solution and salt solution into the subjects’ oral cavity in a random order at a rate of 3 mL/3 s. Participants were instructed to swallow every six seconds based on audio cues. There was a 10 minutes rest period between the two tasks to avoid any potential carryover effects.
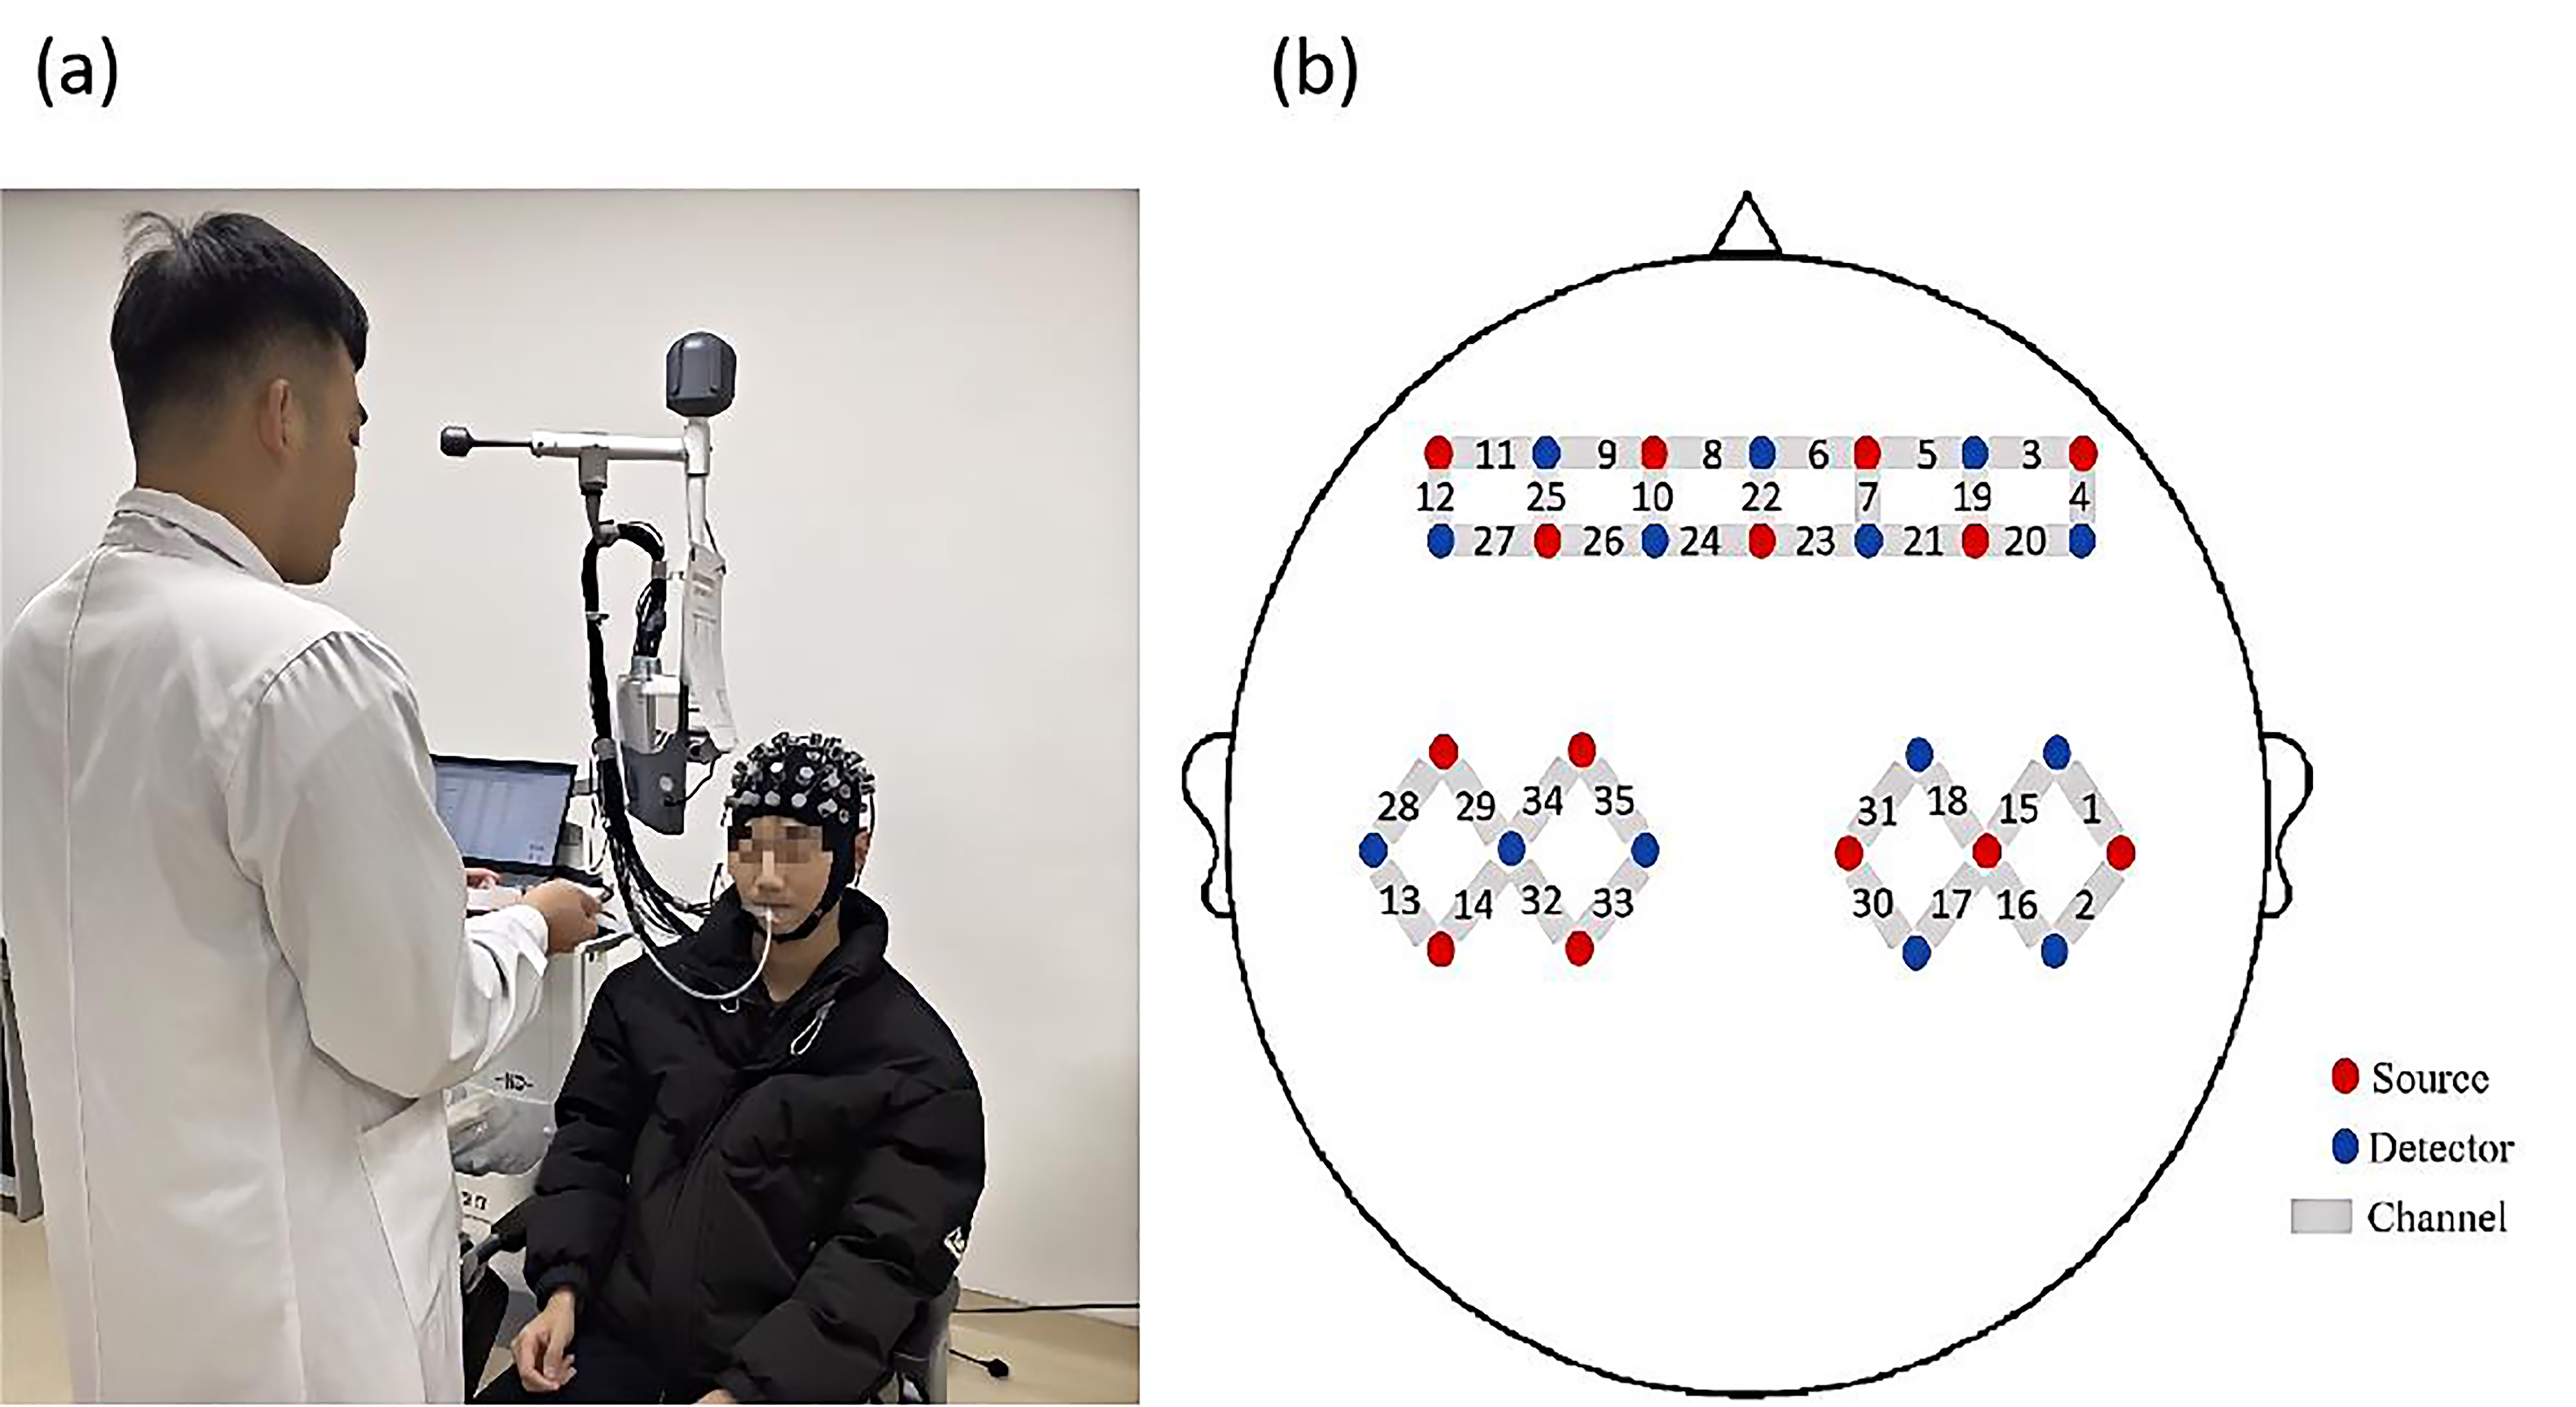
In this experiment, a multi-channel, portable fNIRS device (NirSmart-6000A,
China Danyang Huichuang Medical Equipment Co., Ltd., Danyang, Jiangsu, China) was
used to record changes in HbO
 Fig. 3.
Experiment process and probe distribution map. (a) Illustration of the liquid being injected into the participant’s oral cavity through a tube. (b) Schematic diagram showing the positions of functional near-infrared spectroscopy (fNIRS) channels and probes.
Data were processed and analyzed using NirSpark software (NirSpark1.8.1, DanYang
HuiChuang Medical Equipment Co., Ltd, Danyang, Jiangsu, China). The following
preprocessing steps were applied: (1) Conversion of raw intensity data to optical
density data, with a signal standard deviation threshold of six and a peak
threshold of 0.5. Motion artifact correction was performed using spline
interpolation [20]. (2) Removal of physiological noise (respiration, heartbeat)
and drift by bandpass filter at 0.01–0.2 Hz. (3) Conversion of the filtered
optical density data to concentrations of HbO
After preprocessing, block averaging analysis was performed for different taste
solution swallowing tasks. The first 60 seconds of the task block were selected
(30 seconds of rest followed by 30 seconds of the swallowing task) and the mean
and difference values of HbO
Statistical analysis was performed using SPSS 25.0 software (IBM Corp., Chicago,
IL, USA). Descriptive statistics, such as mean and standard deviation (SD), were
used to represent the demographic data of the participants. The normality of the
measured data and the homogeneity of variances were tested using the
Kolmogorov-Smirnov and Levene’s tests, respectively. A significance level of
p
Results for all 18 participants were included in the analysis.
In the water swallowing task, there were significant differences (p
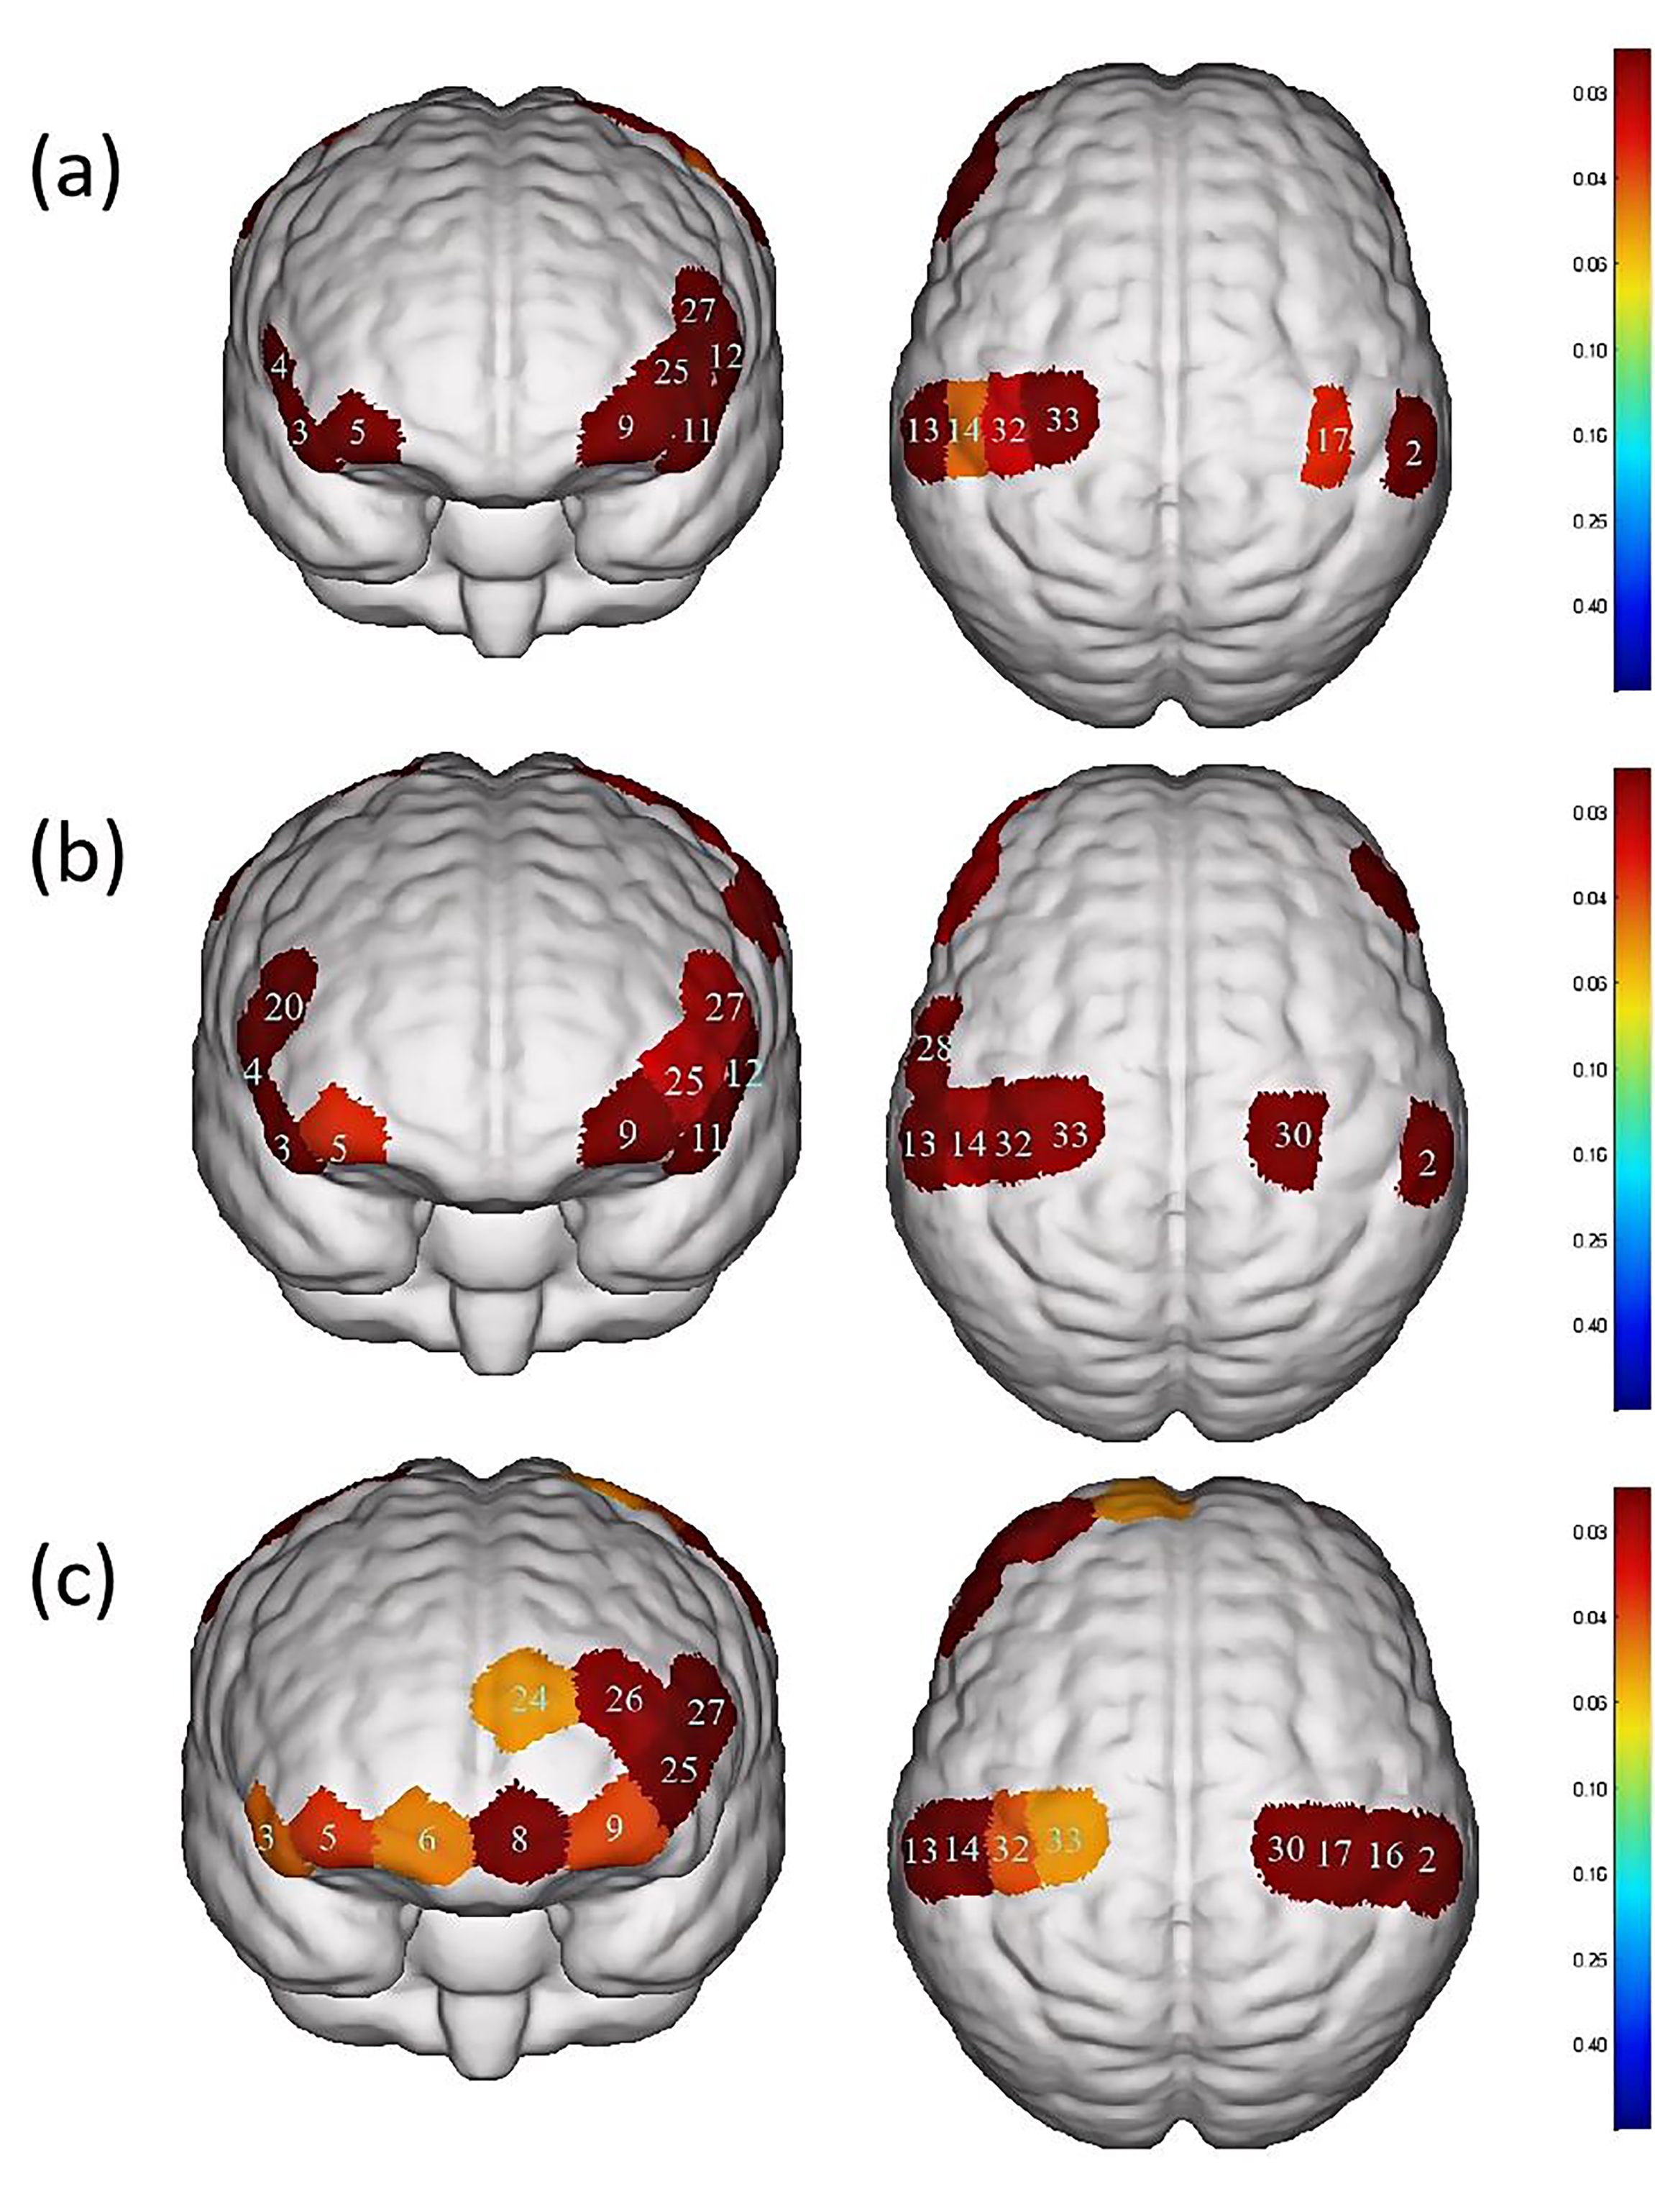
 Fig. 4.
Differences in cortical activation between resting state and
task state during different swallowing tasks. (a) Swallowing water. (b)
Swallowing acetic acid solution. (c) Swallowing salt solution. The image only
shows the regions corresponding to significantly activated channels (p
| Channel | S-D | Brain area | p-value | |
| 2 | S1-D6 | S1, Wernicke area | 0.027 |
0.016284# |
| 3 | S2-D2 | IFC | 0.075 |
0.0000465# |
| 4 | S2-D7 | Broca area, IFC | 0.088 |
0.00018802# |
| 5 | S3-D2 | OFC, Frontopolar area | 0.030 |
0.026091# |
| 9 | S4-D4 | OFC, Frontopolar area | 0.028 |
0.016284# |
| 11 | S5-D4 | IFC | 0.092 |
0.0000555# |
| 12 | S5-D10 | Broca area, IFC | 0.088 |
0.0000881# |
| 13 | S6-D5 | S1, M1, Wernicke area | 0.035 |
0.016284# |
| 14 | S6-D11 | S1 | 0.027 |
0.043729# |
| 17 | S7-D12 | S1, M1 | 0.027 |
0.035518# |
| 25 | S10-D4 | Frontopolar area | 0.026 |
0.015313# |
| 27 | S10-D10 | DLPFC, Broca area | 0.034 |
0.013593# |
| 32 | S13-D11 | S1, M1 | 0.030 |
0.028567# |
| 33 | S13-D14 | PMC, SMA, M1 | 0.040 |
0.036341# |
Note: Values are presented as the
mean
In the acetic acid solution swallowing task, there were significant differences
(p
| Channel | S-D | Brain area | p-value | |
| 2 | S1-D6 | S1, Wernicke area | 0.029 |
0.037065# |
| 3 | S2-D2 | IFC | 0.058 |
0.037065# |
| 4 | S2-D7 | Broca area, IFC | 0.069 |
0.027861# |
| 5 | S3-D2 | OFC, Frontopolar area | 0.029 |
0.03533# |
| 9 | S4-D4 | OFC, Frontopolar area | 0.027 |
0.040093# |
| 11 | S5-D4 | IFC | 0.098 |
0.027861# |
| 12 | S5-D10 | Broca area, IFC | 0.090 |
0.027861# |
| 13 | S6-D5 | S1, M1, Wernicke area | 0.043 |
0.037065# |
| 14 | S6-D11 | S1 | 0.034 |
0.024812# |
| 20 | S8-D7 | DLPFC, Broca area | 0.037 |
0.017507# |
| 25 | S10-D4 | Frontopolar area | 0.028 |
0.028969# |
| 27 | S10-D10 | DLPFC, Broca area | 0.032 |
0.026413# |
| 28 | S11-D5 | PMC, SMA | 0.034 |
0.02167# |
| 30 | S12-D12 | PMC, SMA, M1 | 0.041 |
0.037065# |
| 32 | S13-D11 | S1, M1 | 0.031 |
0.036512# |
| 33 | S13-D14 | PMC, SMA, M1 | 0.034 |
0.022105# |
Note: Values are presented as the
mean
In the salt solution swallowing task, there were significant differences
(p
| Channel | S-D | Brain area | p-value | |
| 2 | S1-D6 | S1, Wernicke area | 0.039 |
0.0054562# |
| 3 | S2-D2 | IFC | 0.045 |
0.032803# |
| 5 | S3-D2 | OFC, Frontopolar area | 0.029 |
0.027288# |
| 6 | S3-D3 | OFC, Frontopolar area | 0.026 |
0.034764# |
| 8 | S4-D3 | OFC, Frontopolar area | 0.025 |
0.012459# |
| 9 | S4-D4 | OFC, Frontopolar area | 0.027 |
0.028476# |
| 13 | S6-D5 | S1, M1, Wernicke area | 0.045 |
0.0036729# |
| 14 | S6-D11 | S1 | 0.036 |
0.014922# |
| 16 | S7-D6 | S1 | 0.036 |
0.013247# |
| 17 | S7-D12 | S1, M1 | 0.039 |
0.009113# |
| 24 | S9-D9 | OFC, Frontopolar area | 0.025 |
0.038196# |
| 25 | S10-D4 | Frontopolar area | 0.034 |
0.011725# |
| 26 | S10-D9 | Frontopolar area | 0.025 |
0.017149# |
| 27 | S10-D10 | DLPFC, Broca area | 0.046 |
0.011667# |
| 30 | S12-D12 | PMC, SMA, M1 | 0.050 |
0.011684# |
| 32 | S13-D11 | S1, M1 | 0.034 |
0.030086# |
| 33 | S13-D14 | PMC, SMA, M1 | 0.036 |
0.038308# |
Note: Values are presented as the
mean
When comparing water swallowing and acetic acid solution swallowing, there were
significant differences (p
 Fig. 5.
Differences in cortical activation when swallowing water
compared to swallowing acetic acid solution and salt solution. (a) Comparison of
swallowing water and acetic acid solution. (b) Comparison of swallowing water and
salt solution. The image only shows the regions corresponding to significantly
activated channels (p
| Channel | S-D | Brain area | Water | Acetic acid solution | Salt solution | p-value |
| 20 | S8-D7 | DLPFC, Broca area | 0.008 |
0.044 |
0.025 |
0.0285691 |
| 28 | S11-D5 | PMC, SMA | 0.013 |
0.042 |
0.027 |
0.0347651 |
| 24 | S9-D9 | OFC, Frontopolar area | –0.012 |
0.006 |
0.010 |
0.0212022 |
Note: Values are presented as the
mean
When comparing water swallowing and salt solution swallowing, there was a
significant difference (p
In this study, fNIRS technology was used to determine the similarities and differences in brain function activation in healthy adults when swallowing water, acetic acid solution and salt solution. A salty taste, commonly encountered in daily life, was added for comparison. To the authors knowledge, this is the first study to use this technology to investigate the effects of swallowing salt solution stimuli on brain function activation during voluntary swallowing in healthy adults. Simultaneously, the portability and anti-interference characteristics of fNIRS was used for taste research during swallowing.
The present study used a 35-channel fNIRS system to record from the bilateral PFC, motor cortex and somatosensory cortex of participants. Results revealed that S1, M1, DLPFC, Wernicke’s area, Broca’s area, PMC, SMA, IFC, OFC and the frontopolar area were activated during water swallowing, acetic acid solution swallowing and salt solution swallowing. These findings are similar to those of Knollhoff et al. [24], who found significant activation in the M1, SMA, S1, IFC and DLPFC brain regions during water swallowing in healthy adults. The results of this study are consistent with previous fMRI studies [25, 26], indicating different levels of activation during water swallowing and taste stimulation in areas such as S1, M1, SMA, insula, postcentral gyrus and PFC. The OFC and frontopolar areas, which are included in the PFC, have been reported to be activated in previous fNIRS studies investigating swallowing-related cortical activation. A study by Kober [27, 28, 29] demonstrated significant activation in the PFC during the execution of water swallowing and saliva swallowing tasks using fNIRS. Broca’s area, located in the PFC, is typically associated with the production of motor speech. However, different studies have shown intense activation in this area during swallowing and tongue movement tasks. There are several reasons that help explain the activation of the Broca’s area during swallowing. First, the insular cortex (Brodmann area 13 (BA13)), located proximally to BA44, BA45, has consistently been implicated in the swallowing process, with anatomical evidence suggesting that the insular cortex receives sensory inputs from various brain regions involved in swallowing [30, 31]. Second, Ertekin et al. [32] proposed that sensory inputs from the human oral and pharyngeal areas are localized to BA44 in the brain. This indicates that Broca’s area is also involved in controlling nonverbal orofacial sensory and motor behaviors. Therefore, it can be speculated that the activation of Broca’s area during water swallowing, acetic acid solution swallowing and salt solution swallowing tasks may be a result of intense activation in the deep insular cortex. In previous neuroimaging studies on voluntary swallowing-related cortical activation, the significantly activated area also included the PMC. Martin et al. [33] have suggested that this area is typically involved in the process of voluntary swallowing, indicating the neural innervation of the muscles involved in swallowing in the oral cavity, pharynx and esophagus in this brain region. Zhang et al. [34] demonstrated the activation of Wernicke’s area during modified pharyngeal electrical stimulation, indicating that this area is also activated during the swallowing process. Previous studies have also confirmed the crucial role of Wernicke’s area in swallowing [35].
Additionally, significant differences were observed in the activation of DLPFC, Broca’s area, PMC and SMA between swallowing acetic acid solution and swallowing water (Table 4, Fig. 5), with a higher level of activation during acetic acid solution swallowing. Previous studies [36, 37] have suggested that DLPFC, a cortical area unique to primates, plays an important role in perception, cognitive activity and emotional response to unpleasant bodily signals or visceral pain. It is particularly associated with self-awareness and attention control and is involved in sensorimotor integration due to its connections with the insular, anterior cingulate and PMC. Swallowing an acetic acid solution may cause discomfort in participants during the swallowing task. Based on the survey conducted, all participants reported a greater oral and pharyngeal stimulation with acetic acid solution, requiring more focused attention to complete the swallowing task. Therefore, a higher level of activation in the DLPFC cortex during acetic acid solution swallowing compared to water swallowing was observed. In terms of cortical function, both PMC and SMA belong to Brodmann Area 6, which is a core part of the brain involved in motor control. The SMA is located in the DLPFC [38, 39] and it is involved in both motor action control [40] and the initiation of motor behaviors, such as movement planning and execution [41]. The PMC is located on the lateral surface of the frontal lobe and is primarily responsible for the planning and execution of complex motor behaviors, such as tool use, gestures and language [42]. Both PMC and SMA play important roles in swallowing movements, regulating the initiation, execution and control of swallowing actions, as well as inhibiting and facilitating the swallowing reflex. Mulheren et al. [43] have shown that sour taste can increase the brain hemodynamic response in M1 and SMA. A fMRI study on taste stimulation in healthy individuals revealed more activation in two brain regions near the PMC and SMA in the middle and anterior precentral gyrus during sour taste stimulation compared to that of water conditions [25]. These findings confirm the results of the current study, indicating that swallowing a more strongly stimulating acetic acid solution results in higher activation levels in PMC and SMA.
When comparing swallowing water to swallowing salt solution, significant differences were found only in the activation of the OFC and frontopolar area (Table 4, Fig. 5), with a higher level of activation during salt solution swallowing. Human pathological studies and neuroimaging evidence suggest that the OFC plays a crucial role in emotional processing [44, 45]. As a basic taste, excessive saltiness can produce unpleasant taste stimulation. The concentration of salt solution used in this study caused discomfort in all participants. Swallowing a salt solution may have led to activation in the OFC and frontopolar area of the brain in healthy participants. O’Doherty et al. [46] showed that the OFC is involved in processing negative and positive emotional responses, with more pronounced activation in the OFC during sweet taste (glucose) and salty taste (NaCl) stimulations compared to tasteless stimulation (water). This is consistent with the results reported here.
In this study, the area and extent of activation in the PFC of the brain was higher when swallowing acetic acid solution and salt solution than swallowing water. Previous clinical research has found that many patients with cognitive impairments experience difficulty swallowing, and patients have been observed to have long-term swallowing dysfunction after a stroke. Therefore, the relationship between cognition and swallowing has been widely studied, with previous research indicating that cognitive function plays a crucial role in the swallowing process [47]. In this experiment, subjects reported a stronger discomfort when swallowing acetic acid solution and salt solution than when swallowing water, which not only required the execution of swallowing function but also involved cognitive components such as perception to ensure swallowing. Neurons were continuously activated to enable the completion of swallowing. When swallowing plain water, subjects had less activation of cognitive components, lacking the involvement of cognitive factors. This may explain why the activation of the PFC was significantly lower when swallowing water compared to swallowing acetic acid solution and salt solution.
This study has several limitations. First, due to equipment limitations, fNIRS can provide reliable and effective data on hemoglobin concentration levels in participants but cannot assess activity in deeper brain regions such as the insular cortex, basal ganglia, cerebellum and brainstem that are closely related to swallowing. Second, the sample size was relatively small, with only eighteen healthy participants recruited for this preliminary experiment, which might not be sufficient to broadly generalize the results of swallowing water, acetic acid solution and salt solution. Future studies with larger sample sizes are needed. Additionally, the experimental procedure included both swallowing tasks and taste stimulations, so the results of swallowing movements may also be influenced by taste stimulation. Finally, in future research, further assessments can be conducted on patients with swallowing disorders to explore the differences in brain activation between healthy individuals and patients under taste stimulation.
The fNIRS research results indicate that swallowing either water, acetic acid solution or salt solution activates multiple brain regions involved in the regulation of the swallowing process in healthy subjects. fNIRS further helps to elucidate the neural network mechanisms related to swallowing. Additionally, this preliminarily study suggests that swallowing acetic acid solution can better activate the DLPFC, Broca’s area, PMC and SMA in healthy subjects when compared to swallowing water. Swallowing salt solution exhibits greater activation in the frontopolar area and OFC than swallowing water. The changes in brain function activation provide theoretical support for taste stimulation in patients with swallowing disorders, helping the choice of better rehabilitation methods to improve clinical symptoms. Therefore, using acid and salty stimulation for the treatment of patients with swallowing disorders may promote the recovery of both brain function and swallowing function.
The raw data supporting the conclusions of this article will be made available by the authors, without undue reservation.
JK and JL conceived designed the experiment. MG carried out the preparation of experimental materials and experiments. YY and SW collected data and revised the article. SG analyzed and interpreted data. MT and YW directed the overall experiment and provided financial support. All authors contributed to editorial changes in the manuscript. All authors read and approved the final manuscript. All authors have participated sufficiently in the work and agreed to be accountable for all aspects of the work.
Studies reported here involving human participants were reviewed and approved by the Ningbo Rehabilitation Hospital (approval number: 2023-24). Participants provided written informed consent for their participation in this study. Written informed consent was obtained from individuals for the publication of any potentially identifiable images or data included in this article.
The authors thank all the participants in this study except the authors.
This project was supported by the Zhejiang Traditional Chinese Medicine Science and Technology Plan Project (2024ZL954).
The authors declare no conflict of interest.
References
Publisher’s Note: IMR Press stays neutral with regard to jurisdictional claims in published maps and institutional affiliations.