


 , Yihuai Zou 1,*
1 Department of Neurology, Dongzhimen Hospital, Beijing University of Chinese Medicine, 100700 Beijing, China
2 Department of Imaging, Dongzhimen Hospital, Beijing University of Chinese Medicine, 100700 Beijing, China
Abstract
Advancements in neuroimaging technologies have significantly deepened our understanding of the neural physiopathology associated with stroke. Nevertheless, the majority of studies ignored the characteristics of dynamic changes in brain networks. The relationship between dynamic changes in brain networks and the severity of motor dysfunction after stroke needs further investigation. From the perspective of multilayer network module reconstruction, we aimed to explore the dynamic reorganization of the brain and its relationship with motor function in subcortical stroke patients.
We recruited 35 healthy individuals and 50 stroke patients with unilateral limb motor dysfunction (further divided into mild-moderate group and severe group). Using dynamic multilayer network modularity analysis, we investigated changes in the dynamic modular reconfiguration of brain networks. Additionally, we assessed longitudinal clinical scale changes in stroke patients. Correlation and regression analyses were employed to explore the relationship between characteristic dynamic indicators and impairment and recovery of motor function, respectively.
We observed increased temporal flexibility in the Default Mode Network (DMN) and decreased recruitment of module reconfiguration in the Attention Network (AN), Sensorimotor Network (SMN), and DMN after stroke. We also observed reduced module loyalty following stroke. Additionally, correlation analysis showed that hyper-flexibility of the DMN was associated with better lower limb motor function performance in stroke patients with mild-to-moderate impairment. Regression analysis indicated that increased flexibility within the DMN and decreased recruitment coefficient within the AN may predict good lower limb function prognosis in patients with mild to moderate motor impairment.
Our study revealed more frequent modular reconfiguration and hyperactive interaction of brain networks after stroke. Notably, dynamic modular remodeling was closely related to the impairment and recovery of motor function. Understanding the temporal module reconfiguration patterns in multilayer networks after stroke can provide valuable information for more targeted treatments.
Keywords
- functional magnetic resonance imaging
- multilayer brain network
- motor impairment
- module reconfiguration
- stroke
The brain network can be defined as a collection of functional connectivity (FC) among various brain regions, derived from the statistical interdependence of spontaneous fluctuations in their blood oxygen level-dependent (BOLD) signals [1, 2]. Emerging evidence suggests the temporal variability and instability of brain functional network organization, with interactions among specific networks even during the resting state [3, 4, 5]. To accurately capture changes in time-varying FC, existing static models of functional reorganization need to be improved. Several algorithms have been developed to describe brain dynamics, including K-mean clustering [6], co-activation patterns [7], and principal component analysis [8]. Nevertheless, the majority of previous researches on dynamic networks has either ignored the continuum of the time window or failed to investigate the specific patterns of variation among networks explicitly.
Stroke is a common cause of disability in adults [9]. Function impairment after stroke can be considered a disorder within the brain network. Clinically, stroke patients with similar lesion locations may exhibit markedly diverse motor function outcomes [10]. The pattern of functional reorganization may reflect the severity of the disease, the accumulation of auto-adaptive capacity during disease progression, and the effectiveness of interventions [11, 12, 13]. Pioneering researchers have sought to identify image features that may be biomarkers of motor recovery after stroke. They found that increased FCs between the cortex are associated with recovered grasping performance after stroke [14], and restoration of coupling patterns within the ipsilesional hemisphere over time has been related to the extent of recovery [15]. The advent of dynamical analysis methods has broadened research searching for neuroimaging biomarkers.
Graph theory has confirmed the existence of modular organization within the brain [16, 17, 18]. Each distinct module is responsible for specific functions, and this modular arrangement is thought to enable efficient processing of designated functions while maintaining global network integration [19]. Similarly, the modular organization of the brain exhibits dynamically altering properties. The multilayer network modular algorithm [20], a mathematical extension of conventional networks, can be envisioned as a stack of numerous individual two-dimensional matrix networks, forming a three-dimensional multilayer network. In a dynamic multilayer network, each layer represents FC within a specific time window, and clusters with similar BOLD time courses within each time window are identified as modules [21, 22]. The advantage of the dynamic module detection method lies in its capacity to provide insights into continuous brain dynamics by preserving the temporal order between neighboring layers. Alterations in modular structure are frequently correlated with nervous system diseases, as exemplified in schizophrenia [23], depression [24], autism [25], and bipolar disorder [26]. However, applying this method to the post-stroke brain needs further investigation. Notably, since network properties are not static over time, dynamic changes in the brain network within seconds or minutes may represent a more sensitive measure of impairment and recovery of brain functions.
In this study, we used the multilayer modular network algorithm with temporal resolution to reveal dynamic modular reorganization after stroke. Additionally, we sought to identify the relationship between changes in module characteristics and motor performance after stroke. We hypothesized that substantial dynamic restructuring of the modular structure occurs after stroke, and these aberrant temporal variabilities are related to post-stroke hemiparesis. These findings would facilitate a deeper understanding of the neural mechanisms underlying movement deficits and recovery.
We screened patients from the First Affiliated Hospital of Beijing University of Chinese Medicine. Criteria for inclusion comprised the following: (1) age 18–80 years; (2) patients were diagnosed with ischemic stroke and suffered for the first time (Referring to the Chinese Guidelines for the Diagnosis and Treatment of Acute Ischemic Stroke 2018 https://www.medsci.cn/guideline/show_article.do?id=fec5a1c0016ea8f7); (3) the illness duration ranged within 1.5 months; (4) motor dysfunction after stroke was the prominent manifestation; (5) patients were right-handed before the stroke. We recruited 35 demographically matched healthy controls (HCs) from the local community with no psychological or neurological disorders. The studies involving human participants were reviewed and approved by Medical Ethics Committee, Dongzhimen Hospital, Beijing University of Chinese Medicine (No: 2022DZMEC-111-02). Written informed consent was provided for the patients or their families/legal guardians.
To reduce the impact of potential confounding factors, we adopted a set of exclusion criteria: (1) inability to complete clinical scales; (2) any history of neurological disorders, such as multiple infarcts, hemorrhage, or psychiatric disorders; (3) any contraindications to undergo Magnetic Resonance Imaging (MRI).
All resting-state functional imaging scans were acquired with a 3.0-Tesla
scanner (Siemens, Verio, Germany) at the MRI Unit of the First Affiliated
Hospital of Beijing University of Traditional Chinese Medicine, using a
single-shot T2*-weighted gradient echo planar imaging (EPI) sequence, with the
following parameters: Repetition Time (TR) = 2000 ms, Echo Time (TE) = 30 ms, fip
angle = 90°, slice thickness = 3.5 mm, skip = 1 mm, and slice number =
31, matrix size = 64
The MRI images of 26 patients with right hemispheric lesions were flipped along
the midsagittal plane before data analysis [27]. Data preprocessing was
implemented using SPM12 software (Statistical Parametric Mapping 12,
http://www.fil.ion.ucl.ac.uk/spm). Each functional Magnetic Resonance Imaging
(fMRI) scan consisted of 179 time points. We discarded the first ten volumes to
correct magnetic field equilibration, signal stabilization, and adaptation of
subjects to scanner noise. Subsequent data preprocessing steps include slice time
correction, motion correction, spatial normalization, and smoothing. Next, we
standardized all images to the Montreal Neurological Institute (MNI) space. The
resampling voxel size was 3
The motor function was assessed using the Fugl-Meyer
Assessment (FMA). FMA serves as a robust tool for evaluating disease severity,
rehabilitation progress, and treatment response [28], which can be subdivided
into FMA upper extremity scores (FMA-U) and FMA lower extremity scores
(FMA-L). A lower FMA score indicates more severe motor
impairment caused by stroke. Considering the diverse range of motor impairment
severity among the enrolled patients, additional subgroup analyses were conducted
based on the FMA score. According to Dawson et al. [29], patients with
an FMA score
In this investigation, we restricted the stroke group to
patients with strokes lasting less than 1.5 months, with unilateral limb
dysfunction as the primary symptom. Additionally, we enrolled patients with
ischemic lesions localized on one side of the centrum semiovale, corona radiata,
and basal ganglia regions to ensure a high degree of sample homogeneity.
In addition, we explained the scanning procedure to the
participants before the MRI scan. We also emphasized the importance of
maintaining audiovisual closure and avoiding cognitive processes during scanning.
Participants displaying excessive head motion (
We utilized the DynamicBC toolbox (http://www.restfmri.net/forum/DynamicBC) [30]
to generate dynamic FC. The entire brain was divided into 90
regions (excluding the cerebellum) using the Anatomical Automatic Labeling (AAL)
atlas [31]. This atlas divides the brain into five Resting-State Networks (RSNs),
including the Default Mode Network (DMN), Attention Network (AN), Visual Network
(VN), Subcortical Network (SN), and Sensorimotor Network (SMN). Dynamic FC was
computed through the sliding time window method, which involved segmenting the
entire fMRI time series into smaller time windows and calculating the
connectivity matrix for each time window. Then, dynamic
multilayer brain networks were constructed by linking a node in the coherence
matrix to its corresponding node in the coherence matrix of adjacent time
windows. Different from methods that treat the data in each
window as an independent sample, the multilayer network approach considers the
temporal dependence between windows. Following the methodology of previous
studies [14, 32], we employed a sliding window length of 50, with the window
shifted by 1 step. FC between brain regions was assessed using Pearson
correlation coefficients and Fisher Z-transformed. Consequently, for each
participant, a matrix of dimensions 90
Multilayer modular detection describes clusters of highly connected regions as
modular structures that change over time. We applied the modularity maximization
algorithm to detect the temporal modular within the dynamic multilayer network
[33]. This algorithm identifies modular temporally by maximizing a Louvain-like
modularity function (
Where µ is the total edge weight in the network,
Multilayer modularity analysis classifies brain regions into modules for each
time window. To capture temporal changes in module configurations, we defined the
flexibility of node
Here,
The Module Allegiance Matrix (MAM) detection was introduced to analyze interactions between different brain areas in the multilayer networks. The values in the MAM represent the proportion of times during the scanning process that the nodes within the RSNs are assigned to the same module. If two nodes within the RSN are consistently assigned to the same module, their module allegiance is 1. If they never appear together in the same module, their module allegiance is 0. MAM is calculated as follows:
Where
The dynamic interaction among brain regions can be more precisely characterized using two metrics: the recruitment coefficient and the integration coefficient, derived from the MAM. The recruitment coefficient describes the probability of nodes from the same RSN reorganizing into modules during scanning, thus reflecting internal alignment. Conversely, the integration coefficient denotes the probability of a node sharing the same module with nodes from different RSNs, representing the alliance with regions from diverse RSNs.
The recruitment coefficient for node
The integration coefficient for node
In the two appealing equations,
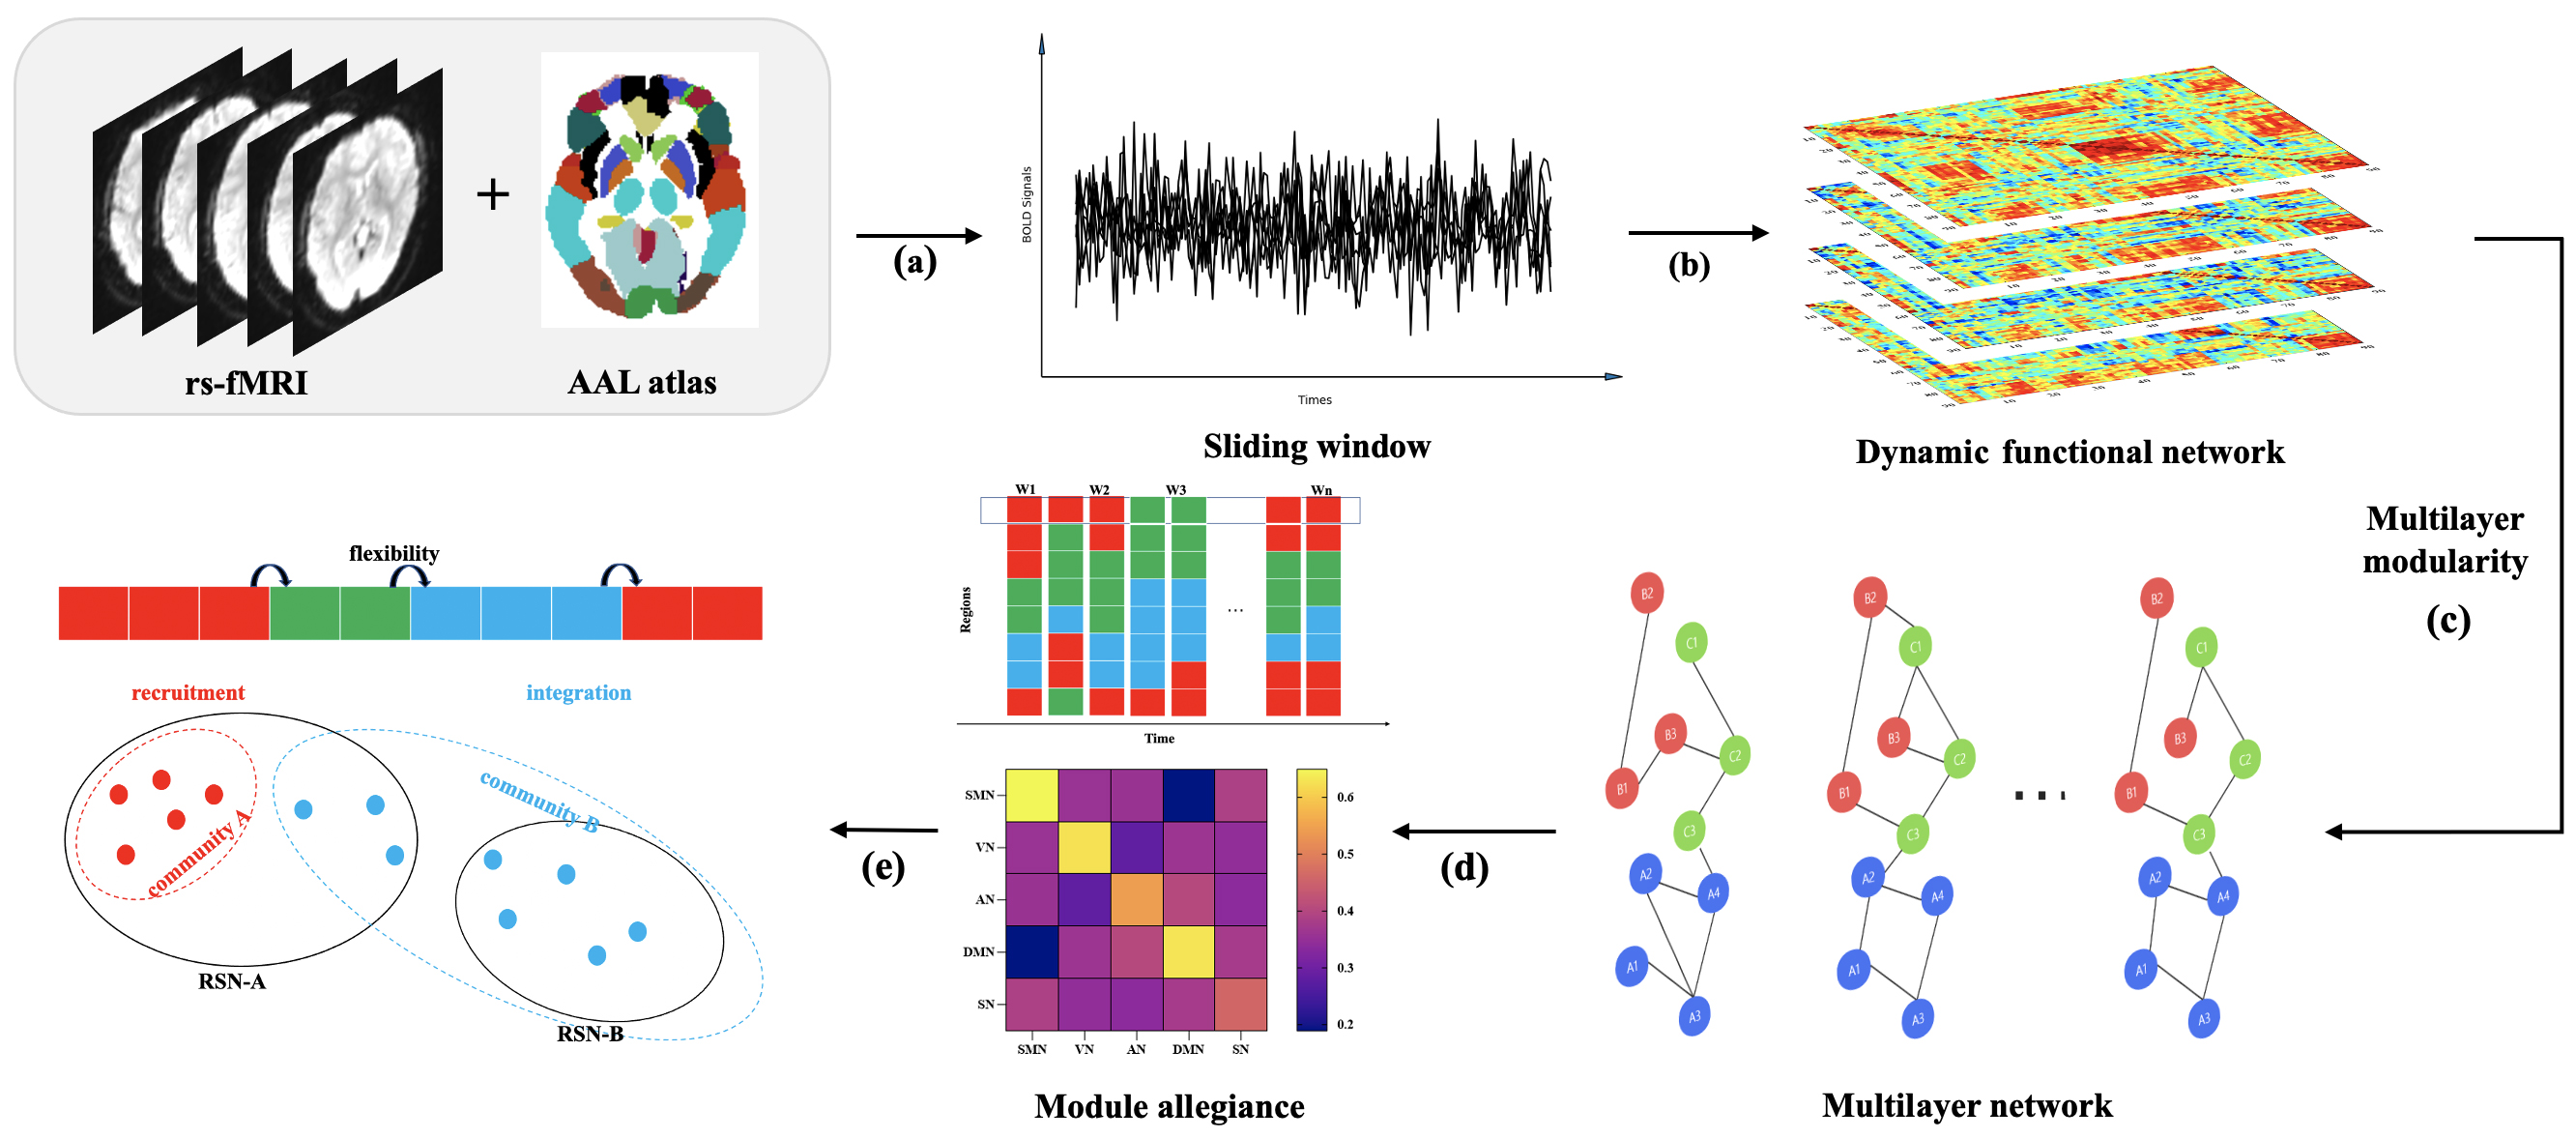 Fig. 1.
Data analysis flowchart. (a) Image pre-processing and time series extraction from fMRI signals by AAL atlas. (b) Sliding window analysis to construct individual dynamic functional matrix. (c) Multilayer network construction and module division. (d) Calculation of flexibility and construction of the Module allegiance matrix. (e) Calculation of recruitment and integration coefficients. Abbreviations: AAL, Anatomical Automatic Labeling; RSN, Resting State Networks; fMRI, functional Magnetic Resonance Imaging; BOLD, blood oxygen level-dependent; SMN, Sensorimotor Network; VN, Visual Network; AN; Attention Network; DMN, Default Mode Network; SN, Subcortical Network.
In the analysis of the modular structure of multilayer networks, the parameter
We performed Pearson correlation analyses of FMA scores on the day of the MRI
scan and dynamic indicators with characteristic changes after stroke, p
We employed a single linear regression model
to identify neuroimaging markers sensitive to the favorable prognosis of motor
function after stroke. Dynamic measures exhibiting intergroup differences were
used as dependent variables, while scale scores reflecting motor function
improvement served as independent variables. The coefficients in the model were
estimated using the least squares method. Subsequently, the regression equation
was tested using an F-test. A significance level of p
Differences in demographic information among
the three groups were analyzed using a one-way analysis of variance (ANOVA). For
clinical scales, a paired-sample t-test was employed to identify
differences between the pre-assessments and post-assessments in the stroke group.
Metrics related to multilayer brain networks, including Q, flexibility,
recruitment, and integration coefficients, were evaluated by calculating the
average value across all nodes within the same RSN. The Kolmogorov-Smirnov test
was subsequently applied to assess data normality. If the data were not normally
distributed, the Kruskal-Wallis H-rank sum test was used. If
the data were normally distributed, ANCOVA was used, with age
and gender included as covariates. A post-hoc analysis Multiple Comparison of
Means - Tukey Honestly Significant Difference (Means - Tukey HSD) was conducted
for dynamic multilayer network parameters showing group effects. Differences were
considered significant at p
Participants included 50 stroke patients and 35 HCs. Excessive head movement was observed in 4 stroke patients and 4 HCs. Ultimately, 46 stroke patients and 31 HCs were included in the analyses. The stroke group was further divided into mild-moderate impairment (n = 30) and severe impairment (n = 16) groups. There were no significant differences in age (p = 0.333) and gender (p = 0.307) were found among the three groups. The clinical characteristics of participants are summarized in Supplementary Table 1.
Stroke patients showed significant improvement in FMA, FMA-L, and FMA-U scores, indicating improvement in motor performance. Details are provided in the Table 1.
| Clinical Scale scores | Mild-to-moderate deficits (n = 30) | p value | Severe motor deficits (n = 16) | p value | ||
| First assessment | Second assessment | First assessment | Second assessment | |||
| FMA | 87.40 |
93.50 |
31.25 |
44.06 |
||
| FMA-L | 30.73 |
32.60 |
0.002 | 20.38 |
26.06 |
0.03 |
| FMA-U | 56.63 |
60.53 |
0.001 | 10.94 |
20.00 |
0.002 |
The differences in scale scores were analyzed by paired sample t test. Abbreviations: FMA, Fugl-Meyer Assessment; FMA-L, Fugl-Meyer Assessment-Lower Extremity; FMA-U, Fugl-Meyer Assessment-Upper Extremity.
Ischaemic lesions in stroke patients included in the study were predominantly distributed in the basal ganglia, internal capsule, thalamus, and corona radiata. Employing MRIcron software (Version 4, http://www.softpedia.com/get/Science-CAD/MRIcron.shtml), we labeled the infarct lesions of each participant. The distribution of infarct lesions was overlapped for presentation (Fig. 2).
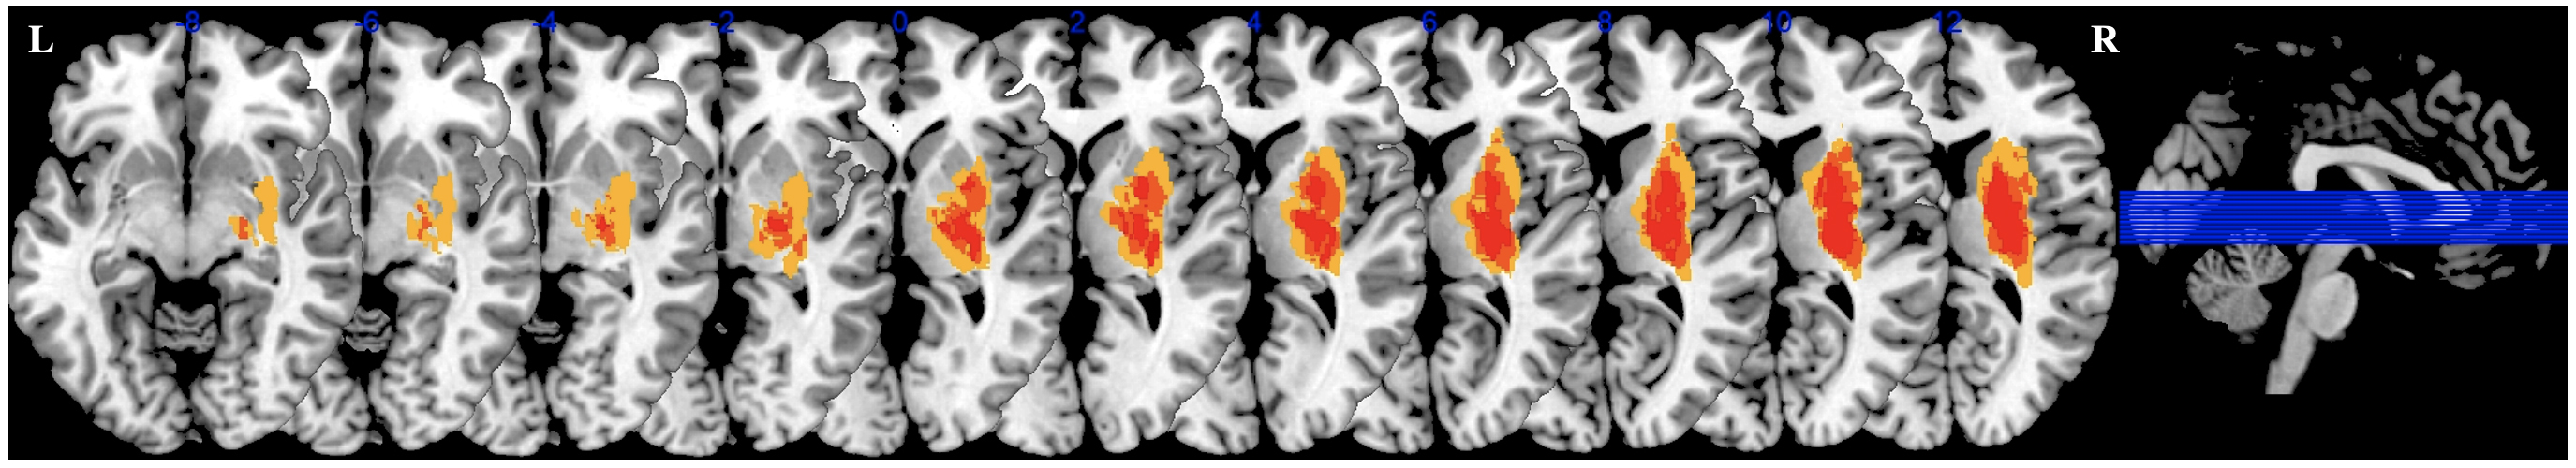 Fig. 2.
Overlapping lesion images. The images with left hemisphere lesions were flipped from left to right along the median sagittal line. The blue lines represent the slices of the brain shown. Abbreviations: L, Left; R, Right.
To quantify the compartmentalization of potential functional modules in the
brain, we calculated the modularity Q. The process of community
switching over the scanning time is illustrated in Fig. 3A–C, with one subject
randomly selected from each group as an example. There were no statistically
significant differences in Q and
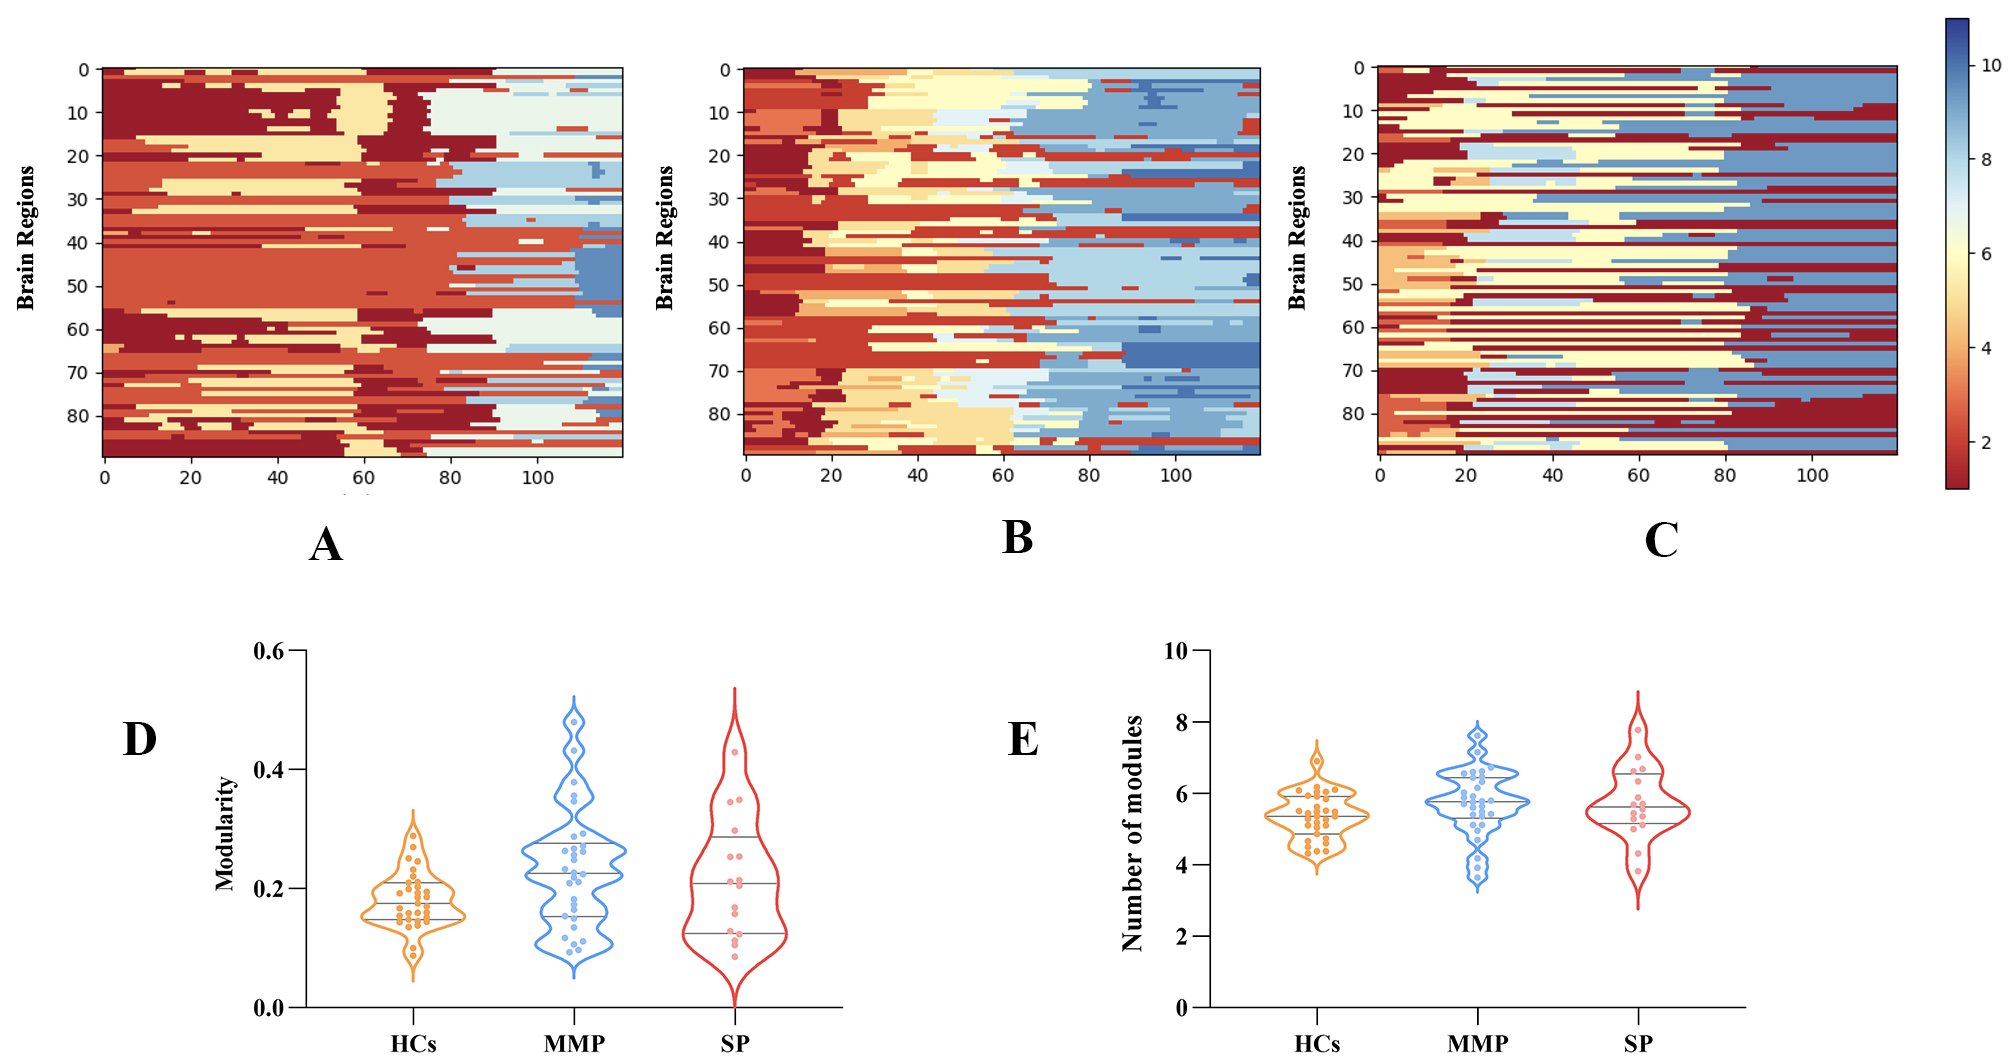 Fig. 3.
Modular partitioning of multilayer brain networks. (A) Modular segmentation of HCs during the scanning time. (B,C) Dynamic module partitioning for mild-to-moderate and severe motor impairments, respectively. (D) Comparisons among stroke patients with mild-to-moderate and severe impaired motor function and HCs in modularity Q. (E) Difference in the number of modules among the three groups. Abbreviations: Q, Modularity Q; HCs, Health controls; MMP, Mild-to-moderate patients; SP, Severe patients.
We computed the flexibility of RSNs to characterize the dynamic reconstruction of modules. Patients with stroke exhibited higher flexibility in the DMN than HCs (p = 0.009). Post-hoc analyses revealed that patients with mild to moderate impairment showed significantly greater flexibility in the DMN than HCs (p = 0.022). No statistical differences were observed in the other networks. Further details can be found in Fig. 4D.
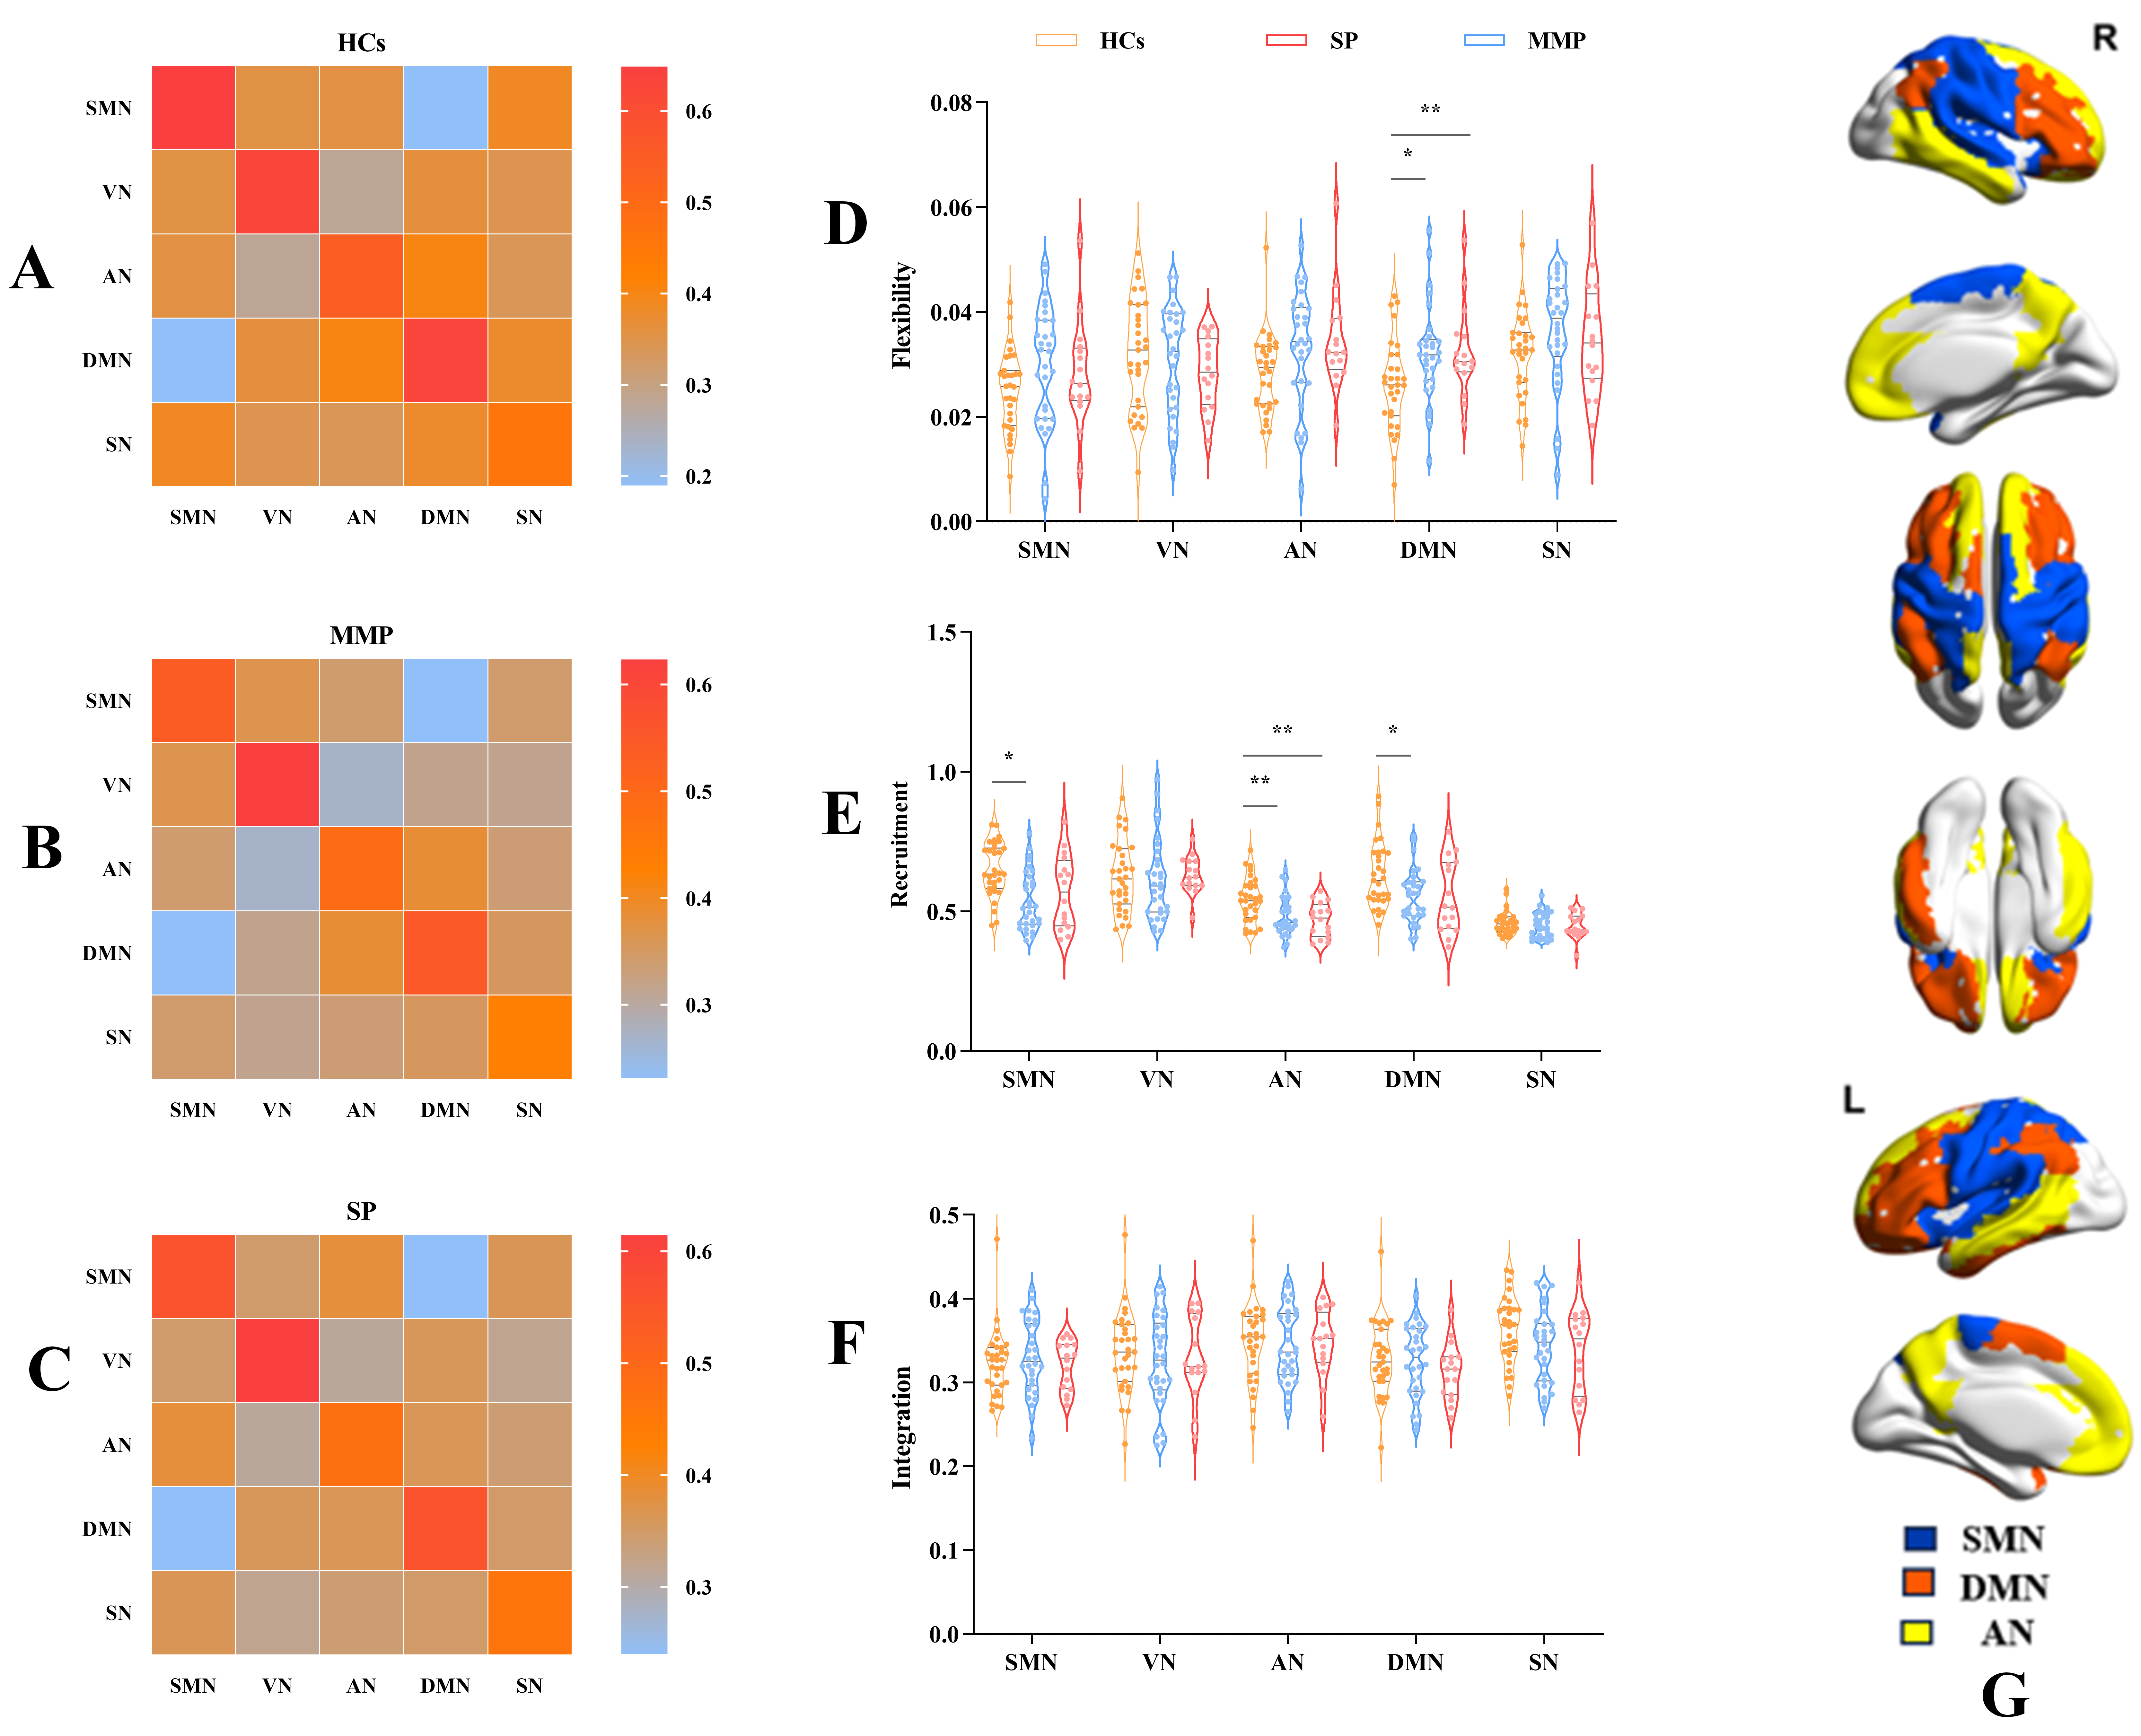 Fig. 4.
Module reconfiguration pattern differences.
(A) MAM of HCs. (B) MAM of MMP. (C) MAM of SP. (D) The results
showed that flexibility in the DMN were higher in MMP than in HCs, implying more
frequent modular reconfiguration in MMP. (E,F) The results
showed lower recruitment coefficients of SMN, AN, and DMN in MMP compared to HCs.
Furthermore, the recruitment coefficient of AN was reduced in SP compared to HCs.
These findings suggest a significant alteration in the pattern of modular
reconfiguration and augmented interaction between brain networks after stroke.
Single (*) and double (**) asterisks represent p
The MAM, also known as the temporal co-occurrence matrix [36],
describes the relationship between RSNs. To explore patterns of networks in the
dynamic reconfiguration of modules, we generated module loyalty matrices of RSNs
for three groups. Each subject possessed a module loyalty matrix, and the group
level was shown by averaging all subjects within the group (Fig. 4A–C). The
darker color in the heatmap signifies a lower probability of network alignment,
while a lighter color indicates a higher likelihood of alignment. Within the MAM,
the intra-network color is brighter than the inter-network
color in both HCs and patients (p
Recruitment and integration coefficients characterize the alignment preferences
of brain regions during the dynamic reconfiguration process by assessing the
relationship between empirical functional networks (i.e., RSNs defined by a brain
atlas) and actual delineated modules (i.e., the functional compartments of
observed subjects computed by a modular maximization algorithm). The MAM provides
a holistic view of the dynamics of brain networks. To further investigate the
dynamic interactions within and between RSNs after stroke, we compared the
recruitment and integration coefficients of the RSNs among the three groups. The
results revealed that the recruitment coefficients of the patients, compared to
the HCs, were significantly lower in the AN, SMN, and DMN (Kruskal-Wallis H, AN:
p
We correlated the dynamic indicators of significant differences with the patients’ motor performance. We found that higher flexibility of DMN after stroke positively correlates with lower limb functional performance in patients with mild-to-moderate motor impairment (r = 0.369, p = 0.045, Fig. 5A). However, this correlation was not found in patients with severe motor impairment (r = 0.057, p = 0.833, Fig. 5D). In addition, dynamic indicators with statistical differences were entered into a linear regression model to establish the relationship between motor function recovery after two weeks and temporal features. We found that hyper-flexibility of DMN (R2 = 0.200, F (1,28) = 5.798, p = 0.013, Fig. 5B) can predict improved lower limb motor function in patients with mild-to-moderate motor impairment. Additionally, higher recruitment coefficients of the AN predict worse recovery of lower extremity function in these patients (R2 = 0.132, F (1,28) = 4.243, p = 0.049, Fig. 5C), indicating that lower recruitment coefficients correspond to improved lower limb motor recovery. However, other dynamic indicators in patients with mild-to-moderate impairment showed no relationship with the prognosis of motor function. Furthermore, we did not observe an association between dynamic metrics and lower limb motor outcomes in patients with severe motor deficits after stroke. The results are shown in Fig. 5E,F. Patients without lower limb motor impairment (FMA-L = 34 points) were excluded from regression analyses to avoid the ceiling effect [29]. Significant predictive relationships remained in patients with mild-to-moderate motor impairment, suggesting that the main results were stable and not significantly influenced by the ceiling effect. Detailed analysis procedures are provided in the Supplementary Results.
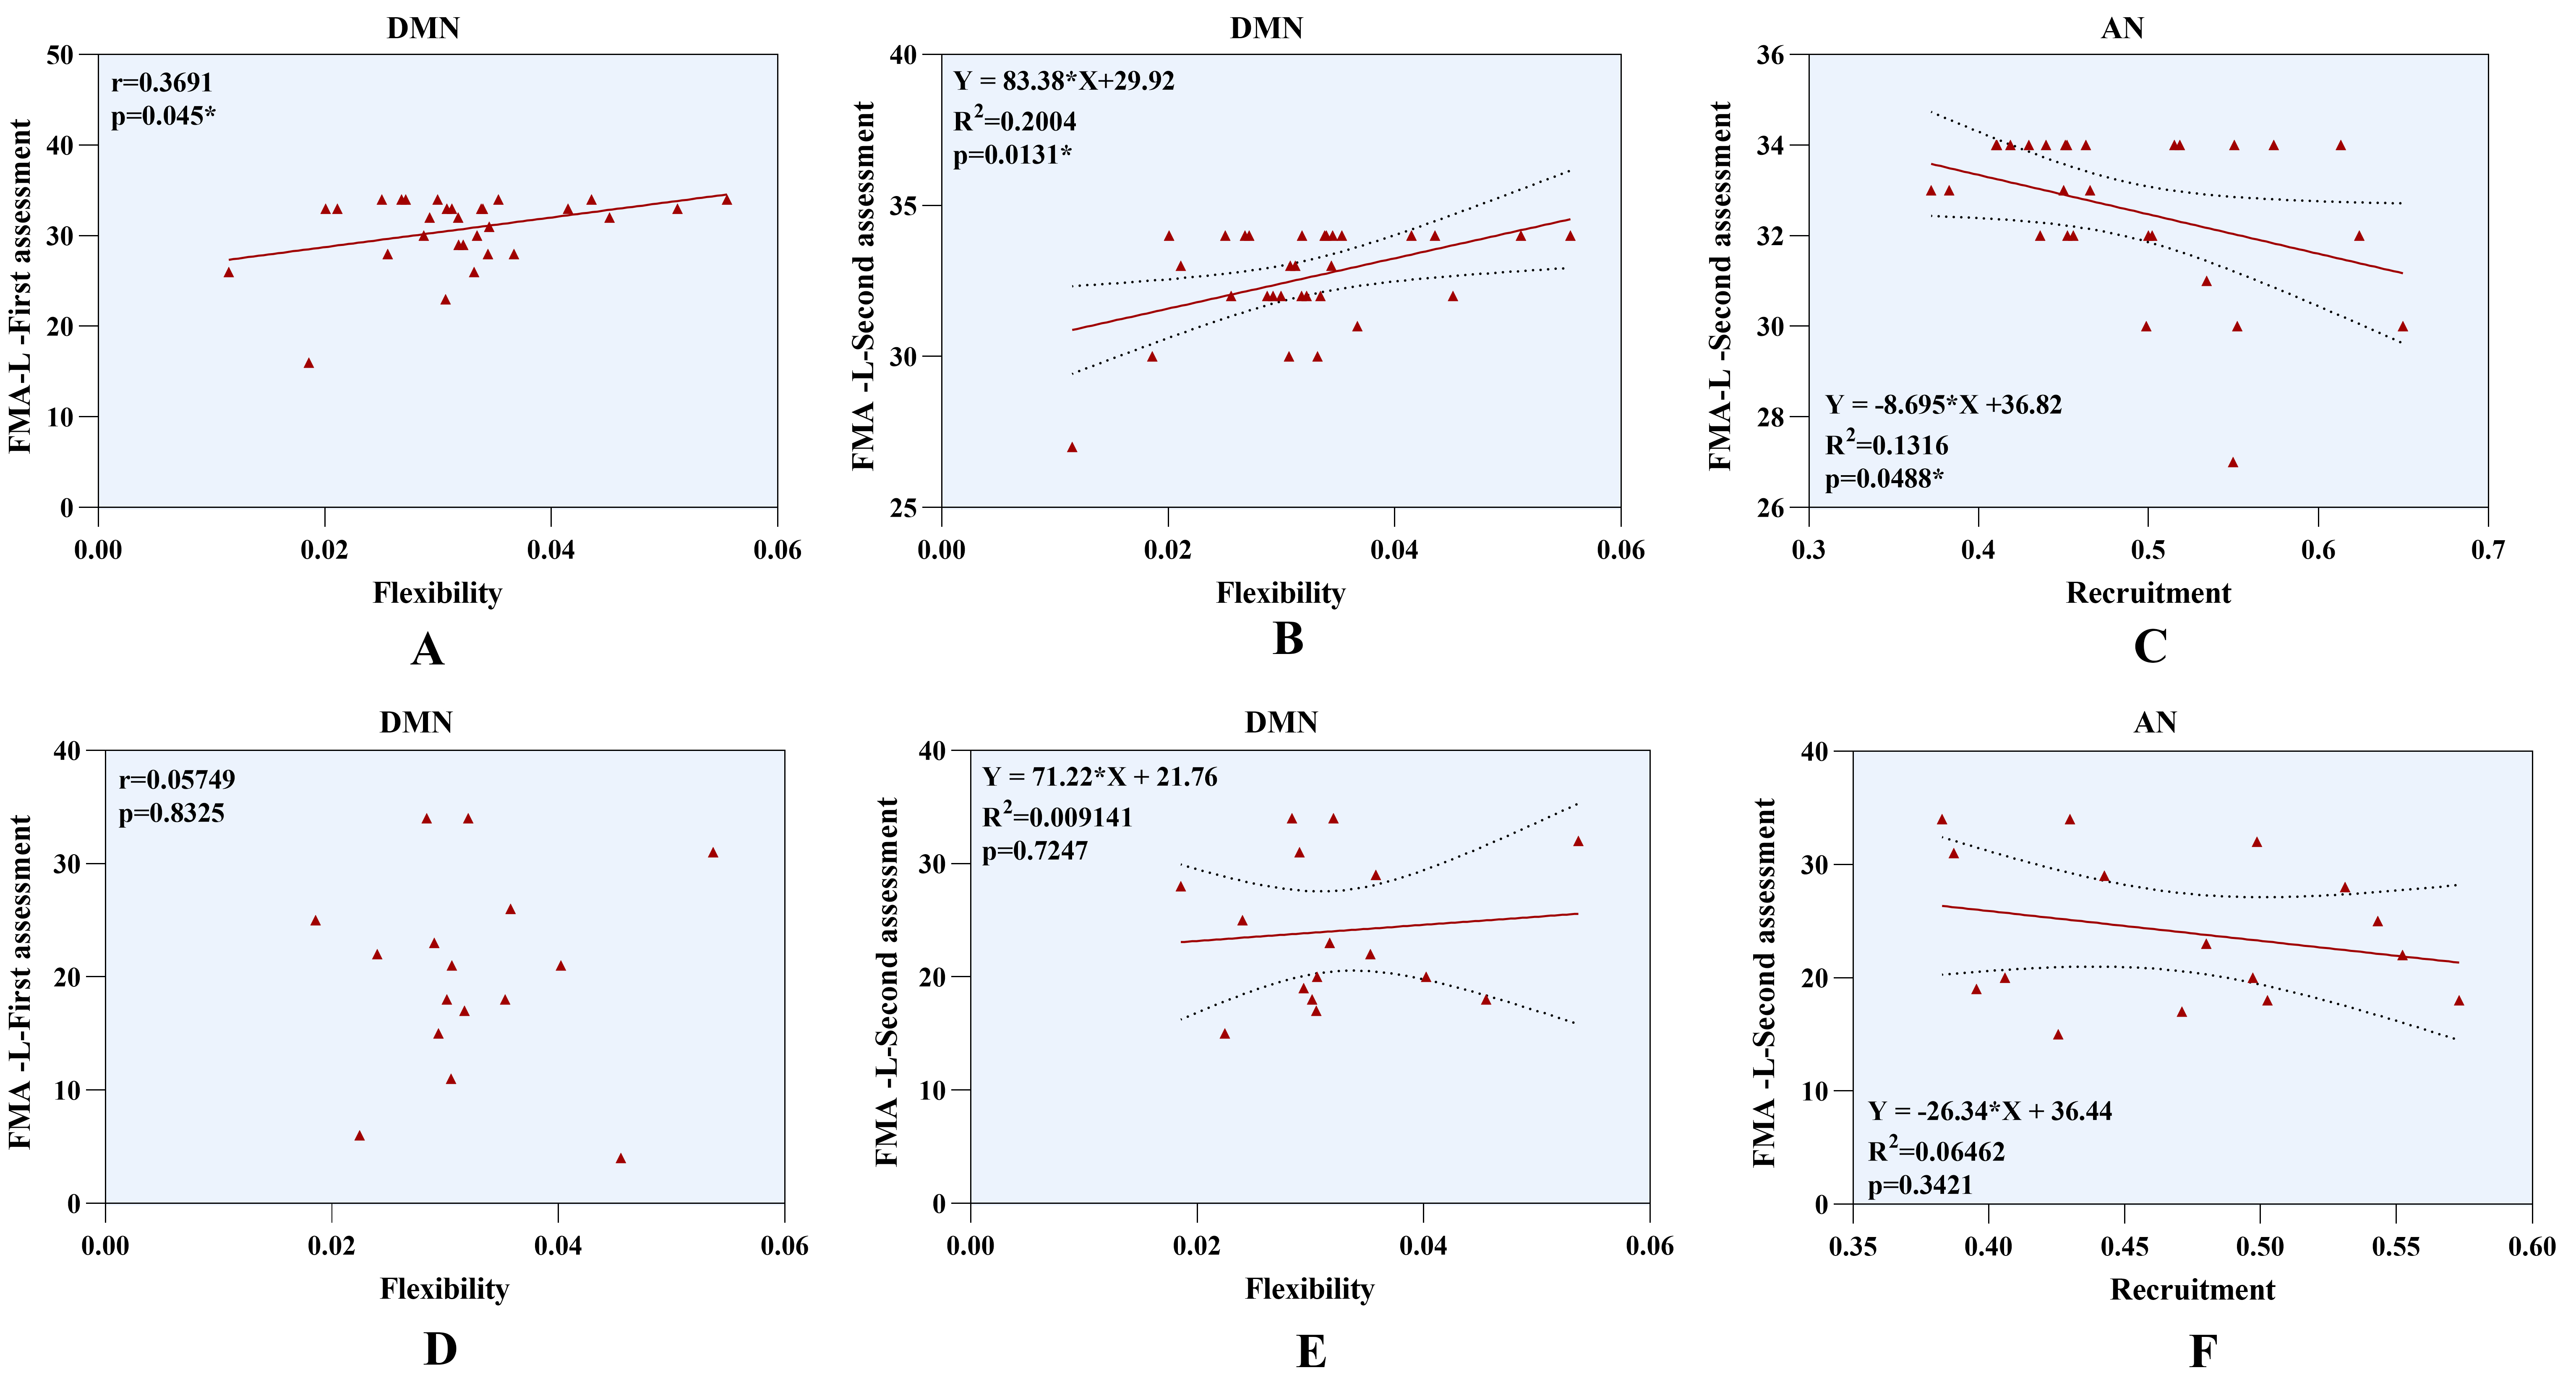 Fig. 5.
Regression analysis of dynamic indicators and lower limb motor function. (A) Higher flexibility of DMN positively correlates with lower limb function in patients with mild-to-moderate motor impairment. (B) Hyper-flexibility of DMN predicts improvement of lower limb outcomes in patients with mild-to-moderate motor deficits. (C) Higher recruitment coefficients of AN represent worse lower limb prognosis in patients with mild-to-moderate motor deficits. (D–F) No association was found between dynamic indicators and lower limb motor outcomes in patients with severe motor impairment. Abbreviations: AN, Attention Network; DMN, Default Mode Network; FMA-L, Fugl-Meyer Assessment-Lower Extremity.
Pearson correlations were calculated across different analysis strategies to
assess the consistency of the main findings. The results indicated a high level
of consistency, with correlations between different pairs of
Brain function remodeling after stroke involves dynamic integration and coordination across multiple regions and time scales. We applied modular detection algorithms to identify multilayer temporal networks and to capture the dynamic interaction of RSNs after stroke. We observed increased flexibility in the DMN and decreased recruitment in the DMN, AN, and SMN. Correlation and regression analysis were employed to investigate the relationship between dynamic alterations and motor function impairment and recovery. The results showed a positive correlation between the over-flexibility of the DMN and motor performance in patients with mild to moderate deficits. The regression analysis results suggest that higher flexibility in the DMN and lower recruitment coefficients in the AN may be biomarkers for predicting lower limb motor function recovery in patients with mild-to-moderate motor impairment. These findings highlight dynamic alterations in the multilayer network modular structure after stroke and provide complementary evidence for dynamic graph theory. In conclusion, this study reveals the neural mechanisms underlying stroke, and this dynamic module reorganization potentially serve as a neuroimaging biomarker for motor function recovery.
Flexibility describes the frequency of module rearrangements. Our results confirm that, even in the resting state, the brain module structures of stroke patients and HCs continuously transformed. We identified hyper-flexibility of DMN after stroke, suggesting stroke caused an unstable network structure and active reconfiguration within the DMN, especially in patients with mild to moderate motor impairment. Previous research has reported increased brain network flexibility during cognitive tasks, suggesting it responds to behavioral changes [20]. Acquiring motor skills in HCs is also closely associated with increased flexibility [37]. Disease states lead to over-flexibility, as observed in patients with autism spectrum disorder [25] and schizophrenia [38]. This remote activation may be a form of dysfunction or a compensatory response [39, 40]. The DMN is responsible for primary perception, advanced cognition, and their integration. Abnormal FC changes within and between the DMN have been reported in subcortical stroke patients [41]. Distinctive alterations in the DMN have been observed in both acute and chronic stroke patients without cognitive deficits [42]. The dynamic switching of modules in the DMN may represent an optimization strategy for delivering brain information to support diverse functional activity.
Stroke induces complex information exchange across multiple networks [43, 44, 45, 46]. Frequency-based exploration of dynamic reconfiguration in the multilayer network after stroke reveals an overly flexible state in the DMN. Probabilistic-based exploration methods, such as MAM, recruitment, and integration coefficients, complement the forms of modular reconfiguration. We observed reduced recruitment coefficients in the SMN, AN, and DMN, suggesting that stroke disrupts the original functional networks in the normal brain. Consequently, these networks are less separated from other RSNs and tend to continuously reconfigure modules with other RSNs to support neurological functions of the brain after stroke. It may serve as an adaptive response to impaired brain function. Numerous studies have consistently demonstrated altered FC within sensorimotor and cognitive control regions. The SMN has been reported to undergo significant changes in FC following acute stroke, playing a crucial role in the intricate process of motor function remodeling [47, 48]. The SMN is vital in perceptual transmission and motor initiation after stroke [49]. Anomalies in the SMN appear to mirror irregularities in motor network interaction after stroke and adaptive changes in response to motor network impairment. The AN correlates with processing incidental stimuli and attentional shifts [50]. The ventral AN assumes a critical role in accident perception and the processing of adaptive percepts [51]. The dorsal AN has been emphasized for its significant role in attentional control, visuospatial processing, and goal-directed orientation [52]. Additionally, previous research has reported FC disruptions within the AN and SMN. These abnormal changes may have implications for prognosis and recovery from stroke [53]. In summary, from the perspective of dynamic module remodeling, we observed more significant temporal variability after stroke, providing new evidence for changes in these networks.
Functional brain networks maintain communication in the resting state, exhibiting integration, interaction, and synchronization effects. Within the modular structure of the multilayer network, RSNs are assigned to different or the same modules in each layer. Specific RSNs may display abnormal dynamic modular allegiance, impairing the necessary integration of brain functions. The MAM summarizes the consistency of RSNs assigned to modules. We calculated the MAM in both stroke patients and HCs, and the results suggest that the RSNs tend to form modules with themselves in both physiological and pathological states. Notably, we observed a reduction in the MAM within all RSNs after stroke, which was evident in patients with mild to moderate and severe motor impairment. These results suggest that nodes within the same RSNs are less likely to reorganize into the same module, indicating weaker intra-network interactions after stroke. In addition, we observed an increase in the MAM between RSNs after stroke, supporting the increased interaction of networks during dynamic module reconfiguration. This increased communication between networks after stroke may reflect compensatory or maladaptive responses to impaired connectivity. The MAM can be considered a soft partitioning method to describe the degree or probability of each RSN’s participation in modules [54]. Higher module loyalty may correspond to more robust structural or functional connectivity of networks. It should be noted that dynamic network integration between networks is not mathematically equivalent to structural or functional connectivity. A network can exhibit strong structural or functional connectivity with other networks but weak dynamic network integration, suggesting its regions are less likely to combine with other networks into modules [55]. The over- and under-synchronization pattern after stroke suggests a complex, time-varying evolution of module structure. The mechanisms underlying the increase in dynamic reconfiguration after stroke remain elusive but may involve an altered excitation/inhibition balance and regulatory functions between networks.
Numerous attempts have been made to identify neural biomarkers; abnormal functional and structural connectivity were observed in patients with post-stroke motor dysfunction, which is associated with clinical impairment and recovery [10, 56]. The modular multilayer network analysis approach used in this study can sensitively capture the dynamic characteristics of the brain, compensating for the limitations of previous studies. We found over-flexibility of the DMN in patients with mild to moderate motor impairment, which reflects good motor function performance. Furthermore, multilayer network metrics with significant differences were included in the regression model to assess the relationship between these metrics and motor recovery after 2-week follow-up. The results showed that increased flexibility in the DMN may predict motor improvement of the lower limb in patients with mild-to-moderate motor function deficits. This hyperactivation might be instrumental in exchanging information during motor function recovery. RSNs with lower recruitment coefficients exhibit less uniform assignment to modules over time, while RSNs with higher recruitment coefficients indicate more dynamic interaction with other RSNs. Lower recruitment coefficients in the AN suggest that the AN is more inclined to participate in multiple brain functions and is involved in a dynamic process of reorganizing the module as a connection unit, it may also be a potential biomarker for predicting the recovery of lower extremity motor function in patients with mild-to-moderate motor deficits. The current findings suggest that early dynamic modular reorganization may reflect motor function impairment and predict recovery longitudinally. Understanding this relationship will facilitate the development of targeted and individualized treatments.
There are some limitations to acknowledge. First, although we performed a repeatability analysis to demonstrate the robustness of the results, the present study included only stroke patients with limited lesions, and the primary manifestation was unilateral motor dysfunction. Therefore, caution is needed when extending these findings to patients with infarcts in different brain regions or to patients with other post-stroke symptoms. Additionally, the relationship was not found in patients with severe motor function impairments, possibly due to slightly impaired patients benefiting more readily from re-adaptation after stroke. We would need a larger sample size of stroke patients, especially severely impaired patients, to improve the statistical power to assess the relationship between dynamic metrics and clinical scale scores.
We employed dynamic multilayer network analysis to investigate patients with unilateral motor function impairment after stroke. The present investigation indicates decreased module loyalty after stroke. Furthermore, we identified hyperactivity in the DMN of stroke patients with mild to moderate motor impairment during dynamic modular remodeling. Higher levels of this activity indicated less impairment of motor function, and this pattern of activity predicted recovery of lower limb movement. In addition, we found that patients with mild to moderate motor impairment had reduced recruitment in the AN, and higher recruitment indicated a poorer prognosis for lower limb outcomes. Specifically, this characteristic pattern of the AN was favorable for recovery of lower limb movement after stroke. Characteristic changes in DMN and AN during dynamic modular reconfigurations potentially serve as biomarkers linked to the damage and recovery of lower limb motor function after stroke. These findings advance our understanding of the neural mechanisms underlying movement deficits and improvements.
The code used in this study are available from https://github.com/GenLouvain/GenLouvain. The data sets analyzed during the current study are available from https://github.com/hqw15/DMMN.
XY analyzed fMRI data and wrote the original draft; KW and YL collected the behavioral and brain imaging data; CC, TC, and XS contributed to the MRI scanning; ZT performed the literature searches and supervised the entire experimental process; YZ designed the study. All authors contributed to editorial changes in the manuscript. All authors read and approved the final manuscript. All authors have participated sufficiently in the work and agreed to be accountable for all aspects of the work.
The studies involving human participants were reviewed and approved by Medical Ethics Committee, Dongzhimen Hospital, Beijing University of Chinese Medicine (No: 2022DZMEC-111-02). Written informed consent was provided for the patients or their families/legal guardians.
Declaration of AI-assisted Technologies in the Writing Process: During the revision of this work, the authors used ChatGPT AI tool in order to check spell and grammar of all the text. After using this tool, the authors reviewed and edited the full text as needed and took full responsibility for the content of the publication.
This work was partially supported by the National Natural Science Foundation of China (No. 82174331).
The authors declare no conflict of interest.
Supplementary material associated with this article can be found, in the online version, at https://doi.org/10.31083/j.jin2310182.
References
Publisher’s Note: IMR Press stays neutral with regard to jurisdictional claims in published maps and institutional affiliations.