


 , Anna Dorofeeva 1, Julia Samoylenko 1, Ksenia Kobzeva 1, Olga Bushueva 1,3,*
1 Laboratory of Genomic Research, Research Institute for Genetic and Molecular Epidemiology, Kursk State Medical University, 305041 Kursk, Russia
2 Department of Obstetrics and Gynecology, Institute of Continuing Education, Kursk State Medical University, 305041 Kursk, Russia
3 Department of Biology, Medical Genetics and Ecology, Kursk State Medical University, 305041 Kursk, Russia
Abstract
Uterine fibroids (UFs) are the most common benign tumors in women of reproductive age and are frequently associated with impaired fertility, reproductive dysfunction, and pregnancy complications. Arterial hypertension (AH) is another prevalent chronic condition in women, while increasing epidemiological evidence demonstrates the existence of a bidirectional relationship between UFs and AH. However, the genetic mechanisms underlying this association remain unclear. We hypothesized that UF-associated loci identified in genome-wide association studies (GWAS) may contribute to AH susceptibility.
Genomic DNA from 606 hospitalized patients with UFs (n = 178 with comorbid AH; n = 428 AH-free) underwent allele-specific PCR amplification targeting 17 common GWAS-derived polymorphisms.
The rs1812266 (LOC105375949) locus was associated with a reduced risk of AH (odds ratio (OR) = 0.74; p = 0.028). Model-based multivariate dimensionality reduction (MB-MDR) analysis revealed significant gene–gene interactions (pperm ≤ 0.05) involving UF loci and AH risk, including five key variants (rs66998222, LOC102723323; rs2456181, ZNF346; rs1812266, LOC105375949; rs10929757, GREB1; rs7986407, FOXO1) appearing in multiple models. Notably, rs66998222 was observed in five models, suggesting this residue possesses a central role. For gene–environment interactions, five variants, rs66998222, LOC102723323; rs1812266, LOC105375949; rs10929757, GREB1; rs2456181, ZNF346; rs2553772, LOC105376626, appeared in multiple models, with the smoking × rs66998222 interaction being central to five models. These six risk variants subsequently underwent systematic functional annotation to characterize the potential associated biological roles. Bioinformatics analysis indicated that single nucleotide polymorphisms (SNPs) associated with oxidative stress, renin–angiotensin–aldosterone system (RAAS) function, tissue fibrosis, angiogenesis, and smooth muscle cell remodeling are common mechanisms in both UFs and AH. Cis-eQTL genes and transcription factor (TF)-linked biological processes mediate these mechanisms. Validation using the Cardiovascular Disease Knowledge Portal confirmed the relevance of several SNPs to blood pressure traits.
To our knowledge, this is the first study to explore the genetic overlap between UFs and AH, providing novel molecular evidence for shared pathophysiological pathways. Our findings support the concept of a common genetic predisposition underlying both conditions and may inform new directions for integrated reproductive and cardiovascular health strategies.
Keywords
- uterine fibroids
- hypertension
- genome wide association studies
- single nucleotide polymorphism
Uterine fibroids (UF) and arterial hypertension (AH) are highly prevalent conditions that exert a considerable impact on the health of women during both reproductive and postmenopausal periods [1]. UF is recognized as one of the most common benign tumors affecting women of reproductive age. According to epidemiological data, the prevalence of uterine fibroids reaches approximately 70–80%, with clinically significant symptoms observed in about 20–50% of affected individuals [2, 3]. This condition is associated with a wide range of adverse outcomes, including abnormal uterine bleeding, anemia, chronic pelvic pain, reproductive dysfunction, infertility, and pregnancy-related complications [4, 5]. Similarly, arterial hypertension remains one of the most widespread chronic disorders, affecting an estimated 28.5–31.1% of the global adult population [6].
AH has been frequently identified as a potential risk factor for the development of UF [7]. Moreover, growing evidence suggests a possible bidirectional relationship, indicating that UF itself may contribute to an increased risk of hypertensive disorders. Several studies have shown that the presence of UF is associated with a 1.44- to 1.88-fold higher risk of developing hypertension [8, 9], as well as hypertensive complications during pregnancy, such as preeclampsia [10, 11].
Despite the accumulating clinical and epidemiological data supporting an association between these conditions, the genetic underpinnings of this relationship remain largely unexplored. In recent decades, genome-wide association studies (GWAS) have emerged as a powerful approach for identifying genetic loci associated with susceptibility to various complex diseases [12]. In the context of UF, GWAS have successfully identified multiple genetic variants linked to increased disease risk [13, 14, 15, 16]. Similarly, GWAS have also revealed numerous loci implicated in the pathogenesis of AH [17, 18].
However, to date, no studies have specifically addressed whether genetic loci associated with UF risk may also influence the development of AH.
The study cohort consisted of 606 unrelated UF patients from Central Russia, including 178 hospitalized individuals with comorbid arterial hypertension and 428 normotensive controls. The Ethical Review Committee of Kursk State Medical University approved the study protocol (protocol No 5 from May 11, 2021), and all participants provided written informed consent. The study was carried out in accordance with the guidelines of the Declaration of Helsinki. The inclusion criteria for the study required participants to have self-declared Russian ancestry and to have been born in Central Russia. Table 1 provides the baseline and clinical characteristics of the study cohort.
| Baseline сharacteristics of the study cohort | Patients with uterine fibroid (N = 606) | p-value | ||
| With arterial hypertension | Without arterial hypertension | |||
| (N = 178; 29.4%) | (N = 428; 70.6%) | |||
| Age | Ме [Q1; Q3], N | 51 [48; 57], 178 | 47 [42; 50], 428 | |
| BMI | Ме [Q1; Q3], N | 30.2 [27; 34], 102 | 26.3 [23; 29.8], 178 | |
| Smoking | Yes, N (%) | 22 (12.4%) | 68 (15.9%) | |
| No, N (%) | 156 (87.6%) | 360 (84.1%) | ||
| ND, N (%) | - | - | ||
| Age of UF diagnosis | Ме [Q1; Q3], N | 43 [38; 46], 133 | 40 [35; 44], 332 | |
| Multiple form of UF | Yes, N (%) | 85 (47.8%) | 231 (54%) | |
| No, N (%) | 63 (35.4%) | 141 (32.9%) | ||
| ND, N (%) | 30 (16.9%) | 56 (13.1%) | ||
Note: Me, median; Q1, the first quartile; Q3, the third quartile; ND, no data; BMI, body mass index; UF, uterine fibroids; differences that are statistically significant are indicated in bold.
The patients were enrolled in the study with ultrasound-verified UF from 2021 to 2023 at two tertiary care facilities (Perinatal Centre and Kursk City Maternity Hospital).
Patients with AH were selected from those with clinically confirmed systolic
blood pressure
Cigarette smoking has been conclusively linked to hypertension pathogenesis through its dual-phase impact on endothelial function and vascular tone regulation. Nicotine induces sympathetic nervous system activation, leading to vasoconstriction and increased blood pressure, while long-term exposure contributes to endothelial dysfunction and arterial stiffness [6, 18].
The selection of genetic variants for this study was performed in two consecutive stages. In the initial stage, candidate single nucleotide polymorphisms (SNPs) were identified from the database - GWAS Catalog (https://www.ebi.ac.uk/gwas/; accessed March 14, 2024), which at that time contained 238 SNPs across 169 loci associated with uterine fibroid susceptibility based on 22 genome-wide association studies. Priority was given to SNPs that showed consistent associations with uterine fibroid risk in at least two independent studies of European populations. We excluded variants with minor allele frequencies below 0.05 and those that presented technical challenges for TaqMan probe design due to high GC content, GC clamps, or extended homopolymeric sequences. This initial screening process yielded seven candidate SNPs: rs72709458 (TERT), rs58415480 (SYNE1), rs7907606 (STN1/SLK), rs547025 (SIRT3), rs117245733 (LINC00598), rs7986407 (FOXO1) and rs2456181 (ZNF346). The second stage of SNP selection utilized the Reproductive System Knowledge Portal (https://reproductive.hugeamp.org/; accessed October 10, 2024), which provides comprehensive GWAS meta-analysis data for reproductive disorders. Using the search term “uterine fibroids”, we identified additional candidate SNPs while applying the same exclusion criteria regarding minor allele frequency and technical feasibility of genotyping using fluorescent probes. This secondary analysis contributed ten additional SNPs to our study: rs66998222 (LOC102723323), rs59760198 (DNM3), rs10929757 (GREB1), rs9419958 (STN1), rs1812266 (LOC105375949), rs1986649 (FOXO1), rs641760 (PITPNM2), rs2235529 (WNT4), rs2553772 (LOC105376626), and rs11031731 (THEM7P/WT1). The combined selection process resulted in a final set of 17 SNPs that met our criteria for both established association with uterine fibroids and technical suitability for genotyping analysis. This two-phase approach allowed us to comprehensively capture genetic variants of potential importance in uterine fibroid pathogenesis while ensuring methodological robustness in our subsequent analyses.
Genotyping procedures were conducted at the Laboratory of Genomic Research, Research Institute for Genetic and Molecular Epidemiology, Kursk State Medical University (Kursk, Russia). Venous blood samples (up to 5 mL) were collected from the cubital vein of each participant and stored in EDTA-coated tubes at –20 °C until processing. Genomic DNA was extracted using standard protocols, including phenol/chloroform extraction and ethanol precipitation, and its purity, quality, and concentration were assessed using a NanoDrop spectrophotometer (Thermo Fisher Scientific, Waltham, MA, USA).
Allele-specific real-time PCR assays, developed in-house, were used for
genotyping. Primer and probe sequences were designed using Primer3web software
(version 4.1.0, ELIXIR, Cambridge, MA, USA) [20]. PCR amplification was carried
out in 25 µL reaction mixtures containing 1.5 units of Hot Start Taq DNA
polymerase (Biolabmix, Novosibirsk, Russia), approximately 10 ng of DNA, and the
following reagent concentrations: 0.25 µM of each primer; 0.1 µM of
each probe; 250 µM of each dNTP; and varying MgCl2 concentrations: 4
mM for rs59760198, 3 mM for rs117245733, rs547025, rs10929757, rs9419958,
rs1812266, rs1986649, rs2553772 and rs11031731, 3.5 mM for rs2456181, rs7907606,
rs641760 and rs2235529, 2.5 mM for rs7986407, rs58415480 and rs72709458, and 1.5
mM for rs66998222. The PCR buffer (1
The analysis of statistical data was performed using the STATISTICA software (version 13.3, StatSoft, Santa Clara, CA, USA). To assess the normality of the data distribution, the Shapiro-Wilk test was utilized. As most quantitative variables did not follow a normal distribution, the results were expressed as medians (Me) along with their corresponding interquartile ranges [Q1–Q3]. For comparing quantitative variables between two independent groups, the Mann-Whitney U test was applied. Differences in categorical variables were evaluated using Pearson’s chi-squared test, with Yates’ correction for continuity when appropriate.
The Hardy-Weinberg equilibrium for genotype distributions was tested using Fisher’s exact test. The SNPStats web-based platform (https://www.snpstats.net/start.htm, accessed on February 7, 2025) was employed to perform logistic regression analyses examining potential correlations between genotype distributions and AH susceptibility. This analysis followed an additive genetic model and was adjusted for confounding factors, including age, body mass index (BMI) and age of UF diagnosis. To account for the influence of risk factors on genetic marker associations, separate analyses were performed for individuals with and without exposure to these factors.
The AH patient cohort and control group met the required power criteria of 80%, as calculated using the online GAS Power Calculator [21]. Analyses employed a multiplicative model with a significance level of 0.05. Given an AH prevalence of 0.08 in Central Russia and minor allele frequencies ranging from 0.07 to 0.49, the sample sizes of AH patients (n = 180) and controls (n = 430) provided sufficient power to detect intergroup differences in minor allele frequencies at OR between 1.39 and 1.8.
The analysis utilizing the model-based multivariate dimensionality reduction
(MB-MDR) method investigated combinations of genotypes at two, three, and four
levels, assessing both gene-gene (G
All statistical analyses were performed using R version 3.6.3 (R Foundation for
Statistical Computing, Vienna, Austria). For every interaction tier, we retained
the top three to four models exhibiting maximal Wald statistics and minimal
p-values for subsequent evaluation. The MB-MDR method also enabled the
identification of specific genotype combinations significantly associated with
the studied phenotypes (p
To explore the functional implications of the studied SNPs, several bioinformatics tools described in details in our previews studies [24] were employed:
• The GTEx Portal (http://www.gtexportal.org/, accessed on February 13, 2025) was used to analyze SNP associations with expression quantitative trait loci (eQTLs) in various tissues, including heart, vessels and blood [25].
• eQTLGen (https://www.eqtlgen.org/, accessed on February 13, 2025) provided additional data on SNP-eQTL relationships, particularly in peripheral blood samples.
• HaploReg v4.2 (https://pubs.broadinstitute.org/mammals/haploreg/haploreg.php, accessed on February 13, 2025) was utilized to examine SNP locations within regulatory elements, such as DNase hypersensitive regions, and their links to histone modifications.
• The atSNP Function Prediction tool (http://atsnp.biostat.wisc.edu/search, accessed on February 13, 2025) assessed how SNP variations affected transcription factor binding affinity based on reference and alternative alleles [26].
• Gene Ontology (http://geneontology.org/, accessed on February 13, 2025) was applied to identify biological processes enriched among transcription factors associated with the studied SNPs, connecting these processes to AH pathogenesis [27].
• The Cardiovascular Disease Knowledge Portal (CVDKP) (https://cvd.hugeamp.org/, accessed on February 13, 2025) integrated genetic association data, offering insights into SNP relationships with AH and related phenotypes, such as isolated increased systolic or diastolic blood pressure [28].
The integration of these bioinformatics tools provided a comprehensive understanding of the functional roles of the SNPs, their interactions with environmental risk factors, and their contributions to the molecular mechanisms underlying AH pathogenesis. This approach combined genetic, environmental, and computational analyses to uncover intricate patterns of disease susceptibility.
Significant inverse association with AH risk was observed for rs1812266 effect allele C (LOC105375949) in the combined analysis (OR = 0.74, 95% CI = 0.57–0.97, p = 0.028) (Table 2).
| Genetic variant | Effect allele | Other allele | N | OR1 (95% CI) | p2 |
| rs117245733 LINC00598 | A | G | 654 | 0.93 (0.38–2.26) | 0.87 |
| rs547025 SIRT3 | C | T | 654 | 0.95 (0.56–1.62) | 0.86 |
| rs2456181 ZNF346 | C | G | 653 | 1.14 (0.89–1.46) | 0.31 |
| rs7907606 STN1, SLK | G | T | 654 | 1.06 (0.77–1.45) | 0.73 |
| rs58415480 SYNE1 | G | C | 654 | 0.87 (0.62–1.23) | 0.43 |
| rs7986407 FOXO1 | G | A | 653 | 0.97 (0.73–1.27) | 0.81 |
| rs72709458 TERT | T | C | 653 | 0.95 (0.69–1.30) | 0.73 |
| rs66998222 LOC102723323 | A | G | 654 | 1.23 (0.92–1.65) | 0.17 |
| rs59760198 DNM3 | T | C | 650 | 1.17 (0.89–1.54) | 0.27 |
| rs10929757 GREB1 | A | C | 653 | 0.78 (0.59–1.02) | 0.067 |
| rs9419958 STN1 | T | C | 654 | 1.11 (0.80–1.55) | 0.52 |
| rs1812266 LOC105375949 | С | G | 654 | 0.74 (0.57–0.97) | 0.028 |
| rs1986649 FOXO1 | T | C | 654 | 1.20 (0.87–1.67) | 0.27 |
| rs641760 PITPNM2 | T | C | 652 | 0.88 (0.62–1.23) | 0.44 |
| rs2235529 WNT4 | T | C | 651 | 0.98 (0.68–1.42) | 0.92 |
| rs2553772 LOC105376626 | T | G | 653 | 1.11 (0.86–1.44) | 0.43 |
| rs11031731 THEM7P, WT1 | A | G | 654 | 1.14 (0.80–1.63) | 0.46 |
Note: All statistical models used the minor allele as reference and controlled
for age, BMI and age of UF diagnosis. Data show: 1 adjusted odds ratios with
95% CIs; 2 significance values. Bold indicates p
The MB-MDR analysis identified seven statistically significant intergenic
interaction models (pperm
| Gene-gene interaction models | NH | WH | NL | WL | Wmax | pperm | |||
| The best 2-locus models of gene-gene interactions (for models with pmin. | |||||||||
| rs66998222 LOC102723323 |
1 | 0.2311 | 12.12 | 1 | –0.0886 | 4.527 | 12.12 | 0.016 | |
| rs1812266 LOC105375949 |
2 | 0.1426 | 11.19 | 1 | –0.0958 | 5.539 | 11.19 | 0.028 | |
| The best 3-locus models of gene-gene interactions (for models with pmin. | |||||||||
| rs11031731 THEM7P, WT1 |
4 | 0.2155 | 22.75 | 0 | NA | NA | 22.75 | 0.003 | |
| rs2553772 LOC105376626 |
3 | 0.4620 | 22.04 | 1 | –0.2773 | 3.706 | 22.04 | 0.015 | |
| rs10929757 GREB1 |
4 | 0.2550 | 21.06 | 1 | –0.1211 | 4.361 | 21.06 | 0.016 | |
| The best 4-locus models of gene-gene interactions (for models with pmin. | |||||||||
| rs1986649 FOXO1 |
9 | 0.3933 | 46.10 | 2 | –0.2344 | 7.151 | 46.10 | 0.001 | |
| rs1812266 LOC105375949 |
8 | 0.4001 | 45.42 | 2 | –0.1800 | 6.984 | 45.42 | 0.002 | |
Note: MB-MDR, model-based multivariate dimensionality reduction; NH, the number
of interacting high-risk genotypes;
The MDR method revealed several key findings (Fig. 1). First, the genetic variants included in the most significant gene-gene interaction models were predominantly characterized by antagonistic and additive effects, with the exception of SNPs rs2456181 ZNF346 and rs10929757 GREB1, which demonstrated pronounced synergistic interactions. Second, the most notable individual effect was observed for rs66998222 LOC102723323, contributing 1.01% to the trait entropy associated with AH. Third, the individual (main) effects of the genetic variants involved in the top gene-gene interaction models (ranging from 0.38% to 1.01% of AH entropy contribution) were comparable to the effects of gene-gene interactions (0.06% to 0.64% of AH entropy contribution).
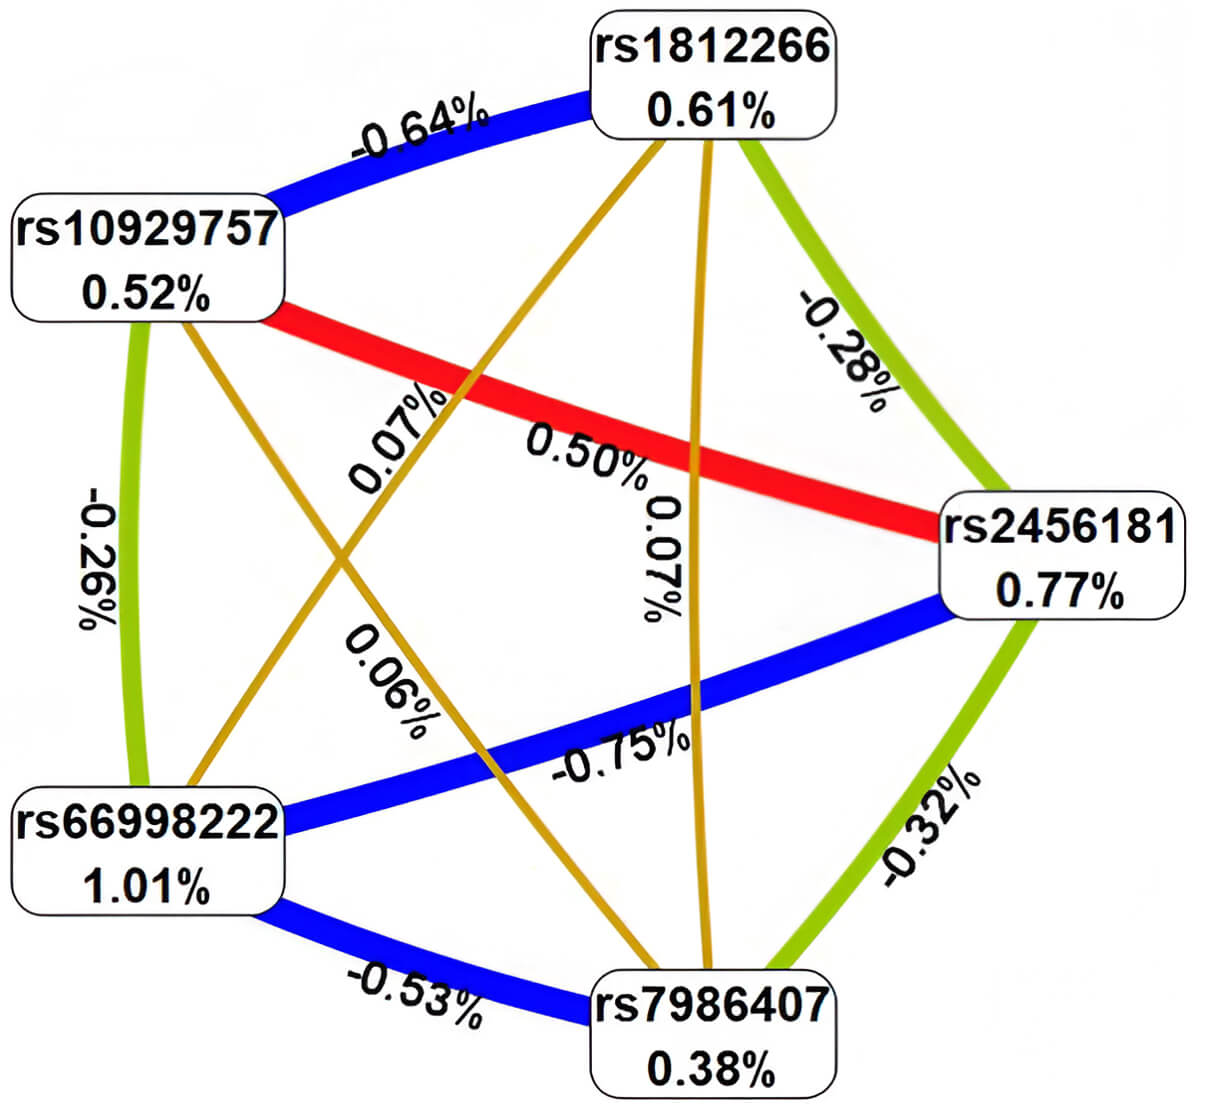 Fig. 1.
Architecture of significant epistatic gene-gene networks in AH pathogenesis. Color coding: red = strongly synergistic, brown = additive interactions, green = moderate antagonistic, blue = pronounced antagonistic. Line thickness scales with effect magnitude (% entropy contribution).
Fourth, the strongest associations with AH were identified for the following
genotype combinations of the polymorphic gene variants: rs66998222
LOC102723323 (A/G)
Using the MB-MDR approach, seven most significant gene–environment interaction
models associated with AH were identified, including one two-level, three
three-level, and three four-level interaction models (Table 4). In total, six
genetic variants were involved in the top SNP–smoking interaction models, with
five of them—rs66998222 (LOC102723323), rs1812266
(LOC105375949), rs10929757 (GREB1), rs2456181
(ZNF346), and rs2553772 (LOC105376626)—appearing in two or
more of the most significant G
| Gene-gene interaction models | NH | WH | NL | WL | Wmax | pperm | |||
| The best two-order models of gene-smoking interactions (for G | |||||||||
| SMOKE |
1 | 0.1353 | 9.40 | 1 | –0.07 | 3.071 | 9.395 | 0.022 | |
| The best three-order models of gene- interactions (for G | |||||||||
| SMOKE |
2 | 0.1854 | 15.35 | 1 | –0.165 | 2.779 | 15.35 | 0.028 | |
| SMOKE |
3 | 0.1636 | 14.49 | 2 | –0.138 | 6.883 | 14.49 | 0.03 | |
| SMOKE |
2 | 0.1758 | 13.35 | 2 | –0.137 | 8.545 | 13.35 | 0.032 | |
| The best four-order models of gene- interactions (for G | |||||||||
| SMOKE |
4 | 0.3465 | 31.49 | 1 | –0.235 | 3.881 | 31.49 | 0.005 | |
| SMOKE |
5 | 0.2809 | 30.11 | 1 | –0.299 | 2.972 | 30.11 | 0.009 | |
| SMOKE |
4 | 0.5388 | 29.79 | 1 | –0.297 | 3.363 | 29.79 | 0.013 | |
Abbreviations: SMOKE, Smoking; NH, number of high-risk genotype interactions;
In the next stage of the analysis, interactions between these genetic variants and risk factors were further evaluated using Multifactor Dimensionality Reduction (MDR) modeling (Fig. 2). First, MDR analysis demonstrated that smoking, as an environmental risk factor, exhibited the weakest individual effect, contributing only 0.15% to AH-related entropy, which is considerably lower compared to the individual effects of SNPs (ranging from 0.52% to 1.01%). Second, smoking displayed heterogeneous interaction patterns with the genetic variants involved in the top gene–environment interaction models: a moderate synergistic effect in interaction with rs10929757 (GREB1), a moderate antagonistic effect with rs2456181 (ZNF346), and additive effects with rs66998222 (LOC102723323) and rs1812266 (LOC105375949).
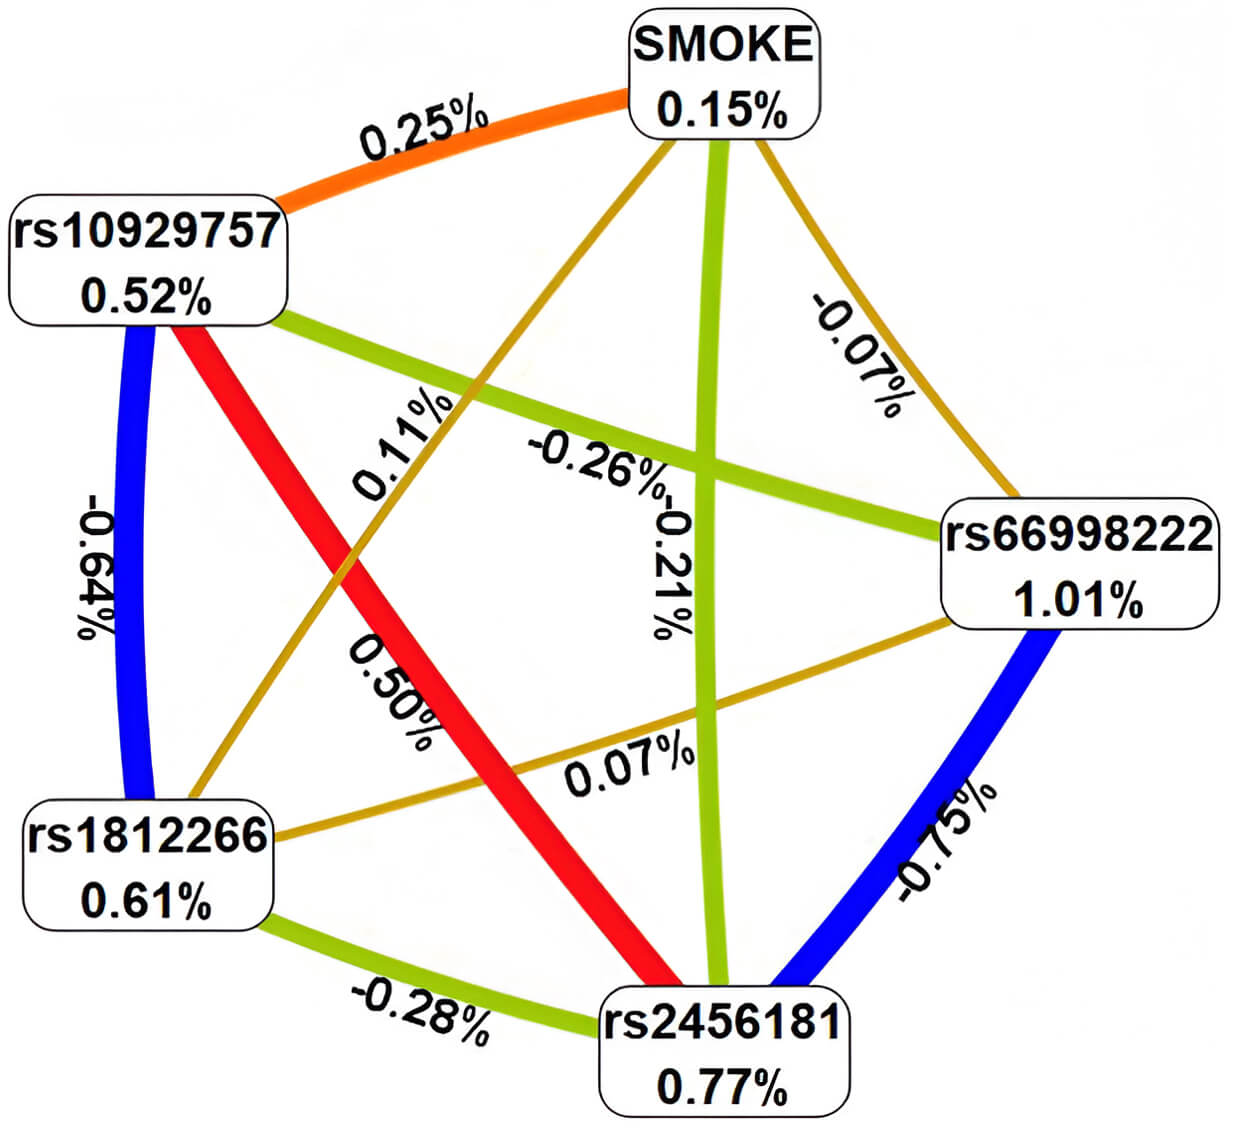 Fig. 2.
Architecture of significant G
Third, the strongest associations with AH were observed for the following
gene–environment interaction combinations: no smoking
Our integrated analysis of genetic variants, epistatic interactions, and gene-environment effects revealed significant associations between arterial hypertension and six UF-associated GWAS loci: rs2456181 ZNF346, rs7986407 FOXO1, rs66998222 LOC102723323, rs10929757 GREB1, rs1812266 LOC105375949 and rs2553772 LOC105376626. These risk variants subsequently underwent systematic functional annotation to characterize their potential biological roles.
The results of the cis-eQTL analysis (Table 5), shed light on the impact of specific genetic variants on gene expression. According to the GTEx Portal, rs2456181 ZNF346 increases expression of FGFR4 and UIMC1 in blood and arteries, and also increases UIMC1 in heart. In the same time rs2456181 ZNF346 increases expression itself in arteries. SNP rs7986407 FOXO1 increases expression of ENSG00000287837 in blood, arteries and heart and SNP decreases expression of SLC25A15 in arteries and heart. And, lastly, SNP rs2553772 LOC105376626 increases expression of CD44 and ENSG00000255521 in arteries; and SNP decreases ENSG00000289526 in blood and APIP in heart.
| Genetic variant | Expressed gene | p | Effect (NES) | Tissue | Symbol | Z-score | FDR |
| GTEx Portal | eQTLGene | ||||||
| rs2456181 ZNF346(C/G) | FGFR4 | 1.9 |
0.27 | Whole Blood | UIMC1 | 34.953 | 0 |
| FGFR4 | 9.7 |
0.27 | Artery - Tibial | FGFR4 | 13.916 | 0 | |
| UIMC1 | 6.4 |
0.10 | Artery - Tibial | ZNF346-IT1 | –4.477 | 0.02 | |
| FGFR4 | 9.6 |
0.23 | Artery - Aorta | HK3 | 4.279 | 0.047 | |
| UIMC1 | 1.2 |
0.074 | Whole Blood | ||||
| UIMC1 | 6.2 |
0.12 | Heart - Atrial Appendage | ||||
| ZNF346 | 2.3 |
0.13 | Artery - Tibial | ||||
| rs7986407 FOXO1 (A/G) | SLC25A15 | 2.5 |
–0.27 | Artery - Tibial | MRPS31 | –13.189 | 0 |
| ENSG00000287837 | 7.4 |
0.25 | Artery - Tibial | WBP4 | 7.614 | 0 | |
| ENSG00000287837 | 1.1 |
0.24 | Whole Blood | SLC25A15 | –5.603 | 0.0001 | |
| ENSG00000287837 | 4.9 |
0.27 | Artery - Aorta | FOXO1 | 5.526 | 0.0001 | |
| SLC25A15 | 5.0 |
–0.17 | Heart - Left Ventricle | KBTBD7 | –4.391 | 0.029 | |
| ENSG00000287837 | 1.2 |
0.21 | Heart - Atrial Appendage | ||||
| ENSG00000287837 | 6.8 |
0.20 | Heart - Left Ventricle | ||||
| SLC25A15 | 0.8 |
–0.18 | Heart - Atrial Appendage | ||||
| SLC25A15 | 1.4 |
–0.22 | Artery - Aorta | ||||
| rs2553772 LOC105376626 (G/T) | CD44 | 5.3 |
0.28 | Artery - Tibial | RP1-68D18.4 | –5.205 | 0.001 |
| CD44 | 9.2 |
0.22 | Artery - Aorta | CD44 | 4.609 | 0.011 | |
| ENSG00000255521 | 1.3 |
0.24 | Artery - Tibial | ||||
| CD44 | 1.7 |
0.18 | Artery - Coronary | ||||
| ENSG00000289526 | 4.1 |
–0.17 | Whole Blood | ||||
| APIP | 0.1 |
–0.27 | Heart - Atrial Appendage | ||||
Effect alleles appear in bold. Key terms: eQTL, expression quantitative trait loci; NES, normalized effect size; FDR, false discovery rate.
The eQTLGen Browser data further demonstrated significant expression quantitative trait loci associations in blood samples. The rs2456181 variant in ZNF346 was associated with decreased expression of ZNF346-IT1 alongside increased expression levels of UIMC1, FGFR4, and HK3. Similarly, rs7986407 in FOXO1 showed correlations with reduced MRPS31, SLC25A15, and KBTBD7 expression, while exhibiting elevated expression of WBP4 and FOXO1 itself. Finally, the rs2553772 polymorphism in LOC105376626 displayed positive associations with CD44 expression but negative correlations with RP1-68D18.4 levels (Table 5).
The analysis of transcription factors revealed that the SNP allele G rs2456181
ZNF346 creates DNA binding sites for 45 TFs, co-controlling response to
interleukin-9-mediated signaling pathway (GO:0038113; false discovery rate (FDR)
= 1.04
The ref allele A rs7986407 FOXO1 creates DNA binding sites for 37 TFs,
co-controlling response to peroxisome proliferator activated receptor signaling
pathway (GO:0035357; FDR = 1.06
The analysis of transcription factors revealed that the SNP allele A rs66998222
LOC102723323 creates DNA binding sites for 28 TFs, co-controlling
cellular response to cytokine stimulus (GO:0071345; FDR = 1.07
SNP allele C rs10929757 GREB1 creates DNA binding sites for 44 TFs,
co-controlling response to cardiac chamber formation (GO:0003207; FDR = 2.21
The SNP allele C rs1812266 LOC105375949 creates DNA binding sites for
29 TFs, co-controlling response to interleukin-4-mediated signaling pathway
(GO:0035771; FDR = 5.94
SNP allele G rs2553772 LOC105376626 creates DNA binding sites for 20
TFs, jointly involved in positive regulation of cholesterol biosynthetic process
(GO:0045542; FDR = 3.67
Epigenetic profiling using HaploReg v4.2 revealed characteristic histone modification patterns at AH-associated risk loci. The SNPs rs2456181 (ZNF346), rs7986407 (FOXO1), rs10929757 (GREB1), and rs2553772 (LOC105376626) consistently showed active chromatin marks in blood and cardiac tissue, including H3K4me1 (histone H3 lysine 4 mono-methylation), H3K27ac (lysine 27 acetylation), and H3K9ac (lysine 9 acetylation). Notably, rs2456181, rs7986407, and rs2553772 additionally demonstrated similar regulatory histone signatures in vascular tissues (Supplementary Table 9).
The Cardiovascular Disease Knowledge Portal confirms that two GWAS-significant variants identified in our study—rs2456181 ZNF346 and rs1812266 LOC105375949—demonstrate established associations with elevated arterial hypertension risk in prior research, corroborating our findings. Moreover, rs2456181 ZNF346 increases and rs66998222 LOC102723323 decreases systolic blood pressure. Also, rs7986407 FOXO1 increases and rs66998222 LOC102723323 decreases diastolic blood pressure (Supplementary Table 10).
Studies have demonstrated that UF is associated with a 1.44- to 1.88-fold increased risk of AH [8, 9], as well as with a higher likelihood of hypertensive pregnancy disorders, including preeclampsia [10, 11]. Conversely, an elevated risk of UF has also been reported among individuals with AH [7].
Both conditions share common pathophysiological features involving alterations in smooth muscle cells (SMCs). In UF, changes occur in both the myometrial tissue and vascular SMCs, whereas AH is also characterized by profound structural and functional changes in vascular SMCs [29]. According to recent findings, patients with UF exhibit alterations in arteriolar architecture, including mitochondrial and endoplasmic reticulum stress, as well as myocyte migration, which may potentially influence blood pressure regulation [30].
It is well established that components involved in blood pressure regulation, such as the renin-angiotensin-aldosterone system (RAAS) [31], may influence the risk of UF development through mechanisms associated with inflammation, cellular proliferation, angiogenesis, and fibrosis [32, 33]. These processes represent common pathogenic pathways linking UF and AH [34, 35].
Moreover, alterations in estrogen levels, which play a critical role in the pathogenesis of UF [36, 37, 38, 39], are also involved in the regulation of postmenopausal vasomotor symptoms, including blood pressure modulation [40].
Given these shared pathophysiological mechanisms and accumulating clinical evidence supporting the association between UF and AH, it is plausible to assume that these two conditions are not only interrelated but may also mutually exacerbate each other.
In our study, we first evaluated the association between 17 confirmed GWAS loci associated with UF and the risk of AH. We found that rs1812266 (LOC105375949 G/C) was associated with a decreased risk of AH (OR = 0.74, 95% CI = 0.57–0.97, p = 0.028). Our findings are supported by bioinformatics data from the Cardiovascular Disease Knowledge Portal (CVDKP), which aggregates data from meta-analyses of GWAS studies worldwide. According to CVDKP, six studies showed an association between rs1812266 (LOC105375949 G/C) and a decreased risk of AH (Supplementary Table 11).
Bioinformatics analysis revealed that the C allele of the SNP, which showed protective effects regarding AH risk in our study, generates binding sites for transcription factors (TFs) involved in the regulation of processes such as «interleukin-4-mediated signaling pathway», which plays a key role in suppressing pro-inflammatory responses, reducing vascular damage, and improving vascular function [41]. Additionally, the C allele is involved in the JAK-STAT pathway, activated by growth hormone or cytokine receptors (e.g., IL-6, Angiotensin II). The pathway regulates cardiomyocyte hypertrophy and inflammatory processes, suggesting their role in cardiovascular pathology risk, including AH [42, 43]. Moreover, the C allele of this SNP regulates “SMAD protein signal transduction” which reduces fibrotic damage in vascular SMCs [44].
Furthermore, our study demonstrated that UF-GWAS significant loci, such as rs2456181 (ZNF346), rs7986407 (FOXO1), rs66998222 (LOC102723323), rs10929757 (GREB1), and rs2553772 (LOC105376626), were involved in the most significant gene–gene interactions associated with the development of AH.
Functional annotation revealed that rs2456181 ZNF346, through cis-eQTL effects, influences the expression of several genes involved in the regulation of cardiovascular system function. Specifically, rs2456181 increases the expression of genes such as FGFR4, UIMC1, and HK3 in blood, arteries, and the heart, while concurrently reducing the expression of ZNF346-IT1. The FGFR4 gene (fibroblast growth factor receptor 4) is involved in cell proliferation and angiogenesis, and its increased expression can contribute to vascular dysfunction and AH [45, 46]. The UIMC1 gene (ubiquitin interaction motif containing 1) plays a role in the DNA damage response and cell cycle regulation, and is closely associated with menopause [47]. This could impact endothelial function, vascular remodeling, and, ultimately, increase the risk of AH [48]. The HK3 gene (hexokinase 3) is involved in glucose metabolism [49], and its dysregulation may be associated with metabolic disorders, which are often linked to AH [50]. The G allele (major in our case) of rs2456181 forms binding sites for transcription factors that regulate processes are likely connected to the common pathophysiological pathways of UF and AH, such as inflammation, endothelial dysfunction, and vascular remodeling [29, 30]. For instance, IL-9 and IL-17 are pro-inflammatory cytokines that may amplify inflammation and promote the development of AH [51]. Data from the CVDKP confirm that the G allele of rs2456181 is associated with an increased risk of AH and an isolated increase in systolic blood pressure.
The FOXO1 gene (forkhead box O1) regulates the cell cycle, apoptosis, oxidative stress, and vascular homeostasis [52] and may contribute to heart hypertrophy and vascular remodeling, linking it to AH [53]. Functional analysis revealed that rs7986407 (FOXO1), involved in the most significant gene-gene interactions, affects the expression of several genes potentially involved in the development of AH. According to cis-eQTL analysis, rs7986407 reduces the expression of SLC25A15 (mitochondrial ornithine transporter) in arteries and the heart. The SLC25A15 gene plays a role in nitrogen metabolism and mitochondrial function [54, 55], and its reduced expression may be associated with disturbances in energy metabolism and oxidative stress, which are characteristic of AH [56, 57, 58, 59]. Furthermore, the locus correlates with decreased expression of MRPS31 (mitochondrial ribosomal protein) and KBTBD7 (a protein involved in ubiquitination), as well as increased expression of WBP4 (Wnt signaling pathway-binding protein). The MRPS31 gene is involved in mitochondrial ribosome biogenesis, and its dysregulation may affect the energy balance of cells [60]. WBP4 gene dysfunction has been linked to the development of neurodevelopmental syndrome with hypotonia as a symptom [61]. KBTBD7 gene has been shown in mice experiments to influence inflammation and dysfunction in the myocardium [62]. According to the CVDKP, the G allele of rs7986407 (FOXO1) is associated with an increase in diastolic blood pressure, confirming its potential role in regulating vascular tone and the risk of AH.
The LOC102723323 gene is a long non-coding RNA (lncRNA) whose function is not fully understood. However, it is known that lncRNAs can play a significant role in regulating gene expression, including genes associated with the cardiovascular system [63]. Functional analysis revealed its potential influence on cytokine pathways and the hypoxia response. The minor SNP allele A (rs66998222 LOC102723323), involved in forming the best gene-gene interaction models, creates binding sites for transcription factors that regulate inflammatory processes, which play a key role in the pathogenesis of AH [51, 64]. According to data from the Cardiovascular Disease Knowledge Portal, the A allele of rs66998222 is associated with a reduction in both systolic and diastolic blood pressure, highlighting its potential protective role in regulating vascular tone.
The GREB1 gene (growth regulation by estrogen in breast cancer 1) is
known for its role in regulating cell proliferation and apoptosis, as well as
being a target of estrogen-dependent signaling, influencing blood pressure [65].
Functional analysis revealed that the A allele (rs10929757 GREB1),
involved in the most significant gene-gene interactions, forms binding sites for
transcription factor “positive regulation of apoptotic process”, a key factor
in vascular wall remodeling [30]. The C allele (SNP rs10929757), on the other
hand, creates binding sites for transcription factors that control the
development of heart compartments, regulation of cytokine production and response
to hypoxia. IL-6 is a key pro-inflammatory cytokine that can contribute to
endothelial dysfunction and vascular inflammation, characteristic of AH [66]. The
response to hypoxia also plays a crucial role in regulating blood pressure
through the activation of HIF-1
According to the cis-eQTL analysis, rs2553772 LOC105376626, also
involved in the most significant gene-gene interactions, increases the expression
of CD44 in arteries and blood, and decreases the expression of
APIP in the heart. The CD44 gene encodes the hyaluronan
receptor and may contribute to the pathogenesis of AH through
endothelial-mesenchymal transition and inflammatory processes [68, 69]. The
APIP gene (adenosine deaminase acting on RNA) is associated with
cardioprotective function [70]. The reference (minor in our case) allele T
(rs2553772) forms binding sites for transcription factors that regulate crucial
processes for maintaining cardiovascular homeostasis and may be linked to the
pathogenesis of AH [51]. The G allele (rs2553772) creates binding sites for
transcription factors controlling SREBP and TGF-
Summarizing the findings above, we conclude that SNPs influence the risk of hypertension by affecting inflammation, response to oxidative stress, RAAS function, tissue fibrosis, angiogenesis, and SMCs remodeling. These effects are mediated through cis-eQTL interactions and biological processes related to transcription factors (Fig. 3).
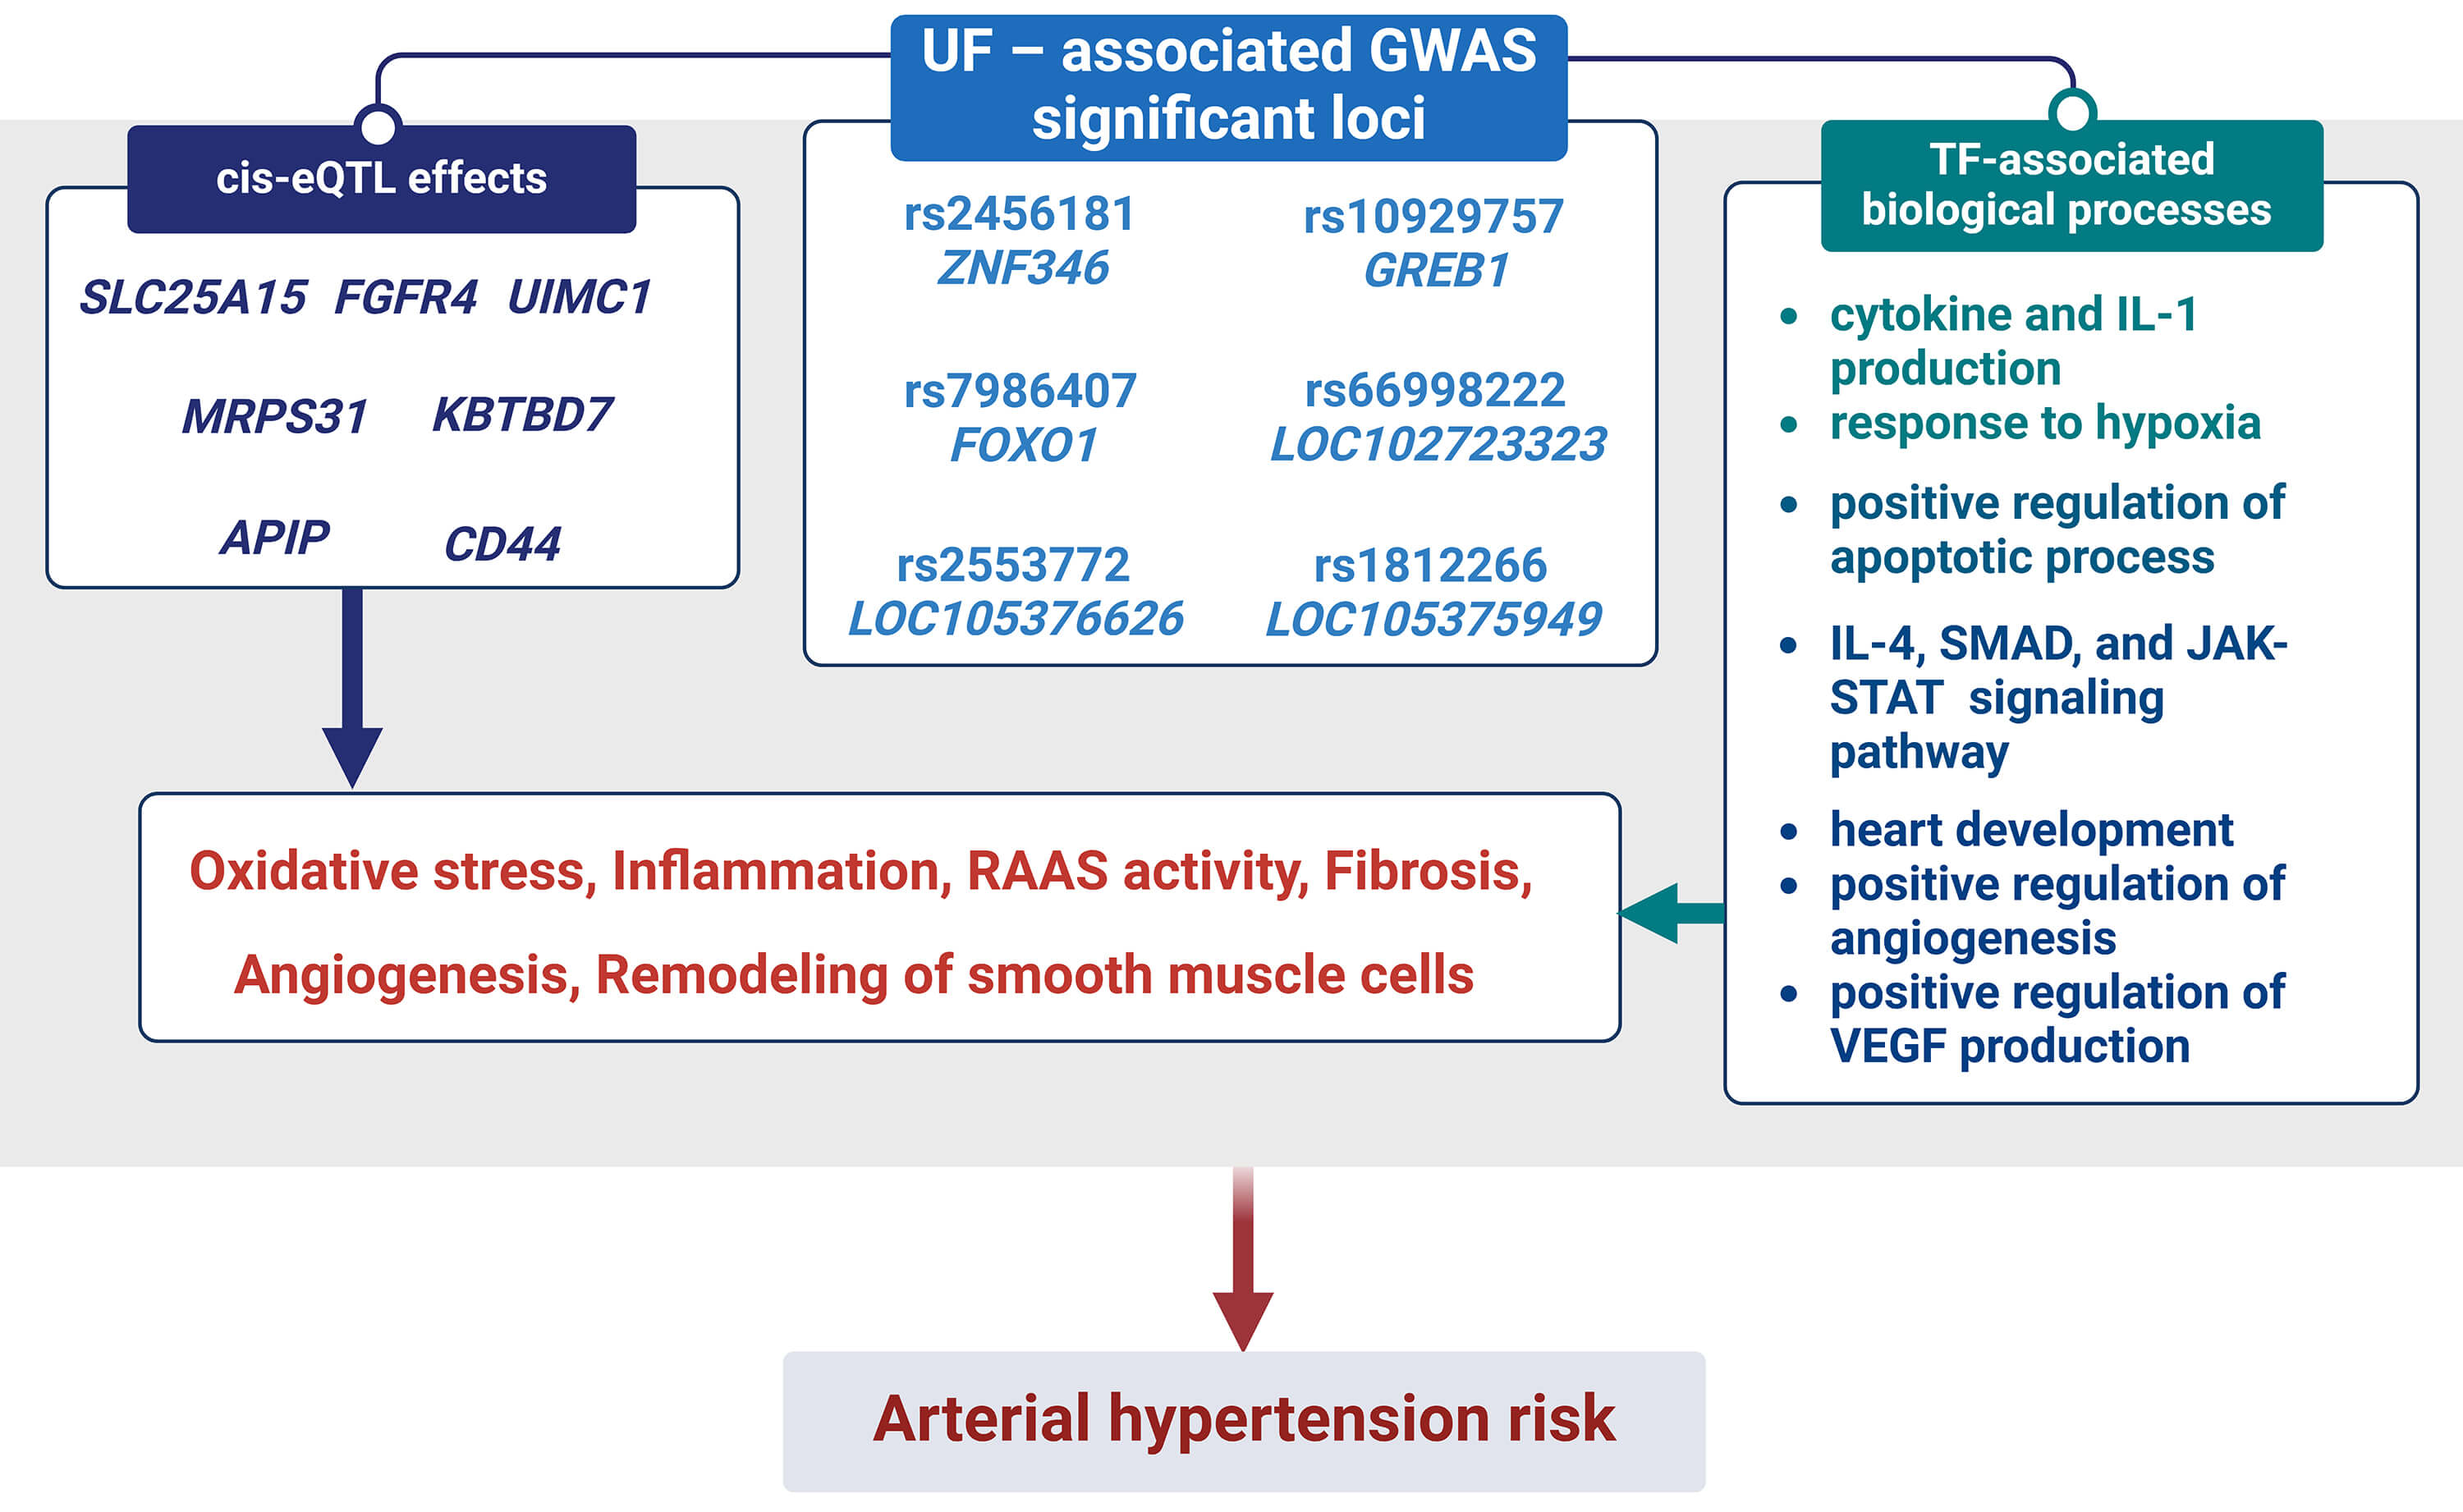 Fig. 3.
The outline of associations UF-GWAS SNPs and AH risk: biological
processes associated with TFs and cis-eQTL effects binding to GWAS SNPs. Notes:
RAAS, renin-angiotensin-aldosterone system; TF, transcription factors; IL,
interleukin; SMAD, a family of proteins that act as signal transducers in the
transforming growth factor beta (TGF-
For the first time, our team analyzed the relationship between GWAS loci of UF and the risk of AH, which allows for a fundamental confirmation of previously identified clinical correlations [7, 8, 9]. The obtained results may be of significant importance for developing new strategies for the prevention and treatment of both UF and AH [29], as well as for understanding the common molecular mechanisms underlying these diseases.
This study has several limitations. First, the number of analyzed SNP markers was restricted, which may have limited the scope of genetic associations identified. Second, the use of TaqMan probe-based genotyping imposed methodological constraints, resulting in the exclusion of certain SNPs due to difficulties in probe design. Third, certain clinical variables were either missing for some participants or characterized by low prevalence, which limited our ability to explore gene–environment interactions and the potential influence of SNPs on specific clinical features of the disease. Finally, the principal limitations of this research involve the modest cohort size and the necessity for validation across different ethnic populations.
The original contributions presented in the study are included in the article/Supplementary Material, further inquiries can be directed to the corresponding author.
OB designed the research study. LP, JS and AD performed the experiments. LP, KK, and OB analyzed the data. LP and OB wrote the manuscript. All authors contributed to editorial changes in the manuscript. All authors read and approved the final manuscript. All authors have participated sufficiently in the work and agreed to be accountable for all aspects of the work.
The research protocol was approved by the Ethics Committee of Kursk State Medical University (protocol number 5, from May 11, 2021). This research complied with all ethical standards outlined in the Declaration of Helsinki and was performed in full adherence to applicable national regulations and institutional policy requirements. All of the participants provided signed informed consent.
Not applicable.
This research received no external funding.
The authors declare no conflict of interest.
In the course of manuscript preparation, the authors employed Microsoft Copilot and DeepL to improve text clarity and check grammar. All outputs generated with these tools were carefully reviewed and revised by the authors, who assume full responsibility for the final content of the publication.
Supplementary material associated with this article can be found, in the online version, at https://doi.org/10.31083/FBS42728.
References
Publisher’s Note: IMR Press stays neutral with regard to jurisdictional claims in published maps and institutional affiliations.