


 , Haibo Liu 1,†, Sungmi Park 1, Michael R. Green 1,‡, Lihua Julie Zhu 1,3,4,*
1 Department of Molecular, Cell and Cancer Biology, University of Massachusetts Chan Medical School, Worcester, MA 01605, USA
2 Regeneration Center, Duke University School of Medicine, Duke University, Durham, NC 27701, USA
3 Department of Molecular Medicine, University of Massachusetts Chan Medical School, Worcester, MA 01605, USA
4 Department of Genomics and Computational Biology, University of Massachusetts Chan Medical School, Worcester, MA 01605, USA
†These authors contributed equally.
‡Deceased February 10, 2023.
Abstract
Alternative cleavage and polyadenylation (APA) is a crucial post-transcriptional gene regulation mechanism that regulates gene expression in eukaryotes by increasing the diversity and complexity of both the transcriptome and proteome. Despite the development of more than a dozen experimental methods over the last decade to identify and quantify APA events, widespread adoption of these methods has been limited by technical, financial, and time constraints. Consequently, APA remains poorly understood in most eukaryotes. However, RNA sequencing (RNA-seq) technology has revolutionized transcriptome profiling and recent studies have shown that RNA-seq data can be leveraged to identify and quantify APA events.
To fully capitalize on the exponentially growing RNA-seq data, we developed InPAS (Identification of Novel alternative PolyAdenylation Sites), an R/Bioconductor package for accurate identification of novel and known cleavage and polyadenylation sites (CPSs), as well as quantification of APA from RNA-seq data of various experimental designs. Compared to other APA analysis tools, InPAS offers several important advantages, including the ability to detect both novel proximal and distal CPSs, to fine tune positions of CPSs using a naïve Bayes classifier based on flanking sequence features, and to identify APA events from RNA-seq data of complex experimental designs using linear models. We benchmarked the performance of InPAS and other leading tools using simulated and experimental RNA-seq data with matched 3′-end RNA-seq data. Our results reveal that InPAS frequently outperforms existing tools in terms of precision, sensitivity, and specificity. Furthermore, we demonstrate its scalability and versatility by applying it to large, diverse RNA-seq datasets.
InPAS is an efficient and robust tool for identifying and quantifying APA events using readily accessible conventional RNA-seq data. Its versatility opens doors to explore APA regulation across diverse eukaryotic systems with various experimental designs. We believe that InPAS will drive APA research forward, deepening our understanding of its role in regulating gene expression, and potentially leading to the discovery of biomarkers or therapeutics for diseases.
Keywords
- InPAS
- alternative polyadenylation
- cleavage and polyadenylation site
- RNA-seq
The maturation of most eukaryotic mRNAs and many long non-coding RNAs (lncRNAs) involves an essential step of cleavage and polyadenylation of transcripts [1, 2, 3, 4, 5]. Interestingly, most eukaryotic genes contain two or more cleavage and polyadenylation sites (CPSs), which are mainly located in 3′ untranslated regions (UTRs), but also occur less frequently in introns or even coding exons [6, 7]. The selective use of these alternative CPSs generates diverse isoforms with different 3′ ends from the same gene locus through a crucial and prevalent post-transcriptional gene regulation mechanism called alternative cleavage and polyadenylation (APA) [8, 9, 10].
In metazoans, the intrinsic strength of a CPS is mainly determined by the exact
sequences and spatial placement of two core cis-elements, termed the
polyadenylation signal (PAS) and the downstream sequence element (DSE) [11, 12].
The PAS is a relatively conserved hexamer, AAUAAA or its close variant, and is
located approximately 25–40 nucleotides upstream of the CPS [11, 13, 14, 15]. By
contrast, the DSE is a variable U-rich or (U+G)-rich motif, and is located 10–40
nucleotides downstream of the CPS [16, 17, 18]. In addition, the CPS strength is
modulated by an auxiliary, often U or G-rich, cis-element that is
located in a
APA can affect gene expression through multiple mechanisms, including alteration of RNA coding potential, as well as RNA stability, localization, and translation efficiency, which can be due to changes in the availability of binding sites for regulators such as microRNAs (miRNAs), long non-coding RNAs (lncRNAs), and RNA-binding proteins on 3′ UTRs [30]. APA is highly tissue/cell type-specific and dynamically modulated [10, 22, 39]. Physiologically regulated APA plays important roles in many cellular processes, including cell homeostasis and differentiation [40, 41]. Conversely, abnormal regulation of APA can result in pathological effects on cells, such as uncontrolled cell proliferation and death [31, 42, 43]. Therefore, APA is implicated in both health and disease [23, 44, 45, 46]. Notably, APA events have been suggested as potential biomarkers for disease diagnosis and prognosis, as well as therapeutic targets [31, 47]. Thus, it is valuable to identify and quantify APA in different cell/tissue types and states, especially APA events related to various diseases.
Over the last decade, more than a dozen experimental methods, collectively called 3′-end RNA sequencing (RNA-seq), have been developed for profiling APA events, including A-seq2 [48], 3′ massive analysis of cDNA ends RNA-sequencing (MACE-seq) [49], and Poly(A)-ClickSeq (PAC-seq) [50] (for a review, see [45, 51]). Application of these methods has yielded valuable insights into the global landscape of APA and has led to many of the aforementioned findings in diverse organisms [15, 29, 52, 53, 54, 55]. However, several issues hinder the widespread adoption of these methods. For instance, some of these methods are incapable of accurately quantifying isoform abundance, while others are expensive, material-demanding, technically challenging, laborious, and/or prone to bias and priming artifacts [2, 45, 56, 57].
In contrast, conventional bulk RNA-seq (hereafter called RNA-seq) approaches [58] have been widely used, resulting in exponential growth of transcriptome profiling data over the last decade [59]. More importantly, RNA-seq data have been shown to contain information for identifying and quantifying APA events [60, 61], leading to the development of over 30 computational tools for mining APA events from RNA-seq data (Additional file 1: Supplementary Table 1) (for reviews, see [51, 62, 63]). However, most of these tools either cannot identify novel APA events or lack sensitivity and specificity in detecting and quantifying novel APA events [63]. In practice, Dynamic analysis of Alternative PolyAdenylation from RNA-seq (DaPars) [64] and its successor DaPars2 [65], Alternative PolyAdenylation trap (APAtrap) [66], and Tool for Alternative Polyadenylation site AnalysiS (TAPAS) [67] are currently considered the leading tools which can detect novel CPSs and quantify APA dynamics (3′ UTR shortening or lengthening) by modelling sudden changes in read coverage along 3′ UTRs [63, 68]. Notably, only DaPars and DaPars2 have been adopted for large-scale APA analysis [64, 65, 69, 70, 71]. These tools vary in input and output formats, core algorithms, functionalities, and performance [51, 63, 68]. For CPS detection and quantitation, APAtrap can handle one sample, or one or two groups of samples, DaPars exactly two groups of samples, and TAPAS individual sample. For differential APA analysis, all the three tools can only handle exactly two groups of samples by performing Fisher’s exact test [64], linear trend test [66], or negative binomial regression [67]. Furthermore, none of the four tools considers sequence features flanking CPSs during CPS detection.
To alleviate the above-mentioned problems of existing tools and meet the demand of large-scale identification and quantification of APA using the large volume of existing and growing RNA-seq data, we developed InPAS (Identification of novel alternative polyadenylation sites), an R/Bioconductor package (https://bioconductor.org/packages/InPAS/). InPAS can efficiently identify both novel proximal and distal CPSs, fine tune positions of CPSs using a machine learning algorithm based on flanking sequence features, and quantify differential APA events from RNA-seq data of various experimental designs, with or without biological replicates. We conducted a comprehensive performance evaluation of InPAS and other leading tools using both simulated and experimental RNA-seq datasets. Our results reveal that InPAS frequently outperforms the other leading tools in terms of sensitivity, precision, and specificity. In addition, we analyzed several datasets from the Gene Expression Omnibus (GEO) database and The Cancer Genome Atlas (TCGA) Program to illustrate the scalability of InPAS in identifying and quantifying APA under physiological and pathological conditions.
InPAS is an open-source R/Bioconductor package for identifying novel proximal and distal CPSs, as well as quantifying APA from RNA-seq data of various experimental designs, using existing 3′ UTR annotations as guide. It is built on top of more than 20 other R/Bioconductor packages, including cleanUpdTSeq [72] for adjusting CPSs via a naïve Bayes classifier based on sequence features flanking CPSs, limma [73] for linear model-based differential APA usage testing, future and batchtools for parallel computing, and RSQLite for managing the metadata and intermediate files.
The InPAS workflow comprises four key steps: (1) extraction of 3′ UTR annotation, (2) manipulation and quality control of coverage data, (3) CPS search, and (4) differential APA analysis, as well as two auxiliary steps: (5) visualization of APA events, and (6) preparation of files for gene set enrichment analysis (GSEA). The key steps are shown in Additional file 2: Supplementary Fig. 1, and the entire workflow is depicted in Additional file 2: Supplementary Fig. 2, while the details on the InPAS algorithms are described in Additional file 3. Extraction of 3′ UTR annotation involves a series of steps including extraction of 3′ UTR annotation from a Gene Transfer Format (GTF) file for a reference genome, removal of any overlaps between 3′ UTRs of transcripts on opposite strands, collapse of 3′ UTRs of the same genes by their start coordinates, and extraction of downstream regions of the resulting 3′ UTRs up to a user-defined length or the nearest boundary of a downstream gene for later de novo CPS search, whichever is satisfied first. The third step, CPS search, is the most computation-intensive step, which is typically performed through four stages: (1) searching for distal CPSs (dCPSs), (2) searching for proximal CPSs (pCPSs), (3) adjusting dCPSs, and (4) adjusting pCPSs. To search for dCPSs, InPAS assesses the change pattern of the normalized merged coverage along each representative 3′ UTR and the associated extended region using a sliding window approach adopted from APAtrap [66]. Subsequently, pCPS search is performed using an optimal segmentation algorithm [74]. If the predicted dCPSs and pCPSs co-localize with annotated CPSs, they are replaced by the annotated CPSs. Otherwise, the predicted dCPSs and pCPSs can be further adjusted using a naïve Bayes classifier such as the one from the cleanUpdTSeqpackage [72]. Using a sliding window method, the classifier scores each base within a user-defined distance from the predicted CPSs based on a set of sequence features, including the occurrence of the core and auxiliary cis-elements. The initially predicted CPSs are replaced by sites of the highest scores as determined by the classifier if the highest score is greater than a user-defined threshold. In practice, users can utilize the classifier from our previously published CleanUpdTSeq package (available at https://www.bioconductor.org/packages/cleanUpdTSeq) for APA analysis of vertebrate RNA-seq data. Alternatively, users have the options to create a species- or clade-specific classifier using CleanUpdTSeq if sufficient polyadenylation data from the species or closely related species is available. Instructions for this are provided in the vignette (accessible at https://www.bioconductor.org/packages/devel/bioc/vignettes/cleanUpdTSeq/inst/doc/cleanUpdTSeq.html). If annotated polyadenylation data for a particular organism is lacking, users can either generate the necessary annotations to train a model or opt to use a classifier from a closely related species. Our published work on CleanUpdTSeq has shown that a classifier trained in zebrafish can be successfully applied to other vertebrates [72].
For each entry of 3′ UTR annotation with predicted pCPSs and dCPSs, mean
coverage of the short and the long 3′ UTRs per sample are calculated.
Differential APA usage between two conditions is quantified as a change in
Percentage of Distal polyA site Usage Index (
We used polyester (v1.33.0) [75] to generate 100-bp paired-end RNA-seq data with
known CPSs and differential APA events as follows. Annotation for a subset of
genes was extracted from the GENCODE GTF file (v34) for the human primary genome
assembly (GRCh38) with the following criteria: (1) none of the selected genes
overlapped; (2) each transcript had a 3′ UTR that was at least 1 kb in length and
contained by a single terminal exon; (3) for multi-isoform genes, at most two
isoforms were selected. If two isoforms were chosen for a gene, the two
alternative 3′ UTRs should share the same start coordinate and differ in length
by at least 1 kb. This process resulted in an abridged GTF file containing
annotation for 5689 and 962 genes with one and two isoforms, respectively. Based
on the abridged GTF file, RNA-seq data with a targeted sequencing depth of
20
The simulated RNA-seq reads were mapped to the human primary genome assembly GRCh38 with the abridged GTF file as gene annotation using STAR (v2.5.3a) [76] in the basic two-pass mode. The resulting alignment files in the SAM format were converted to the BAM format and sorted by coordinates using SAMtools (v1.9) [77]. Genome coverage was calculated based on unique alignments, using the bedtools genomcov module (v2.29.0) [78] with the following settings: -bg -split. The resulting bedGraph file was used for APA analysis.
We generated two TxDb databases (TxDB_1 and TxDB_2) using the makeTxDbFromGFF
function from the GenomicFeatures package. TxDB_1 was created with the abridged
GTF file containing the annotation for the 5689 single-isoform genes and the
short transcript isoform of the 962 bi-isoform genes, while TxDb_2 was created
based on the annotation for the long transcript isoform of the 962 bi-isoform
genes. We performed InPAS-based APA analysis on the bedGraph files of different
coverage depths separately using each of the two databases, with the
single-isoform genes in the TxDb_1 as the negative controls. For CPS searches,
only extracted 3′ UTRs whose first 100-base mean coverage was at least
20
The abridged GTF files containing the annotation for the 5689 single-isoform
genes and that of the 962 bi-isoform genes was converted into a 12-column BED
file using the ea-utils gtf2bed module
(https://github.com/ExpressionAnalysis/ea-utils). The BED file was used to
generate 3′ UTR annotation files using the DaPars_Extract_Anno.py script. CPS
prediction was performed using the DaPars_main.py scripts with the same bedGraph
file specified twice to provide coverage data for a two-group analysis in a
configuration file. Threshold parameters in the configuration file were set as
follows: Num_least_in_group1 = 1, Num_least_in_group2 =
1, Coverage_cutoff = 20, FDR_cutoff = 0.05,
PDUI_cutoff = 0.2, Fold_change_cutoff = 0.59. APA events
with FDR
As described for DaPars-based analysis, 3′ UTR annotation files were generated except that the DaPars_Extract_Anno.py script from the DaPar2 software was used. The number of mapped reads for each sample was calculated using SAMtools (v1.9) [77]. CPS prediction was performed using the DaPars2_Multi_Sample_Multi_Chr.py script with a configuration file as required.
For individual sample-based CPS detection, distal 3′ UTRs of each sample were first predicted using the identifyDistal3UTR command, with the same BED file for DaPars-based analysis as gene annotation and individual bedgraph file provided as coverage data. CPS detection was performed using the predictAPA command with the following option settings: -g 1 -n 1.
For differential APA analysis, distal 3′ UTRs of each sample were first predicted using the identifyDistal3UTR command, with the same BED files for DaPars-based analysis as gene annotation and the two bedgraph files from the two simulated conditions at a given sequencing depth provided as coverage data. CPS detection was performed using the predictAPA command with the following option settings: -g 2 -n 1 1. Differential APA analysis was performed using the deAPA function in the deAPA package bundled with APAtrap.
TAPAS-specific annotation files were generated from the same BED files for DaPars-based analysis using a custom Python script. CPS detection was performed using the APA_sites_detection command with read length and individual bedgraph file specified. Differential APA analysis was performed using Diff_APA_site_analysis command with the predicted CPSs for each sample by the APA_sites_detection command as input.
We obtained three sets of RNA-seq data and matched 3′-end RNA-seq data from the GEO and Sequence Read Archive (SRA) databases: GSE42420 [23] and GSE94950 [50], GSE151721 and GSE151724 [79], GSE56010 [80] and SRP065825 [81]. These data were from human or mouse cell lines treated with control siRNA or siRNA against CFIm25 [23, 50], HNRNPC [80, 81], Srsf3 or Srsf7 [79]. Additionally, we downloaded RNA-seq data (E-MTAB-2836) for human cerebral cortex and liver tissues from ArrayExpress [82], as well as RNA-seq data (GSE87410) for 50 pairs of tumor and normal tissues of nine cancer types [83] from the GEO database. Aligned RNA-seq data in the BAM format for both primary tumors and matched normal tissues for the TCGA BRCA (n = 113 patients) [84] and TCGA KIRC (n = 72 patients) [85] projects were downloaded from the GDC data portal (https://portal.gdc.cancer.gov/) [86]. Additional information about these datasets is provided in Additional file 1: Supplementary Table 2.
The quality of the raw sequencing data was assessed using FastQC
(https://www.bioinformatics.babraham.ac.uk/projects/fastqc) before preprocessing.
For PAC-seq data (GSE94950) [50], Cutadapt [87] was used to remove TruSeq adaptor
sequences, the first six nucleotides derived from the ‘Click-Adaptor’, and
poly(G) tails with explicit option settings: -a
NNNNAGATCGGAAGAGCACACGTCTGAACTCCAGTCAC -m 35 -j 10 –nextseq-trim 20. Next,
custom Perl scripts were used to further trim the resulting reads to remove
poly(A) tails of length
The quality of the raw RNA-seq data (GSE42420, GSE151721, GSE56010, E-MTAB-2836,
and GSE87410) was assessed using FastQC
(https://www.bioinformatics.babraham.ac.uk/projects/fastqc). Subsequently,
Illumina sequencing adapter sequences and low-quality bases were trimmed using
fastp (v0.21.0) [89] with the following explicit option settings:
–cut_tail –cut_tail_window_size 4 –cut_tail_mean_quality 15
–cut_front –cut_front_window_size 1 –cut_front_mean_quality 3
–adapter_fasta adapter.fa –length_required 25. Outputs from fastp was
further processed to remove trailing poly(A) or leading poly(T) of length
Due to the unavailability of fastq files for the TCGA data, we regenerated fastq files from BAM files using the SamToFastq module of the Picard Tools (v2.26.10) (https://broadinstitute.github.io/picard/). The paired-end reads from GSE42420, GSE151721, GSE56010, E-MTAB-2836, and GSE87410, and the TCGA data were mapped to the human reference transcriptome (GENCODE v34) with the whole genome as decoy, using Salmon (v1.9) [90] with explicit options setting: –seqBias –gcBias –posBias –softclip –softclipOverhangs –biasSpeedSamp 5 -l IU –validateMappings. Next, transcript-by-sample count tables for each dataset were generated using the tximport package [91]. Mean depth of coverage per transcript was calculated using the formula 2lc/L, where l is the read length in base, c is the estimated read counts for a given transcript, and L is the computed effective length in base of the given transcript. The mean depth of coverage per transcript was summed up across all relevant samples for a given differential APA analysis to obtain the total depth of coverage of a given transcript. For each pair of compared conditions, we filtered out transcripts with a total depth of coverage lower than 10, noncoding transcripts of protein-coding genes, transcripts encoding small nucleolar RNAs (snoRNAs), miRNAs, ribosomal RNAs (rRNAs), transfer RNAs (tRNAs), rRNA pseudogenes, small activating RNAs (saRNAs), small conditional RNAs (scRNAs), small nuclear RNAs (snRNAs), and vault RNAs, as well as other transcripts shorter than 200 bases from the corresponding count table. Annotation for the remaining transcripts was extracted from the original GTF file, resulting in an abridged GTF file for the given comparison, which was used for further APA analyses.
The abridged GTF files for each comparison were converted into 12-column BED
files as described above. CPS prediction and differential APA analysis of the
experimental RNA-seq data were performed as described for the simulated RNA-seq
data. To evaluate the accuracy of predicted CPSs by these tools, we compared the
predicted CPSs from the RNA-seq data with those identified from the 3′-end
RNA-seq data as references. CPS predicted from RNA-seq data (GSE42420, GSE151721,
GSE56010) were considered correct if the predicted CPSs were within 50-bp
distance of the CPSs detected by 3′-end RNA-seq data (GSE94950, GSE151724, and
SRP065825). An APA event with an occurrence rate
To benchmark InPAS along with other leading tools (DaPars, DaPars2, APAtrap, and
TAPAS) for APA analysis, we first simulated a series of RNA-seq datasets of
different depths of coverage (20
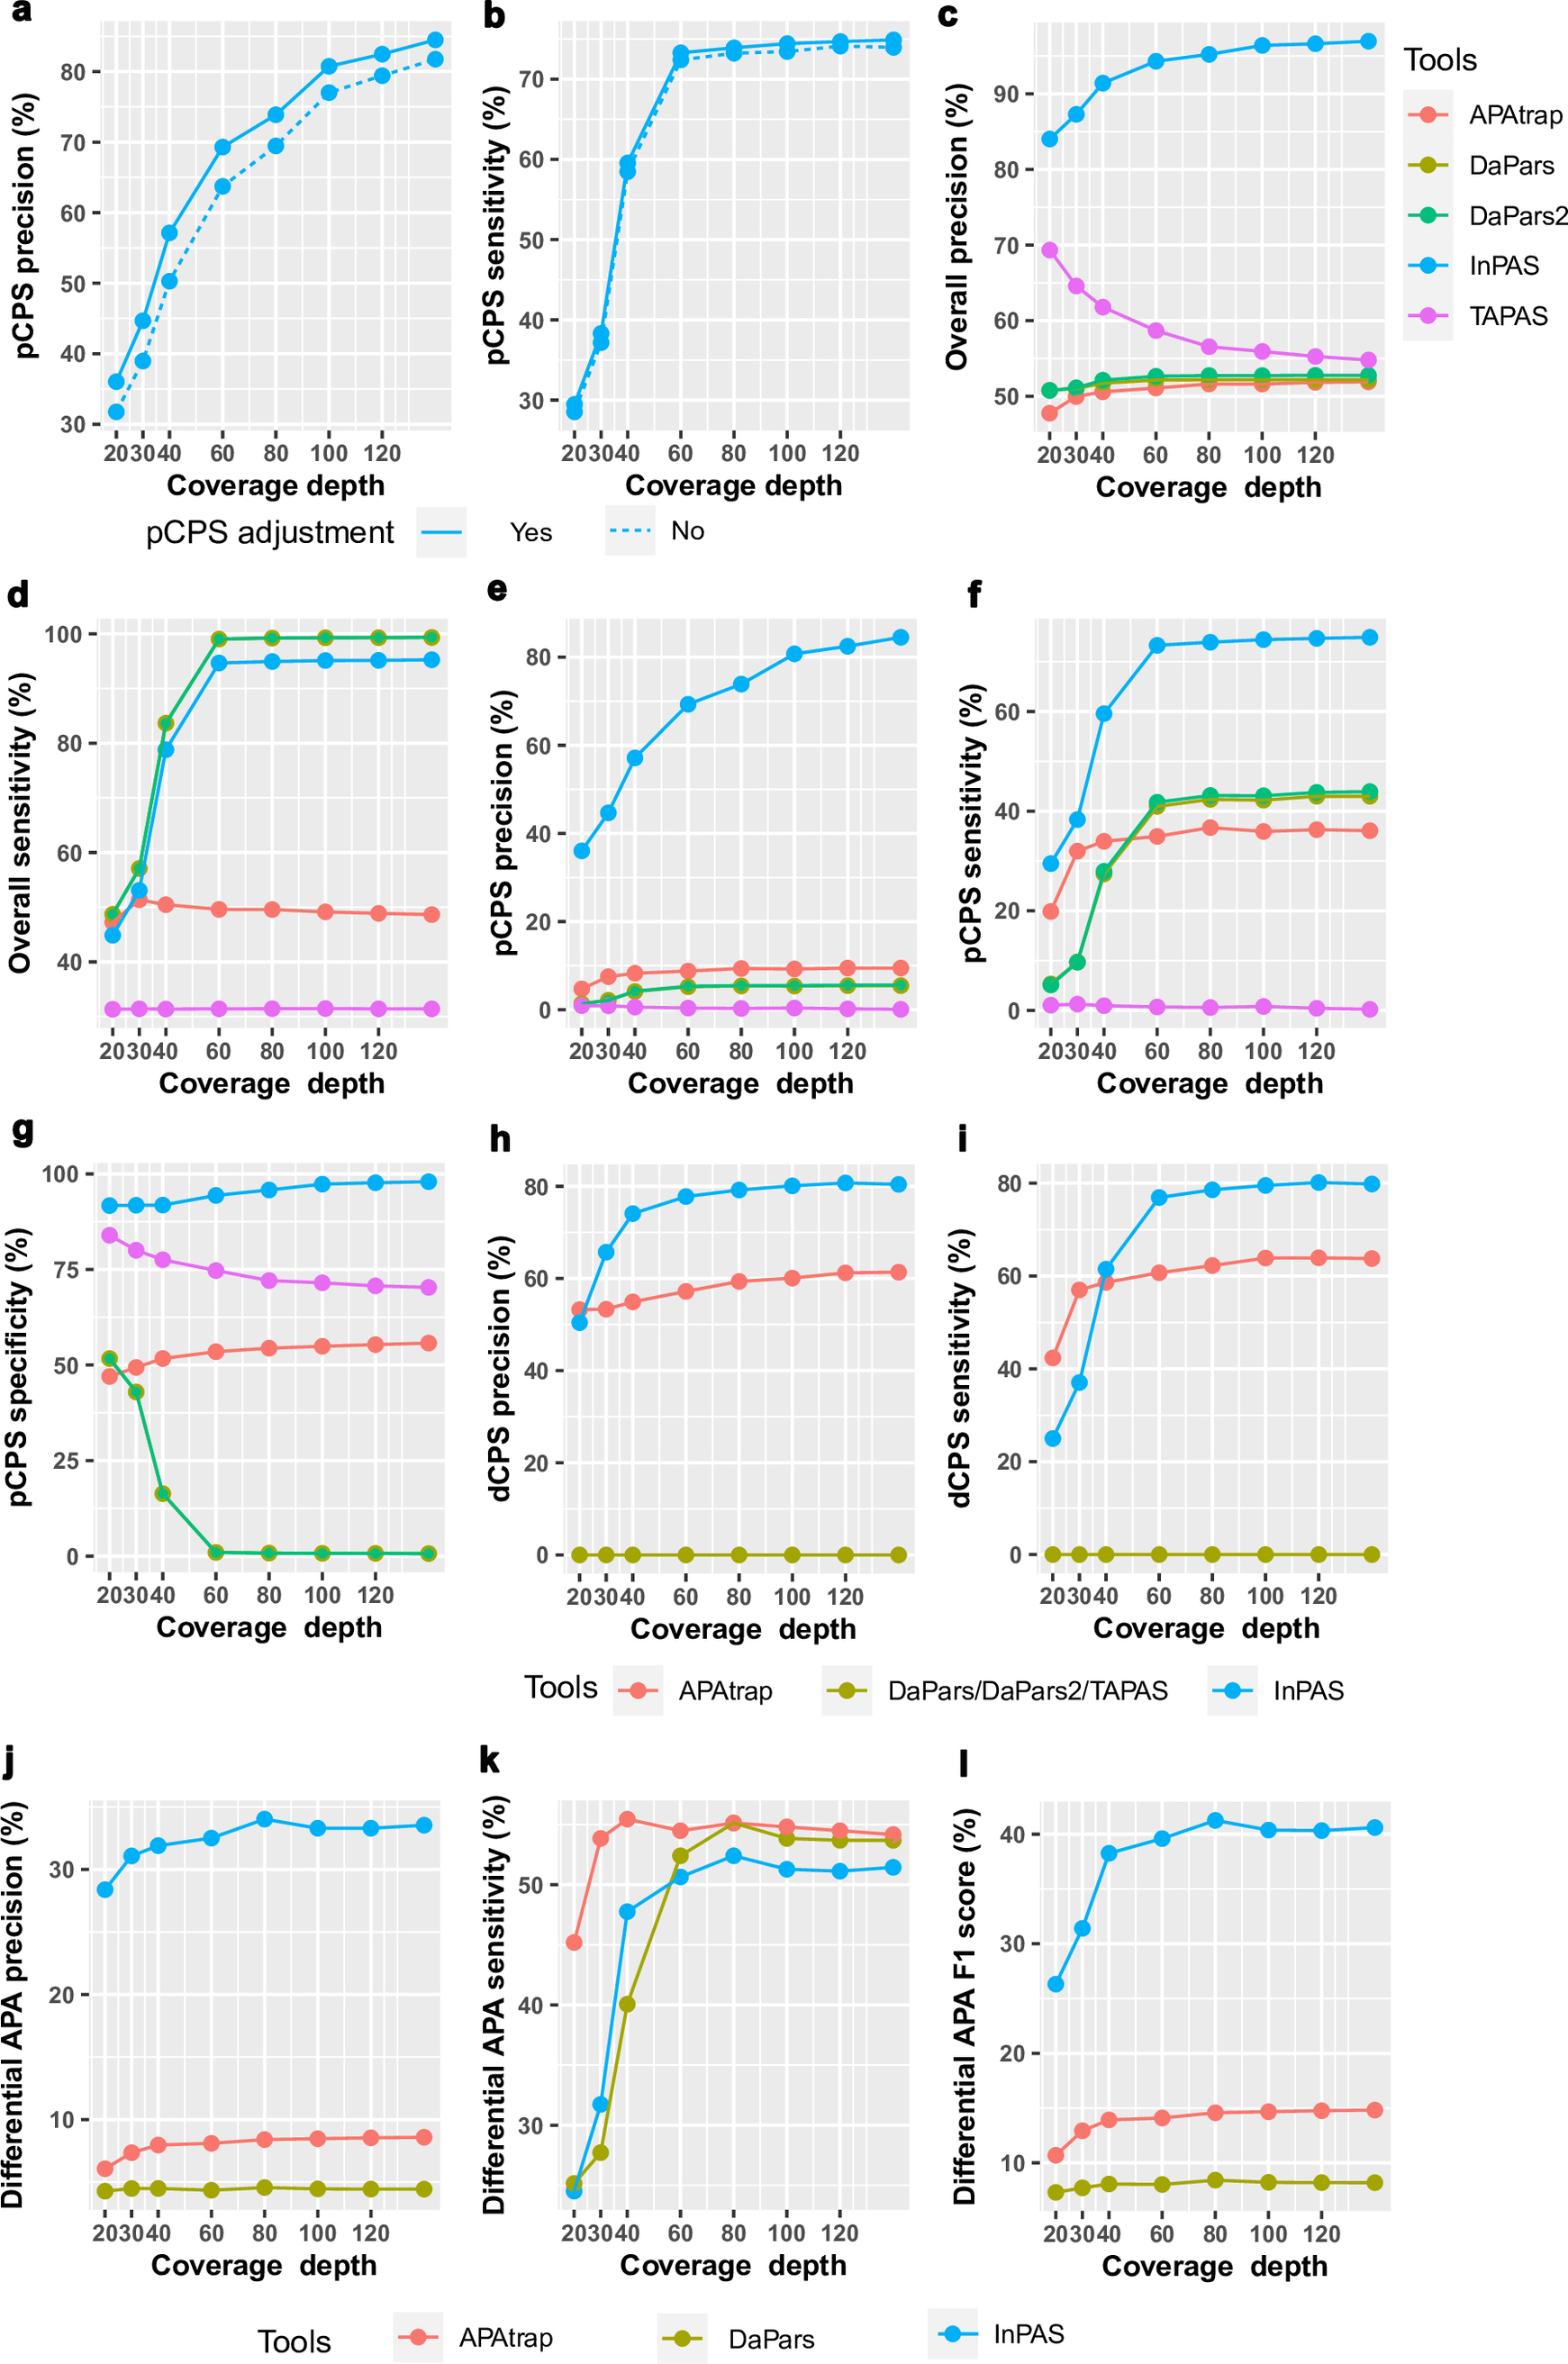 Fig. 1.
Comparison of InPAS with other leading tools in identifying and quantifying APA from simulated RNA-seq data. (a,b) Precision and sensitivity of InPAS in predicting pCPSs is slightly improved by adopting the naïve Bayes classifier from the cleanUpdTSeq package to adjust the rudimentarily predicted pCPSs at different depths of coverage. (c,d) Precision and sensitivity of InPAS and other tools in predicting both dCPS and pCPSs. (e–g) Precision, sensitivity, and specificity of InPAS and other tools in predicting pCPSs. Subpanels (d–g) shared the same figure legend as (c). (h,i) Precision and sensitivity of InPAS and other tools in predicting dCPSs when annotation for the short 3′ UTRs is provided as 3′ UTR annotation. None of TAPAS, DaPars and DaPars2 can predict the dCPSs. (j–l) Precision, sensitivity and F1 score of InPAS, DaPars, APAtrap and TAPAS in recovering known differential APA events. Fisher’s exact test was used by DaPars [64] and InPAS, linear trend test by APAtrap [66], or negative binomial regression by TAPAS [67]. DaPars2 cannot perform differential APA analysis, so it was not included in the evaluation. CPS, cleavage and polyadenylation site; pCPSs, proximal CPSs; dCPS, distal CPSs; UTR, untranslated region; InPAS, Identification of Novel alternative PolyAdenylation Sites; DaPars, Dynamic analysis of Alternative PolyAdenylation from RNA-seq; APAtrap, Alternative PolyAdenylation trap; TAPAS, Tool for Alternative Polyadenylation site AnalysiS; RNA-seq, RNA sequencing.
Next, we evaluated the performance of InPAS and the other leading tools mentioned above using experimental datasets: three sets of published RNA-seq data with matched 3′-end RNA-seq data [23, 50, 79, 80, 81] (Additional file 1: Supplementary Table 2). These data were from human or mouse cell lines treated with control siRNA or siRNA against CFIm25 [23, 50], HNRNPC [80, 81], Srsf3 or Srsf7 [79]. Previous studies have shown that CFIm25 [23], HNRNPC [92, 93], SRSF3 and SRSF7 [79] can all modulate 3′ UTR length. We first determined the CPSs of each sample using the 3′-end RNA-seq data, which were used as imperfect truth for evaluating the performances of the tools for APA analysis. More than 75% of the CPSs detected in each sample overlap with the entities in the PolyASite 2.0 database [6], though the number of detected CPSs across samples under the same conditions varies drastically (Additional file 2: Supplementary Fig. 3). InPAS showed higher precision and F1 scores for most samples in predicting CPSs than other tools (Fig. 2a,c), while its sensitivity in predicting CPSs slightly lower than those of DaPars and DaPars2, which displayed the best sensitivity (Fig. 2b). Given that none of DaPars, DaPars2, and TAPAS can predict dCPSs de novo, we compared the precision of these tools in predicting pCPSs. InPAS showed the best precision in predicting pCPSs (Fig. 2d).
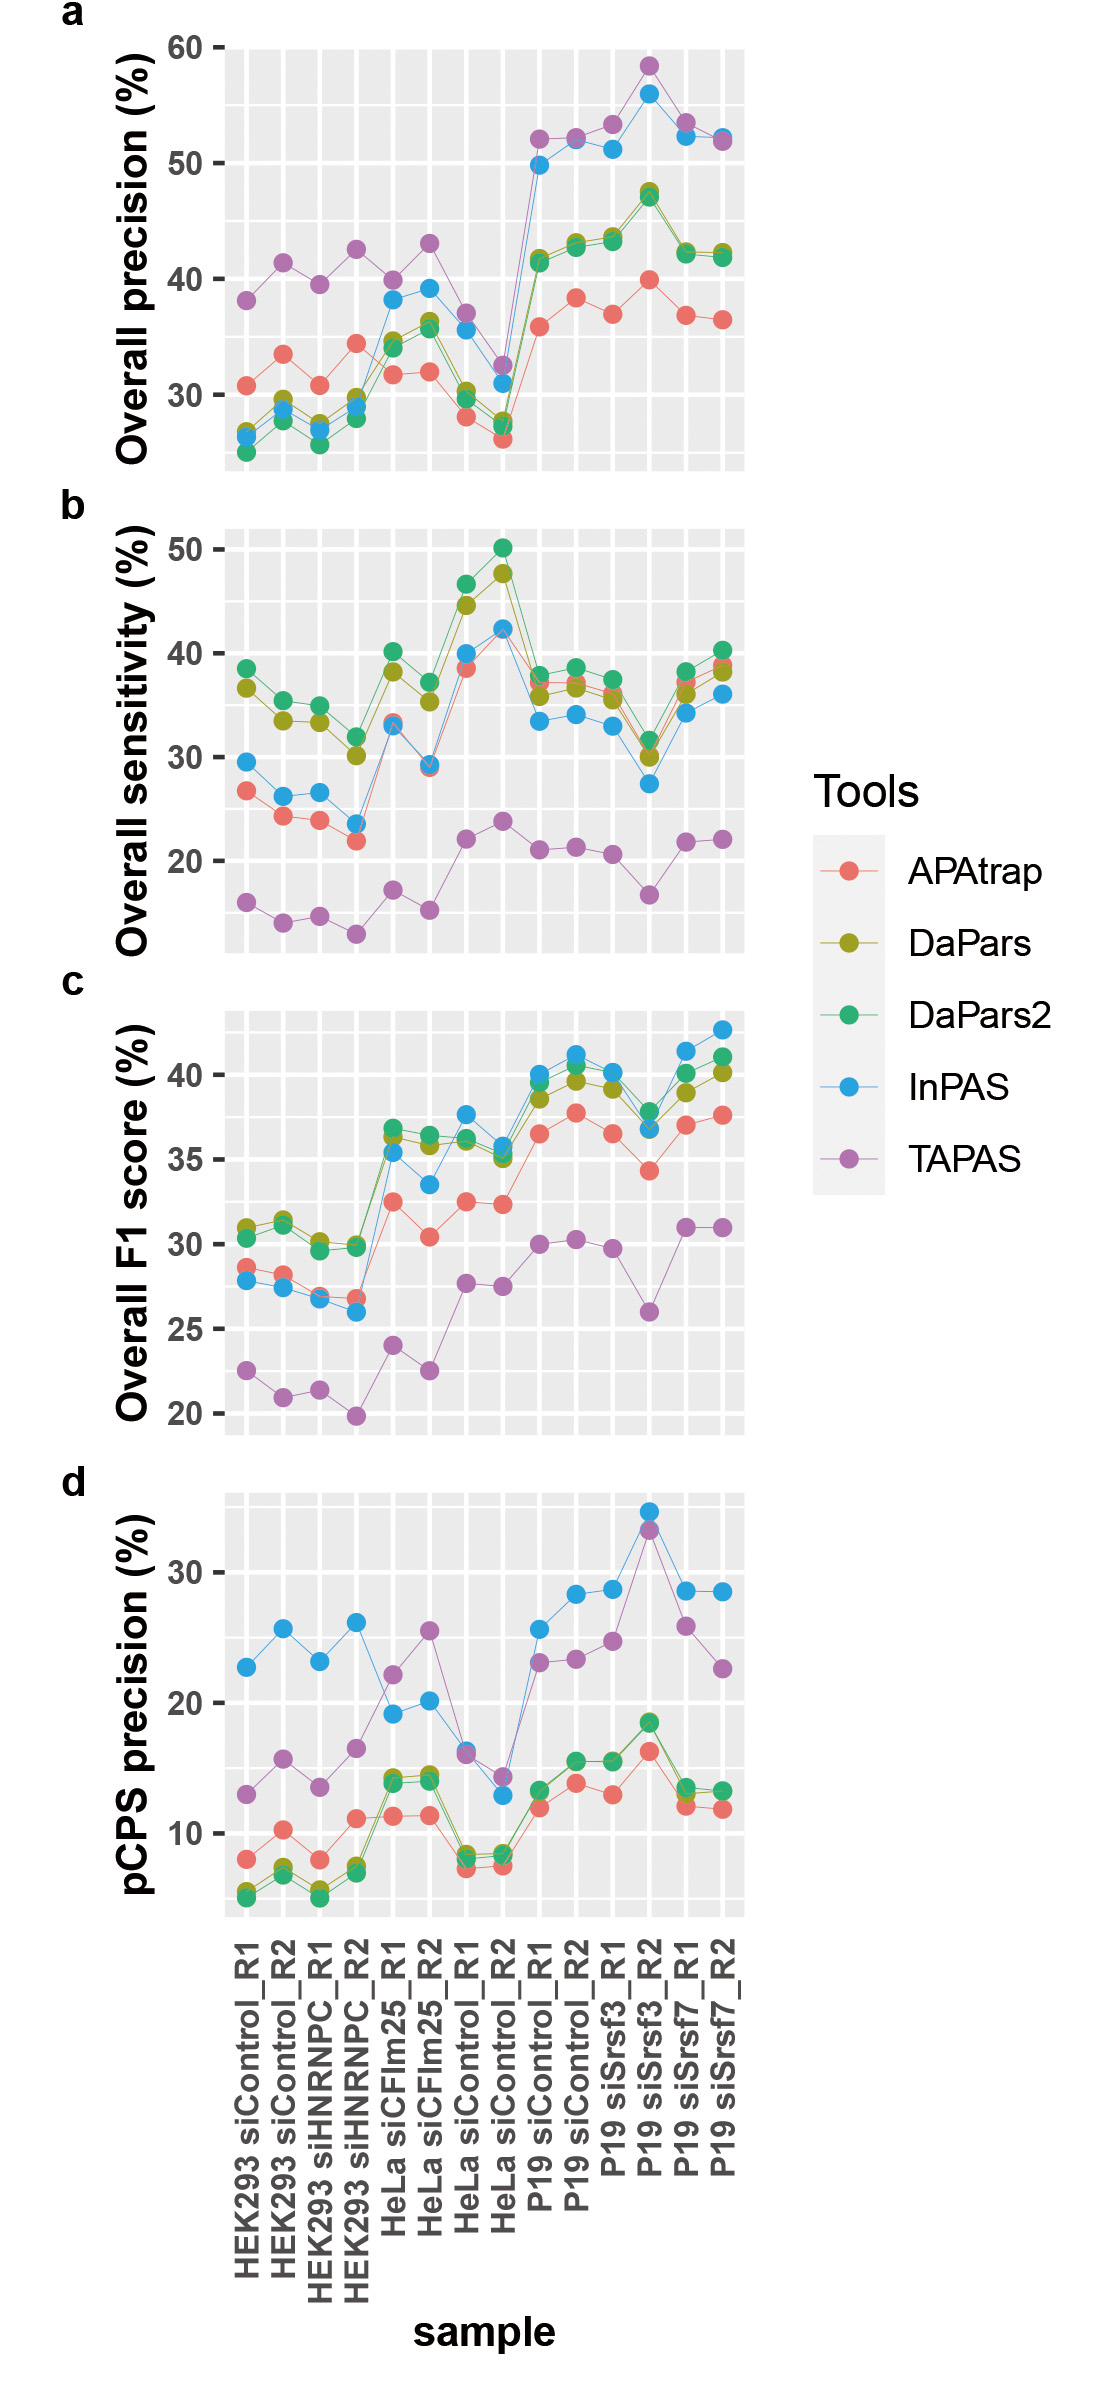 Fig. 2.
Comparison of InPAS with other leading tools in identifying CPSs from experimental RNA-seq data. (a,b) Precision and sensitivity of InPAS and other tools predicting both pCPSs and dCPSs. (c) F1 scores of InPAS and other tools predicting both pCPSs and dCPSs. (d) Precision of InPAS and other tools predicting pCPSs.
Besides precision, sensitivity, and specificity, we compared the functionalities, runtime, and maximal memory consumption of these tools for APA analyses using the simulated and experimental RNA-seq. Table 1 shows the differences of these tools in functionalities [64, 65, 66, 67]. APAtrap behaved as the most time-consuming tool for both predicting CPSs and differential APA analysis (Fig. 3a,b). InPAS ran only slightly slower than DaPars and DaPars2 in predicting CPSs, where TAPAS was the fastest. For differential APA analysis, APAtrap and TAPAS performed as the first and second most time-consuming tool, respectively, followed by DaPars, while InPAS was the fastest tool (Fig. 3b). In terms of maximal memory consumption, TAPAS consumed the largest amount of memory during differential APA analysis, followed by APAtrap, InPAS, and DaPars (Fig. 3c). The maximal memory required by DaPars and InPAS were small, and comparable (Fig. 3c).
| InPAS | DaPars | DaPars2 | APAtrap | TAPAS | |
| Annotation file format1 | TxDb | BED | BED | BED | Proprietary |
| Operation unit2 | transcript set | transcript | transcript | transcript | gene |
| pCPS prediction | Y | Y | Y | Y | Y |
| dCPS prediction3 | Y | N | N | Y | N |
| Absolute CPS quantification4 | Y | Y | N | Y | Y |
| Relative CPS quantification | Y | Y | Y | N | N |
| Number of samples for CPS prediction and quantification | 1 | ||||
| Differential CPS usage | Y | Y | N | Y | Y |
| Number of samples for differential CPS usage5 | |||||
| Parallel computing | Y | N | Y | N | N |
| CPU time | + | ++ | ++ | +++++ | +++ |
| Maximal memory | + | + | + | ++ | +++++ |
| Open source6 | Y | Y | Y | Y | partial |
| Programming language | R | Python | Python | Perl | C, R |
| Reference | This study | [64] | [65] | [66] | [67] |
Notes: (1) InPAS extracts 3′ UTR and immediate intergenic region up to 10 kb
from a TxDb database and get gene symbols from a EnsDb; DaPars, DaPars2 and
APAtrap extract 3′ UTR of each transcript from a 12-column BED file containing
transcript models and get gene symbol from an optional transcript-to-gene map;
TAPAS uses a proprietary format file to represent transcript models, which has to
be prepared with special care. (2) In InPAS, a set of transcripts of the same
gene share the same starting coordinate of the last exons is consider a single
operation unit; DaPars, DaPars2 and APAtrap consider each transcript as an
operation unit; TAPAS considers each gene as an operation unit. (3) DaPars and
DaPars2 consider the 3′ extremity of each transcript as the authentical dCPS of
the transcript; TAPAS considers the most downstream 3′ extremity of transcripts
of a gene as the authentical distal CPS of the gene; InPAS and APAtrap can
predict de novo dCPSs downstream of annotated 3′ UTR. (4) InPAS and DaPars output
both PDUI and length-normalized abundance; DaPars2 only reports PDUI for each
sample; APAtrap report length-normalized abundance; TAPAS reports abnormally high
length-normalized abundance and total basewise read coverage for each 3′ UTR. (5)
InPAS can use PHMM to perform single sample differential analysis, Fisher exact
test for two groups of samples without replicates, linear model for single group
and two groups of samples with replicates. DaPars performs differential analysis
using Fisher exact test for two groups of samples; APAtrap uses linear trend test
to perform differential analysis for two groups of samples; TAPAS use negative
binomial generalized linear model for differential analysis of two groups of
samples with
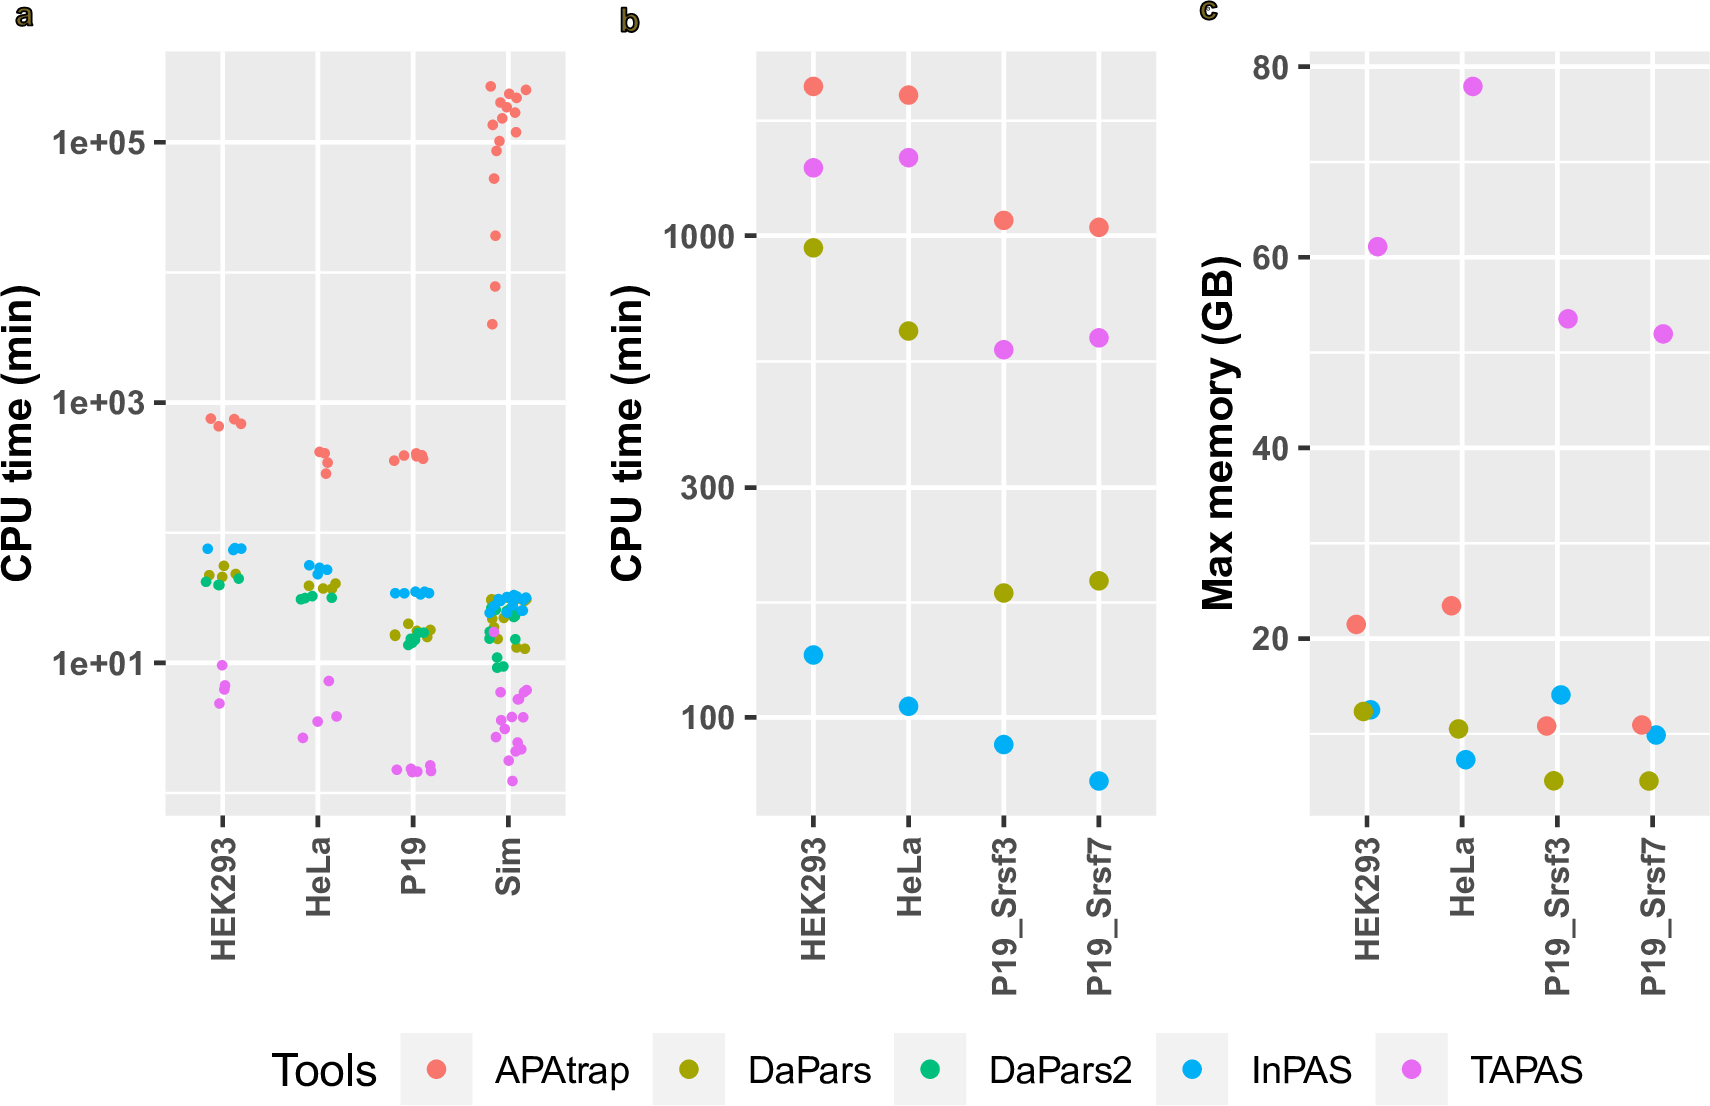 Fig. 3.
CPU time and maximal memory consumption of InPAS and other tools. (a) CPU time used by each tool to predict CPSs of each sample. The y axis is on a log10 scale. Each dot represents a sample. HEK293, HeLa, and P19 are names of cell lines, from which the RNA was extracted for RNA-seq. Sim, the simulated RNA-seq data using polyester. (b) CPU time used by each tool to detect differential APA events between replicates treated by a control siRNA or an siRNA against HNRNPC (HEK293), CFIm25 (HeLa), Srsf3 (P19), or Srsf7 (P19). (c) Maximal memory required by each tool to get differential APA events between replicates treated by a control siRNA or an siRNA against HNRNPC (HEK293), CFIm25 (HeLa), Srsf3 (P19), or Srsf7 (P19).
To showcase the ability of InPAS to identify differential APA in physiological states, we analyzed RNA-seq data from normal human brain and liver tissues [82]. Our analysis revealed that for 165 genes, the dCPS was used more favorably in the brain than in the liver, whereas for 22 genes, the pCPS was used more favorably in the brain than in the liver (Additional file 1: Supplementary Table 3), which is consistent with the well-documented phenomenon of widespread lengthening of 3′ UTRs in neuronal tissues via APA [94, 95]. Additional file 2: Supplementary Fig. 4 highlights several of the genes (LRP3, SRSF7, YY1, and ZNF706) that exhibited differential APA as identified by InPAS. Additionally, we observed an overrepresentation of genes related to pathways of neurodegeneration–multiple diseases (KEGG pathway hsa05022) among the genes showing differential APA in the brain compared to the liver (gene ratio = 0.20, adjusted p-value = 0.0038).
Next, we tested the ability of InPAS to identify differential APA events in heterogeneous tumor samples compared to matched normal tissue samples by analyzing two datasets, one from 50 patients with nine different cancer types [83] and the other from 113 patients with breast invasive carcinoma (BRCA) [84] and 72 patients with kidney renal clear cell carcinoma (KIRC) [85]. Although the number of differential APA events detected for each patient varied in both datasets, we identified 1162 recurrent differential events among the 50 patients with diverse cancers, and 941 recurrent differential events among the 185 patients with BRCA or KIRC, with a large fraction of differential APA events resulting in preferential use of pCPS (3′ UTR shortening) in tumor samples (Fig. 4a, Additional file 1: Supplementary Tables 4 and 5, and Additional file 2: Supplementary Fig. 5). Our findings are consistent with a previous study [64] showing widespread preference for utilizing pCPSs in cancers. The genes exhibiting differential APA in the nine cancer types include 74 genes from the COSMIC-curated Cancer Gene Census list (v96) (http://cancer.sanger.ac.uk/census), 27 tumor suppressor genes, 24 oncogenes, seven “double agents” (genes with both oncogenic and tumor-suppressor functions) [96], and 14 fusion genes (Additional file 1: Supplementary Table 4). Similarly, genes involved in differential APA in the TCGA data include 31 genes from the COSMIC-curated Cancer Gene Census list (v96) (http://cancer.sanger.ac.uk/census), nine tumor suppressor genes, 11 oncogenes, seven “double agents” and four fusion genes (Additional file 1: Supplementary Table 5). Genes involved in the p53 signaling pathways and a few other KEGG and Reactome pathways were overrepresented among the genes with differential APA between tumor and normal samples from patients of the nine cancer types (Fig. 4b,c). We also observed an overrepresentation of genes in the renal cell carcinoma pathway (KEGG hsa05211), among the genes with differential APA in the TCGA BRCA or KIRC samples compared to the matched normal tissues (gene ratio = 0.033, adjusted p-value = 0.031).
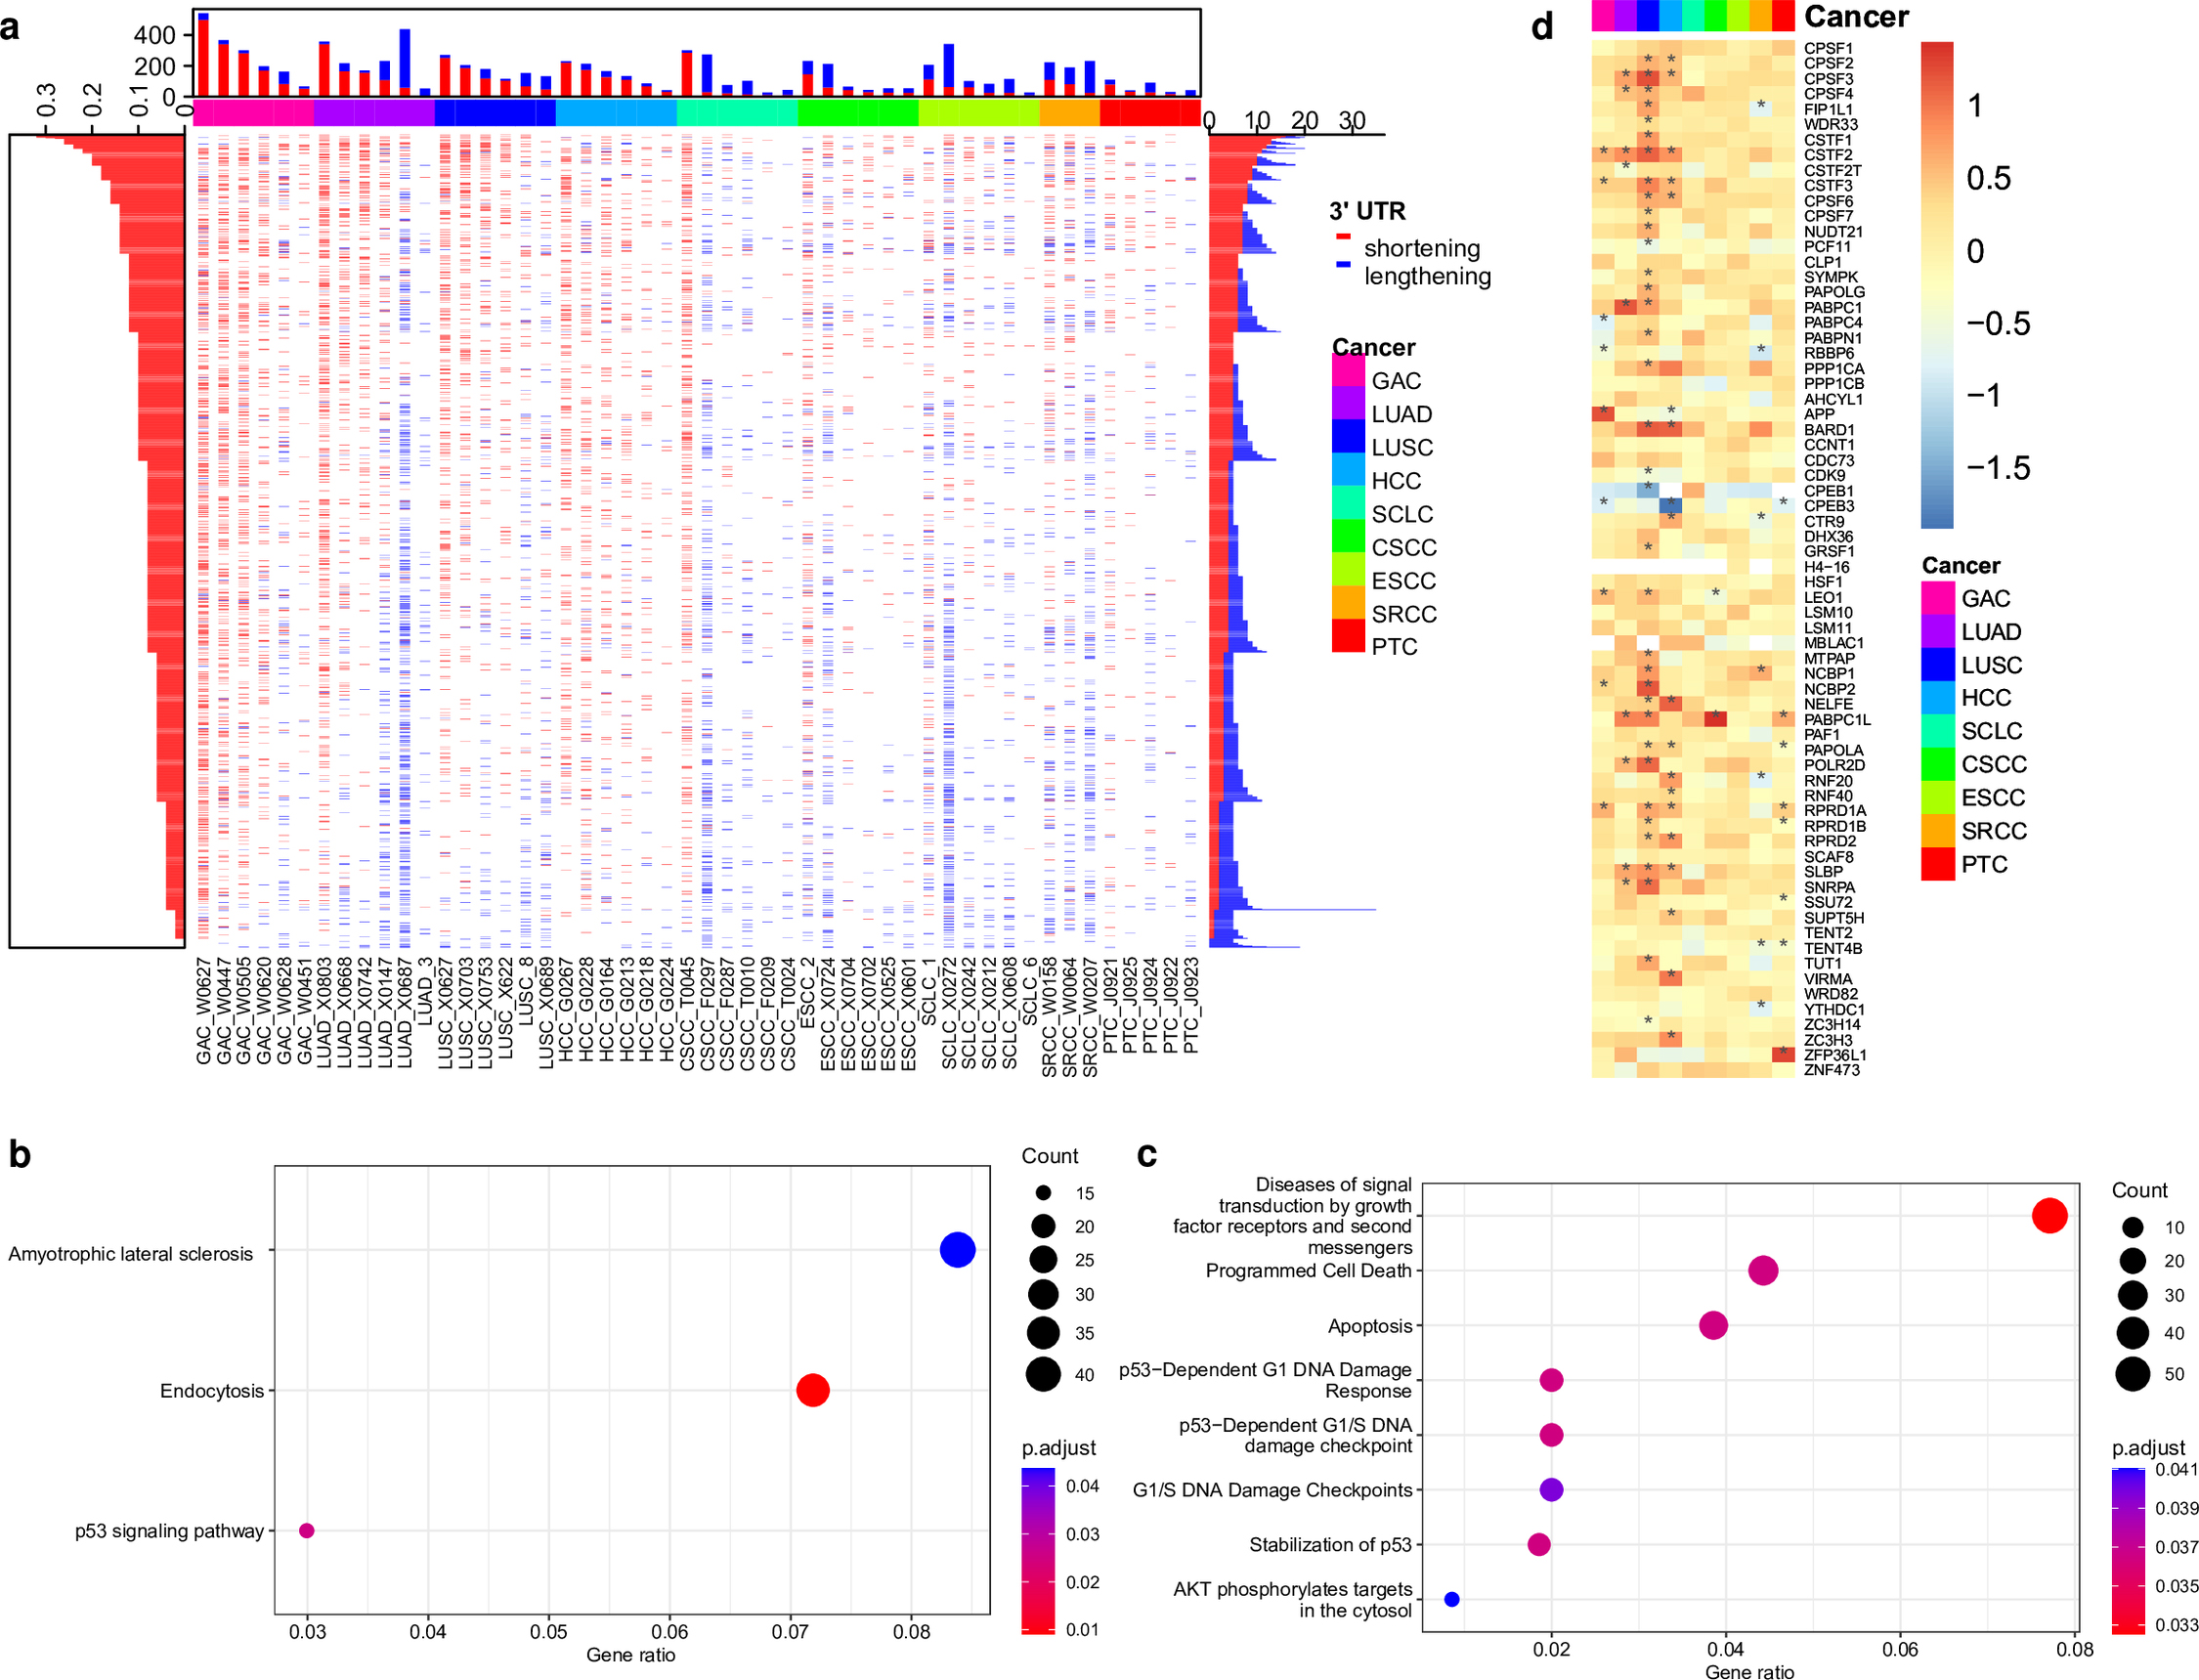 Fig. 4.
Differential APA events identified by InPAS across nine cancer
types. (a) The central heatmap displays 1162 recurrent APA events across the
nine cancer types. The top stacking barplot shows the number of 3′ UTR shortening
(red) and lengthening (blue) events in each tumor sample compared to the matched
normal tissue. The left barplot shows the proportions of samples across the nine
cancer types with 3′ UTR shortening, while the right stacking shows the number of
samples across the nine cancer types with 3′ UTR shortening (red) and lengthening
(blue). GAC, gastric adenocarcinoma; LUAD, lung adenocarcinoma; LUSC, lung
squamous cell carcinoma; HCC, hepatocellular carcinoma; SCLC, small-cell lung
carcinoma; CSCC, cervical squamous cell carcinoma; ESCC, esophageal squamous cell
carcinoma; SRCC, gastric signet-ring cell carcinoma; PTC, papillary thyroid
carcinoma. (b,c) KEGG and Reactome pathways overrepresented among genes
showing differential APA in tumor samples compared to the matched normal tissues,
respectively. (d) Heatmap showing the log2(fold change) of expression of
genes involved in mRNA 3′ end processing (GO0031124) between the tumor and the
matched normal samples. The significant changes (adjusted p value
To investigate the mechanisms that drive APA during tumorigenesis, we examined the genes showing recurrent APA in the two cancer datasets for overlap with a collection of 127 significantly mutated genes in cancers, curated by the TCGA PanCan12 project [97]. However, only a small fraction of genes with recurrent differential APA in the two datasets—17 (1.46%) of genes in the BRCA dataset and 21 (2.23%) of genes in the KIRC dataset—were PanCan12 significantly mutated genes (Additional file 1: Supplementary Tables 4 and 5). These results suggest that the vast majority of APA events in the two cancer datasets may not be caused by known mutations of the cis-elements in 3′ UTRs. On the other hand, we found that many genes involved in 3′-end processing of pre-RNA transcripts showed aberrant expression in most tumor samples compared to their matched normal tissues (Fig. 4d, and Additional file 2: Supplementary Figs. 6,7, and 8), which is consistent with a previous study [64] and suggest dysregulation of these 3′-end processing factors might contribute to many APA events. Furthermore, our analysis suggests that the genes and the directions of their aberrant expression in tumors relative to matched normal tissues may be specific to tumor type or even patient.
APA is a key eukaryotic post-transcriptional mechanism that plays roles in both health and disease by producing mRNA isoforms with distinct 3′ UTRs or even different coding sequences. However, accurately detecting and quantifying APA from RNA-seq data remains challenging due to the complexity of eukaryotic RNA transcription and processing and the limitations of existing analysis tools. To address this issue, we developed a R/Bioconductor package, called InPAS, which has several important improvements over the leading APA analysis tools (DaPars, DaPars2, APAtrap, and TAPAS). Firstly, InPAS collapses 3′ UTRs, which share the same start coordinates and from transcripts of the same gene, and takes the longest one as representative, reducing the number of candidates for analysis and improving statistical power. In contrast, DaPars, DaPars2, and APAtrap perform analysis for every annotated 3′ UTR separately, which leads to redundant or even artificial APA discovery. Secondly, InPAS can efficiently de novo identify both pCPSs and dCPSs, whereas DaPars, DaPars2, and TAPAS can only identify novel pCPSs. Thirdly, differing from other leading tools, InPAS provides the option to finely adjust the position of rudimentarily predicted CPSs based on the flanking sequence features by leveraging a naïve Bayes classifier [72], increasing the precision of CPS detection. Fourthly, in addition to employing Fisher’s Exact test for differential APA analysis in a simple two-group experimental design like DaPars, InPAS uniquely offers the capability to utilize the linear model method [73] for differential APA analysis in complex experimental designs. In addition, InPAS implements Poisson hidden Markov model for single-sample exploratory APA analysis [98] and the linear model method for single-group APA analysis, setting it apart from other tools that do not support these analyses. Fifthly, InPAS is designed for efficient parallel processing, which is essential for analyzing large datasets or running on high-performance computing clusters. This feature distinguishes it from other leading tools except DaPars2, which allows for parallel computing but does not offer the capability to perform differential APA analysis.
InPAS is computationally efficient, with CPU time and memory consumption that are on par with those of DaPars and DaPars2. In sharp contrast, APAtrap and TAPAS impose considerably longer CPU time and high memory requirement. InPAS owes its high efficiency to a combination of factors, including parallel computing, vectorized operations inherent to R, and strategic implementation choices. For example, it leverages the swift readr functions (https://cran.r-project.org/web/packages/readr/index.html) for importing bedgraph files to R and stores the coverage data in memory-efficient Rle objects.
We have illustrated the superior precision, sensitivity, and specificity of InPAS using both simulated and experimental RNA-seq data. InPAS’ enhanced specificity is attributed in part to a filtering procedure that eliminates predicted pCPSs located in close proximity to the 3′ ends of transcripts. These pCPSs are frequently artifacts arising from the nature decay of read coverage at the extremities of transcripts in RNA-seq data [99].
InPAS analysis of RNA-seq data from human brain and liver tissue revealed that for the majority of genes undergoing significant differential APA, the dCPS was used more favorably in the brain than in the liver, which is consistent with previous findings that the brain expresses more genes with longer 3′ UTR transcript isoforms than other tissues [94]. Interestingly, one of these genes was SRSF7, a splicing factor that has previously been shown to enhance pCPS usage in a concentration-dependent, but splicing-independent, manner by recruiting the cleavage factor FIP1, which results in shorter 3′ UTRs [79]. It has been shown that SRSF7 is down-regulated and 3′ UTRs are globally extended during neuronal differentiation [79] and that SRSF7 expression is directly regulated by miR-30a-5p, miR-216b-5p, and miR-181a-5p in renal cancer cells [100]. Based on our findings, it is plausible that the increased usage of the dCPS of SRSF7 in the brain may be involved in the down-regulation of SRSF7, which could subsequently result in the extension of many 3′ UTRs in the brain tissue. Further studies are needed to elucidate the mechanisms and confirm the potential role of SRSF7 in 3′ UTR regulation in the context of the brain tissue.
Despite the challenges in identifying and quantifying APA events in heterogenous tumor samples, we identified ~1000 recurrent APA events in diverse cancer RNA-seq datasets, with the majority resulting in preferential use of pCPSs and causing 3′ UTR shortening. Recurrent APA events were identified in dozens of oncogenes, tumor suppressor genes, and “double agents” [96]. APA events associated with these genes may contribute to tumorigenesis. However, the functional consequences of most of those shifts in 3′ UTR length are unclear. Global studies have shown that tandem 3′ UTR APA for most mRNA transcripts has only a moderate effect on their translation efficiency and mRNA stability in mouse fibroblasts [101]. Therefore, many of those identified APA events may have only limited effect on biological functions if they do not change protein coding potential and/or RNA and protein localization. Nevertheless, the combination of small changes of many genes and/or significant changes of a small fraction of genes may contribute to tumorigenesis. Unlike APA events between normal human tissues, such as the brain and liver, which are highly consistent between replicates, overall APA events are highly heterogeneous from sample to sample in cancer datasets, even though some recurrent APA events are present across samples of the same cancer types and across samples of different cancer types, consistent with previous studies [64, 69, 102]. This heterogeneity of APA in cancer samples may be due to variations in the cancer type, tumor stage, cell composition or cell state [69, 102]. In addition to cell type/state-specific auxiliary trans-factors involved in APA, the observed heterogeneous APA events may be largely due to the heterogeneous concentrations/activities of core polyadenylation proteins [19, 22, 103]. Our analysis of the expression pattern of 3′-end processing genes in the two cancer datasets as well as previous studies [64, 103] supports this hypothesis.
APA analysis is inherently complex, and current computational tools designed for analyzing short-read RNA-seq data suffer from low sensitivity and specificity. These limitations stem from both technical limitations associated with short read-based RNA-seq and the biological intricacies of eukaryotic RNA transcription, splicing and 3′ end processing. For instance, biases introduced by library preparation, sequencing, and mapping can lead to noisy read coverage across exons, especially in 3′ UTRs. Moreover, certain 3′ UTRs present additional difficulties for coverage-based APA analysis because they are composed of several exons separated by introns [104], or because they overlap with other 3′ UTRs of different starting sites, or non-3′ UTR exons from the same or different genes. Additionally, post-transcriptional 3′ UTR re-cleavage and re-polyadenylation of mRNA transcripts at pCPSs in the cytoplasm, generating stable uncapped autonomous RNA fragments [34], can make coverage signal flanking CPSs unpredictable and complicate APA analysis. Furthermore, tissue heterogeneity can also hinder the identification of true CPSs from bulk RNA-seq data since many APA events are cell type-specific [105, 106].
Excitingly, direct RNA sequencing using Oxford Nanopore platforms allows for the precise identification of polyadenylation sites for each transcript in eukaryotes [107, 108], overcoming the challenges associated with APA analysis of short-read RNA-seq data. However, the current cost of Nanopore sequencing remains prohibitive for many laboratories. As the cost decreases and sequencing throughput improves, direct RNA-seq is poised to become the mainstream method of APA analysis in the near future.
APA is a crucial post-transcriptional mechanism that regulates gene expression in eukaryotes, involved in both health and diseases. We developed the InPAS package to facilitate identification and quantification of APA events from the large amount of existing and emerging RNA-seq data. With several important improvements over existing popular software for APA analysis, InPAS can accurately and efficiently identify novel pCPSs and dCPSs, as well as quantify APA from RNA-seq data of various experimental designs. We believe our InPAS will fuel the study of APA to advance our understanding of the role of APA in regulating gene expression and develop biomarkers or even therapeutics for diseases.
The datasets analyzed in this study are available from the GEO and SRA databases under accession numbers GSE42420 (https://www.ncbi.nlm.nih.gov/geo/query/acc.cgi?acc=GSE42420) [23], GSE94950 (https://www.ncbi.nlm.nih.gov/geo/query/acc.cgi?acc=GSE94950) [50], GSE151721 (https://www.ncbi.nlm.nih.gov/geo/query/acc.cgi?acc=GSE151721) and GSE151724 (https://www.ncbi.nlm.nih.gov/geo/query/acc.cgi?acc=GSE151724) [79], GSE56010 (https://www.ncbi.nlm.nih.gov/geo/query/acc.cgi?acc=GSE56010) [80] and SRP065825 (https://www.ncbi.nlm.nih.gov/sra/?term=SRP065825) [81], and GSE87410 (https://www.ncbi.nlm.nih.gov/geo/query/acc.cgi?acc=GSE87410) [83], or from the ArrayExpress under accession number E-MTAB-2836 (https://www.ebi.ac.uk/biostudies/arrayexpress/studies?query=E-MTAB-2836) [82], or from the TCGA-BRCA (https://portal.gdc.cancer.gov/projects/TCGA-BRCA) [84] and TCGA-KIRC (https://portal.gdc.cancer.gov/projects/TCGA-KIRC) [85] projects in the Genomic Data Commons Data Portal. All scripts to reproduce the analyses and simulated data, are available at https://github.com/haibol2016/InPAS_paper. The InPAS R package is freely available as described below.
Project name: InPAS.
Project home page: https://www.bioconductor.org/packages/InPAS/ and https://github.com/jianhong/InPAS.
Operating system(s): Platform independent, but Unix-like operating system is preferred for the best performance.
Programming language: R.
Other requirements: None.
License: GNU GPLv2.
Any restrictions to use by non-academics: None.
LJZ conceived the idea. JO and HL developed the InPAS package. JO, HL, LJZ, and SP designed the InPAS package and helped with debugging and documentation. HL generated and analyzed the simulated data, and analyzed the public datasets and generated all the figures and tables. HL and LJZ interpreted the data. HL and LJZ drafted the manuscript. MRG played a key role in the project’s initial development, contributing both to its conceptualization and its financial support until his passing. All authors were involved in critically reading and editing the manuscript. All authors read and approved the final manuscript. All authors have participated sufficiently in the work and agreed to be accountable for all aspects of the work. JO and HL contributed equally to this work.
Not applicable.
We thank Dr. Sara K. Deibler for her invaluable editing and insightful comments.
This work was supported by NIH grant R01GM035490 to MRG, who passed away unexpectedly on February 10th, 2023.
The authors declare no conflict of interest.
Supplementary material associated with this article can be found, in the online version, at https://doi.org/10.31083/j.fbs1604021.
References
Publisher’s Note: IMR Press stays neutral with regard to jurisdictional claims in published maps and institutional affiliations.