


 , Ksenia Kobzeva 2,†, Anna Dorofeeva 2, Vera Sergeeva 1, Olga Bushueva 2,3,*
1 Department of Anesthesia and Critical Care, Institute of Continuing Education, Kursk State Medical University, 305041 Kursk, Russia
2 Laboratory of Genomic Research, Research Institute for Genetic and Molecular Epidemiology, Kursk State Medical University, 305041 Kursk, Russia
3 Department of Biology, Medical Genetics and Ecology, Kursk State Medical University, 305041 Kursk, Russia
†These authors contributed equally.
Abstract
Background: Comorbidities such as obesity and type 2 diabetes
mellitus (T2DM) have emerged as critical risk factors exacerbating the severity
and mortality of COVID-19. Meanwhile, numerous genome-wide association studies
(GWAS) have identified single nucleotide polymorphisms (SNPs) associated with
increased susceptibility to severe COVID-19. Aim: This study
investigated whether SNPs previously identified by GWAS as risk factors for
severe COVID-19 also correlate with common comorbidities—obesity and T2DM—in
hospitalized patients with severe COVID-19. Methods: DNA
samples from 199 hospitalized COVID-19 patients were genotyped using probe-based
PCR for 10 GWAS SNPs previously implicated in severe COVID-19 outcomes
(rs143334143 CCHCR1, rs111837807 CCHCR1, rs17078346
SLC6A20–LZTFL1, rs17713054 SLC6A20–LZTFL1,
rs7949972 ELF5, rs61882275 ELF5, rs12585036 ATP11A,
rs67579710 THBS3, THBS3-AS1, rs12610495 DPP9,
rs9636867 IFNAR2). Results: The analysis revealed
significant associations between certain SNPs and the increased risk of obesity
and T2DM in severe COVID-19 patients. Specifically, rs17713054
SLC6A20–LZTFL1 (risk allele A; odds ratio (OR) = 2.34, 95%
confidence interval (CI) = 1.24–4.4, p = 0.007) and rs7949972
ELF5 SNP (risk allele T; OR = 1.79, 95% CI = 1.11–2.91, p =
0.015) were associated with increased risk of obesity. SNP rs9636867
IFNAR2 was associated with a higher risk of T2DM (risk allele G, OR =
8.28, 95% CI = 1.69–40.64, p = 0.027). Using the model-based multifactor dimensionality reduction (MB-MDR) approach, the
six most significant gene–gene interaction patterns associated with obesity in
severe COVID-19 patients were identified and included five polymorphic loci:
rs7949972, rs17713054, rs61882275, rs12585036, and rs143334143, participating in
two or more of the most significant G–G interactions (p
Graphical Abstract
Keywords
- GWAS
- COVID-19
- rs17713054
- rs7949972
- rs9636867
- obesity
- type 2 diabetes mellitus
- gene–gene interactions
- gene–environmental interactions
- associations
The Coronavirus disease 2019 (COVID-19) has emerged as a global health crisis, posing significant threats to public health and challenging healthcare systems worldwide [1]. SARS-CoV-2, the virus responsible for COVID-19, has spread rapidly across diverse demographic groups, affecting individuals of all ages, ethnicities, and genders [2, 3, 4]. The spectrum of clinical manifestations associated with COVID-19 ranges from mild respiratory symptoms akin to a common cold to severe conditions such as bronchitis, pneumonia, acute respiratory distress syndrome (ARDS), multi-organ failure, and mortality [5, 6]. As the pandemic unfolded, extensive research efforts were directed toward unraveling the factors contributing to the severity and outcomes of COVID-19 infections.
Genome-wide association studies (GWAS) have been instrumental in identifying single nucleotide polymorphisms (SNPs) associated with increased susceptibility to severe manifestations of COVID-19. Genes such as SLC6A20, LZTFL1, CCR9, FYCO1, CXCR6, XCR1, HLA-DBP1, IFNAR2, ACE2, OAS1, DPP9, TYK2, CCHCR1, and RAVER1 have been implicated in these studies, shedding light on potential genetic determinants of severe COVID-19 and hospitalization [7, 8, 9, 10, 11, 12].
Moreover, it has become increasingly evident that underlying health conditions, known as comorbidities, play a pivotal role in exacerbating the severity of COVID-19 and elevating the risk of adverse outcomes, including mortality [13, 14, 15]. Among the myriad of comorbidities, obesity and type 2 diabetes mellitus (T2DM) have emerged as particularly significant risk factors for severe COVID-19 [16, 17, 18, 19]. Patients with pre-existing conditions such as obesity or T2DM are more prone to experiencing a more aggressive disease course and progression [20, 21]. However, genetic studies on comorbid diseases with COVID-19 are limited, while we are becoming increasingly aware of the long-term consequences of COVID-19 on various organ systems, including the pulmonary, cardiovascular, hematologic, renal, central nervous system, and gastrointestinal [22, 23]. This growing comprehension underscores the imperative to delve deeper into the understanding of COVID-19.
Understanding the intricate interplay between genetic predispositions identified through GWAS and these common comorbidities is imperative for elucidating the complex mechanisms underpinning the severity of COVID-19. In light of these considerations, our study aims to investigate whether SNPs previously identified by GWAS as genetic risk factors for severe COVID-19 are associated with obesity and T2DM in patients with severe COVID-19.
The basic outline of the study is presented in Fig. 1.
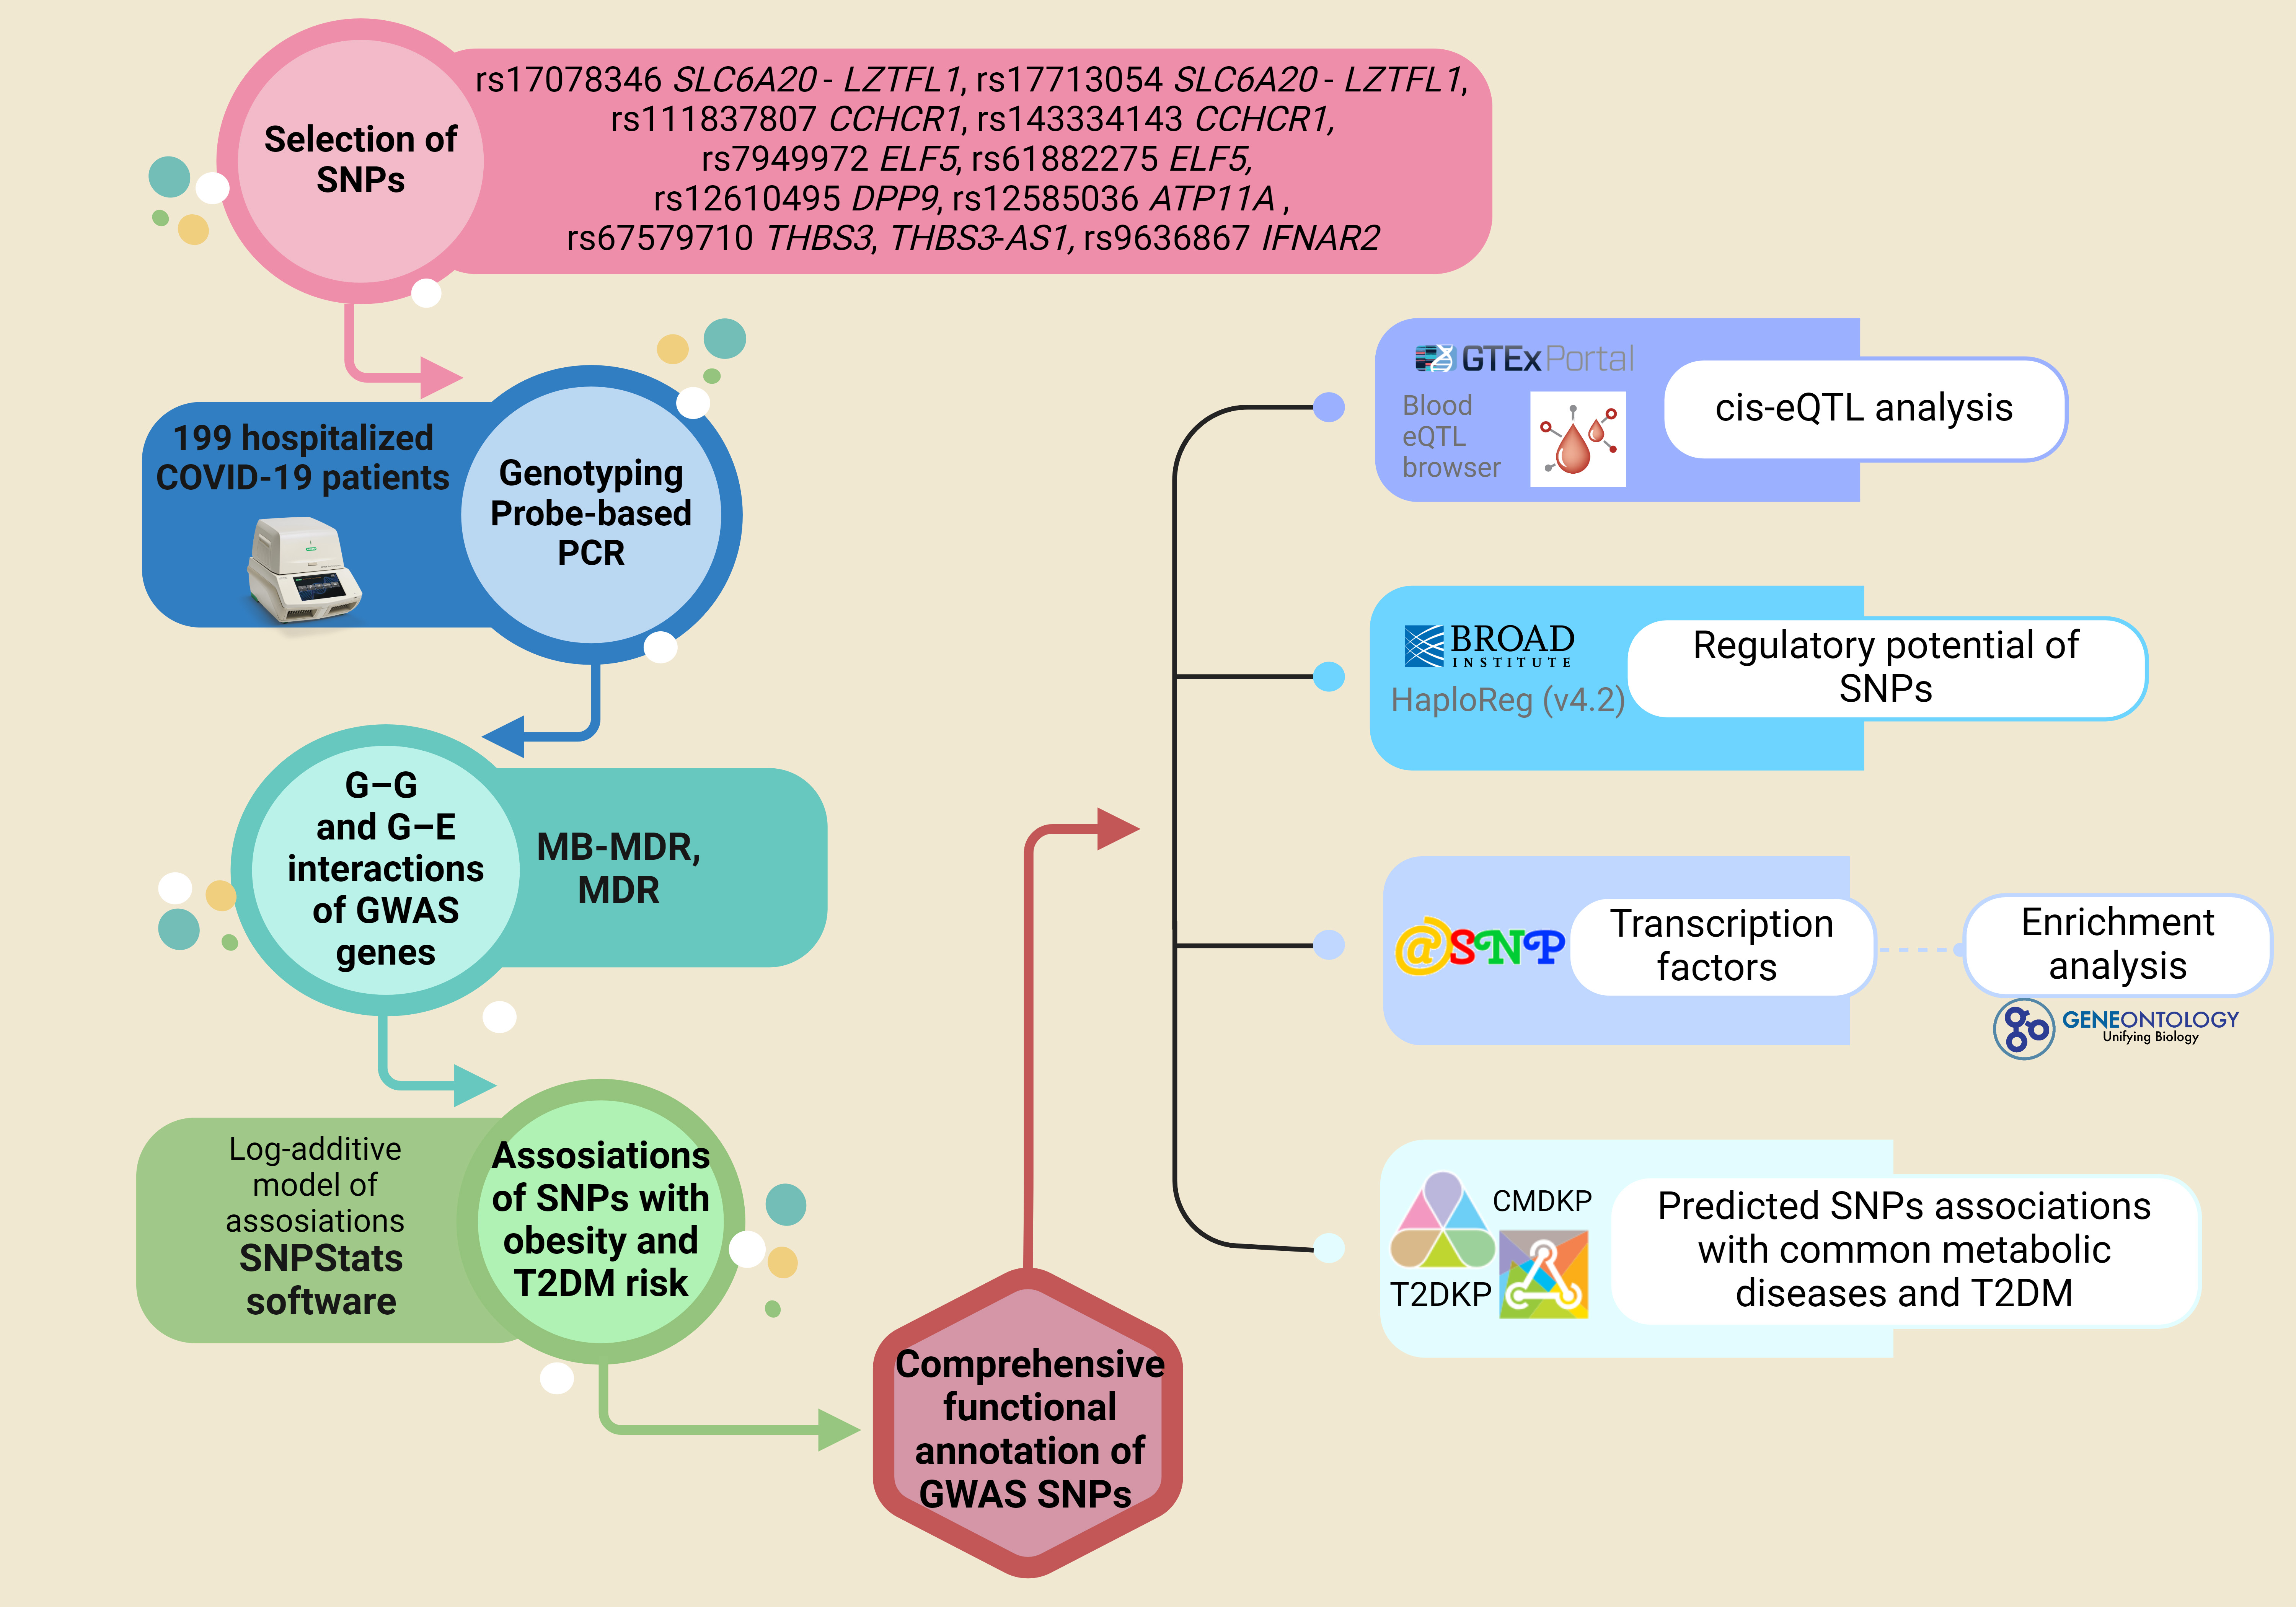 Fig. 1.
Outline of materials and methods used in the study. PCR, polymerase chain reaction; GWAS, genome-wide association studies; MB-MDR, model-based multifactor dimensionality reduction; cis-eQTL, cis-expression quantitative trait loci; SNP, single nucleotide polymorphisms; CMDKP, common metabolic diseases knowledge portal; T2DKP, type 2 diabetes knowledge portal; T2DM, type 2 diabetes mellitus.
The study included 199 hospitalized COVID-19 patients from Central Russia. The Ethical Review Committee of Kursk State Medical University approved the study protocol (protocol No. 1 from January 11, 2022), and all participants provided written informed consent. The inclusion criteria for the study required participants to have self-declared Russian ancestry and to have been born in Central Russia. Table 1 provides the baseline and clinical characteristics of the study cohort.
| Baseline and clinical characteristics | COVID-19 patients without chronic diseases | COVID-19 patients with chronic diseases | p-value | |
| Obesity | ||||
| n = 94 | n = 105 | |||
| Age, Ме (Q1; Q3) | 67 (55; 79) | 58 (61; 78) | ||
| BMI, Ме (Q1; Q3) | 24 (22; 26.7) | 34 (31; 38) | ||
| Gender | Males, N (%) | 53 (56.4%) | 39 (37.1%) | |
| Females, N (%) | 41 (43.6%) | 66 (62.9%) | ||
| Smoking | Yes, N (%) | 33 (35.1%) | 25 (23.8%) | |
| No, N (%) | 61 (64.9%) | 80 (76.2%) | ||
| Low physical activity | Yes, N (%) | 47 (50%) | 63 (60%) | |
| No, N (%) | 47 (50%) | 42 (40%) | ||
| Low fruit/vegetable consumption | Yes, N (%) | 57 (60.6%) | 71 (67.6%) | |
| No, N (%) | 37 (39.4%) | 34 (32.4%) | ||
| Death | Yes, N (%) | 29 (30.9%) | 38 (36.2%) | |
| No, N (%) | 65 (69.1%) | 67 (63.4%) | ||
| T2DM | ||||
| n = 160 | n = 39 | |||
| Age, Ме (Q1; Q3) | 67.5 (55.5; 78) | 69 (64; 78) | ||
| BMI, Ме (Q1; Q3) | 28.15 (23.6; 33.2) | 34 (30.1; 37.7) | ||
| Gender | Males, N (%) | 81 (50.6%) | 11 (28.2%) | |
| Females, N (%) | 79 (49.4%) | 28 (71.8%) | ||
| Smoking | Yes, N (%) | 49 (30.6%) | 30 (76.9%) | |
| No, N (%) | 111 (69.4%) | 9 (23.1%) | ||
| Low physical activity | Yes, N (%) | 85 (53.1%) | 14 (35.9%) | |
| No, N (%) | 75 (46.9%) | 25 (64.1%) | ||
| Low fruit/vegetable consumption | Yes, N (%) | 56 (35%) | 24 (61.5%) | |
| No, N (%) | 104 (65%) | 15 (38.5%) | ||
| Death | Yes, N (%) | 45 (28.1%) | 22 (56.4%) | |
| No, N (%) | 115 (71.9%) | 17 (43.6%) | ||
Statistically significant differences between groups are indicated in bold. BMI, body mass index.
The patients were enrolled in the study during the COVID-19 pandemic from 2020 to 2022 at the intensive care units (ICU) of Kursk Regional Hospital №6 and Kursk Regional Tuberculosis Dispensary. All patients had a PCR-confirmed COVID-19 diagnosis. All patients underwent a complete clinical examination. Qualified doctors established the diagnosis of concomitant diseases based on a full range of clinical and laboratory-instrumental research methods. In our case–control study, all patients with severe COVID-19 were divided into subgroups depending on the presence or absence of T2DM or obesity.
In accordance with the WHO guidelines, low fruit and vegetable consumption was defined as consuming less than 400 g per day. Adequate consumption of fresh vegetables and fruits was defined as consuming 400 g or more, equivalent to 3–4 servings per day, excluding starchy tubers, such as potatoes. Insufficient physical activity was characterized by engaging in less than 180 minutes per week of moderate to vigorous physical activities. This encompassed various forms of exercise, including leisure activities such as walking and running, and fitness club exercises, such as treadmill running, aerobics, or resistance training.
When selecting genes and polymorphisms, we used data from the largest GWAS
meta-analysis studying severe COVID-19, published in 2023 [7]. Our study selected
loci with a p-level significance of
Genotyping of the SNPs was performed using an allele-specific probe-based
polymerase chain reaction (PCR) according to the protocols designed in the
Laboratory of Genomic Research at the Research Institute for Genetic and
Molecular Epidemiology of Kursk State Medical University. The Primer3 software
(https://primer3.ut.ee/) was used for primer
design. A real-time PCR procedure was performed in a 25 µL reaction
solution containing 1.5 units of Hot Start Taq DNA polymerase (Biolabmix,
Novosibirsk, Russia), approximately 10 ng of DNA, and the following
concentrations of reagents: 0.25 µM of each primer; 0.1 µM of each
probe; 250 µM of each dNTP; 3 mM MgCl
STATISTICA software (v13.3, TIBCO Software Inc., Palo Alto, CA, USA) was utilized for statistical processing. The normality of the distribution for quantitative data was assessed using the Shapiro–Wilk test. Most quantitative parameters exhibited deviations from the normal distribution, so they were presented as the median (Me) along with the first and third quartiles (Q1 and Q3). The Kruskal–Wallis test was used to compare quantitative variables among three independent groups. Following that, groups were contrasted pairwise using the Mann–Whitney test, which was also performed to compare quantitative variables among two independent groups. For categorical variables, differences in statistical significance were evaluated using Pearson’s chi-squared test with Yates’s correction for continuity.
The compliance of genotype distributions with Hardy–Weinberg equilibrium was evaluated using Fisher’s exact test. The study groups’ genotype frequencies and associations with disease risk were analyzed using the SNPStats software (https://www.snpstats.net/start.htm). The log-additive model was considered for the genotype association analysis. Associations within the patients with/without obesity or T2DM were adjusted for covariates. Variables that revealed differences in the general clinical characteristics of the study groups were used as covariates.
The model-based multifactor dimensionality reduction (MB-MDR) analysis tested two-, three-, and four-level genotype combinations
(G–G) and genotype–environment combinations (G–E). The empirical
p-value (p
The MDR method also analyzed the most significant G–G and G–E models. The analysis was implemented in the MDR program (v.3.0.2) (http://sourceforge.net/projects/mdr). The MDR method was used to assess the mechanisms of interactions (synergy, antagonism, additive interactions (independent effects)) and the strength of interactions (the contribution of individual genes/environmental factors to the entropy of a trait and the contribution of interactions). The results of the MDR analysis were visualized as a graph.
The functional effects of SNPs were examined using bioinformatics resources, the methodologies and functionalities of which were extensively detailed in our previous studies [25, 26, 27, 28, 29].
• The bioinformatic tool GTExportal (http://www.gtexportal.org/) was used to analyze the expression levels of the studied genes in whole blood, blood vessels, adipose tissue, and pancreas, as well as the expression quantitative trait loci (eQTLs) [30].
• To examine SNPs binding to quantitative expression trait loci (eQTL) in peripheral blood, the eQTLGen resource available at https://www.eqtlgen.org/ was employed [31].
• HaploReg (v4.2), a bioinformatics tool available at https://pubs.broadinstitute.org/mammals/haploreg/haploreg.php, was utilized to assess the associations between SNPs and specific histone modifications indicative of promoters and enhancers. These modifications included acetylation of lysine residues at positions 27 and 9 of the histone H3 protein, as well as mono-methylation at position 4 (H3K4me1) and tri-methylation at position 4 (H3K4me3) of the histone H3 protein. Additionally, the tool was applied to investigate the positioning of SNPs in DNase hypersensitive regions, regulatory motif sites, and locations binding to regulatory proteins [32].
• The atSNP Function Prediction online tool (http://atsnp.biostat.wisc.edu/search) was used to evaluate the impact of SNPs on the gene affinity to transcription factors (TFs) depending on the carriage of the reference/alternative alleles [33]. TFs were included based on the degree of influence of SNPs on the interaction of TFs with DNA and calculated based on a positional weight matrix.
• Using the Gene Ontology online tool (http://geneontology.org/), it was feasible to analyze the joint involvement of TFs linked to the reference/SNP alleles in overrepresented biological processes directly related to the pathogenesis of obesity and T2DM [34]. Biological functions controlled by transcription factors associated with SNPs were used as functional groups.
• Bioinformatic analyses were conducted utilizing the resources provided by the Common Metabolic Diseases Knowledge Portal (https://hugeamp.org/) and the Type 2 Diabetes Knowledge Portal (https://t2d.hugeamp.org/). These portals integrate and analyze data from the largest consortiums dedicated to studying metabolic diseases, facilitating comprehensive investigations into genetic associations, intermediate phenotypes, and risk factors related to obesity and T2DM.
The analysis of associations of genotypes in the entire group (Table 2) revealed a link between rs17713054 SLC6A20–LZTFL1 and rs7949972 ELF5 and the increased risk of obesity. Specifically, the rs17713054 SLC6A20–LZTFL1 demonstrated an odds ratio (OR) = 2.34, 95% confidence interval (CI) = 1.24–4.4, p = 0.007 (risk allele A), while the rs7949972 ELF5 exhibited an OR = 1.79, 95% CI = 1.11–2.91, p = 0.015 (risk allele T).
| Genetic variant | Effect allele | Other allele | N | OR [95% CI] |
p |
| rs143334143 CCHCR1 | A | G | 185 | 1.38 [0.67–2.82] | 0.38 |
| rs111837807 CCHCR1 | C | T | 185 | 1.73 [0.80–3.75] | 0.16 |
| rs17713054 SLC6A20–LZTFL1 | A | G | 186 | 2.34 [1.24–4.40] | 0.007 |
| rs17078346 SLC6A20–LZTFL1 | C | A | 187 | 1.69 [0.94–3.07] | 0.078 |
| rs12585036 ATP11A | T | C | 184 | 0.84 [0.49–1.42] | 0.5 |
| rs12610495 DPP9 | G | A | 183 | 1.56 [1.00–2.42] | 0.046 |
| rs61882275 ELF5 | A | G | 185 | 1.43 [0.97–2.12] | 0.072 |
| rs7949972 ELF5 | T | C | 185 | 1.79 [1.11–2.91] | 0.015 |
| rs9636867 IFNAR2 | G | A | 186 | 1.15 [0.75–1.75] | 0.53 |
| rs67579710 THBS3, THBS3-AS1 | A | G | 184 | 0.97 [0.42–2.20] | 0.93 |
All calculations were performed relative to the minor alleles (effect allele) with adjustment for sex. 1: odds ratio (OR) and 95% confidence interval (CI); 2: p-value; statistically significant differences are marked in bold.
Subsequently, in the entire group of patients (Table 3), rs9636867 IFNAR2 was associated with a higher risk of T2DM (risk allele G, OR = 8.28, 95% CI = 1.69–40.64, p = 0.027).
| Genetic variant | Effect allele | Other allele | N | OR [95% CI] |
p |
| rs143334143 CCHCR1 | A | G | 185 | 0.75 [0.07–8.04] | 0.89 |
| rs111837807 CCHCR1 | C | T | 185 | 0.09 [0.01–0.78] | 0.81 |
| rs17713054 SLC6A20–LZTFL1 | A | G | 186 | 0.72 [0.32–1.63] | 0.42 |
| rs17078346 SLC6A20–LZTFL1 | C | A | 187 | 0.79 [0.37–1.66] | 0.52 |
| rs12585036 ATP11A | T | C | 184 | 0.30 [0.07–1.28] | 0.085 |
| rs12610495 DPP9 | G | A | 183 | 2.38 [0.73–7.78] | 0.14 |
| rs61882275 ELF5 | A | G | 185 | 1.91 [0.69–5.26] | 0.21 |
| rs7949972 ELF5 | T | C | 185 | 2.00 [0.66–6.10] | 0.22 |
| rs9636867 IFNAR2 | G | A | 186 | 8.28 [1.69–40.64] | 0.0027 |
| rs67579710 THBS3, THBS3-AS1 | A | G | 184 | 1.15 [0.18–7.38] | 0.89 |
All calculations were performed relative to the minor alleles (effect allele) with adjustments for sex, BMI, smoking, and fruit/vegetable intake. 1: odds ratio (OR) and 95% confidence interval (CI); 2: p-value; statistically significant differences are marked in bold.
Using the MB-MDR approach, the six most significant gene–gene interaction
patterns associated with obesity in patients with severe COVID-19 were
identified: Three two-locus, two three-locus, and one four-locus
(p
| Gene–gene interaction models | NH | beta H | WH | NL | beta L | WL | Wmax | p |
| The best two-locus models of intergenic interactions (for G–G models with p | ||||||||
| rs7949972 ELF5 × rs17713054 SLC6A20–LZTFL1 | 1 | 0.445 | 3.284 | 1 | –0.251 | 10.332 | 10.33 | 0.016 |
| rs61882275 ELF5 × rs17713054 SLC6A20–LZTFL1 | 0 | NA | NA | 1 | –0.2458 | 9.872 | 9.872 | 0.022 |
| rs12585036 ATP11A× rs17713054 SLC6A20–LZTFL1 | 1 | 0.246 | 4.173 | 1 | –0.2295 | 7.876 | 7.876 | 0.024 |
| The best three-locus models of intergenic interactions (for G–G models with p | ||||||||
| rs7949972 ELF5 × rs12585036 ATP11A× rs17713054 SLC6A20–LZTFL1 | 2 | 0.262 | 10.06 | 3 | –0.3308 | 22.361 | 22.36 | 0.001 |
| rs61882275 ELF5 × rs12585036 ATP11A× rs143334143 CCHCR1 | 2 | 0.319 | 8.93 | 3 | –0.3558 | 16.643 | 16.64 | 0.002 |
| The best four-locus models of gene–gene interactions (for G–G models with p | ||||||||
| rs61882275 ELF5 × rs12585036 ATP11A× rs17713054 SLC6A20–LZTFL1 × rs143334143 CCHCR1 | 1 | 0.318 | 2.884 | 3 | –0.4935 | 25.860 | 25.86 | 0.001 |
NH, number of interacting high-risk genotypes; beta H: the
regression coefficient for high-risk interactions identified at the second stage
of analysis; WH: Wald statistics for high-risk interactions; NL: the number of
interacting low-risk genotypes; beta L: regression coefficient for low-risk
interactions identified at the second stage of analysis; WL: Wald statistics for
low-risk interactions; p
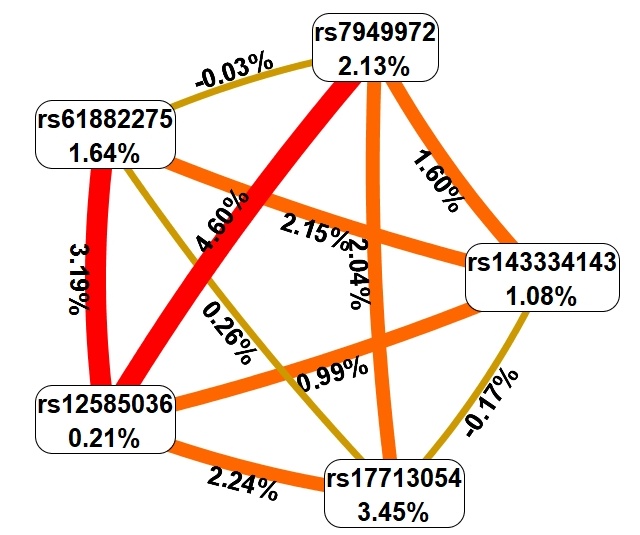 Fig. 2.
Graph reflecting the structure and power of the most significant G–G interactions of GWAS loci associated with obesity in patients with severe COVID-19. The color of the lines reflects the nature of the interaction: red and orange lines mean strong and moderate synergism, brown means additive (independent) effects, and % reflects the strength and direction of the phenotypic effect of gene–gene interaction (% of entropy).
First, MDR showed that the genetic variants included in the best G–G models are
characterized predominantly by moderate and pronounced synergism, except for SNP
rs17713054, which showed additive (independent) effects (in interaction with
rs61882275 and rs143334143); in addition, additive effects were observed when
analyzing the interactions of rs61882275 and rs7949972. Secondly, the effects of
intergenic interactions (trait entropy indicators: 0.03%–4.60%) were
comparable to the mono-effects of SNPs (entropy indicators: 0.21%–3.45%).
Thirdly, the following combinations of genotypes of polymorphic gene variants
have the strongest correlations with obesity in patients with severe COVID-19:
rs7949972 ELF5 C/C
Using the MB-MDR approach, the six most significant gene–gene interaction
patterns associated with type 2 diabetes mellitus in patients with severe
COVID-19 were identified: Three three-locus and three four-locus models
(p
| Gene–gene interaction models | NH | beta H | WH | NL | beta L | WL | Wmax | p |
| The best three-locus models of intergenic interactions (for G–G models with p | ||||||||
| rs9636867 IFNAR2 × rs67579710 THBS3, THBS3-AS1 × rs12585036 ATP11A | 4 | 0.4170 | 18.76 | 1 | –0.2586 | 9.095 | 18.76 | 0.035 |
| rs7949972 ELF5 × rs67579710 THBS3, THBS3-AS1 × rs12585036 ATP11A | 3 | 0.3377 | 15.93 | 1 | –0.1932 | 5.111 | 15.93 | 0.038 |
| rs7949972 ELF5 × rs12610495DPP9× rs143334143 CCHCR1 | 3 | 0.4483 | 18.69 | 2 | –0.1830 | 7.343 | 18.69 | 0.047 |
| The best four-locus models of gene–gene interactions (for G–G models with p | ||||||||
| rs67579710 THBS3, THBS3-AS1 × rs61882275 ELF5 × rs12610495 DPP9× rs11183780 CCHCR1 | 5 | 0.4857 | 36.44 | 1 | –0.1362 | 3.218 | 36.44 | 0.015 |
| rs7949972 ELF5 × rs67579710 THBS3, THBS3-AS1 × rs12610495 DPP9× rs143334143 CCHCR1 | 6 | 0.4857 | 36.44 | 1 | –0.1362 | 3.218 | 36.44 | 0.019 |
| rs67579710 THBS3, THBS3-AS1 × rs61882275 ELF5 × rs12610495 DPP9× rs143334143 CCHCR1 | 5 | 0.4933 | 34.37 | 1 | –0.1344 | 3.143 | 34.37 | 0.030 |
NH, number of interacting high-risk genotypes; beta H: regression
coefficient for high-risk interactions identified at the second stage of
analysis; WH: Wald statistics for high-risk interactions; NL: number of
interacting low-risk genotypes; beta L: regression coefficient for low-risk
interactions identified at the second stage of analysis; WL: Wald statistics for
low-risk interactions; p
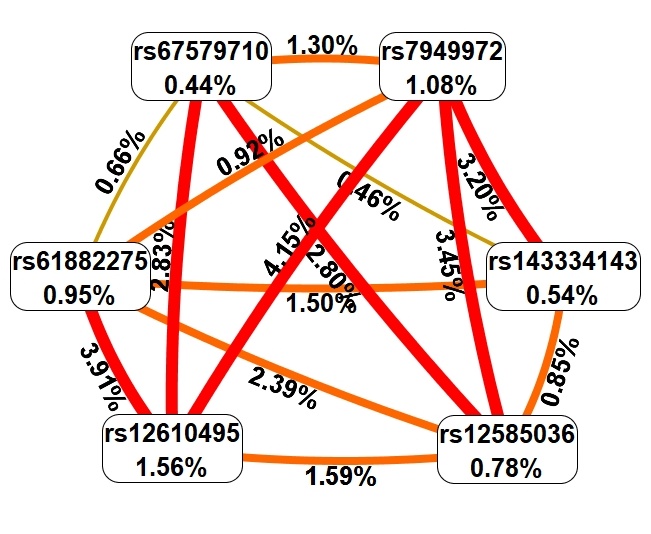 Fig. 3.
Graph reflecting the structure and power of the most significant G–G interactions of GWAS loci associated with T2DM in patients with severe COVID-19. The color of the lines reflects the nature of the interaction: red and orange lines mean strong and moderate synergism, brown means additive (independent) effects, and % reflects the strength and direction of the phenotypic effect of gene–gene interaction (% of entropy).
First, MDR showed that genetic variants included in two or more best G–G models
are characterized mainly by moderate and pronounced synergism, except for SNP
rs143334143, which showed additive (independent) effects (in interaction with
rs67579710 and rs12610495), as well as rs67579710 (in interaction with
rs143334143 and rs61882275). Secondly, the effects of intergenic interactions
(maximum entropy indicators of a trait: 4.15%) exceeded the mono-effects of SNPs
(maximum entropy indicators: 1.56%). Thirdly, the following combinations of
genotypes of polymorphic gene variants have the strongest correlations with T2DM
in patients with severe COVID-19: rs9636867 IFNAR2 G/G
Using the MB-MDR approach, the nine most significant models of gene–environment
interactions associated with obesity in patients with severe COVID-19 were
identified: Two two-level models, four three-order models, and three four-level
models (p
| Gene–environmental interaction models | NH | beta H | WH | NL | beta L | WL | Wmax | p |
| The best two-order models of gene–environmental interactions (for G–E models with p | ||||||||
| PHYS × rs7949972 ELF5 | 2 | 0.2248 | 8.293 | 0 | NA | NA | 8.293 | 0.011 |
| VEGET × rs17713054 SLC6A20 - LZTFL1 | 1 | 0.2290 | 6.287 | 0 | NA | NA | 6.287 | 0.027 |
| The best three-order models of gene–environmental interactions (for G–E models with p | ||||||||
| SMOKE × rs61882275 ELF5 × rs12610495 DPP9 | 2 | 0.4831 | 12.454 | 1 | –0.3543 | 3.561 | 12.454 | 0.032 |
| SMOKE × rs7949972 ELF5 × rs17713054 SLC6A20 - LZTFL1 | 1 | 0.4550 | 3.413 | 2 | –0.2661 | 11.032 | 11.032 | 0.017 |
| SMOKE × rs61882275 ELF5 × rs143334143 CCHCR1 | 2 | 0.3236 | 10.790 | 1 | –0.2445 | 3.230 | 10.790 | 0.032 |
| SMOKE × rs61882275 ELF5 × rs17713054 SLC6A20 - LZTFL1 | 2 | 0.3339 | 6.548 | 2 | –0.2608 | 10.561 | 10.561 | 0.030 |
| The best four-order models of gene–environmental interactions (for G–E models with p | ||||||||
| VEGET × rs61882275 ELF5 × rs12585036 ATP11A× rs143334143 CCHCR1 | 4 | 0.3960 | 19.827 | 3 | –0.4303 | 13.324 | 19.83 | 0.003 |
| SMOKE × rs9636867 IFNAR2 × rs17078346 SLC6A20 - LZTFL1 × rs12585036 ATP11A | 1 | 0.2298 | 4.641 | 3 | –0.4293 | 19.319 | 19.32 | 0.007 |
| VEGET × rs61882275 ELF5 × rs12585036 ATP11A× rs11183780 CCHCR1 | 4 | 0.3876 | 17.905 | 1 | –0.3132 | 3.904 | 17.90 | |
NH, number of high-risk interactions; beta H: regression coefficient
for high-risk interactions identified at the second stage of analysis; WH: Wald
statistics for high-risk interactions; NL: number of interacting low-risk
interactions; beta L: regression coefficient for low-risk interactions identified
at the second stage of analysis; WL: Wald statistics for low-risk interactions;
p
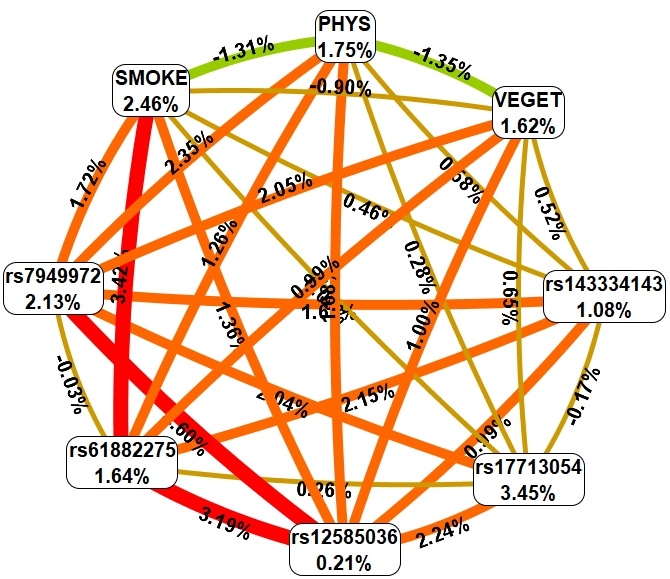 Fig. 4.
Graph reflecting the structure and power of the most significant G–E interactions of GWAS loci associated with obesity in patients with severe COVID-19. The color of the lines reflects the nature of the interaction: red and orange lines mean strong and moderate synergism, brown means additive (independent) effects, and % reflects the strength and direction of the phenotypic effect of gene–gene interaction (% of entropy).
First, MDR found that the environmental risk factor level of physical activity
exhibited moderate antagonism in interaction with smoking and fresh fruit and
vegetable consumption. Secondly, environmental risk factors are characterized by
both moderate/pronounced synergism and additive (independent) effects in
interaction with genetic variants included in two or more of the most significant
models of gene–environment interactions. Thirdly, the mono-effects of
environmental factors (contribution to the entropy of the trait is
1.62%–2.46%) are comparable to the mono-effects of SNPs (contribution to the
entropy of the trait is 0.21%–3.45%). Fourth, the effects of gene–environment
interactions (contribution to entropy: 0.09%–3.42%) are comparable to the
mono-effects of environmental factors and SNPs included in the most significant
G–E interactions (contribution to trait entropy: 0.21%–3.45%). Fifthly, the
following gene–environmental interactions have the strongest correlations with
obesity in patients with severe COVID-19: PHYS 1
Using the MB-MDR approach, the three most significant models of
gene–environment interactions associated with the development of T2DM in
patients with severe COVID-19 were identified, and after a permutation test, a
statistically significant level of p
| Gene–environmental interaction models | NH | beta H | WH | NL | beta L | WL | Wmax | p |
| The best three-order models of gene-environmental interactions (for G–E models with p | ||||||||
| PHYS × rs67579710 THBS3, THBS3-AS1 × rs12585036 ATP11A | 1 | 0.799 | 18.62 | 0 | NA | NA | 18.62 | 0.001 |
| PHYS × rs7949972 ELF5 × rs12610495 DPP9 | 2 | 0.373 | 16.95 | 0 | NA | NA | 16.95 | 0.016 |
| PHYS × rs61882275 ELF5 × rs12610495 DPP9 | 2 | 0.343 | 14.91 | 0 | NA | NA | 14.91 | 0.029 |
NH, number of high-risk interactions; beta H: regression coefficient
for high-risk interactions identified at the second stage of analysis; WH: Wald
statistics for high-risk interactions; NL: number of interacting low-risk
interactions; beta L: regression coefficient for low-risk interactions identified
at the second stage of analysis; WL: Wald statistics for low-risk interactions;
p
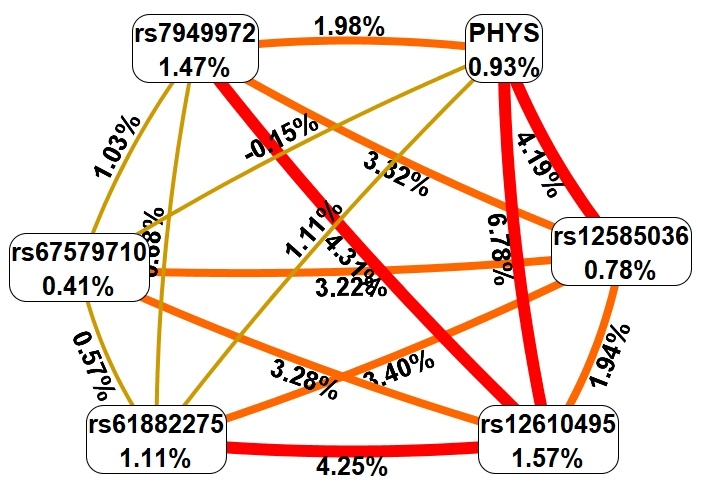 Fig. 5.
Graph reflecting the structure and power of the most significant G–E interactions of GWAS loci associated with T2DM in patients with severe COVID-19. The color of the lines reflects the nature of the interaction: red and orange mean strong and moderate synergism, brown means additive (independent) effects, and % reflects the strength and direction of the phenotypic effect of gene–gene interaction (% of entropy).
Firstly, MDR revealed that the mono-effect of physical inactivity (0.93% of
trait entropy) is comparable to the mono-effects of SNPs of genes included in the
most significant gene–environment interactions (0.41%–1.57% of entropy).
Secondly, the effects of gene–environment interactions (maximum entropy values:
6.78%) exceed the mono-effects of physical inactivity (0.93%) and the
mono-effects of SNPs (0.41%–1.57% entropy). Thirdly, physical inactivity is
characterized by moderate and pronounced synergism in interaction with all
genetic variants included in the best G–E models, except for interactions with
rs67579710 and rs61882275, in which physical inactivity was characterized by
independent (additive) effects. Fourthly, the effects of interactions of genetic
variants included in the most significant G–E models (maximum entropy
indicators: 4.31%) are comparable to the effects of genotype–environment
interactions (maximum entropy indicators: 6.78%). Fifthly, the following
gene–environment interactions have the strongest correlations with T2DM in
patients with severe COVID-19: PHYS 1
According to findings from the eQTLGen Browser, rs17713054 SLC6A20–LZTFL1 was correlated with a decrease in the expression levels of FLT1P1, CCR3, CCR1, SACM1L, CCR5, CCR2, RP11-24F11.2, and CXCR6 in blood, while it was associated with an increase in CCR9 expression. Furthermore, data from the GTEx Portal revealed that rs17713054 SLC6A20–LZTFL1 was linked to reduced expression levels of CXCR6 in tibial and subcutaneous adipose tissues, along with an elevation in LZTFL1 expression in subcutaneous adipose tissue (Table 8).
| SNP | Effect allele | Gene expressed | Z-score | p-value | FDR | Gene expressed | p-value | Effect (NES) | Tissue |
| eQTLGen Browser | GTEx Portal Data | ||||||||
| rs17713054 | A | FLT1P1 | ↓ (–15.12) | 1.4 × 10 |
0 | CXCR6 | 1.7 × 10 |
↓ (–0.42) | Artery–tibial |
| SLC6A20–LZTFL1 | CCR3 | ↓ (–14.34) | 1.2 × 10 |
0 | |||||
| (G/A) | CXCR6 | ↓ (–13.93) | 4.2 × 10 |
0 | CXCR6 | 6.7 × 10 |
↓ (–0.30) | Adipose–subcutaneous | |
| CCR1 | ↓ (–7.42) | 1.2 × 10 |
0 | ||||||
| SACM1L | ↓ (–5.77) | 8.1 × 10 |
0.00006 | LZTFL1 | 1.0 × 10 |
↑ (0.21) | Adipose–subcutaneous | ||
| CCR5 | ↓ (–5.21) | 1.9 × 10 |
0.0006 | ||||||
| CCR9 | ↑ (5.11) | 3.3 × 10 |
0.001 | CCR9 | 1.6 × 10 |
↑ (0.33) | Whole blood | ||
| CCR2 | ↓ (–4.97) | 6.7 × 10 |
0.002 | ||||||
| RP11-24F11.2 | ↓ (–4.63) | 3.6 × 10 |
0.01 | ||||||
| rs7949972 | T | CAT | ↓ (–56.03) | 3.3 × 10 |
0 | CAT | 3.2 × 10 |
↓ (–0.25) | Whole blood |
| ELF5 | CAT | 4.3 × 10 |
↓ (–0.15) | Artery–tibial | |||||
| (C/T) | ABTB2 | ↓ (–15.16) | 6.1 × 10 |
0 | ABTB2 | 0.00007 | ↓ (–0.17) | Whole blood | |
| rs9636867 | G | IFNAR2 | ↓ (–34.8) | 2.8 × 10 |
0 | IFNAR2 | 1.3 × 10 |
↓ (–0.24) | Adipose–subcutaneous |
| IFNAR2 | IL10RB | ↑ (22.35) | 1.1 × 10 |
0 | IL10RB | 2.1 × 10 |
↑ (0.15) | Adipose–subcutaneous | |
| (A/G) | IL10RB | 0.00007 | ↑ (0.15) | Adipose–visceral (Omentum) | |||||
| IL10RB | 3.7 × 10 |
↑ (0.15) | Artery–tibial | ||||||
| IFNAR2 | 7.3 × 10 |
↓ (–0.16) | Pancreas | ||||||
Effect alleles are marked in bold.
Additionally, rs7949972 ELF5 was found to decrease the expression levels of CAT in whole blood and the tibial artery, while ABTB2 expression was reduced specifically in whole blood due to the influence of this SNP (Table 8). Moreover, rs9636867 IFNAR2 was associated with decreased expression of IFNAR2 in blood, subcutaneous adipose tissue, and pancreas while increasing the expression levels of IL10RB in blood, subcutaneous and visceral adipose tissues, and the tibial artery (Table 8).
Using the bioinformatics tool HaploReg (v4.2), we analyzed histone modifications associated with SNPs identified in our study as linked to an increased risk of obesity and T2DM (Table 9).
| SNP (Ref/Alt allele) | Tissues marks | Vessels–aorta | Blood | Adipose tissue | Pancreas |
| rs17713054 | H3K4me1 | Enh | - | Enh | Enh |
| SLC6A20–LZTFL1 | H3K4me3 | - | - | - | - |
| (G/A) | H3K27ac | Enh | - | - | Enh |
| rs9636867 | H3K4me1 | Enh | Enh | Enh | Enh |
| IFNAR2 | H3K4me3 | - | Pro | Pro | Pro |
| (A/G) | H3K27ac | - | Enh | Enh | - |
| H3K9ac | - | Pro | Pro | - | |
| DNase | - | DNase | - | - |
H3K4me1, mono-methylation at the fourth lysine residue of the histone H3 protein; H3K4me3, tri-methylation at the fourth lysine residue of the histone H3 protein; H3K9ac, the acetylation at the ninth lysine residues of the histone H3 protein; H3K27ac, acetylation of the lysine residues at N-terminal position 27 of the histone H3 protein; effect alleles are marked in bold. Enh: histone modification in the enhancer region; Pro: histone modification at the promoter region.
SNP rs17713054 SLC6A20–LLZTFL1 is situated in a DNA-binding region associated with histone H3 monomethylation at the fourth lysine residue (H3K4me1) in the aorta and adipose tissue. Moreover, H3K27ac, which marks enhancers, particularly in the aorta, is further influenced by this SNP. As for SNP rs9636867 IFNAR2, it is positioned in the DNA binding region of H3K4me1 in the aorta, blood, adipose tissue, and pancreas, as well as H3K4me3 in blood, adipose tissue, and pancreas. The effect of these histone tags is increased by the H3K27ac, marking enhancers in blood cells and adipose tissue, and the H3K9ac, marking promoters in blood cells and adipose tissue. Notably, SNP rs9636867 IFNAR2 is localized in the DNA region hypersensitive to DNase-1 in the blood.
The risk allele A of rs17713054 SLC6A20–LZTFL1 is associated
with the generation of DNA binding sites for 48 transcription factors (TFs),
participating in fat cell differentiation (GO:0045444; FDR = 3.45
Meanwhile, the risk allele T rs7949972 ELF5 creates DNA binding sites for 31 TFs, involved in pituitary gland development (GO:0021983; FDR = 0.00477), fat cell differentiation (GO:0045444; FDR = 0.00478), response to peptide hormone (GO:0043434; FDR = 0.0233) (Supplementary Table 6).
Moreover, the risk allele G rs9636867 IFNAR2 generates binding sites for 60 TFs, associated with two overrepresented biological processes: negative regulation of endoplasmic reticulum stress-induced intrinsic apoptotic signaling pathway (GO:0071499; FDR = 0.0447), cellular response to oxidative stress (GO:0034599; FDR = 0.00909) (Supplementary Table 7).
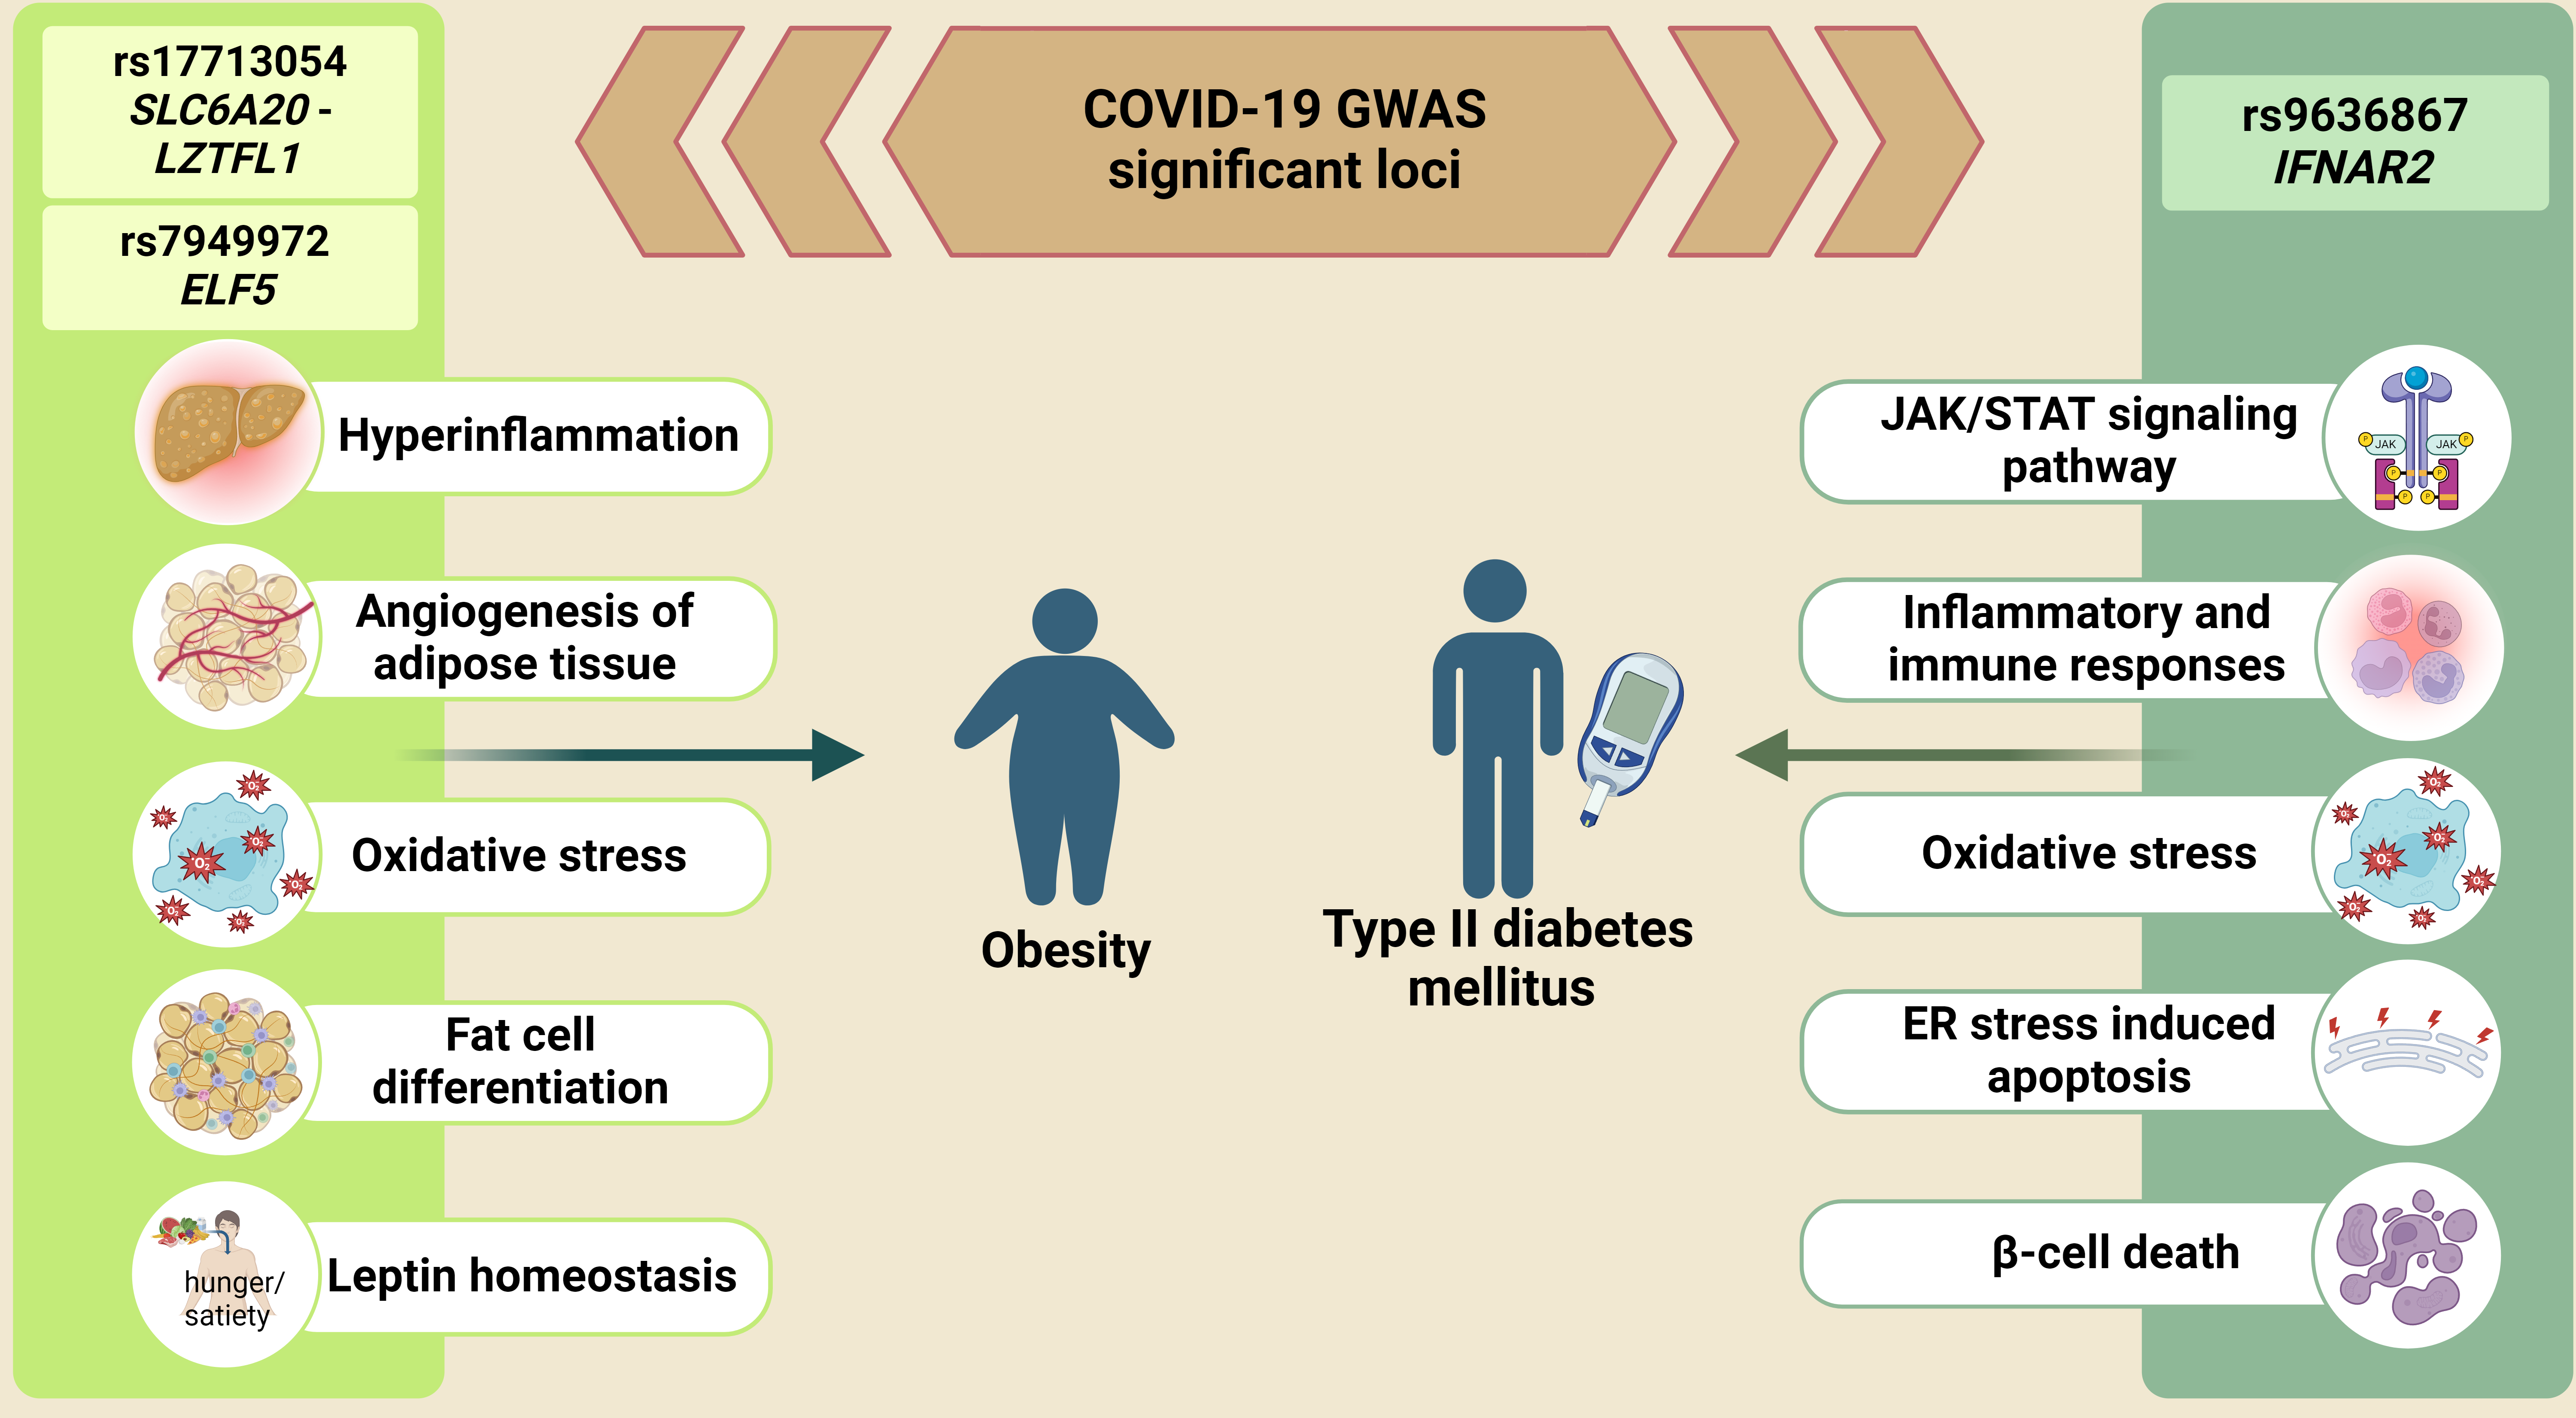
We evaluated the association of severe COVID-19 GWAS-significant SNPs rs17713054 SLC6A20–LZTFL1 and rs7949972 ELF5 with an increased risk of obesity, as well as rs9636867 IFNAR2 with an increased risk of T2DM. It is also worth noting that the SNPs rs7949972, rs61882275, rs12585036, rs17713054, rs143334143, and rs67579710 were involved in the most significant models of gene–gene interactions. The contribution of G–G interactions to the entropy of obesity and T2DM was comparable to/exceeded the mono-effects of genetic variants, which indicates the significant role of epistatic interactions between GWAS-significant loci in the susceptibility to severe COVID-19.
Numerous studies have examined the role of GWAS-significant genes in COVID-19 pathogenesis; they have primarily focused on processes critical to SARS-CoV-2 infection and progression. The genes SLC6A20 and LZTFL1 are potentially relevant to COVID-19 through their interaction with angiotensin-converting enzyme 2, the receptor for SARS-CoV-2 [35]. ELF5 is suggested to be involved in viral entry and wound healing [36]. IFNAR2, as a receptor for interferons, plays a crucial role in regulating inflammation and immune responses [37].
Our study found an association between rs17713054 SLC6A20–LZTFL1 and an increased risk of obesity. It is noteworthy that when analyzing gene–gene interactions, this genetic variant showed the most powerful mono-effect (3.45% contribution to the entropy of the trait) and was comparable to/exceeded the effects of intergenic interactions (Fig. 2). Previous research supports this correlation in several ways. Firstly, LZTFL1 is associated with Bardet–Biedl syndrome, which includes obesity among its symptoms [38]. Secondly, LZTFL1 regulates leptin signaling and participates in the LepRb signaling pathway in the hypothalamus, which is crucial for energy homeostasis [39]. Elevated circulating leptin levels are often linked to leptin resistance [40], a characteristic feature of obesity [41, 42, 43]. Finally, Lztfl1 knockout mice exhibit hyperphagia, leptin resistance, and obesity [44].
Our bioinformatic analysis uncovered more potential explanations for the link between rs17713054 SLC6A20–LZTFL1 and obesity. More specifically, rs17713054 SLC6A20–LZTFL1 was characterized by high regulatory potential, marked by histone modifications in adipose tissue. The risk allele A rs17713054 SLC6A20–LZTFL1 also had strong cis-eQTL effects. This SNP is linked to decreased FLT1P1 expression in blood. FLT1P1 is known for its role in regulating the expression of vascular endothelial growth factor receptor 1 (VEGFR1) [45]. Endothelial growth factors (VEGFs) and their receptors (VEGFRs) can enhance angiogenesis in both brown and white fat, activating thermogenesis and ultimately reducing body weight through increased energy expenditure [46]. Moreover, the eQTL effects of rs17713054 on the expression levels of chemokine receptors (CCR1, CCR2, CCR3, CCR5, CCR9, CXCR6) were observed. Chemokines and chemokine receptors facilitate the development of obesity by promoting and/or supporting inflammatory leukocyte influx, especially recruitment of proinflammatory monocytes, into hypertrophic fat tissue [47]. Excessive expansion of adipose tissue triggers this pathway, thus exacerbating obesity and related comorbidities [48], such as insulin resistance and nonalcoholic fatty liver disease [49]. Furthermore, among other genes with altered expression levels influenced by rs17713054 was SACM1L. SACM1L mediates lipid transfer between closely opposed ER and endosomal membranes, along with several other lipid transfer proteins [50]. One study observed SACM1L to be upregulated in patients with insulin resistance, a condition associated with obesity [51].
TFs binding to the risk allele A rs17713054 were associated with the transforming growth factor beta receptor signaling pathway (GO:0007179), mostly responsible for the regulation of white and brown adipocyte differentiation, adipose tissue fibrosis, and adipocyte metabolic and endocrine functions [52]. Moreover, risk allele A rs17713054 created binding sites for TFs jointly involved in fat cell differentiation (GO:004544), further supporting the association between rs17713054 and obesity.
Based on our findings, allele T rs7949972 ELF5 was associated with an
increased risk of obesity and showed a rather pronounced mono-effect when
analyzing intergenic interactions (2.13% contribution to the entropy of the
trait), and was also characterized by the most pronounced interaction with
rs12585036 ATP11A (4.60% contribution to obesity) (Fig. 2).
ELF5 belongs to the erythroblast transformation-specific (Ets) transcription
factor family. Through cis-eQTL mechanisms, rs7949972 ELF5 exerts
regulatory effects on gene expression, particularly downregulating catalase
(CAT) expression in various tissues, including whole blood and the
tibial artery. Catalase, a well-known antioxidant enzyme, is implicated in
multiple severe chronic human conditions, including cardiovascular and metabolic
diseases [53, 54, 55]. Studies on catalase-knockout mice suggest a potential link
between excessive hydrogen peroxide (H
Our investigation also found an association between the IFNAR2 SNP
rs9636867 and the risk of T2DM. Interferon
Through cis-eQTL effects, the rs9636867 IFNAR2 variant modulated the expression of IFNAR2 in blood, adipose tissue, and the pancreas while also influencing IL10RB expression in blood and adipose tissues. Importantly, individuals with T2DM often exhibit a low-grade chronic inflammatory state characterized by elevated levels of cytokines and adipokines, along with activation of proinflammatory pathways [62]. Notably, knockdown experiments targeting IFNAR2 have shown inhibitory effects on inflammatory responses in mice with type 1 diabetes (T1D) [63]. Thus, the dysregulation of IFNAR2 and IL10RB expression, as influenced by the genetic variant rs9636867, may disrupt the delicate balance of inflammatory and immune responses, ultimately contributing to the development and progression of T2DM.
Interestingly, rs9636867 IFNAR2 exhibited high regulatory potential, having histone modifications in blood, adipose tissue, and the pancreas, along with a DNase-sensitive region in blood.
Risk allele G rs9636867 IFNAR2 generates DNA binding sites for TFs that
are involved in cellular responses to oxidative stress (GO:0034599) and negative
regulation of the endoplasmic reticulum stress-induced intrinsic apoptotic
signaling pathway (GO:0071499). These pathways are pivotal in maintaining
cellular health and function, particularly in insulin production and glucose
homeostasis [64]. Dysregulation of these pathways can lead to T2DM progression.
The ER is integral to protein synthesis, folding, and cell quality control.
Chronic hyperglycemia and hyperlipidemia, common features of T2DM, can disrupt ER
homeostasis, triggering an unresolved unfolded protein response (UPR) and
eventual
Furthermore, studies have provided additional evidence supporting the role of allele G rs9636867 IFNAR2 in the pathogenesis of T2DM. Notably, research has shown that this allele is associated with increased levels of HbA1c [66], a key indicator of hyperglycemia, and a higher BMI [67], a risk factor for T2DM development.
Moreover, several genome-wide association studies (GWAS) have implicated rs9636867 IFNAR2 in various complications observed in diabetic patients. These include peripheral artery disease in individuals with T2DM [68], macroalbuminuria in those with T1D [69], and severe diabetic kidney disease [70]. Collectively, these findings provide robust support for our conclusion that allele G rs9636867 IFNAR2 contributes to an elevated risk of T2DM.
Our study assessed the associations between GWAS significant loci with the risk of T2DM and obesity in patients with severe COVID-19. We identified the most significant intergenic and gene–environment interactions and conducted a comprehensive functional annotation of SNPs associated with T2DM and obesity to analyze their involvement in the molecular mechanisms of these diseases. Our findings suggest that GWAS loci rs17713054 and rs7949972, previously linked to severe COVID-19, intergenic interactions of rs7949972, rs17713054, rs61882275, rs12585036, rs143334143, and gene–environmental interactions of rs17713054, rs61882275, rs12585036, rs143334143, and rs7949972 with physical inactivity, fruit/vegetable intake and smoking are associated with an increased risk of obesity in hospitalized patients with severe COVID-19. Similarly, the GWAS locus rs9636867, intergenic interactions of rs7949972, rs61882275, rs12585036, rs143334143, rs67579710, rs12610495, and gene–environmental interactions of rs7949972, rs61882275, rs12585036, rs67579710, rs12610495 and physical inactivity are associated with a higher risk of T2DM in hospitalized patients with severe COVID-19. Using bioinformatics tools, we established the high regulatory potential of the studied SNPs and identified the mechanisms through which they can participate in the risk of obesity and T2DM, primarily through their binding to transcription factors and expression quantitative trait loci.
Firstly, the study was constrained by a limited number of cases due to the difficulty in obtaining informed consent from severely ill hospitalized patients. This limitation may have reduced the statistical power, potentially leading to missed associations with the risk of T2DM and obesity. Secondly, we focused exclusively on 10 significant SNPs identified by GWAS and did not investigate other genes implicated in the progression of severe COVID-19. Thirdly, we lacked data on significant biochemical parameters for T2DM, such as glycated hemoglobin (HbA1C) and fasting blood glucose (FBG). Consequently, we could not assess the correlations between these parameters and the GWAS SNPs. Additionally, some obese patients also had T2DM. Given that these two diseases are pathogenetically related and can even serve as risk factors for the progression of each other, such a coincidence may impact the purity of our experimental data.
The data presented in this study are available upon request from corresponding author.
OB designed the research study. AL, KK and AD performed the research. VS and OB analyzed the data. AL and KK wrote the manuscript. All authors contributed to editorial changes in the manuscript. All authors read and approved the final manuscript. All authors have participated sufficiently in the work and agreed to be accountable for all aspects of the work.
The study was conducted according to the guidelines of the Declaration of Helsinki and was approved by the Ethical Review Committee of Kursk State Medical University (No. 1 from January 11, 2022). All the participants gave written informed consent before the enrollment in this study.
Not applicable.
This research received no external funding.
The authors declare no conflict of interest.
References
Publisher’s Note: IMR Press stays neutral with regard to jurisdictional claims in published maps and institutional affiliations.