1. Introduction
Diabetes mellitus is one of the oldest diseases known to mankind; the ancient
Egyptians have described it for 3000 years [1]. Clinically diabetes mellitus
characterized by a metabolic disorder caused a chronic hyperglycemia accompanied
by a more or less significant alteration in the metabolism of carbohydrates,
lipids and proteins [2]. Carbohydrate digestive enzymes play a major role in the
management of intestinal glucose absorption and the postprandial hyperglycemia.
This opens up a therapeutic approach based on inhibition of the digestive enzymes
such as pancreatic -amylase and intestinal -glucosidase, to
reduce the hydrolyzes of carbohydrate into a monosaccharide absorbed by the
intestine and consequently decrease the hyperglycemia level [3]. Currently,
multiple synthetic drugs are used as -amylase and
-glucosidase inhibitors in order to manage diabetes, like Acarbose,
Voglibose, and Miglitol [4]. Although, the long-term utilization of these drugs
could lead to various side effects [5]. As a result, additional research is
needed to uncover natural compounds extracted from medicinal plants that have the
potential to suppress the carbohydrate digestive enzyme with fewer side effects.
Medicinal plants represent the classical therapeutic source in developing
countries [6]. In addition, plant species belonging to the Artemisia genus are
utilized in worldwide ethnomedical practices due to their anti-diabetic
characteristics [7]. Artemisia compestris L. is one of the Artemisia
species that has historically been used to treat digestive tract disorders [8]
such as gastric ulcer [9], diarrhea [10], antispasmodic [11], obesity, and also
as an antidiabetic agent [12]. Different pharmacological studies showed that
Artemisia campestris L. has antibacterial [13], antitumor [14],
anti-inflammatory [15], antiplatelet [16], antispasmodic [17], antidiarrheal
[18], and anti-ulcer activities [19]. Belgacem et al. [20] reported that
Artemisia campestris L. has a hypoglycemic impact, however no
information was provided on the mechanism of action responsible for this effect.
Chronic hyperglycemia induces the production of extreme amounts of reactive
oxygen species in the tissues and this progression can lead to sever organ
damage. As a result, research into anti-diabetic substances or extracts with
antioxidant properties is essential for the treatment of diabetes mellitus [21].
For this reason, we investigate the quantitative phytochemical analysis and the
antioxidant activity of Artemisia campestris aqueous extract (AcAE) and
hydro-ethanolic extract (AcEE) in our study. Moreover, for the first time we
study the effect of AcAE and AcEE on -amylase and
-glucosidase in vitro and in vivo and their
intestinal glucose absorption in Wistar rats. In order to determine the
mechanisms of action that explained the anti-diabetic activity of
Artemisia campestris L.
2. Materials and Methods
2.1 Chemicals
The following reagents were purchased from SigmaAldrich: The starch and the
sucrose powders, the -glucosidase enzyme, the -amylase
enzyme, dinitrosalicylic acid, Acarbose, phlorizin dehydrate, D-glucose
anhydrous, potassium chloride (KCl), magnesium chloride-6-hydrate
(MgCl·6HO), sodium chloride (NaCl), folin-ciocalteu, gallic acid,
ascorbic acid, quercetin, DPPH, aluminum chloride (AlCl), potassium
ferricyanide [KFe (CN)], methanol, ethanol, chloroform, and ferric
chloride (FeCl), Trichloroacetic acid (TCA). Calcium chloride dihydrate
(CaCl·2HO) purchased from ScharlauChemie S.A., Spain. Sodium hydrogen
carbonate (NaHCO) were purchased from Farco Chemical Supplies, (Puerto
Rico). Sodium phosphate monobasic 2-hydrate NaHPO·2HO purchased
from Panreac, Spain. Alloxan mono-hydrate was purchased from ACROS Organics.
Pentobarbital obtained from CEVA Santé Animale, France. Ether obtained from
Somaprol, Casablanca, Morocco.
2.2 Plant Material
The aerial part of Artemisia campestris L.was provided by local
herboristery and the plant was identified by Pr. Elachouri Mostafa from the
department of Biology. The voucher specimen HUMPOM-151 was kept in the herbarium
of faculty of sciences, Mohamed First University Oujda (Morocco).
• Aqueous extract
According to the traditional use of Artemisia campestris, the aqueous
plant extract (AcAE) was prepared by infusion of 30 g of the aerial part in 300
mL distilled water for 30 min. The aqueous extract was obtained after filtration
and evaporation to dryness in vacuo (yield: 19%). The drug extract ratio for the
AcAE is 30:5.8. The extract was stored at –20 °C until use.
• Hydtro Ethanolic extract
In the dark at room temperature, 25 g of sample was soaked in 250 mL of 50%
aqueous-ethanolic solution for 24 hours. The mixture was filtrated and the
filtrate was evaporated to dryness at 50 °C to obtain the extract in
yield of 14%. The drug extract ratio for the AcEE is 25:3.5. The hydro-ethanolic
extract (AcEE) was kept at –20 °C until use.
2.3 Animals
Wistar rats were provided from the animal’s house of the biology department of
the Faculty of Sciences-Oujda, Morocco, they were placed under standard
conditions (23 °C 2 °C and 12 h light-dark cycle), with
free access to water and food.The animals are kept in their cages for one week
before the day of gavage to allow acclimatization to laboratory conditions. All
animals were cared for in accordance with the internationally accepted guide for
the care and use of laboratory animals published by the United States National
Institutes of Health [22]. The study was authorized by the Faculty of Sciences
institutional review board in Oujda, Morroco (01/20-LBBEH-04 and 09/01/2020).
2.4 Diabetes Induction
Diabetes was induced according to the procedure described by Prince et
al. [23]. The animals were fasted for about 16 h with accessibility to water.
After that, all animals were injected intraperitoneally by alloxan (120 mg/kg.bw)
dissolved in phosphate citrate buffer (pH = 3). One week after the
administration was verified using a glucose oxidase-peroxidase method. The
animals with the glycaemia higher than 1.25 g/L were included in the experiment.
2.5 Phytochemical Test of Artemisia campestris L.
2.5.1 Total Phenolic Content
The total phenol content of the extracts was determined by the Folin-Ciocalteu
method [24] with some modifications. Firstly, 100 L of each extract
at a concentration of 10 mg/mL were mixed with 500 L of the Folin
reagent (10%) and at least 6 mL of distilled water. After 1 min and before 8
min, we added to the mixture 1.5 mL of NaCO (20%). The volume was
adjusted to 10 mL with distilled water. The absorbance was determined at 760 nm.
A standard curve was evaluated using gallic acid concentrations ranging from
15.62 to 500 g/mL. The total phenol content was expressed as
g gallic acid equivalents per mg of dry weight of extract (g
GAE/mg of extract). All determinations have been carried out in triplicate.
2.5.2 Total Flavonoid Content
Total flavonoid content was assessed according to the aluminum chloride
colorimetric method [25]. Briefly, 2 mL of distillated water and 100
L of AlCl (5%) were added to 300 L of extract
at a concentration 10 mg/mL. The volume is adjusted to 5 mL with distilled water.
This solution was well mixed before being let to stand at room temperature for 30
min. The absorbance was measured at 425 nm. A series of concentration of
quercetin (15.62–1000 g/mL) was used as the standard to obtain the
calibration curve. Total flavonoid content was expressed as g
quercetin equivalent per mg of dry weight of extract (g QrE/mg extract).
All measurements were performed in triplicate.
2.5.3 Total Tannin Condensed Content
The method described by Julkunen-Tiitto (1985) with slay modification is used to
determine the condensed tannins content [26]. 50 L of each extract
or standard solution was mixed with 1.5 mL of vanillin (4% solubilized in
methanol), and then 750 L of concentrated HCl was added. The
well-mixed solution was incubated at ambient temperature in the dark for 20 min.
The absorbance was read at 500 nm. Catechin (1.95–1000 g/mL) was
used to make the standard curve and the results were expressed as g
Catechin equivalents per mg of extract dry weight (g CE/mg
extract). All determinations have been carried out in triplicate.
2.6 Antioxidant Activities
2.6.1 DPPH* Radical Scavenging Assay
The antiradical scavenging activity of sample was evaluated using a radical 2,2-diphenyl-1-picrylhydrazyl (DPPH) [27]. The sample extract (200 L)
at range of concentration (25–1000 g/mL, the choice of
concentration is based on our previous study, which demonstrated that 1 mg/mL has
a maximum in vitro antispasmodic effect [17]. For that, we made
dilutions from a concentration of 1 mg/mL) was mixed with an 1800 L
of DPPH solution 0.004% solubilized in methanol. After 30 min, the absorbance
was measured at 517 nm by the spectrophotometer. Ascorbic acid, a standard
antioxidant, was used as a reference. All tests were performed in triplicate.
Radical-scavenging activity of DPPH was calculated as the following percentage
(1)
A0: Absorbance of DPPH alone
A1: Absorbance of sample mixed with DPPH solution
The result is presented as IC (The concentration of the samples
inhibiting the radical scavenging activity by 50%).
2.6.2 Ferric Reducing Antioxidant Power Assay (FRAP)
The ferric ion (Fe) reducing power assay was carried out according to the
method described by Amarowicz et al. [28]. 2.5 mL of 0.2 M of phosphate
buffer (pH 6.6) and 2.5 mL of potassium ferricyanide (1% w/v) were
added to 1 mL of the samples dissolved in distilled water (AcAE or AcEE) at range
of concentration (62–1000 g/mL). The mixture obtained was then
incubated at 50 °C for 20 min. After the incubation 2.5 mL of
Trichloroacetic acid (10% w/v) was added. The mixture was centrifuged
at 3000 rpm for 10 min and 2.5 mL of the supernatant was collected and mixed with
distilled water (2.5 mL) and 0.5 mL of FeCl (0.1% w/v). The
absorbance was then measured at 700 nm against blank sample.
Ascorbic acid was used as a reference compound. All of the tests were performed
in triplicate. The result is presented as IC (The concentration of the
samples caused 50% of inhibition).
2.6.3 -carotene/linoleic Acid Bleaching Assay
The antioxidant activity of AcAE and AcEE was carried out by measuring the
inhibition of the oxidative degradation of -carotene according to the
protocol described by Miller (1970) [29] and modified by Bekkouch et al.
[30]. Briefly, an emulsion of carotene/linoleic acid was prepared by
solubilizing 2 mg of -carotene in 1000 L of chloroform.
Then 2 mg of linoleic acid and 200 mg of Tween (80) were added. To remove the
chloroform, the mixture was then evaporated using a rotavapor. At the end, a
volume of 100 mL of distilled water was added with vigorous stirring. In a series
of test tubes were added a volume of 50 L of samples or
Butylated hydroxyanisole (BHA) at different concentrations (62–1000
g/mL). A volume of 2550 L of the -carotene solution
was the introduced into the tubes. Absorbance was measured at 490 nm before and
after 2 hours incubation at 50 °C against a blank that contains
ethanolfor the BHA. The measurements were made in triplicate.
The percentage of relative antioxidant activity after 2 hours was calculated
according to the following formula
(2)
The result is presented as IC (The concentration of the samples caused
50% of bleaching inhibition).
2.7 In Vitro Inhibition Assay for Digestive Enzymes
The -amylase and -glucosidase inhibition activity by AcAE
and AcEE was studied according to the procedure described by Daoudi et
al. [31] with some minor modifications.The choice of the concentration is made
according to the preliminary validation tests that we have carried out.
2.7.1 In Vitro-amylase Inhibition
The assay mixtures contained 200 L of porcine
pancreatic -amylase enzyme solution (13 IU), 200 L of
phosphate buffer (0.02 M; pH = 6.9) and 200 L of sample (AcAE, AcEE
or acarbose) at the following concentrations (0.56, 1.12, 2.25 mg/mL). The
mixtures were pre-incubated at 37 °C for 10 min. Then, 200
L of starch (1%) dissolved in phosphate buffer was added to each
tube and were incubated for 20 min at 37 °C. Then, 600 L
of 3.5-dinitrosalicylic acid (DNSA) color reagent was added to stop the enzymatic
reaction. The tubes were then incubated for 8 minutes at 100 °C. After
that, they were immersed in an ice-cold water bath for a few minutes. The mixture
was diluted by adding 1 mL of distillate water and the absorbance was measured at
540 nm. All tests were performed in triplicate. The inhibition percentage was
calculated using the below formula:
(3)
The concentration of the samples inhibiting the enzymatic activity of
-amylase by 50% (IC) was calculated graphically according to
the function:
(4)
2.7.2 In Vitro-glucosidase Inhibition
The effect of AcAE and AcEE on -glucosidase activity was
calorimetrically quantified by monitoring the glucose release from sucrose
degradation. The assay mixtures contained 100 L of sucrose (50 mM),
1000 L of phosphate buffer (50 mM; pH = 7.5) and 100
L of -glucosidase enzyme solution (10 IU). Then, 20
L of acarbose, AcAE or AcEE at two different concentrations: 328
and 656 g/mL were added to the mixture. The same volume of
distilled water was replaced in the control. Then, it was incubated at 37
°C in water bath for 25 min. After, the mixture was heating at 100
°C for 5 min in order to stop the enzymatic reaction, and the release
glucose was estimated by glucose oxidase method using a commercially auto-kit
(The GOD-POD is a colored glucose indicator, purchased from Biosystems. S.A
Barcelona, Spain). The absorbance was measured at 500 nm. All tests were
performed in triplicate. The inhibition percentage was calculated using the
formula:
(5)
Principe of GOD-POD method: Glucose oxidase enzyme (GOD) oxidizes the
specific substrate D-glucose to gluconic acid and hydrogen peroxide
(HO) is liberated. Peroxidase enzyme acts on hydrogen peroxide to
liberate oxygen (O). Nascent oxygen then couples with 4-aminoantipyrine and
phenol to form red quinoneimine dye. The intensity of color is directly
proportional to concentration of glucose in plasma. The intensity of color is
measured colorimetrically at 500 nm [32].
2.8 In Vivo, Inhibition for Digestive Enzymes
To evaluate the activity of the both extracts in -amylase and
-glucosidase in vivo, we followed the protocol described by
Subramanian et al. [33]. Normal and diabetic Wistar rats weighing
150–200 g, were deprived of food 16 h before each test. The rats were randomly
divided into four groups with five animals in each. The control group, the
acarbose group (Positive control), the AcAE group and the AcEE group. In fact,
the concentrations choice is based on the previous work that published on the
same topics [34]. The different groups received respectively the distillate water
(10 mL/kg), Acarbose (10 mg/kg), AcAE (250 mg/kg) and AcEE (250 mg/kg). After 30
min of solutions administration, the animals were received orally using a
specific gavage tube, starch (2 g/kg) as an -amylase substrate, or
sucrose (2 g/kg) as an -glucosidase substrate. Then, the blood glucose
was estimated at different times: 0, 30, 60 and 120 min, using the
glucose-peroxidase method (The GOD-POD). Moreover, the diabetic rats were treated
similarly to the normal rats.
2.9 In Situ Intestinal Glucose Absorption
Intestinal glucose absorption, was evaluated using a jejunum segments perfusion
technique [34]. Primarily, normal Wistar rats were deprived of food before the
assay for 36 h, with free access to water. Rats were divided into 4 groupswith
five animals in each: The control group received the perfusion solution (in g/L:
7.37 NaCl, 0.2 KCl, 0.065 NaHPO·2HO, 0.213 MgCl·6
HO, 0.6 NaHCO, and 1.02 CaCl·2HO). The positive control
group received the perfusion solution with the phlorizin (0.2 mM). The third and
fourth group received the perfusion solution with the AcAE or AcEE (250 mg/kg)
respectively. D-glucose (1 g/L) was added to the solutions just before the start
of the experiment and the pH was kept at 7.5. The animals were anesthetized by
intramuscular injection of 50 mg/kg of pentobarbital, and fixed on a
homoeothermic plate (37 °C). Then, 10 cm of the jejunum segment is
perfused with a solution according to the group studied, using a syringe Pump at
0.53 mL/min. After 60 min, the perfuse was collected in order to estimate the
amount of glucose in final solutions using the glucose oxidase peroxidase method
and the length of segments were measured in cm. The results are expressed in
mg/cm/h corresponding of amount of absorbed glucose (mg) per length of the
segment (cm) per time of perfusion (60 min).
2.10 Statistical Analysis
The results were expressed as the mean S.E.M. Moreover, the statistical
analysis was performed differently depending on the experiment:
• Two-way analysis of variance (ANOVA) for in vivo and
in vitro inhibitory digestive enzymes.
• One-way followed by a post hoc Tukey test for in situ
intestinal glucose absorption test.
• Student’s t test to analyze the results of the
phytochemical study and the IC of the antioxidant tests.
The statistical analysis was performed using a GraphPad Prism software, version
5.01 (San Diego, CA, USA). The difference was significant when p is less
than 5%. The concentration of the samples inhibiting 50% of activities
demonstrated (IC) was calculated graphically according to the function
.
3. Results
3.1 Phytochemical Test of Artemisia campestris L.
The Table 1 shows the quantitative phytochemical analysis of the both extract
from Artemisia campestris L. The AcAE possess a high quantity of
phenolic, flavonoid content and condensed tannins by 44.65 0.54
g GAE/mg, 24.41 3.75 g QrE/mg and 14.31
5.26 g CE/mg of extract respectively. For the
hydro-ethanolic extract (AcEE) the total phenolic, flavonoid content and
condensed tannins is 31.7 0.53 g GAE/mg of extract, 17.31
1.69 g QrE/mg of extract and 10.65 4.93
g CE/mg of extract respectively.
Table 1.The quantitative phytochemical analysis of different extract
from Artemisia campestris L.
|
TPC g GAE/mg |
TFC g QrE/mg |
TCC g CE/mg |
| AcAE |
44.65 0.54* |
24.41 3.57 |
14.31 5.26 |
| AcEE |
31.7 0.53 |
17.31 1.69 |
10.65 4.93 |
Data are expressed as mean SEM (n = 3). Student’s t test to
analyze the results. * p 0.05, difference is significant between the
two extracts.
TPC, Total phenolic content (g GAE/mg: g of Gallic
Acid equivalent per mg of extract); TFC, Total flavonoid content (g
QrE/mg: g of Quercetin equivalent per mg of extract); TCC, Total
tannins condensed content (g CE/mg: g of
Catechin equivalent per mg of extract). |
3.2 Antioxidant Activity of Artemisia campestris L.
The antioxidant activity was investigated by three methods, the antiradical
scavenging activity using DPPH radical, -carotene bleaching assay, and
the ferric reducing power activity.
The results obtained showed that the AcAE and AcEE have a dose dependent
antiradical scavenging activity, increased significantly by increasing the
concentration with a maximum effect in a dose 1 mg/mL for the both extract (Fig. 1). In the other hand the aqueous extract of Artemisia campestris have a
low value of IC (0.355 0.057 mg/mL) compared with AcEE (0.450
0.060 mg/mL) (p 0.01) that is to say the AcAE has an
important antioxidant power. The IC obtained by ascorbic acid used as a
positive control is 0.063 0.003 mg/mL (Table 2).
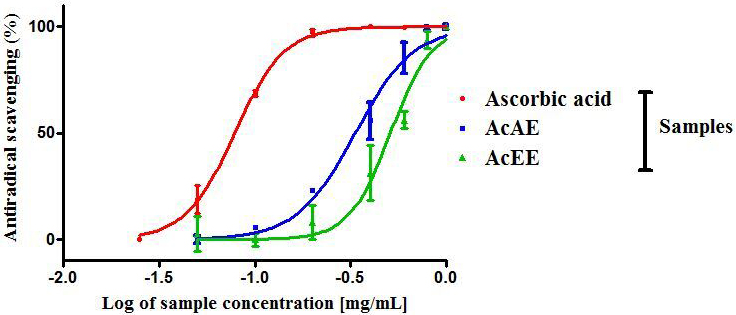 Fig. 1.
Antiradical-scavenging activity against DPPH of
Artemisia campestris aqueous extract (AcAE) and hydro-ethanolic extract
(AcEE). Each value represent means SEM (n = 3).
Table 2.IC value of antioxidant activities of Artemisia
campestris L extracts using three methods: DPPH-scavenging, -carotene
bleaching and FRAP.
|
|
IC (mg/mL) |
|
| Sample |
DPPH |
-carotene bleaching |
FRAP |
| AcAE |
0.355 0.057** |
0.524 0.011 |
0.269 0.025* |
| AcEE |
0.450 0.060 |
0.319 0.097 |
0.396 0.021 |
| Ascorbic acid |
0.063 0.003 |
|
0.130 0.003 |
| BHA |
|
0.212 0.043 |
|
Student’s t-test to analyze the results. *p 0.05;
**p 0.01, difference is significant between the two extracts. Data are expressed as mean SEM (n = 3).
IC value was determined to be the effective concentrations at which
affect an antioxidant activity by 50%. |
The ferric reducing antioxidant power assays are represented in Fig. 2. As
demonstrated by the fact that the AcAE has the largest reducing power activity
when compared to the AcEE, with a dose dependent effect and a maximum at 1 mg/mL
for both extracts, this is confirmed by the fact that the IC of the AcAE
is 0.269 0.025 mg/mL followed by the AcEE with IC value of 0.396
0.021 mg/mL.The difference between the IC of the two extracts is
statistically significant (p 0.05). Moreover, this effect is lower
than the ascorbic acid with an IC = 0.130 0.003 mg/mL
(Table 2).
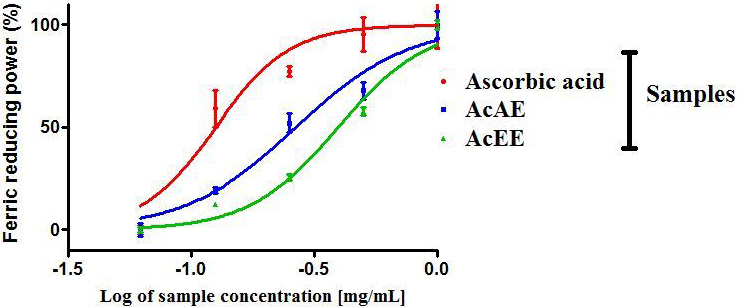 Fig. 2.
Ferric reducing antioxidant power (FRAP) of Artemisia
campestris aqueous extract (AcAE) and ethanolic extract (AcEE). Each value
represent means SEM (n = 3).
The AcAE and AcEE inhibited the bleaching of -carotene with a dose
dependent manner with also a maximum effect at 1 mg/mL (Fig. 3). The highest
activities were found by the AcEE (IC = 0.319 0.097 mg/mL)
followed by AcAE (0.524 0.011 mg/mL). The positive control (BHA) exhibits
a great inhibited of -carotene bleaching compared to the two extract of
Artemisia campestris with IC = 0.212 0.043 mg/mL (Table 2).
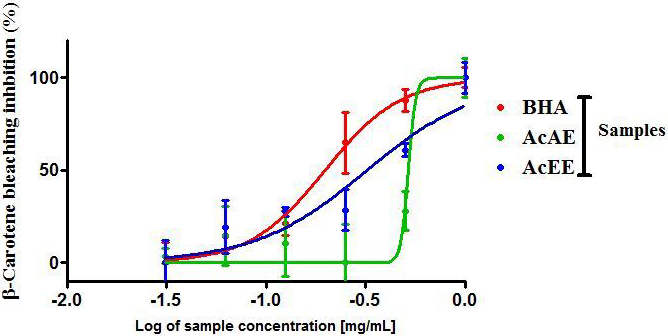 Fig. 3.
The -carotene bleaching assay of Artemisia
campestris aqueous extract (AcAE) and hydro-ethanolic extract (AcEE). Each
value represent means SEM (n = 3).
3.3 In Vitro Inhibition Assay for Digestive Enzymes
Artemisia campestris L. was tested for its inhibitory activity against
the enzymes -amylase and -glycosidase. The -amylase
inhibitory potential of AcAE and AcEE exhibited a dose-dependent inhibition and
very significant compared to the control. The AcEE induced the greatest activity
against -amylase with an inhibition of 32.68, 70.16, and 78.51% for
0.56, 1.12, 2.25 mg/mL compared with the AcAE that exhibited an inhibition of
18.99, 41.87, and 62.31% for 0.56, 1.12, 2.25 mg/mL respectively. The acarbose
used as a reference drug induced an inhibition of 51.34, 68.30, and 79.43% for
the same dose (Fig. 4). According to these results, AcEE has an effect comparable
to that of acarbose, especially in high doses, which is confirmed by the IC of the extract which equal to 0.602 0.072 mg/mL, for acarbose is 0.417
0.014 mg/mL (Table 3).
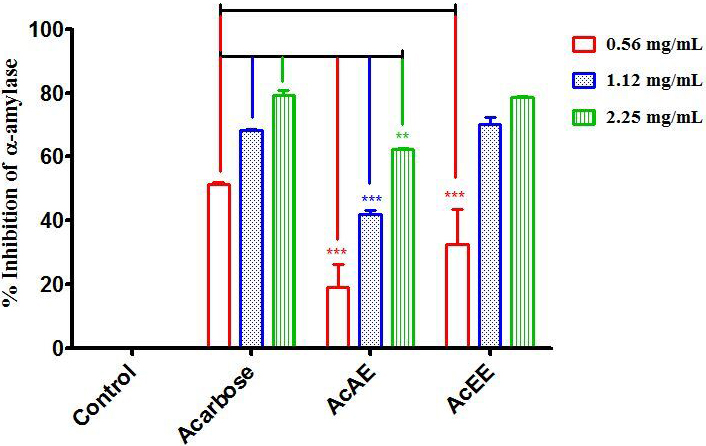 Fig. 4.
In vitro inhibition of the enzyme
-amylase by Artemisia campestris aqueous extract (AcAE),
hydro-ethanolic extract (AcEE) and acarbose (reference drug). The difference between the groups was calculated with a two-way
analysis of variance (ANOVA). Each value represent means SEM. All dose
tests of each groups are very significant compared to control group. **
p 0.01, *** p 0.001. Compared to acarbose group (n = 3).
Table 3.IC Value of inhibition of -amylase by
Artemisia campestris aqueous extract (AcAE), hydro-ethanolic extract
(AcEE) and acarbose (reference drug).
| Sample |
IC (mg/mL) |
| AcAE |
1.259 0.128 |
| AcEE |
0.602 0.072 |
| Acarbose |
0.417 0.014 |
| Each value represent means SEM (n = 3).
IC: concentration of sample that giving half-maximal inhibitory response. |
In terms of the effect of AcAE and AcEE on -glucosidase inhibition,
both extracts inhibit significantly -glucosidase activity compared to
the control and they are almost similar to each other. The most active
concentration for the both extract of Artemisia campestris L. is 656
g/mL by an enzyme inhibition of 81.76% for AcAE and 81.18% for
the AcEE (Fig. 5).
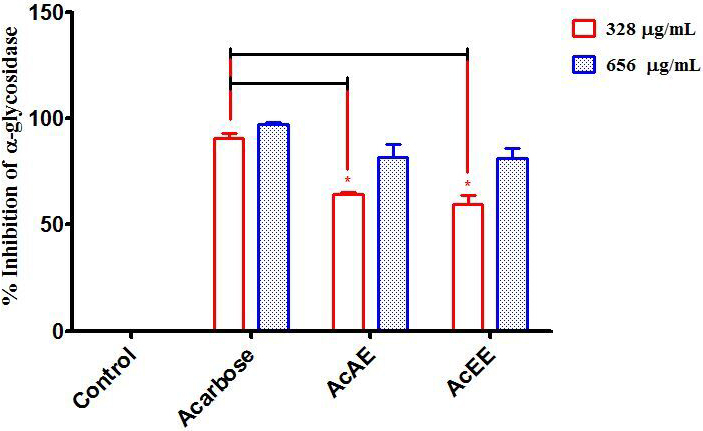 Fig. 5.
In vitro inhibition of the enzyme
-glycosidase by Artemisia campestris L. aqueous extract
(AcAE), hydro-ethanolic extract (AcEE) and acarbose (reference drug). The
difference between the groups was calculated with a two-way analysis of variance
(ANOVA). Each value represent means SEM. All dose tests of each group are
very significant compared to control group. * p 0.05. Compared to
acarbose (n = 3).
3.4 In Vivo Inhibition Assay for a Digestive Enzyme
3.4.1 In Vivo -amylase Inhibitory Effect
The results showed that the AcAE and AcAE (250 mg/kg) decreased postprandial
glycaemia in the normal rats at time 30 and 60 min in a very significant manner
(p 0.001) compared to the control which increased the glycaemia
level from 0.9 g/L up to 1.5 g/L after starch administration. However, the blood
glucose level at time 120 min showed no significant difference between the both
extracts group and the control group. Concerning the group received the acarbose
(10 mg/kg) show similar effect compared with the AcAE and AcEE at time 30 and 60
min (Fig. 6A). In the control group of alloxane-diabetic rats (Fig. 6B), the
glycaemia increased from 3.67 g/L to 4.66 g/L at 30 min. This glycaemia decreases
significantly in presence of the both extract (p 0.01) and very
significantly in the acarbose group (p 0.01).
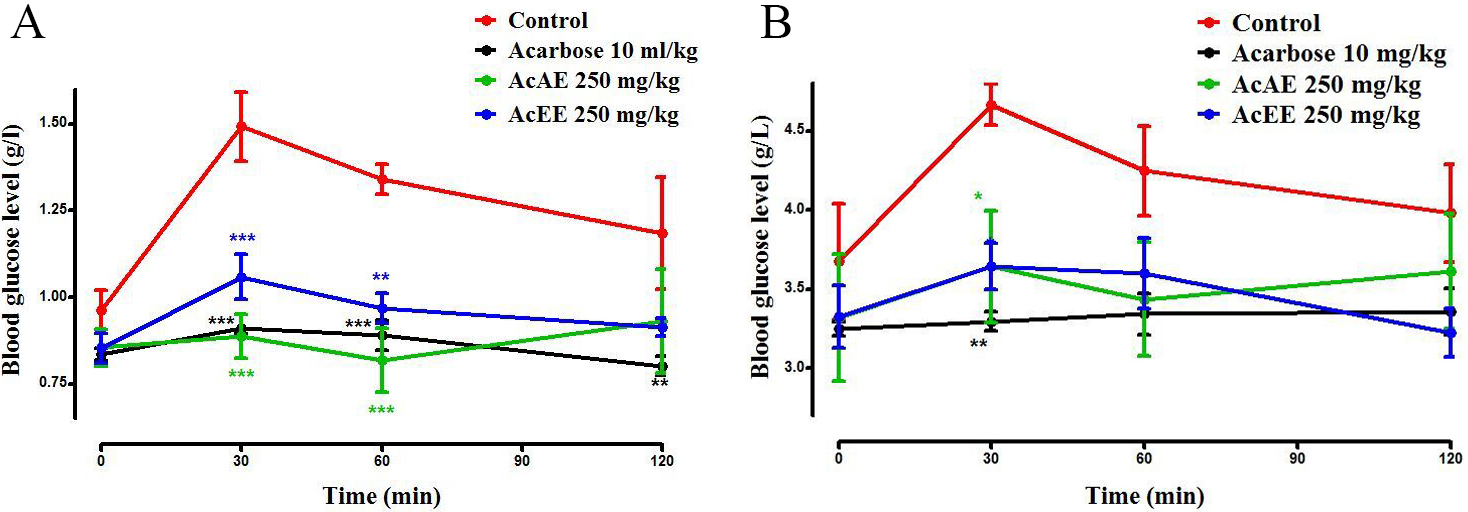 Fig. 6.
Effect of Artemisia campestris L. Aqueous extract
(AcAE) and hydro-ethanolic extract (AcEE) on blood glucose level in normal (A)
and diabetic rat (B) after consumption of starch as an -amylase
substrate. Data represent mean SEM (n = 5). The difference between the
groups was calculated with a two-way analysis of variance (ANOVA). Each value
represent means SEM. * p 0.05, ** p 0.01, and ***
p 0.001 compared to the control group.
3.4.2 In Vivo-glucosidase Inhibitory Effect
The results of the effect of the extracts of Artemisia campestris L. on
the inhibition of -glucosidase in vivo in normal rats was
illustrated in Fig. 7A. After sucrose administration in the control group, the
glycaemia increased from 0.94 g/L to 1.56 g/L at 30 min and continued to rise
until 1.59 g/L. In the presence of AcAE and AcEE (250 mg/kg), the blood sugar
decrease significantly (p 0.001) at 30 min compared with the control
group. At 60 and 120 min, the glycaemia level continues to decrease very
significantly (p 0.001) compared to the control group and until more
than acarbose group. However, in alloxane diabetic rats, the postprandial glucose
concentrations increase in the control group from 3.45 g/L to 4.086 g/L after 30
min. On the other hand, in the group treated with acarbose, blood sugar levels
were reduced by 3.21 g/L to 2.61 g/L at 30 min, the same remark observed in the
AcAE and AcEE groups (Fig. 7B).
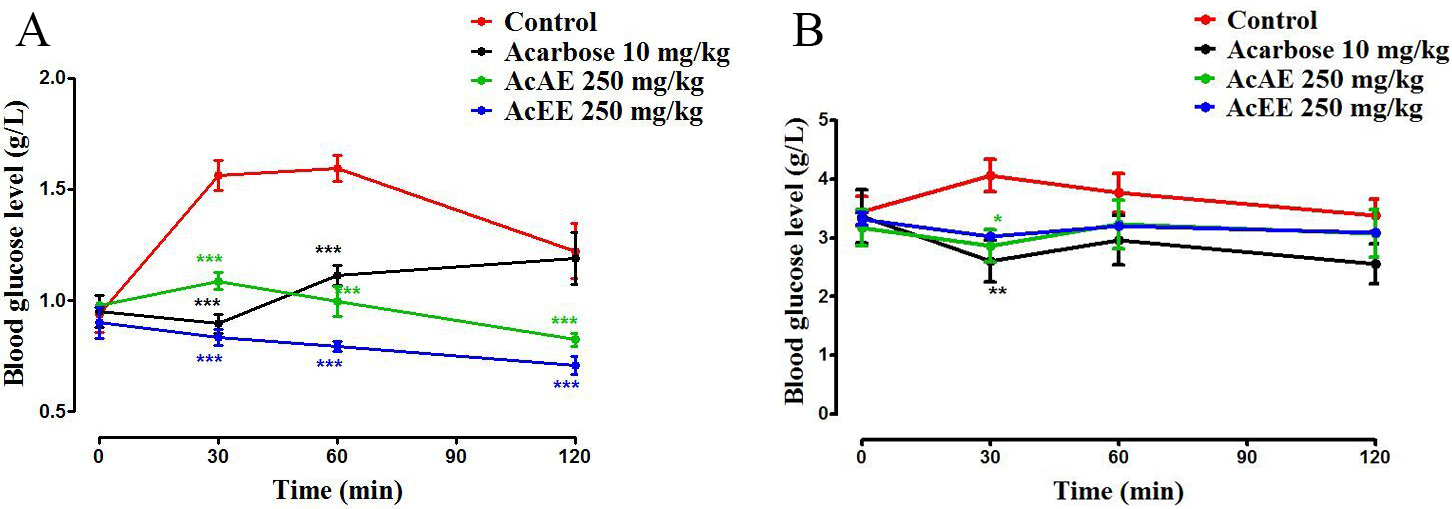 Fig. 7.
Effect of Artemisia campestris L. Aqueous extract
(AcAE) and hydro-ethanolic extract (AcEE) on blood glucose level in normal (A)
and diabetic rat (B) after consumption of sucrose as an -glucosidase
substrate. Data represent mean SEM (n = 5). The difference between the
groups was calculated with a two-way analysis of variance (ANOVA). Each value
represent means SEM. * p 0.05, ** p 0.01, and ***
p 0.001 compared to the control group.
3.4.3 In Situ Intestinal Absorption
The results of the intestinal glucose absorption study show that the amount of
glucose absorbed in the control group is 12.18 0.61 mg/10 cm/h. This
amount decreases significantly in presence of AcAE (p 0.001) and AcEE
(p 0.001) with amount of 6.53 0.57 and 5.34 0.64
mg/10 cm/h respectively. These results are comparable with the result obtained in
phlorizin group with an amount of glucose-absorbed equal a 4.71 0.24
mg/10 cm/h (Fig. 8).
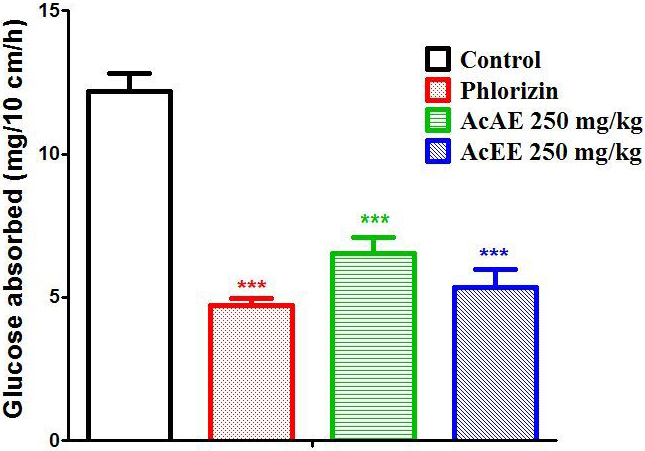 Fig. 8.
Effect of AcAE and AcEE on intestinal glucose absorption in
Wistar rat. Data represent mean SEM (n = 5). The difference between the
groups was calculated with a one-way analysis of variance (ANOVA). Each value
represent means SEM *** p 0.001 compared to the control
group.
4. Discussion
The purpose of this study is to assess the inhibitory effect of
Artemisia campestris L. on carbohydrate Digestive enzymes, particularly
against -amylase and -glucosidase, as well as their intestinal glucose
absorption activity. Additionally, we investigated phytochemical analysis of AcAE
and AcEE and their antioxidant capacity.
Starch is normally the main source of digestible carbohydrates in human
alimentation, and it is the major source of glucose that appears at fairly high
concentrations in the blood circulation following intestinal digestion,
-amylase and -glucosidase are two primary enzymes involved in
carbohydrate digestion. The first step in digestion of starch is catalyzed by
-amylase [35], that present in salivary and pancreatic secretions and
catalyzing the hydrolysis of -(1,4)-glycosidic linkages in starch,
forming an oligosaccharides or disaccharides. The second step
-glucosidase that is fond on luminal surface of enterocytes, hydrolyzes
non-reducing -(1,4) bond of oligosaccharides or disaccharides and
releases glucose molecules [36, 37]. The AcAE and AcEE (250 mg/kg) inhibit the
hyperglycemia level due to administration of starch and sucrose as an
-amylase and -glucosidase substrates respectively in normal
and diabetic rats, in a short time significantly compared to the control and
exhibit a similar activity as acarbose (10 mg/kg). In other words, our extracts
have an inhibitory effect against -amylase and -glucosidase
in vivo, which confirmed by the fact that hydrolysis effect of these
enzymes inhibited in vitro significantly by AcAE and AcEE. In orally
induced hyperglycemia model, the n-butanol Fraction from
Tunisian Artemisia campestris L. at the highest doses of 550 and 400
mg/kg.bw significantly reduced the postprandial hyperglycemic peak compared to
control [20]. Two other Moroccan Asteraceae species (Bubonium imbricatum
Cav. and Cladanthus arabicus (L.)) had an enzyme inhibitory activity
against various enzymes such as -glucosidase [38]. Several extracts
from the Artemisia genus of the Asteraceae family shown inhibitory
effect against the key enzymes involved in carbohydrate metabolism, such as
-amylase (IC = 150.24–384.14 g/mL) and
-glucosidase (IC = 214.42–754.12 g/mL) [7].
The results of the phytochemical analysis of Artemisia campestris L.
demonstrated that the AcAE and AcEE contain an important quantity of polyphenol,
flavonoid and tannin. Similar results were obtained in a previous study [39].
Flavonoids such luteolin, quercetin, kaempferol, apigenin, myricetin, hesperidin,
naringenin and rutin are reported to be abundant in the species Artemisia
campestris L. Additionally, this plant contains the phenolic acids as well as
chlorogenic acid, 3,4-dicaffeoylquinic acid (chlorogenic acid A),
3,5-dicaffeoylquinic acid (chlorogenic acid B), 4,5-dicaffeoylquinic acid
(chlorogenic acid C) [40]. That already performed and confirmed by our previous
work [41]. This may lead to establish a relationship between these
phytoconstituents and the possible effect on the inhibitory of carbohydrate
digestive enzymes. That confirmed by the fact that the chlorogenic acid was the
key to the biological response of Artemisia extracts by the direct
relationship between it and their enzyme inhibitory activity [7]. Furthermore,
chlorogenic acid from coffee has an inhibitory effect against pancreatic
-amylase [42]. In addition, naturally flavonoid especially four
flavonols (quercetin, quercetagetin, myricetin, and fisetin) and three flavones
(luteolin, eupafolin, and scutellarein) exhibited IC values less than 100
M against human salivary -amylase activity. This inhibitory
effect depends on hydrogen bonds between the hydroxyl groups of the polyphenol
ligands and the catalytic residues of the binding site [43]. Miao et al.
[44] had mentioned in their work that six types of catechins has an inhibitory
effect against -amylase enzyme. This effect due to the higher binding
affinity with enzyme by the interacting with the catalytic residues of the active
site forming a phenols-protein complex, including hydroxyl on the 3-position or
5-position of A-C rings. In porcine pancreatic -amylase, another
flavonoid has a more important inhibitory effect such as quercetin, luteolin and
myricetin with an IC less than 500 M. This inhibitory effect
is caused by the following structures: the 2, 3-double bond, 5-OH, the linkage of
the B ring at the 3 position, and the hydroxyl substitution on the B ring [45].
Another new study described that quercetin interacts with three amino acids
(Arg195, Glu233, and Gln63) to catalyze the active site of -amylase by
non-covalent interaction. Therefore, molecular modeling was investigated that the
flavonoid-enzyme complexes exhibiting the competitive inhibition mechanism [46].
Yeast -glucosidase and rat small intestinal -glucosidase was
highly inhibited by several flavonoids such as flavanols, isoflavones and the
anthocyanidins with an IC value less than 13 M. This
inhibitory effect wasenhanced by the following structures: the unsaturated C
ring, 3-OH, 4-CO, the linkage of the B ring at the 3 position, and the hydroxyl
substitution on the B ring [45]. Tannins inhibit the activity of many different
enzymes by the explore tannin/protein interactions. This type of secondary
metabolite frequently interferes with digestive enzymes such as trypsin,
-amylase and -glucosidase by binding the either the enzyme or
the substrate or to both [47]. Moreover, various studies showed a potent
inhibitory effect of tannin on both -amylase and -glucosidase
activities in vitro [48, 49]. The both extracts exhibited an inhibition of
intestinal glucose absorption significantly and it was similar to the phlorizin
used as reference drug, and it is isolated from genus Malus. This natural drug
blocked the intestinal glucose absorption through inhibition of the
sodium-glucose transporter (SGLT) which reduced the glycaemia level [50]. That is
to say, the effect of the plant mayact via the same pathway, but also can act via
the inhibition of GLUT, or both at the same time.
Free radicals are the principal agents involved in several diseases, such as
diabetes mellitus, and the prolonged hyperglycemia can provoke the production of
too much reactive oxygen species (ROS) in tissues. The high contents of
antioxidants compounds decrease the negative effect of free radicals and
protecting against the damage induced by ROS [51, 52]. However, the antioxidants
effect exhibited by AcAE and AcEE in various in vitro assay (DPPH, FRAP
and -carotene) can support the pharmacological activities showed. These
results are demonstrated by various studies and explained by the presence of
artemisinin obtained in Artemisia campestris L. with a remarkable
antioxidant capacity [38, 53].
5. Conclusions
Artemisia campestris L. has highest phenolic content, antioxidant
activity against DPPH, -carotene and FRAP. Moreover, AcAE and AcEE
demonstrated a postprandial anti-hyperglycemic effect via the inhibiting
of the carbohydrate digestive enzyme (-amylase and
-glucosidase) and the intestinal glucose absorption. These results
explain the use of this plant as an antidiabetic agent and support the
pharmacological basis behind this use.
Abbreviations
AcAE, Artemisia campestris aqueous extract; AcEE, Artemisia
campestris hydro-ethanolic extract; FRAP, Ferric reducing antioxidant power;
DPPH, 2,2-diphenyl-1-picrylhydrazyl; BHA, Butylatedhydroxyanisole; TPC, Total
phenolic content; TFC, Total flavonoid content; TCC, Total tannins condensed
content.
Author Contributions
MM and NED and MB and MA (Mohammed Aziz) designed the research study. MM and NED
performed the experiments. OA and MA (Mohamed Addi) provided help and advice on
animal experiment. HM and AZ analyzed the data. MM and NED wrote the manuscript.
J-TC, CH, MA (Mohamed Addi) and MA (Mohammed Aziz) review and editing manuscript.
All authors contributed to editorial changes in the manuscript. All authors read
and approved the final manuscript.
Ethics Approval and Consent to Participate
All animals were cared for in accordance with the internationally accepted guide
for the care and use of laboratory animals published by the United States
National Institutes of Health. The study was authorized by the Faculty of
Sciences institutional review board in Oujda, Morocco (01/20-LBBEH-04 and
09/01/2020).
Acknowledgment
Mustapha Badraoui, Karim Ramdaoui, and Abdennabi Joudar are acknowledged for
technical support and animal breeding.
Funding
This work was funded by the budget allocated to research at Mohamed the First
University by the Ministry of National Education, Vocational Training, Higher
Education and Scientific Research.
Conflict of Interest
The authors declare no conflict of interest. JT Chen is serving as one of the Guest editors
of this journal. We declare that JT Chen had no involvement in the peer review of this article and
has no access to information regarding its peer review. Full responsibility for the editorial process for this
article was delegated to Federica Finetti.


 , Nour Elhouda Daoudi 1, Ouafa Amrani 1, Mohamed Addi 2, Christophe Hano 3,*