IMR Press / FBS / Volume 14 / Issue 3 / DOI: 10.31083/j.fbs1403022
Open Access Review
Raman Spectroscopy Techniques for the Investigation and Diagnosis of Alzheimer's Disease
Show Less
1 Institute of Applied Physics “Nello Carrara”, National Research Council, 50019 Sesto Fiorentino, Italy
*Correspondence: p.matteini@ifac.cnr.it (Paolo Matteini)
Academic Editors: Fabio Moda and Giorgio Giaccone
Front. Biosci. (Schol Ed) 2022, 14(3), 22; https://doi.org/10.31083/j.fbs1403022
Submitted: 19 April 2022 | Revised: 4 May 2022 | Accepted: 10 May 2022 | Published: 1 August 2022
Copyright: © 2022 The Author(s). Published by IMR Press.
This is an open access article under the CC BY 4.0 license.
Abstract

Alzheimer’s disease (AD) is the most common neurodegenerative disorder, resulting in memory loss, cognitive decline, bodily function impairment, and finally death. The growing number of people suffering from AD increasingly urges the development of effective early diagnosis and monitoring techniques. Here, we review the most recent developments in the field of Raman-based techniques, which have shown a significant potential in identifying AD by detecting specific biomarkers in biological fluids, as well as in providing fundamental insights into key molecules involved in the disease progression or in the analysis of histological specimens of patients with AD. These techniques comprise spontaneous and resonant Raman spectroscopies, exploit plasmon- or fiber- enhanced effects, such as surface-, tip- or fiber- enhanced Raman spectroscopies, or involve non-linear techniques like coherent Raman scattering. The scientific efforts employed up to now as well as the rapid technological advancements in optical detection instruments (spectrometers, lasers, substrates for analysis, etc.) and the diffusion of advanced data processing methods suggest a leading role of Raman techniques in the perspective of a preclinical or clinical detection of AD.

Keywords
Raman spectroscopy
optical detection
Alzheimer's disease
biomarkers
biological fluids
early diagnosis
label-free methods
1. Introduction

Alzheimer’s disease (AD) affects tens of millions of patients worldwide, representing the most common neurodegenerative disease [1]. Due to the increment of life expectancy, the number of people affected by AD and other forms of dementia is likely to reach about 152 million by 2050 [2]. AD occurs in most cases in subjects over 65, causing memory loss, cognitive decline, progressive impairment of physiological functions and death, usually within 5–12 years from the onset of the symptoms [3]. Despite the fact that the pathogenic mechanism is not completely understood, AD is characterized by the aggregation in the brain of two different proteins: (i) the amyloid-β peptide, which accumulates in the inter-neuronal space forming amyloid plaques; and (ii) the tubulin-associated unit (Tau), which accumulates in the intra-neuronal space forming neurofibrillary tangles [1, 4]. Reduced levels of Aβ42, a lower Aβ42/Aβ40 ratio, and elevated levels of total Tau or hyperphosphorylated Tau, are established cerebrospinal fluid (CSF) biomarkers that are utilized in the clinical practice to diagnose AD [5, 6]. In addition, other biomarkers detected in both CSF and blood have been related with AD, such as: neurofilament light chain (NfL), neuron-specific enolase (NSE), heart fatty acid binding protein (HFABP), chitinase-3-like protein 1 (YKL-40) and visinin-like protein 1 (VLP-1) [5].

AD is commonly detected when irreversible damages in the brain have occurred, and the definitive diagnosis can only be made post-mortem, upon the identification of the aforementioned aggregates. Therefore, a sensitive and affordable method for the diagnosis of AD, which would allow an early therapeutic intervention, represents one of the main challenges in the field.

Raman-based detection techniques have shown a significant potential for the early diagnosis of AD [1, 7]. Raman spectroscopy provides the molecular fingerprint of biosamples in a non-invasive, non-destructive and label-free manner. Weak Raman signals of biomolecules, as well as frequent fluorescence interferences, have fuelled recent technological breakthroughs aimed at overcoming these constraints through signal enhancement techniques, which were then proposed as investigation and diagnostic tools for AD. Previous reviews extensively discussed Raman-based techniques employed in the study and the diagnosis of AD [7, 8, 9, 10, 11, 12]. Consequently, here we will focus on the latest advancements in the field.

2. Raman Spectroscopy (RS)

RS, described by V.C. Raman in 1928, provides information on the molecular vibrations of a sample, by collecting its inelastic scattering signal under a monochromatic excitation wavelength in the UV, visible or near-infrared (NIR) range (Fig. 1) [13]. The interaction of incident light with the vibrational modes of molecules gives rise to an energy loss (Raman Stokes,
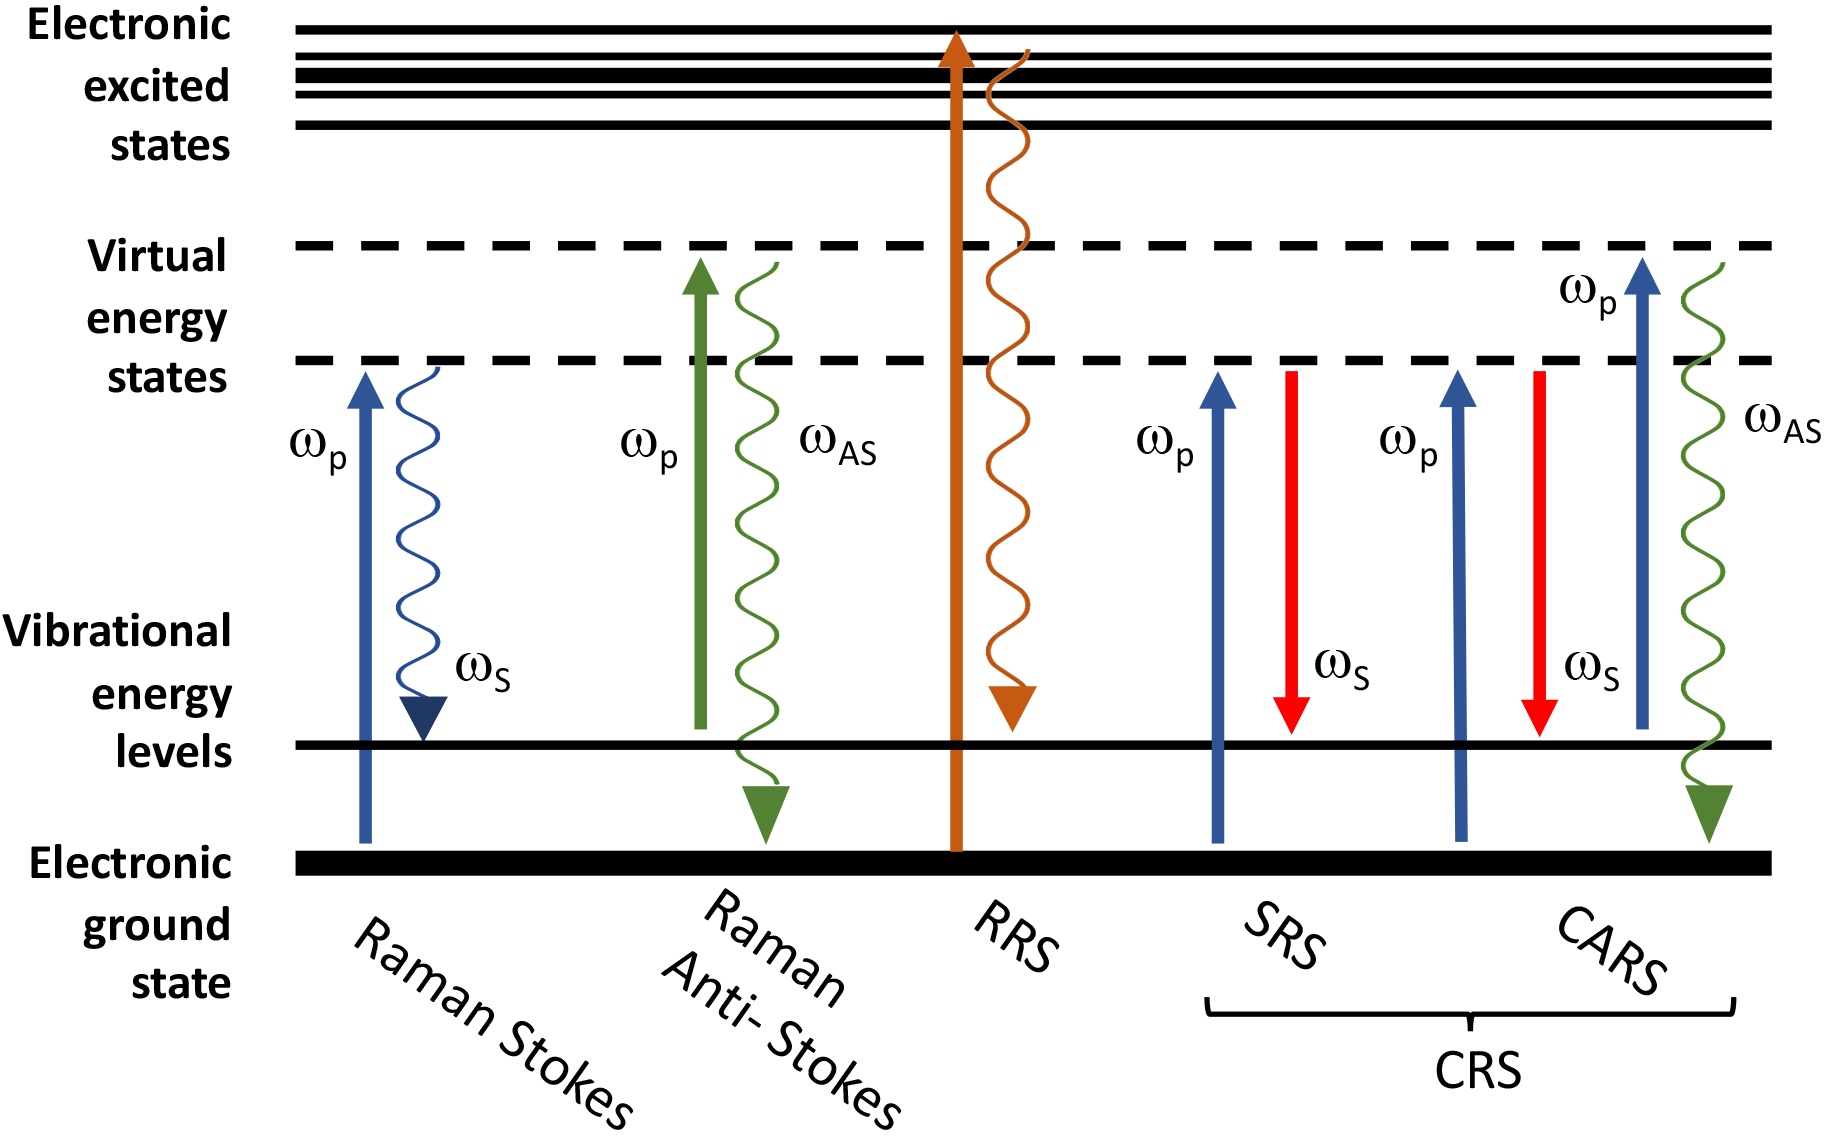
 ωS) or gain (Raman anti-Stokes, ωAS) of the scattered photons, comprising a quantitative and qualitative description of the sample under investigation.

Fig. 1.

Schematic representation of the energy level diagram of Raman scattering processes. From left to right: spontaneous Raman Stokes (ωS) and anti-Stokes emission (ωAS) upon excitation by a laser beam pump ωp; resonant Raman scattering (RRS) that involves the excitation of electronic excited states; coherent Raman scattering (CRS) emissions due to the combination of different laser pump/probe in non-linear effects, such as stimulated Raman scattering (SRS) or coherent anti-Stokes Raman scattering (CARS).

Specifically, information on the chemistry and structure of biomolecules, such as protein secondary or tertiary arrangements, folding states, aggregation, or pH dependent conformations, can be obtained from the analysis of Raman spectra [14, 15, 16, 17]. Exploiting these peculiarities, RS demonstrated great potential for the analysis of AD biosamples, such as histologic specimens and biological fluids. Several studies have shown that Raman experiments can allow detection of amyloid plaques and neurofibrillary tangles in unlabelled samples as derived from human brain tissue of AD patients or in animal models, as well as distinguish them from the surrounding areas [18, 19, 20, 21, 22]. For example, a Raman study in mice demonstrated the ability to differentiate AD from healthy subjects with an accuracy of 85.9%, identifying distinctive disease-related biochemical alterations in retina samples [23].

RS has also shown a high potential in the identification of early-stage AD and its discrimination from late forms of AD and other types of dementia, like dementia with Lewy bodies (DLB), by screening of biological fluids, such as CSF, blood serum and saliva, and analysis of spectral data by machine learning techniques [5, 6, 24, 25]. Exosomes are small extracellular vesicles (sEVs) released from cells into surrounding body fluids. They have been detected in different biological fluids and are now subject of extensive investigation because of their rich protein content involved in a variety of pathological processes. RS has recently been proven as an effective tool for the characterization of sEVs isolated from MC65 cells, and associated with the toxic Aβ42 peptide [26]. Furthermore, the involvement of Aβ42 in sEVs membrane fluidity, due to an alteration to the fatty acid chain lengths, has been identified. These findings could point to a possible mechanism of propagation of neurodegeneration by sEVs carrying toxic oligomers.

3. Resonance Raman Spectroscopy (RRS)

In RRS the energy of the incident photons or, in other words, the wavelength of the excitation laser, is tuned to match the electronic transition of the sample under examination. Such frequency coincidence (or resonance) leads to increased Raman scattering signals, allowing the analysis of molecules that are scarcely or not detected in non-resonance conditions. In essence, selecting the appropriate laser illumination, RRS can highlight signals from desired molecules of the sample, excluding interference from other components or from the background [11]. This technique has been employed in the study of the aggregation and deposition processes of amyloid-β, mediated by metal ions, such as Zn2+ and Cu2+ [11, 27], which are found at high concentration in amyloid plaques. More precisely, RRS allowed to investigate the conformational properties of Cu2+-amyloid-β complexes, which were proposed to play a key role at the initial stages of aggregation [26]. Furthermore, through ab initio calculations of RRS signals it has been possible to identify and characterize fibril-like conformers with an aggregation mechanism mediated by Al3+ [28].

4. Surface-Enhanced Raman Spectroscopy (SERS)

Although spontaneous RS provides excellent chemical specificity, it is an intrinsically weak scattering technique that does not allow the detection of analytes at low concentrations (typically below mM). This is a key constraint when it comes to biosample analysis. SERS relies on the enhanced electromagnetic field arising from the collective oscillation of conduction band electrons, under visible or NIR laser excitation of the surface of noble metal nanoparticles [29]. Thanks to this phenomenon, known as localized surface plasmon resonance (LSPR), the Raman signal of an analyte placed nearby or adsorbed on a nanostructured metal surface (the so-called “hot-spot”) can be enhanced by a factor of up to 1010 [29, 30]. Such signal enhancement allows both the detection and the chemo-structural characterization of trace amounts of main AD biomarkers, such as Aβ40 and Aβ42 amyloid peptides and Tau protein in biological fluids, opening the way to the development of sensitive, non-invasive and label-free methods for the early diagnosis of AD [7, 31]. For example, SERS coupled with multivariate statistical analysis was employed to probe blood serum, obtaining a sensitivity of up to 96% in the discrimination of AD samples from healthy controls [32, 33]. Moreover, human tears were characterized by SERS coupled with multivariate data analysis allowing a discrimination between AD, mild cognitive impairment (MCI), and control subjects [34].

SERS has been also proposed to study key species associated with AD, their structure and aggregation process, in order to shed light on their role in the neurodegenerative mechanism of AD. The secondary structure of different amyloid-β peptides was inspected by SERS to obtain information on the structural rearrangement processes involved in self-aggregation and fibrillation [35]. Similarly, recent SERS studies focused on establishing a relationship between neurotoxicity and structure of different forms of Aβ42 [36, 37].

So far, several SERS nanostructured substrates have been proposed to improve the signal quality and reproducibility or to increase the affinity toward a particular target analyte. They span from colloidal solutions of spherical or quasi-spherical gold and silver nanoparticles, to more complex, assembled or hybrid substrates. For example, dot arrays of silver nanowires were deposited on a hydrophobic substrate of polytetrafluoroethylene for the rapid and sensitive detection of Aβ42 oligomers in liquid [36, 37]. Iodide-modified silver nanoparticles were used to assess the anti-aggregating properties of some compounds, such as Crocein G toward amyloid compounds [38]. Furthermore, an acoustofluidic multimodal sensing platform, based on silver nanoparticles deposited on ZnO nanorods, was developed for the isolation and detection of AD biomarkers in blood plasma [39]. An immobilized-metal affinity strategy was recently employed for the ultrasensitive discrimination of Tau carrying a single phosphorylation on the aminoacid S396 [40]. Employing a hexagonal array of gold pyramids coated with a single molecular layer of graphene different isoforms of Aβ peptide were successfully discriminated by combined SERS and principal component analysis (PCA) [41]. Exploiting a carboxylic acid-functionalized and graphitic nanolayer-coated three-dimensional SERS substrate, composed of a uniform gold nanowire array, the secondary structural changes of amyloid-β and Tau were quantitatively analysed [42]. Ultrasensitive detection of Aβ42 was also achieved by exploiting chiral triangular gold nanorings with a platinum framework [43].

Metal nanostructures can be further conjugated with different functional molecules in order to confer affinity toward specific analytes and improve the detection limit. Nanogap silver cells, conjugated with antibodies specific for Aβ40 or Aβ42, were employed to develop a SERS-based immunoassay for the sensitive and multiplexed detection in human serum [44]. Similarly, a multiplexed SERS biosensing platform, which relies on a specific dye-coded polyA aptamer-gold nanoparticles allowed the simultaneous detection of Aβ42 oligomers and Tau in artificial CSF [45]. For the quantitative determination of Tau in the plasma of AD patients, a SERS-based sensor with a femtomolar detection limit was developed, which involves the use of half antibody fragments immobilized onto gold nanopillars [46]. Tau was also identified by antibody- or streptavidin-conjugated magnetic core SERS substrates [47, 48]. Finally, it was shown that the introduction of a microfluidic platform can overall improve the sensitivity, reproducibility and detection limit of SERS [49].

5. Tip-Enhanced Raman Spectroscopy (TERS)

TERS combines the chemical specificity of Raman spectroscopy with the high spatial resolution of scanning probe microscopy (SPM), providing a non-destructive, direct and label-free chemo-structural characterization at the nanoscale [50, 51, 52]. In a typical TERS experiment a laser excitation wavelength generates a hot-spot on to the apex of a nanometric tip, that is equipped and driven by a scanning probe microscope (including scanning tunnelling microscopy, STM, or atomic force microscopy, AFM). The interaction of the tip with the sample surface reconstructs the morphological image and, upon amplification of the Raman signal, provides a chemo-structural map of the sample with a spatial resolution comparable to the size of the tip’s apex. TERS allowed to study the relationship between structure and neurotoxicity of protein oligomers, such as those formed by the HypF-N model protein [53], providing a direct characterization of the specific amino acid residues that are exposed on the surface of toxic and nontoxic species [54]. Such evaluation provides important information about how the amyloid aggregates can affect cell membrane integrity and signalling pathways. Natural Aβ42 fibrils, as well as two synthetic mutants, were chemically characterized at the scale of a single structure by TERS [55]. In this case, the examination of amide I and III bands allowed to distinguish different geometries of the β-sheets, in highly and less toxic species. Recently, another study performed on Aβ42 fibrils proved that TERS can be used to identify the spectral signatures of specific amino acids and to characterise the secondary structure of the fibrils with a spatial resolution of ~16 nm [56]. Similarly, the morphology and the secondary structure of Tau fibrils were probed by TERS [57]. Furthermore, TERS was used to map the presence of amyloid-β aggregates in proximity of neuronal spines, which have been directly correlated with synapse dysfunction [58].

6. Fiber-Enhanced Raman Spectroscopy (FERS)

The intensity of the Raman signal is directly proportional to the power of the excitation laser and the concentration of the analyte molecules. However, the laser power cannot be increased beyond certain thresholds for technical reasons and without incurring uncontrolled temperature increases, which can damage the sample. FERS can overcome this problem by expanding the interaction between the excitation laser and the analyte molecules. In particular, the use of hollow core fibres (HCFs) permits to confine the excitation and the Raman scattered light in a transmission channel, matching the channel where the sample flows. As a result, the interaction volume is increased through multiple internal reflections, thus raising the Raman scattering events and improving signal collection [59]. For example, an HCF was successfully integrated with a conventional Raman spectroscopic system, and the signal of Aβ42 was 20-fold amplified compared to the conventional Raman signal [60]. The signal was further boosted 10 times by decorating the fiber core with plasmonic nanostructures, which generated an additional SERS effect. Flexibility, cost-effectiveness and low sampling volumes of the HCFs, combined with the portability of handmade Raman systems, makes this approach one of the most attractive tools for in-vivo, label-free and sensitive early diagnosis of AD.

7. Coherent Raman Scattering (CRS)

CRS, that typically includes coherent anti-Stokes Raman scattering (CARS) and stimulated Raman scattering (SRS) effects, is based on nonlinear optical processes that employ multiple photon excitations to stimulate characteristic molecular vibrations of the target molecule. In this way a coherent signal is produced, which is orders of magnitude stronger than the spontaneous Raman scattering [11, 30, 61]. Both of these nonlinear technologically advanced techniques use a first laser beam (ωp) to pump the sample in an excited virtual energy state. Then, in SRS, a second laser beam tuned at the same Stokes frequency of the desired vibration mode (ωS), promotes the stimulated emission. On the other hand, in CARS, the Stokes laser beam is combined with a third pump/probe beam (ωpr, typically tuned at the same frequency of the pump, ωpr = ωp) to resonantly enhance and detect anti-Stokes photons (ωAS = ωpr+ ωpωs = 2ωpωS) (Fig. 1). CARS and SRS were recently employed to characterize amyloid-β plaques by comparing high-resolution images from brain tissues of an AD mouse model [62, 63]. SRS microscopy demonstrated ability to detect disease-induced histological changes, differentiating β-sheets of misfolded amyloid-β from normal proteins and lipids [62]. Similarly, CARS experiments performed on AD human brain tissues, extracted from pre-fontal cortex, highlighted the composition and organization of lipids aggregates on the plaques, contributing to explain the interactions between lipids and amyloids that occur in the formation of toxic Aβ plaques [64].

The main features of RS techniques described in this review, are summarized in Table 1 (Ref. [5, 6, 18, 19, 20, 21, 22, 24, 25, 27, 28, 31, 32, 33, 34, 35, 36, 37, 38, 42, 43, 44, 45, 46, 47, 48, 52, 54, 55, 56, 57, 60, 61, 62, 63, 64]).

Table 1.Key aspects of the Raman-based techniques for the investigation and diagnosis of AD, as described in this review.
Technique Physical principles/adaption Benefits Drawbacks Target samples and concentration/dimensional range
Raman spectroscopy (RS) Inelastic scattering of UV-Vis-NIR light - Non destructive - Weak signals - Brain tissue: resolution at cellular level [18, 19, 20, 21, 22]
- Label free - Resolution limited by diffraction - Biological fluids: CSF, blood, serum, saliva [5, 6, 24, 25]
- Fluorescence background
Resonant RS (RRS) Excitation of electronic transitions of the sample - Signal enhancement due to the “resonance effect” - Fluorescence signal enhancement - ab initio simulations of amyloid-β aggregates [11, 27, 28]
Surface-enhanced RS (SERS) Plasmon resonance effects on metal nanoparticles - Huge signal enhancement (up to 1010) - Metal nanostructures required - Biological fluids: CSF, blood, serum, saliva, tears [31, 32, 33, 34, 44, 46, 47], down to tens fM [31]
- Low detection limit - Signal variability due to nanostructured substrate - Aβ monomers or aggregates, mM-µM [35, 36, 37, 38], down to pM* [43, 45]
- Quenching of fluorescence - Tau protein, µM-pM [42, 43, 46, 47, 48], down to fM * [46]
Tip-enhanced RS (TERS) Plasmon resonance effects on a metal SPM tip - Huge signal enhancement (up to 108) - Experimental complexity and expensive setup - Single structure analysis: oligomer, fibril [54, 55, 56, 57], down to µM [52, 54, 57]
- Nanometric spatial resolution - Signal variability due to tip response
- Low detection limit - Sample heating at the apex of the tip
- Quenching of fluorescence
Fiber-enhanced RS Confinement of light-sample interaction within an optical fiber - Enhanced signal due to increased light-sample scattering events - Requires fine alignment between the spectrometer and the fiber - nL-µL volumes of sample solution, down to µM [60]
- Integrable with handheld Raman systems - Requires coupling with a microfluidic system
- Small samples volumes
- Can be coupled with SERS
Coherent RS Non-linear optical effects that use multiple photons excitations, tuned at defined vibrational frequencies, to generate coherent signals - Increased coherent signals - Single wavelength selection - Brain tissues: resolution at cellular level [61, 62, 63, 64]
- Fast imaging - Expensive setups due high-rate pulsed laser excitation
* calculated values.
8. Concluding Remarks and Future Perspectives

Together with the increase in life expectancy, an increase in the number of people with AD is expected in the near future and this will subsequently lead to an increase in the cost of medical care, as well as in the social cost of supporting the families of people with AD. To date, AD can be diagnosed when irreversible brain damage has already occurred. Therefore, the implementation of efficient methods for early diagnosis could facilitate the adoption of adequate healthcare strategies and the design of more effective therapies.

Herein, we reviewed the most recent advancements in Raman spectroscopies in the investigation and diagnosis of AD, highlighting their potential in revealing the fingerprint of AD biomarkers from biological samples and in discriminating between healthy and diseased specimens. Small amounts of sample required, label-free detection, versatility, sensitivity, and cost convenience of Raman-based techniques, make them very promising in AD research. In this context, AD has recently been linked to neurovascular alterations [65, 66], which could represent a promising target for future Raman investigations of brain tissue [62, 67].

The continuous advancements in the technology and physics of instruments, such as fibers, lasers, confocal systems, microscopes and spectrometers or in the efficacy of the substrates and of the tools for analysis will further contribute to increase the quality of the spectroscopic information. In addition, RS can be coupled with other techniques, such as magnetic resonance imaging (MRI), computed tomography (CT), positron emission tomography (PET), immunohistochemistry and micro-Fourier transform infrared (μFTIR) spectroscopy, to provide more accurate and precise information on the disease and, by means of Big Data Analytics methods and machine learning algorithms, to ultimately distinguish different phenotypes of the pathology. As a result of these advancements, people with AD will have the opportunity to initiate medical treatments earlier during the progression of the disease, benefiting from a more effective therapeutical effect, just as doctors will be able to intervene even before the onset of the disease. Therefore, we can foresee a leading role of Raman techniques in future applications aimed at a preclinical or clinical detection of AD.

Author Contributions

PP wrote the original draft. MB, CD’A, MdeA and PM reviewed and edited the original draft. All authors read and approved the final manuscript.

Ethics Approval and Consent to Participate

Not applicable.

Acknowledgment

We acknowledge our hospital colleagues for their help and discussion.

Funding

We thank the funding support from the European Community and the Italian Ministry of Education University and Research within the EuroNanoMed3 ERANET SPEEDY project (ID 221).

Conflict of Interest

The authors declare no conflict of interest.

Publisher’s Note: IMR Press stays neutral with regard to jurisdictional claims in published maps and institutional affiliations.

References
[1]
Bistaffa E, Tagliavini F, Matteini P, Moda F. Contributions of Molecular and Optical Techniques to the Clinical Diagnosis of Alzheimer’s Disease. Brain Sciences. 2020; 10: E815.
[2]
Patterson C. World Alzheimer report 2018 [Internet]. Alzheimer’s Disease International. 2018. Available at: https://apo.org.au/node/260056 (Accessed: 26 February 2022).
[3]
Vermunt L, Sikkes SAM, van den Hout A, Handels R, Bos I, van der Flier WM, et al. Duration of preclinical, prodromal, and dementia stages of Alzheimer’s disease in relation to age, sex, and APOE genotype. Alzheimer’s & Dementia. 2019; 15: 888–898.
[4]
Pons V, Rivest S. Targeting Systemic Innate Immune Cells as a Therapeutic Avenue for Alzheimer Disease. Pharmacological Reviews. 2022; 74: 1–17.
[5]
Paraskevaidi M, Morais CLM, Halliwell DE, Mann DMA, Allsop D, Martin-Hirsch PL, et al. Raman Spectroscopy to Diagnose Alzheimer’s Disease and Dementia with Lewy Bodies in Blood. ACS Chemical Neuroscience. 2018; 9: 2786–2794.
[6]
Ryzhikova E, Ralbovsky NM, Sikirzhytski V, Kazakov O, Halamkova L, Quinn J, et al. Raman spectroscopy and machine learning for biomedical applications: Alzheimer’s disease diagnosis based on the analysis of cerebrospinal fluid. Spectrochimica Acta Part A: Molecular and Biomolecular Spectroscopy. 2021; 248: 119188.
[7]
Huang CC, Isidoro C. Raman Spectrometric Detection Methods for Early and Non-Invasive Diagnosis of Alzheimer’s Disease. Journal of Alzheimer’s Disease. 2017; 57; 1145–1156.
[8]
Zhou Y, Liu L, Hao Y, Xu M. Detection of aβ Monomers and Oligomers: Early Diagnosis of Alzheimer’s Disease. Chemistry - an Asian Journal. 2016; 11: 805–817.
[9]
Devitt G, Howard K, Mudher A, Mahajan S. Raman Spectroscopy: an Emerging Tool in Neurodegenerative Disease Research and Diagnosis. ACS Chemical Neuroscience. 2018; 9: 404–420.
[10]
Vlasov AV, Maliar NL, Bazhenov SV, Nikelshparg EI, Brazhe NA, Vlasova AD, et al. Raman Scattering: From Structural Biology to Medical Applications. Crystals. 2020; 10: 38.
[11]
Payne TD, Moody AS, Wood AL, Pimiento PA, Elliott JC, Sharma B. Raman spectroscopy and neuroscience: from fundamental understanding to disease diagnostics and imaging. The Analyst. 2020; 145: 3461–3480.
[12]
Luo Z, Xu H, Liu L, Ohulchanskyy TY, Qu J. Optical Imaging of Beta-Amyloid Plaques in Alzheimer’s Disease. Biosensors. 2021; 11: 255.
[13]
Raman CV, Krishnan KS. A New Type of Secondary Radiation. Nature. 1928; 121: 501–502.
[14]
Lippert JL, Tyminski D, Desmeules PJ. Determination of the secondary structure of proteins by laser Raman spectroscopy. Journal of the American Chemical Society. 1976; 98: 7075–7080.
[15]
Maiti NC, Apetri MM, Zagorski MG, Carey PR, Anderson VE. Raman Spectroscopic Characterization of Secondary Structure in Natively Unfolded Proteins:  α-Synuclein. Journal of the American Chemical Society. 2004; 126: 2399–2408.
[16]
Rygula A, Majzner K, Marzec KM, Kaczor A, Pilarczyk M, Baranska M. Raman spectroscopy of proteins: a review. Journal of Raman Spectroscopy. 2013; 44: 1061–1076.
[17]
Kurouski D, Van Duyne RP, Lednev IK. Exploring the structure and formation mechanism of amyloid fibrils by Raman spectroscopy: a review. The Analyst. 2015; 140: 4967–4980.
[18]
Michael R, Lenferink A, Vrensen GFJM, Gelpi E, Barraquer RI, Otto C. Hyperspectral Raman imaging of neuritic plaques and neurofibrillary tangles in brain tissue from Alzheimer’s disease patients. Scientific Reports. 2017; 7: 15603.
[19]
Palombo F, Tamagnini F, Jeynes JCG, Mattana S, Swift I, Nallala J, et al. Detection of aβ plaque-associated astrogliosis in Alzheimer’s disease brain by spectroscopic imaging and immunohistochemistry. The Analyst. 2018; 143: 850–857.
[20]
Lochocki B, Morrema THJ, Ariese F, Hoozemans JJM, de Boer JF. The search for a unique Raman signature of amyloid-beta plaques in human brain tissue from Alzheimer’s disease patients. The Analyst. 2020; 145: 1724–1736.
[21]
Lochocki B, Boon BDC, Verheul SR, Zada L, Hoozemans JJM, Ariese F, et al. Multimodal, label-free fluorescence and Raman imaging of amyloid deposits in snap-frozen Alzheimer’s disease human brain tissue. Communications Biology. 2021; 4: 474.
[22]
Fonseca EA, Lafeta L, Luiz Campos J, Cunha R, Barbosa A, Romano-Silva MA, et al. Micro-Raman spectroscopy of lipid halo and dense-core amyloid plaques: aging process characterization in the Alzheimer’s disease APPswePS1ΔE9 mouse model. The Analyst. 2021; 146: 6014–6025.
[23]
Stiebing C, Jahn IJ, Schmitt M, Keijzer N, Kleemann R, Kiliaan AJ, et al. Biochemical Characterization of Mouse Retina of an Alzheimer’s Disease Model by Raman Spectroscopy. ACS Chemical Neuroscience. 2020; 11: 3301–3308.
[24]
Ralbovsky NM, Halámková L, Wall K, Anderson-Hanley C, Lednev IK. Screening for Alzheimer’s Disease Using Saliva: a New Approach Based on Machine Learning and Raman Hyperspectroscopy. Journal of Alzheimer’s Disease. 2019; 71: 1351–1359.
[25]
Ralbovsky NM, Fitzgerald GS, McNay EC, Lednev IK. Towards development of a novel screening method for identifying Alzheimer’s disease risk: Raman spectroscopy of blood serum and machine learning. Spectrochimica Acta Part A: Molecular and Biomolecular Spectroscopy. 2021; 254: 119603.
[26]
Imanbekova M, Suarasan S, Rojalin T, R. Mizenko R, Hilt S, Mathur M, et al. Identification of amyloid beta in small extracellular vesicles via Raman spectroscopy. Nanoscale Advances. 2021; 3: 4119–4132.
[27]
Ren H, Zhang Y, Guo S, Lin N, Deng L, Yue T, et al. Identifying Cu(II)–amyloid peptide binding intermediates in the early stages of aggregation by resonance Raman spectroscopy: a simulation study. Physical Chemistry Chemical Physics. 2017; 19: 31103–31112.
[28]
Tian B, Cheng C, Yue T, Lin N, Ren H. Chemical identification of the amyloid peptide aggregation-prone Al(III)-peptide complexes by resonance Raman signatures: a computational study. Chemical Physics. 2018; 513: 1–6.
[29]
Tahir MA, Dina NE, Cheng H, Valev VK, Zhang L. Surface-enhanced Raman spectroscopy for bioanalysis and diagnosis. Nanoscale. 2021; 13: 11593–11634.
[30]
Butler HJ, Ashton L, Bird B, Cinque G, Curtis K, Dorney J, et al. Using Raman spectroscopy to characterize biological materials. Nature Protocols. 2016; 11: 664–687.
[31]
Yang B, Jin S, Wang Y, Bao H, Sun J, Chen L, et al. Disease-related proteins determination based on surface-enhanced Raman spectroscopy. Applied Spectroscopy Reviews. 2019; 54: 856–872.
[32]
Ryzhikova E, Ralbovsky NM, Halámková L, Celmins D, Malone P, Molho E, et al. Multivariate Statistical Analysis of Surface Enhanced Raman Spectra of Human Serum for Alzheimer’s Disease Diagnosis. Applied Sciences. 2019; 9: 3256.
[33]
Carlomagno C, Cabinio M, Picciolini S, Gualerzi A, Baglio F, Bedoni M. SERS‐based biosensor for Alzheimer disease evaluation through the fast analysis of human serum. Journal of Biophotonics. 2020; 13: e201960033.
[34]
Cennamo G, Montorio D, Morra VB, Criscuolo C, Lanzillo R, Salvatore E, et al. Surface-enhanced Raman spectroscopy of tears: toward a diagnostic tool for neurodegenerative disease identification. Journal of Biomedical Optics. 2020; 25: 087002.
[35]
Garcia-Leis A, Sanchez-Cortes S. Label-Free Detection and Self-Aggregation of Amyloid β-Peptides Based on Plasmonic Effects Induced by Ag Nanoparticles: Implications in Alzheimer’s Disease Diagnosis. ACS Applied Nano Materials. 2021; 4: 3565–3575.
[36]
Banchelli M, Amicucci C, Ruggiero E, D’Andrea C, Cottat M, Ciofini D, et al. Spot‐on SERS Detection of Biomolecules with Laser‐Patterned Dot Arrays of Assembled Silver Nanowires. ChemNanoMat. 2019; 5: 1036–1043.
[37]
Banchelli M, Cascella R, D’Andrea C, Cabaj L, Osticioli I, Ciofini D, et al. Nanoscopic insights into the surface conformation of neurotoxic amyloid β oligomers. RSC Advances. 2020; 10: 21907–21913.
[38]
Zhang L, Lian W, Li P, Ma H, Han X, Zhao B, et al. Crocein Orange G mediated detection and modulation of amyloid fibrillation revealed by surface-enhanced Raman spectroscopy. Biosensors and Bioelectronics. 2020; 148: 111816.
[39]
Hao N, Wang Z, Liu P, Becker R, Yang S, Yang K, et al. Acoustofluidic multimodal diagnostic system for Alzheimer’s disease. Biosensors and Bioelectronics. 2022; 196: 113730.
[40]
Ma H, Liu S, Liu Y, Zhu J, Han XX, Ozaki Y, et al. In-situ fingerprinting phosphorylated proteins via surface-enhanced Raman spectroscopy: Single-site discrimination of Tau biomarkers in Alzheimer’s disease. Biosensors and Bioelectronics. 2021; 171: 112748.
[41]
Yu X, Hayden EY, Xia M, Liang O, Cheah L, Teplow DB, et al. Surface enhanced Raman spectroscopy distinguishes amyloid Β-protein isoforms and conformational states. Protein Science. 2018; 27: 1427–1438.
[42]
Park HJ, Cho S, Kim M, Jung YS. Carboxylic Acid-Functionalized, Graphitic Layer-Coated Three-Dimensional SERS Substrate for Label-Free Analysis of Alzheimer’s Disease Biomarkers. Nano Letters. 2020; 20: 2576–2584.
[43]
Wang G, Hao C, Ma W, Qu A, Chen C, Xu J, et al. Chiral Plasmonic Triangular Nanorings with SERS Activity for Ultrasensitive Detection of Amyloid Proteins in Alzheimer’s Disease. Advanced Materials. 2021; 33: 2102337.
[44]
Yang J, Hwang I, Cha MG, Kim H, Yim D, Jeong DH, et al. Reaction Kinetics‐Mediated Control over Silver Nanogap Shells as Surface‐Enhanced Raman Scattering Nanoprobes for Detection of Alzheimer’s Disease Biomarkers. Small. 2019; 15: 1900613.
[45]
Zhang X, Liu S, Song X, Wang H, Wang J, Wang Y, et al. Robust and Universal SERS Sensing Platform for Multiplexed Detection of Alzheimer’s Disease Core Biomarkers Using PAapt-AuNPs Conjugates. ACS Sensors. 2019; 4: 2140–2149.
[46]
Yang SJ, Lee JU, Jeon MJ, Sim SJ. Highly sensitive surface-enhanced Raman scattering-based immunosensor incorporating half antibody-fragment for quantitative detection of Alzheimer’s disease biomarker in blood. Analytica Chimica Acta. 2022; 1195: 339445.
[47]
Yu D, Yin Q, Wang J, Yang J, Chen Z, Gao Z, et al. SERS-Based Immunoassay Enhanced with Silver Probe for Selective Separation and Detection of Alzheimer’s Disease Biomarkers. International Journal of Nanomedicine. 2021; 16: 1901–1911.
[48]
Prucek R, Panáček A, Gajdová Ž, Večeřová R, Kvítek L, Gallo J, et al. Specific detection of Staphylococcus aureus infection and marker for Alzheimer disease by surface enhanced Raman spectroscopy using silver and gold nanoparticle-coated magnetic polystyrene beads. Scientific Reports. 2021; 11: 6240.
[49]
Panneerselvam R, Sadat H, Höhn E, Das A, Noothalapati H, Belder D. Microfluidics and surface-enhanced Raman spectroscopy, a win–win combination? Lab on a Chip. 2022; 22: 665–682.
[50]
Zhang Z, Sheng S, Wang R, Sun M. Tip-Enhanced Raman Spectroscopy. Analytical Chemistry. 2016; 88: 9328–9346.
[51]
Deckert-Gaudig T, Taguchi A, Kawata S, Deckert V. Tip-enhanced Raman spectroscopy – from early developments to recent advances. Chemical Society Reviews. 2017; 46: 4077–4110.
[52]
Bonhommeau S, Lecomte S. Tip-Enhanced Raman Spectroscopy: a Tool for Nanoscale Chemical and Structural Characterization of Biomolecules. ChemPhysChem. 2018; 19: 8–18.
[53]
Capitini C, Patel JR, Natalello A, D’Andrea C, Relini A, Jarvis JA, et al. Structural differences between toxic and nontoxic HypF-N oligomers. Chemical Communications. 2018; 54: 8637–8640.
[54]
D’Andrea C, Foti A, Cottat M, Banchelli M, Capitini C, Barreca F, et al. Nanoscale Discrimination between Toxic and Nontoxic Protein Misfolded Oligomers with Tip-Enhanced Raman Spectroscopy. Small. 2018; 14: 1800890.
[55]
Bonhommeau S, Talaga D, Hunel J, Cullin C, Lecomte S. Tip-Enhanced Raman Spectroscopy to Distinguish Toxic Oligomers from Aβ1–42 Fibrils at the Nanometer Scale. Angewandte Chemie International Edition. 2017; 56: 1771–1774.
[56]
Zikic B, Bremner A, Talaga D, Lecomte S, Bonhommeau S. Tip-enhanced Raman spectroscopy of aβ(1-42) fibrils. Chemical Physics Letters. 2021; 768: 138400.
[57]
Talaga D, Smeralda W, Lescos L, Hunel J, Lepejova-Caudy N, Cullin C, et al. PIP2 Phospholipid-Induced Aggregation of Tau Filaments Probed by Tip-Enhanced Raman Spectroscopy. Angewandte Chemie. 2018; 130: 15964–15968.
[58]
Tabatabaei M, Caetano FA, Pashee F, Ferguson SSG, Lagugné-Labarthet F. Tip-enhanced Raman spectroscopy of amyloid β at neuronal spines. The Analyst. 2017; 142: 4415–4421.
[59]
Ding H, Hu DJJ, Yu X, Liu X, Zhu Y, Wang G. Review on All-Fiber Online Raman Sensor with Hollow Core Microstructured Optical Fiber. Photonics. 2022; 9: 134.
[60]
Eravuchira PJ, Banchelli M, D’Andrea C, de Angelis M, Matteini P, Gannot I. Hollow core photonic crystal fiber-assisted Raman spectroscopy as a tool for the detection of Alzheimer’s disease biomarkers. Journal of Biomedical Optics. 2020; 25: 077001.
[61]
Krafft C, Schie IW, Meyer T, Schmitt M, Popp J. Developments in spontaneous and coherent Raman scattering microscopic imaging for biomedical applications. Chemical Society Reviews. 2016; 45: 1819–1849.
[62]
Ji M, Arbel M, Zhang L, Freudiger CW, Hou SS, Lin D, et al. Label-free imaging of amyloid plaques in Alzheimer’s disease with stimulated Raman scattering microscopy. Science Advances. 2018; 4: eaat7715.
[63]
Cunha R, Lafeta L, Fonseca EA, Barbosa A, Romano-Silva MA, Vieira R, et al. Nonlinear and vibrational microscopy for label-free characterization of amyloid-β plaques in Alzheimer’s disease model. The Analyst. 2021; 146: 2945–2954.
[64]
Kiskis J, Fink H, Nyberg L, Thyr J, Li J, Enejder A. Plaque-associated lipids in Alzheimer’s diseased brain tissue visualized by nonlinear microscopy. Scientific Reports. 2015; 5: 13489.
[65]
Nelson AR, Sweeney MD, Sagare AP, Zlokovic BV. Neurovascular dysfunction and neurodegeneration in dementia and Alzheimer’s disease. Biochimica Et Biophysica Acta (BBA) - Molecular Basis of Disease. 2016; 1862: 887–900.
[66]
Lecordier S, Pons V, Rivest S, ElAli A. Multifocal Cerebral Microinfarcts Modulate Early Alzheimer’s Disease Pathology in a Sex-Dependent Manner. Frontiers in Immunology. 2021; 12: 813536.
[67]
Jung GB, Kang SW, Lee G, Kim D. Biochemical Characterization of the Brain Hippocampal Areas after Cerebral Ischemia-Reperfusion Using Raman Spectroscopy. Applied Spectroscopy. 2018; 72: 1479–1486.
Share
Back to top