


 , Shuang Zhi 1, Zibo Yang 1, Na Gu 1, Linlin Dai 1, Jun Cai 1, Juan Wang 2, Dongdong Li 1,*
1 Medicinal Synthesis Research Laboratory, Tianjin Institute of Medical & Pharmaceutical Sciences, 300020 Tianjin, China
2 Department of Genetics, Tianjin Medical University, 300070 Tianjin, China
Abstract
Collagen type XI alpha 1 (COL11A1) is overexpressed in pancreatic cancer and is often associated with poor survival, chemoresistance, and tumor recurrence. However, the role of COL11A1 in pancreatic cancer remains poorly understood.
We explored the correlation between COL11A1 and overall survival in pancreatic cancer patients using Kaplan-Meier survival analysis and validated COL11A1’s regulatory role in the viability of pancreatic cancer cell line PANC-1 using Cell Counting Kit-8 and colony formation assays. To clarify the underlying mechanisms, we further examined COL11A1’s modulation of ferroptosis and autophagy in PANC-1 cells by western blot, reverse transcription quantitative polymerase chain reaction (RT-qPCR), and immunofluorescence assays. Moreover, autophagy agonist rapamycin, inhibitor 3-methyladenine (3-MA), and AKT/Beclin 1 pathway inhibitors were employed to dissect the regulatory crosstalk between COL11A1, autophagy, and ferroptosis.
COL11A1 expression was negatively correlated with pancreatic cancer patients’ survival rate. Its overexpression significantly enhanced the viability and clonogenic capacity of erastin- and rapamycin-treated PANC-1 cells. Our data showed that COL11A1 reduced intracellular iron levels, suppressed reactive oxygen species accumulation, downregulated malondialdehyde and microtubule—associated protein 1 light chain 3—II/I (LC3II/I) expression, while increasing glutathione (GSH), ferritin heavy chain 1 (FTH1) and solute carrier family 7 member 11 (SLC7A11) levels. Furthermore, COL11A1-mediated ferroptosis inhibition was attenuated by the autophagy agonist Rapamycin but enhanced by the inhibitor 3-MA. Notably, COL11A1 promoted AKT and Beclin 1 phosphorylation, and blocking the AKT/Beclin 1 pathway abrogated its ability to suppress autophagy and ferroptosis in pancreatic cancer cells.
The study demonstrated that COL11A1 exerts its oncogenic effects by suppressing autophagy via the AKT/Beclin 1 pathway, consequently inhibiting ferroptosis in pancreatic cancer cells. These findings reveal a novel molecular mechanism through which COL11A1 promotes tumor progression and provide a potential therapeutic target for pancreatic cancer treatment.
Keywords
- collagen type XI alpha 1 chain
- ferroptosis
- autophagy
- AKT/Beclin 1 pathway
- pancreatic ductal carcinoma
Pancreatic cancer is a highly aggressive malignancy with a dismal prognosis and
limited therapeutic advancements. Pancreatic ductal adenocarcinoma (PDAC)
accounts for 85–90% of cases—it arises from pancreatic ductal epithelial
cells, characterized by dense stroma, high metastatic potential, and inherent
therapeutic resistance. GLOBOCAN 2020 reports ~496,000 new cases
and 466,000 deaths annually globally. Set to be the US’s second leading cancer
killer by 2030 (~64,000 new cases in 2024), China records
~128,000 new cases and 121,000 deaths yearly. With
Collagen type XI alpha 1 (COL11A1) belongs to the collagen family. While it plays a role in skeletal development [3], it is also significantly associated with tumor metastasis, treatment resistance, and poor prognosis in various solid tumors such as colorectal, breast, and ovarian cancers [4, 5]. As a key component of the extracellular matrix, COL11A1 serves as a predictive marker for aggressive immune infiltration in pancreatic cancer and regulates signaling pathways involved in cell survival and stress responses [6]. Among these, autophagy and ferroptosis have garnered widespread attention due to their dual roles in tumor progression and treatment resistance. Investigating whether COL11A1 influences PDAC development by regulating autophagy-ferroptosis crosstalk may provide novel insights into its oncogenic mechanisms.
Studies have shown that members of the collagen family, such as Collagen I and Collagen VI, are closely associated with cellular autophagy [7, 8], suggesting that Collagen XI may also be involved in this process. Autophagy and regulated cell death, such as ferroptosis, can determine cellular fate by activating interconnected signaling cascades and regulating gene expression profiles [9]. Autophagy, also known as “self-eating”, is a group of mechanisms that transport proteins and organelles to the lysosome or vacuole for destruction [10]. It is essential for tissue and cellular homeostasis, and dysregulation of autophagy is associated with numerous pathologies, including neurodegenerative diseases, cancer, and Crohn’s disease [11]. An important autophagy protein, Beclin 1, can form different complexes that are involved in autophagosome initiation and autolysosome maturation. Beclin 1-dependent autophagy protects multiple organs, such as the heart, lung and liver, during the pathogenesis of sepsis [12]. Under specific conditions, autophagy plays a key role in driving ferroptosis [13, 14]. Autophagy-mediated ferritin deposition may influence the efficacy of anticancer therapy, the progression of inflammatory responses, and the occurrence and development of tissue fibrosis [9, 15].
Ferroptosis, a newly identified iron-dependent cell death modality, is characterized by intracellular iron accumulation, lipid peroxidation product (malondialdehyde [MDA]) accumulation, glutathione depletion, and reduced glutathione peroxidase 4 (GPX4) activity, ultimately causing lipid membrane damage and perforation [16, 17, 18]. Ferroptosis can be induced by either the intrinsic or extrinsic mechanism. The intrinsic pathway is predominantly activated by suppressing the expression or function of intracellular antioxidant enzymes, such as GPX4. In contrast, the extrinsic pathway is initiated by modulating transporters, including inhibiting the amino acid antiporter system xc or activating the iron transporters transferrin and lactotransferrin [19]. Mitochondria have a dual function in this process: they produce reactive oxygen species (ROS) that increase oxidative stress and release stored iron, which enhances Fenton reactions that intensify lipid peroxidation [20]. Accumulating evidence supports ferroptosis modulation (induction or inhibition) as a promising cancer therapeutic strategy, enhancing radiotherapy [21] and chemotherapy efficacy [22, 23]. Characterized by hyperactive mitochondrial fission and inherently strained redox balance, inducing ferroptosis is a promising therapeutic strategy for PDAC [24], thus making elucidation of ferroptosis regulatory mechanisms crucial for developing effective therapies.
Activation of AMP-activated protein kinase (AMPK) and AKT is closely associated with ROS production [25], and both play important roles in autophagy and lipid metabolism [26, 27, 28]. The ROS/AMPK/mTOR pathway can induce autophagy, while ROS inhibits AKT activity through dephosphorylation of AKT at Ser-473 [29]. Beclin 1 is a key autophagic protein and also a molecular target of AKT. AKT-mediated phosphorylation of Beclin 1 plays a role in autophagy inhibition [30]. Thus, we speculated that COL11A1 regulates autophagy through the AKT/Beclin 1 signaling pathway.
In the present study, we investigated the biological role and underlying molecular mechanism of COL11A1 in autophagy and ferroptosis in PDAC. We demonstrate that COL11A1 inhibits ferroptosis in PDAC by suppressing AKT/Beclin 1-dependent autophagy.
The PANC-1 PDAC cell line was purchased from Procell Life Science & Technology Co., Ltd. (Wuhan, China). The cell lines used in this study were authenticated by short tandem repeat (STR) profiling and and tested negative for mycoplasma. Small interfering RNAs (siRNAs) against Beclin 1 were synthesized by GenePharma (Shanghai, China), the sequences are shown in Table 1. We obtained the pCMV3-COL11A1 plasmid from Sino Biological (Cat.No: HG18256-UT; Beijing, China). LY294002 (a PI3K inhibitor) and erastin (a ferroptosis promoter) were obtained from Beyotime (Shanghai, China). Rapamycin (RAPA, autophagy promoter) was obtained from MedChemExpress (Cat.No: HY-10219, Monmouth Junction, NJ, USA).
| Gene | siRNA sequences (5′ to 3′) |
| siBeclin 1-1 | 5′-GGAGTCTCT GACAGACAAA-3′ |
| siBeclin 1-2 | 5′-GGAGCCAUUUAUUGAAACUTT-3′ |
Cells were seeded in 96-well plates before receiving different treatments. Cell viability was assessed at 24, 48, and 72 h intervals using a Cell Counting Kit-8 (CCK-8) assay in accordance with the manufacturer’s instructions. After the indicated treatments, cells seeded in a 96-well plate were incubated with 10 µL of CCK-8 reagent (Cat.No: CK04, Dojindo, Kumamoto, Japan) per 100 µL of culture medium for 1–4 h at 37 °C in a humidified incubator. The absorbance at 450 nm was then measured.
All cellular extracts were obtained by lysis in radio-immunoprecipitation assay (RIPA) buffer (Solarbio, Beijing, China). Protein concentrations were determined using a bicinchoninic acid (BCA) kit (ThermoFisher Scientific, Waltham, MA, USA). Subsequently, 30 µg protein per sample was separated by 10% sodium dodecyl sulfate polyacrylamide gel electrophoresis (SDS-PAGE) and electrotransferred onto a polyvinylidene difluoride (PVDF) membrane. After blocking with 5% non-fat milk, the membrane was incubated with primary antibodies at 4 °C overnight, followed by incubation with the corresponding secondary antibody for 1 h. Finally, protein bands were detected using ECL reagent (Millipore, Burlington, MA, USA) and visualized using the LAS500 gel imaging system (GE, Massachusetts, NY, USA). The antibodies used are listed in Table 2.
| Name | Company | Catalog number | Antibody concentration |
| GPX4 | Cell Signaling Technology, USA | #52455S | 1:1000 |
| NCOA4 | Cell Signaling Technology, USA | #66849S | 1:1000 |
| FTH1 | Cell Signaling Technology, USA | #3998S | 1:1000 |
| p62 | Cell Signaling Technology, USA | #5114S | 1:1000 |
| AKT | Cell Signaling Technology, USA | #9272S | 1:1000 |
| p-AKTSer473 | Cell Signaling Technology, USA | #4060S | 1:2000 |
| LC3 | Cell Signaling Technology, USA | #12741S | 1:1000 |
| mTOR | Cell Signaling Technology, USA | #2972S | 1:1000 |
| p-mTOR | Cell Signaling Technology, USA | #5536T | 1:1000 |
| Beclin 1 | Cell Signaling Technology, USA | #3738S | 1:1000 |
| p-Beclin 1 | Cell Signaling Technology, USA | #14717S | 1:1000 |
| Sungene Biotech, China | #KM9001 | 1:5000 | |
| Goat anti-rabbit IgG | ZSGB-Bio, China | #ZB-2301 | 1:5000 |
| Goat anti-mouse IgG | ZSGB-Bio, China | #ZB-2305 | 1:5000 |
Total RNA was extracted using the Total RNA Extraction Kit (Promega, Madison, WI, USA) according to the manufacturer’s instructions. Then, it was reverse-transcribed into cDNA using a HiFiScript first-strand cDNA synthesis kit (CWBIO, Beijing, China). Real-time PCR was performed using ChamQTM Universal SYBR qPCR Master Mix (CWBIO, Beijing, China) and detected using an Applied Biosystems 7500 Fast Dx Real-time PCR Instrument (Thermo Fisher Scientific, Rockford, IL, USA). The relative mRNA expression was calculated using the 2-ΔΔCt method. The primer sequences used in this study are listed in Table 3.
| Gene | Primers sequences (5′ - 3′) |
| GAPDH | F: AGCCACATCGCTCAGACAC |
| R: GCCCAATACGACCAAATCC | |
| FTH1 | F: TGAAGCTGCAGAACCAACGAGG |
| R: GCACACTCCATTGCATTCAGCC | |
| GPX4 | F: ACAAGAACGGCTGCGTGGTGAA |
| R: GCCACACACTTGTGGAGCTAGA | |
| SLC7A11 | F: TCCTGCTTTGGCTCCATGAACG |
| R: AGAGGAGTGTGCTTGCGGACAT | |
| LC3 | F: GATGTCCGACTTATTCGAGAGC |
| R: TTGAGCTGTAAGCGCCTTCTA | |
| P62 | F: AGAACGTTGGGGAGAGTGTG |
| R: GCGATCTTCCTCATCTGCTC |
PANC-1 cells were seeded onto coverslips placed in a 24-well plate. After treatment, the cells on the coverslips were fixed and permeabilized followed by blocking in 10% goat serum for 1 h. Then the coverslips were incubated with LC3 antibody (1:200) at 4 °C overnight, followed by incubation with fluorescently labeled secondary antibody at room temperature for 1 h. Nuclei were stained with DAPI. After washing three times with phosphate buffered saline with Tween-20 (PBST), images were captured using a fluorescence microscope.
FeRhoNox-1 (Cat. No.: MX4558; MaokangBio, Shanghai, China) was used to detect intracellular iron content. Cells were seeded in 24-well plates, cultured overnight, and then treated with rhCOL11A1/pCMV3-COL11A1 and erastin for 48 h. After collection, cells were washed twice with preheated PBS, incubated with 5 µM FeRhoNox-1 at 37 °C for 60 min in the dark, and then washed three times with preheated PBS. Nuclei were stained with DAPI, followed by three additional PBS washes, and images were acquired by fluorescence microscopy. Differences in average fluorescence intensity reflect varying intracellular iron levels.
BODIPY™ 581/591 C11 (Cat.No.: D3861; Thermo Fisher Scientific, USA) was used to detect intracellular lipid peroxidation. Cells were seeded in 24-well plates, cultured overnight, and treated with rhCOL11A1/pCMV3-COL11A1 and erastin for 48 h. After collection, cells were washed twice with preheated PBS, incubated with 10 µM BODIPY™ 581/591 C11 at 37 °C for 30–60 min in the dark, and washed three times with preheated PBS. Nuclei were stained with DAPI, followed by three additional PBS washes. Images were captured via fluorescence microscopy, and differences in average fluorescence intensity reflect varying levels of lipid peroxidation.
PANC-1cells were seeded onto coverslips that had been previously placed in a 24-well plate. Following treatment, cells were washed and incubated with JC-1 working solution at 37 °C for 30 min. After washing three times with pre-warmed buffer to eliminate unbound dye, fluorescence detection was performed immediately, with red fluorescence indicating aggregated JC-1 and green fluorescence representing monomeric JC-1. A Mitochondrial Membrane Potential Detection Kit (JC-1) was purchased from Beyotime (No: C2006).
Cells were seeded into 6-well plates and cultured overnight. After different treatments, each sample was collected and washed twice with PBS. The cell precipitate was resuspended in a reagent with a volume three times that of the precipitate, and the resulting suspension was lysed by ultrasound (200 W, ultrasound 3 s, interval 10 s, repeated 30 times) and centrifuged at 4 °C for 10 min. Then the samples were analyzed using a glutathione (GSH) content detection kit (No: BC1175; Solarbio).
After treatment, the cells were collected and incubated in lysis buffer for 2 h at 4 °C. Then the mixture was centrifuged for 10 min to obtain the supernatant for subsequent analyses. Cell samples were lysed in ice-cold RIPA buffer containing protease inhibitors. After centrifugation, the supernatant was collected. For the reaction, 100 µL of supernatant was mixed with 200 µL of 8.1% SDS, 750 µL of thiobarbituric acid (TBA) working solution (0.8% thiobarbituric acid in 20% acetic acid, pH 3.5), and 750 µL of 20% acetic acid. The mixture was vortexed, incubated at 95 °C for 60 minutes, and then cooled on ice. Absorbance was measured at 532 nm in a 96-well plate. MDA concentration was quantified against a standard curve prepared using tetraethoxypropane and normalized to total protein content determined by the BCA assay. Lipid peroxidation was quantified using an MDA assay kit (No: S0131S; Beyotime).
Cells were seeded in a 24-well plate and treated for 48 h. After discarding the culture medium, the samples were processed for analysis according to the manufacturer’s protocol. Intracellular ROS levels were measured via immunofluorescence assays using an ROS assay kit (No: S0033s; Beyotime).
PANC-1 cells were seeded into 6-well plates at a density of 3
The nude mice (BALB/c-nu, weighing 13~16 g) were purchased from
Beijing Vital River Laboratory Animal Technology Co., Ltd. To establish
subcutaneous xenograft models, 20 nude mice were randomly divided into two
groups. The control group (n = 5) received subcutaneous injection of PANC-1 cells
at a dose of 5
Treatment began when the implanted tumors reached a volume of approximately 50 mm3, and the mice were divided into four groups. The control group was administered with physiological saline via intraperitoneal injection. A total of 15 nude mice inoculated with the COL11A1-overexpressing cell line were equally divided into three subgroups, with the following treatment regimens applied via intraperitoneal injection respectively: The first subgroup received physiological saline; the second subgroup was treated with erastin at a dose of 30 mg/kg, 2–3 times per week; the third subgroup was given RAPA at a dose of 4 mg/kg, 2–3 times per week. All experimental animals were humanely euthanized by cervical dislocation in accordance with institutional animal care and use guidelines.
Tumor volumes were calculated from formula: TV = 1/2
The experimental procedures and the animal use and care protocols were approved by the Committee on Ethics of Tianjin Institute of Medical and Pharmaceutical Sciences.
All statistical analyses and graphical visualizations were conducted with
GraphPad Prism v 6.0.1 for Windows (GraphPad Software, Boston, MA, USA). Data
from three independent experiments are presented as the mean
Kaplan Meier survival analysis showed that the expression of COL11A1 was negatively correlated with the survival rate of patients with pancreatic cancer (Fig. 1a). The results of the CCK-8 assay showed that COL11A1 inhibited PANC-1 cell death, and erastin and RAPA weakened the effects of COL11A1 on PANC-1 cells (Fig. 1b,d). Moreover, cloning experiments confirmed that COL11A1 inhibits PANC-1 cell death, and that its inhibitory mechanism may be linked to autophagy and ferroptosis (Fig. 1c).These results indicate that COL11A1 inhibits pancreatic cancer cell death by regulating autophagy and ferroptosis.
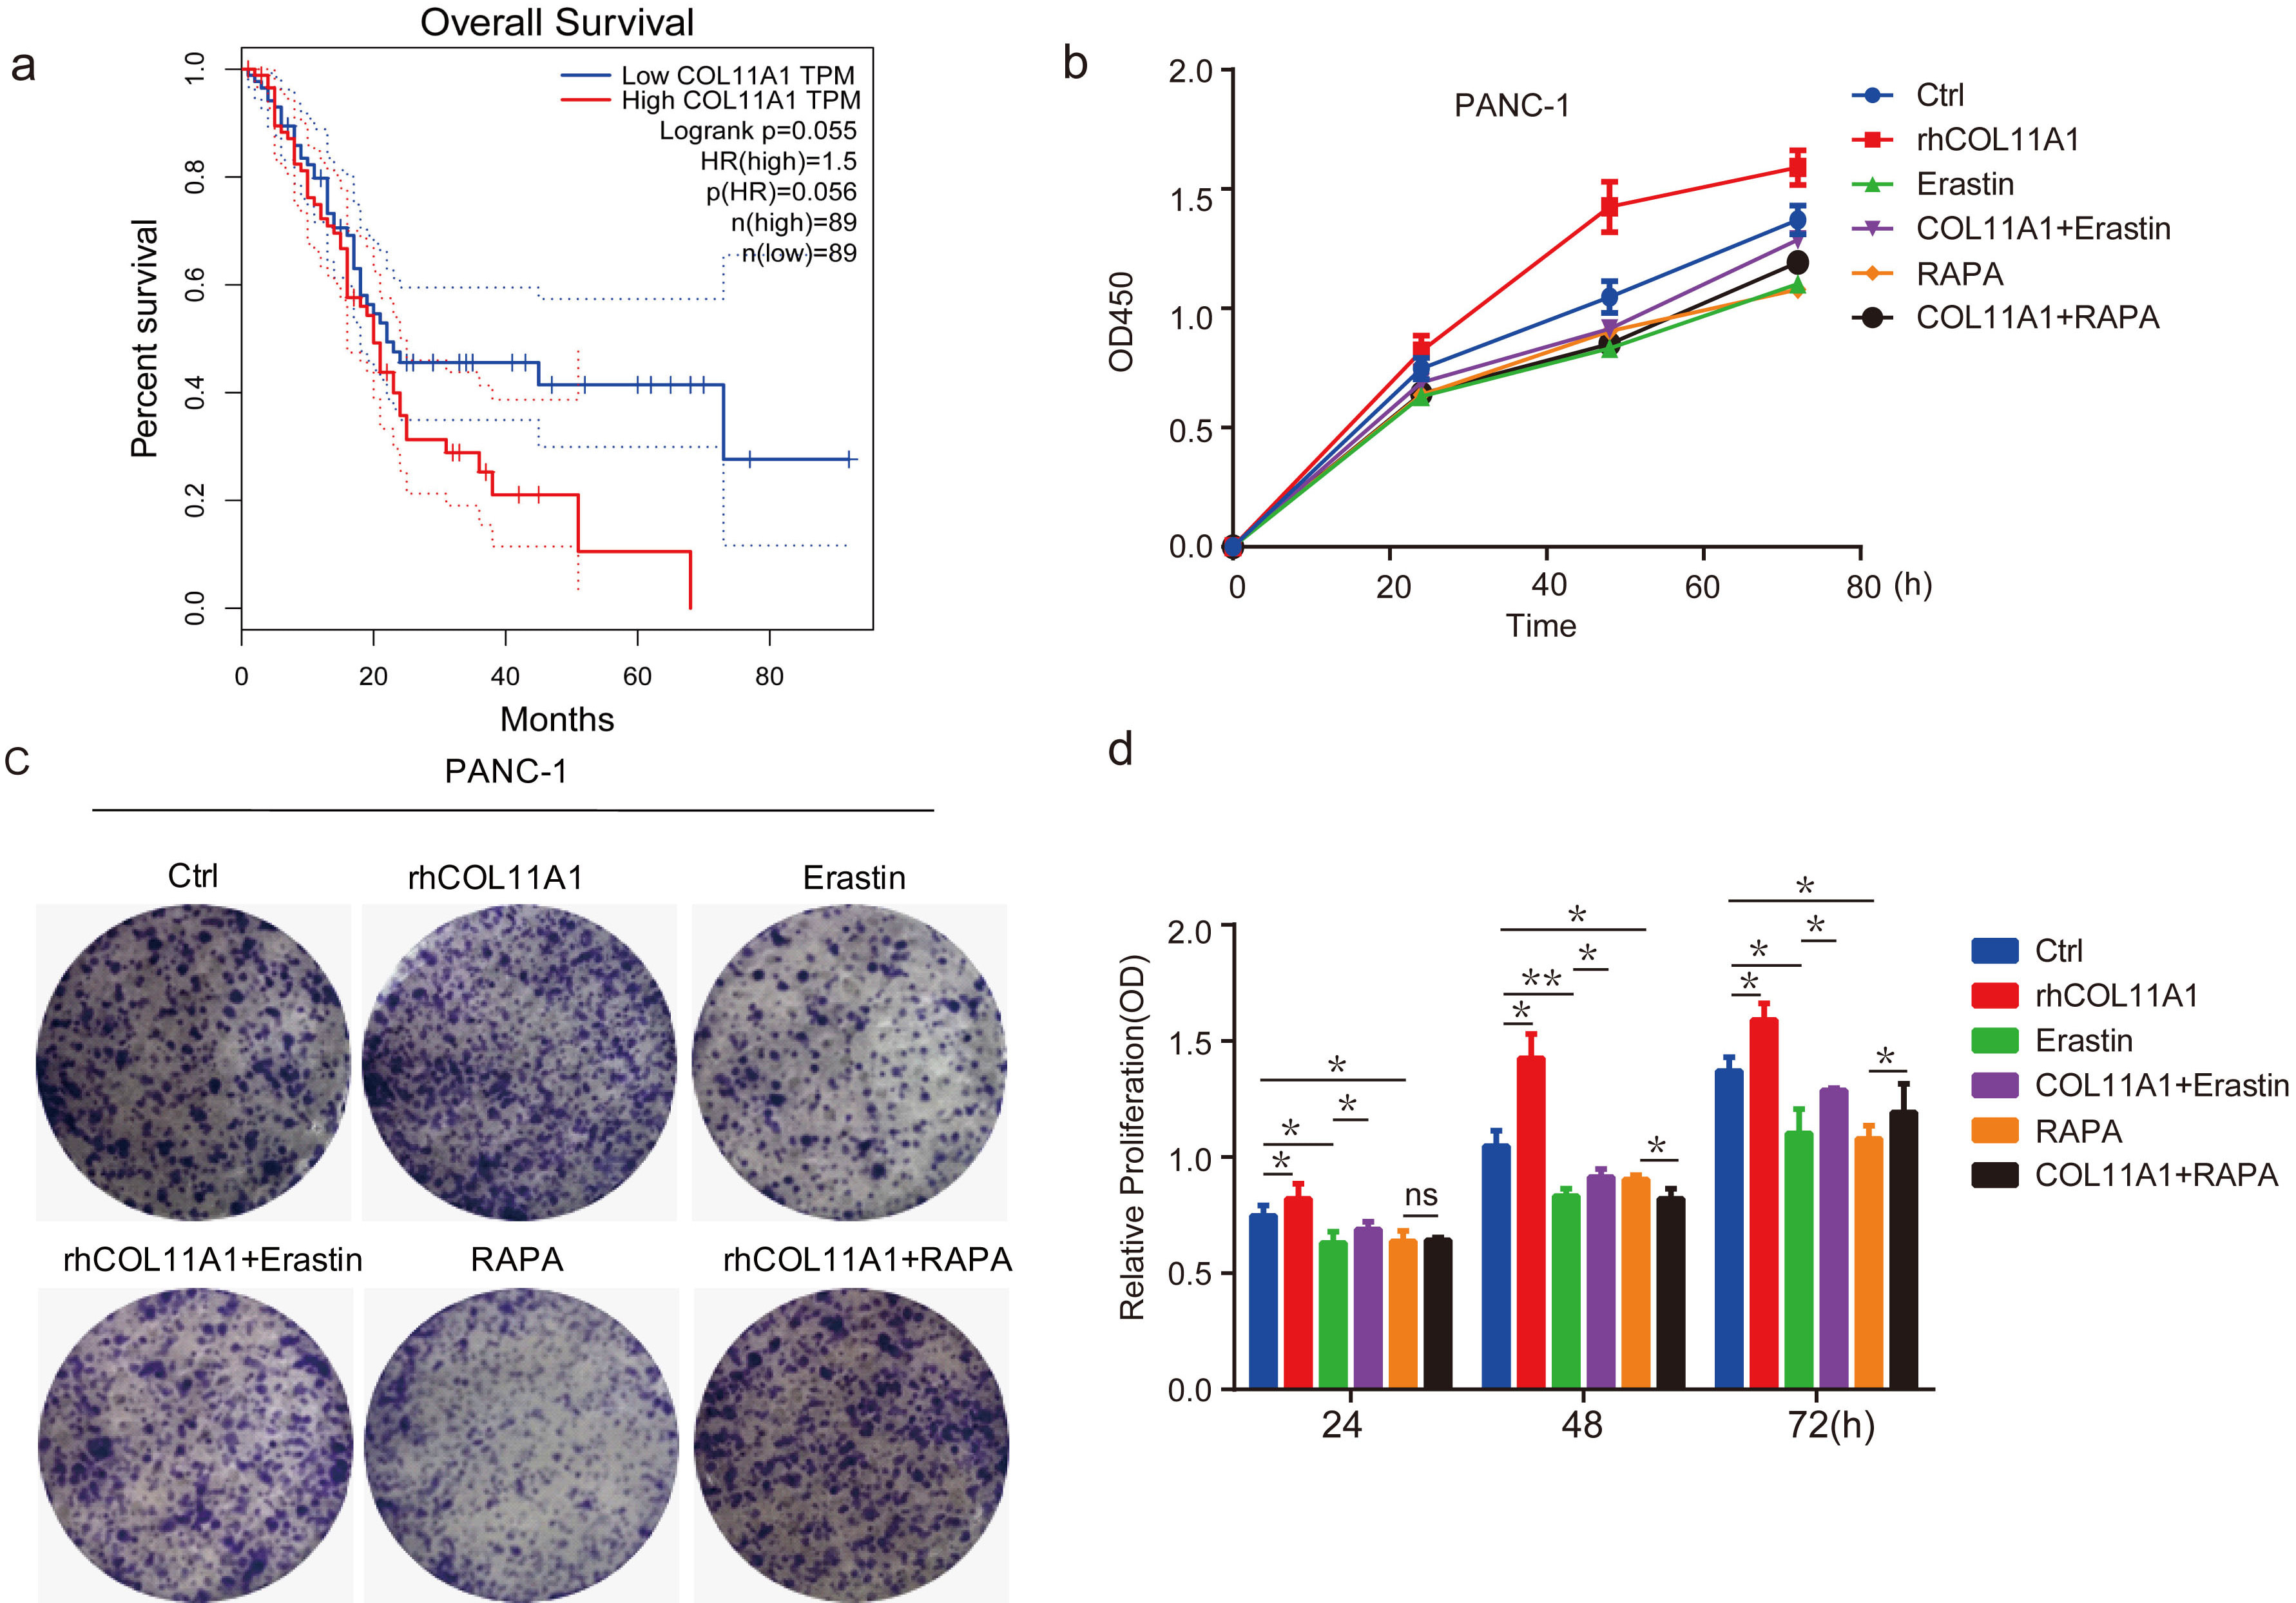 Fig. 1.
COL11A1 inhibited PANC-1 cell death by regulating
autophagy and ferroptosis. (a) Kaplan–Meier Analysis of the correlation between
COL11A1 expression and survival outcomes in patients with pancreatic cancer.
(b) CCK-8 assay was used to detect cell viability under different treatments with
COL11A1, erastin (10 µM), or RAPA (100 nM). (c) Colony formation assay was
performed in PANC-1 cells with different treatments. (d) CCK-8 assay was
performed, and the results are presented as a bar chart showing the viability of
PANC-1 cells among different treatment groups. Data are expressed as the mean
To further validate that COL11A1 participates in regulating ferroptosis in pancreatic cancer cells, we performed western blotting to assess the expression of key ferroptosis-related proteins under COL11A1 modulation. The data demonstrated that COL11A1 significantly enhanced the protein and mRNA expression levels of GPX4, ferritin heavy chain 1 (FTH1), and solute carrier family 7 member 11 (SLC7A11), supporting its regulatory role in the ferroptosis process (Fig. 2a and Fig. 3c). Iron ion content and lipid peroxidation are key indicators of ferroptosis. Specifically, MDA is an end-product marker of lipid peroxidation, whereas GSH is a key antioxidant molecule inhibiting lipid peroxidation. In PANC-1 cells treated with COL11A1, MDA levels were decreased whereas GSH levels were increased (Fig. 2b). Next, the BODIPY 581/591 C11 probe was used to detect lipid peroxidation levels in erastin-pretreated PANC-1 cells. Cells in the COL11A1 treatment groups exhibited a distinct fluorescence shift from green to red, indicating a significant reduction in lipid peroxidation levels (Fig. 2d). Given that lipid peroxidation primarily occurs in mitochondria, we used the JC-1 probe to detect mitochondrial membrane potential (MMP) changes in PANC-1 cells. The COL11A1 treatment group showed predominant red fluorescent J-aggregates, indicating that COL11A1 attenuated erastin-induced MMP disruption in PANC-1 cells (Fig. 2c). Finally, we performed immunofluorescence staining to assess the intracellular levels of iron and ROS—two core mediators of ferroptosis. The results showed that compared with the control group, iron and ROS levels were significantly downregulated in PANC-1 cells treated with COL11A1 (Fig. 2e,f). Furthermore, no significant differences were observed in the key ferroptosis-related indicators between the rhCOL11A1 treatment group and the pCMV3-COL11A1-transfected group. Taken together, these results demonstrated that COL11A1 exerts an inhibitory effect on ferroptosis in PANC-1 cells.
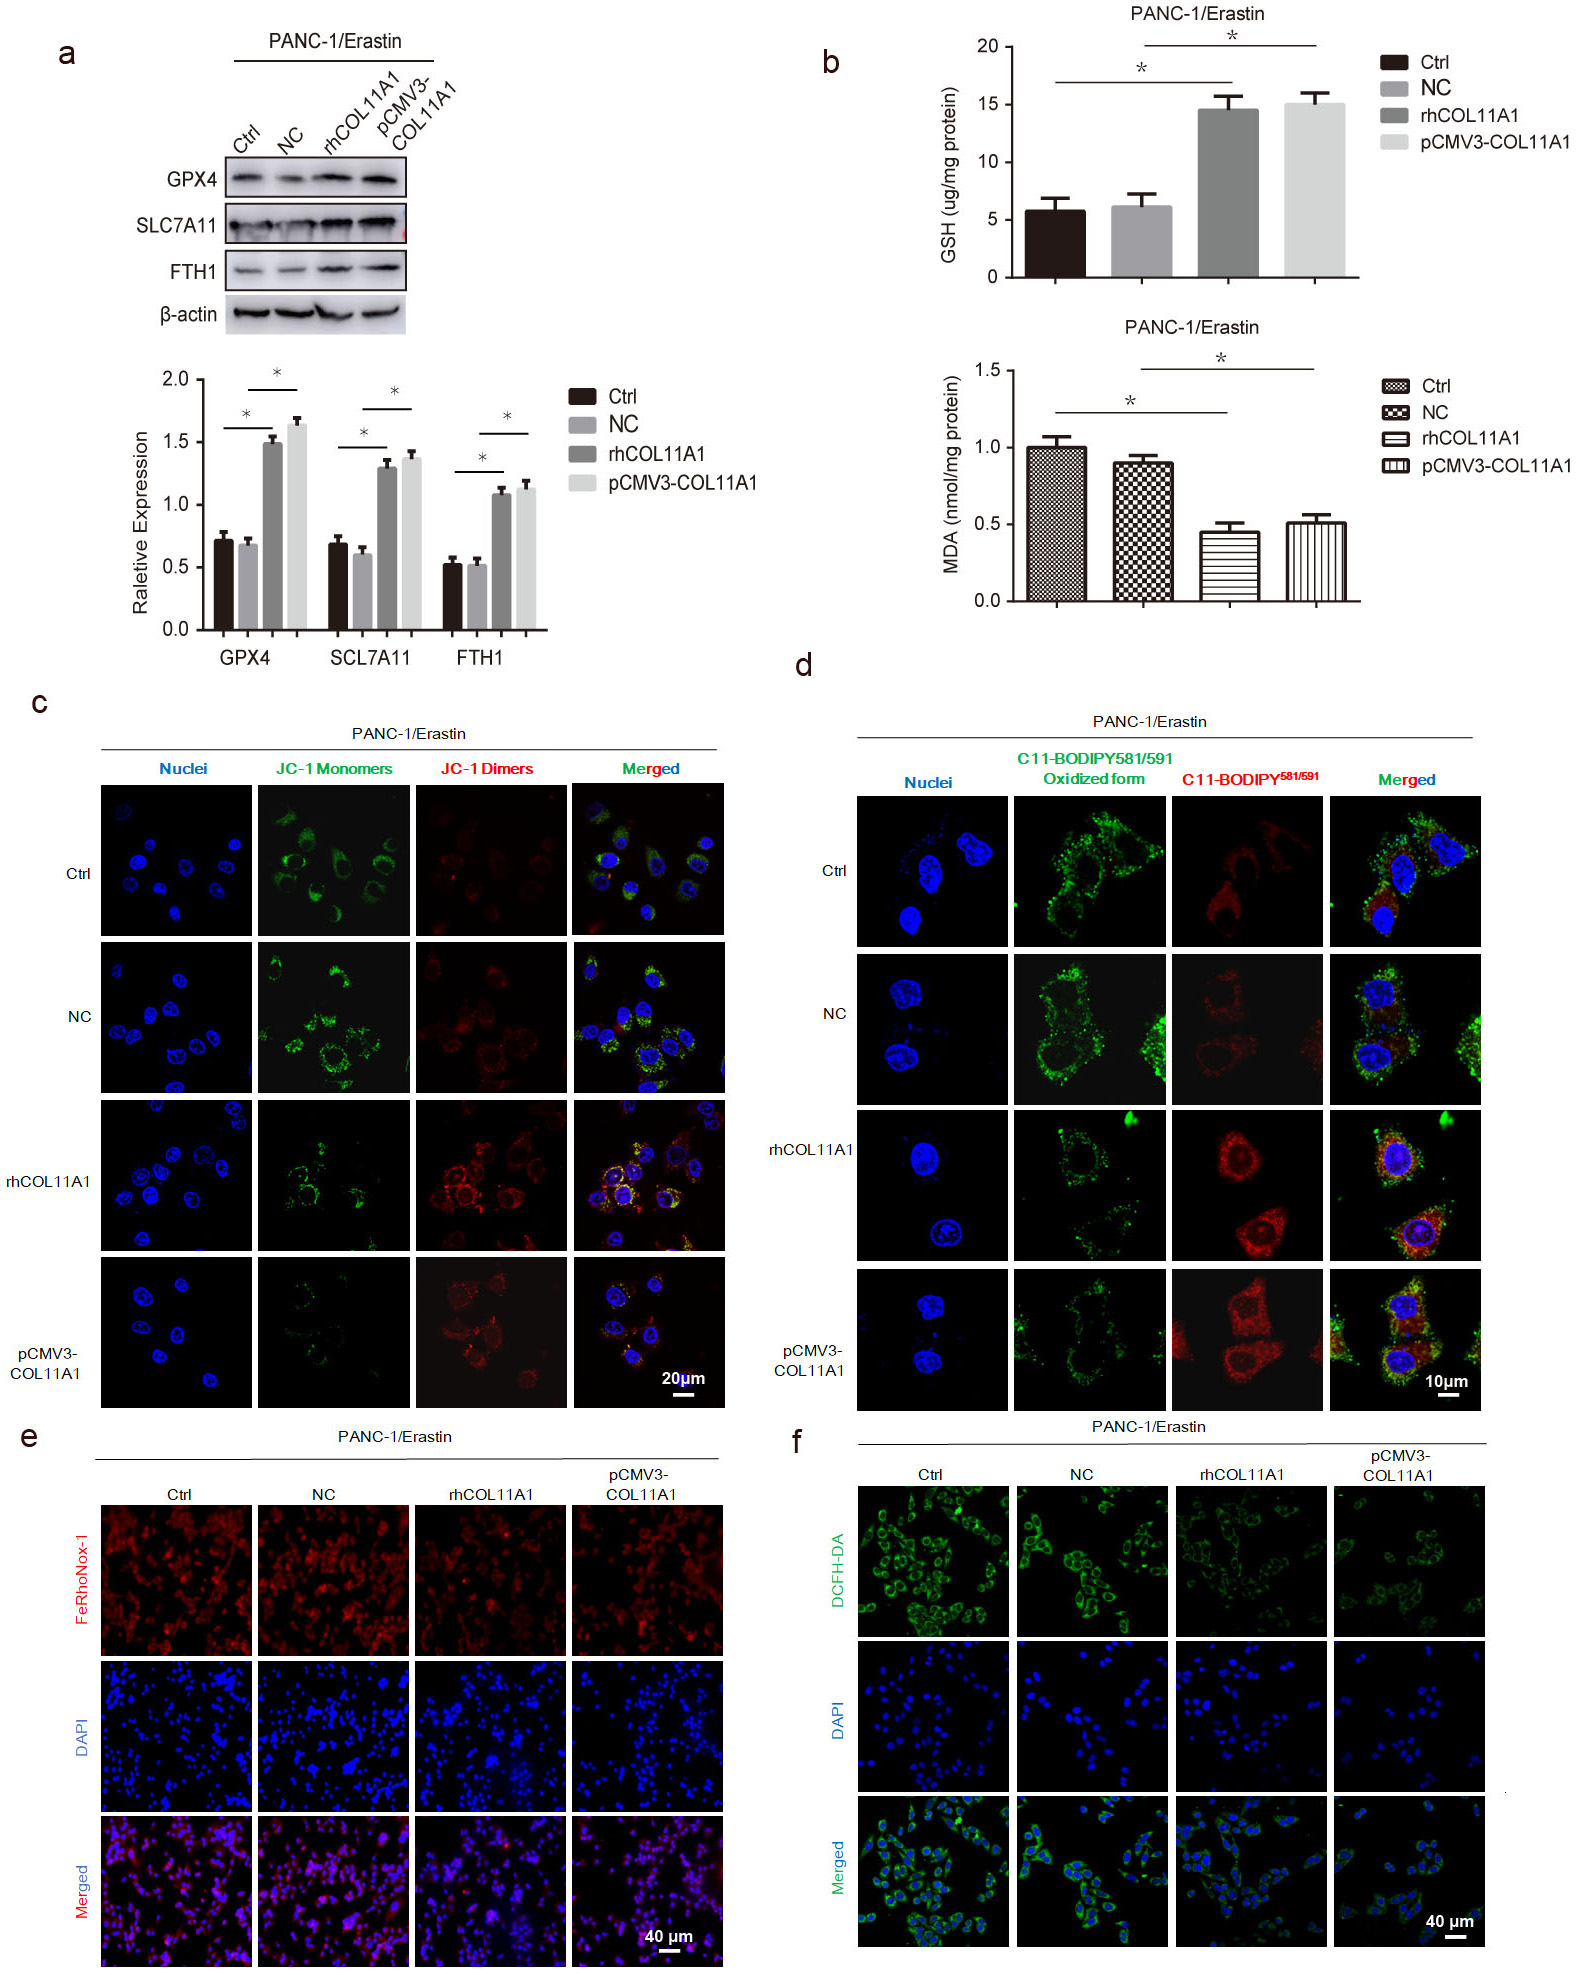 Fig. 2.
COL11A1 inhibited ferroptosis in pancreatic cancer cells. (a)
Western blotting was used to detect the protein expression levels of GPX4,
SLC7A11, and FTH1 under treatment with erastin (10 µM) and transfected
pCMV3-COL11A1, or rhCOL11A1. (b) GSH/MDA kit was used to detect the expression
level of GSH/MDA under treatment with erastin (10 µM) and transfected
pCMV3-COL11A1 or rhCOL11A1. (c) The JC-1 probe was employed to assess the impact
of COL11A1 on MMP. Scale bar: 20 µm. (d) Representative images of
C11-BODIPY581/591 stained COL11A1 overexpressed PANC-1 cells treated with 10
µM erastin for 12 h. A shift in the green-to-red ratio indicates
lipid oxidation. Scale bar: 10 µm. (e) The FeRhoNox-1 probe was employed to
determine the iron ion concentration under different treatment conditions. Scale
bar: 40 µm. (f) Immunofluorescence was used to detect the expression of ROS
by adding DCFH-DA under different treatment. Scale bar: 40 µm.
n = 3, *p
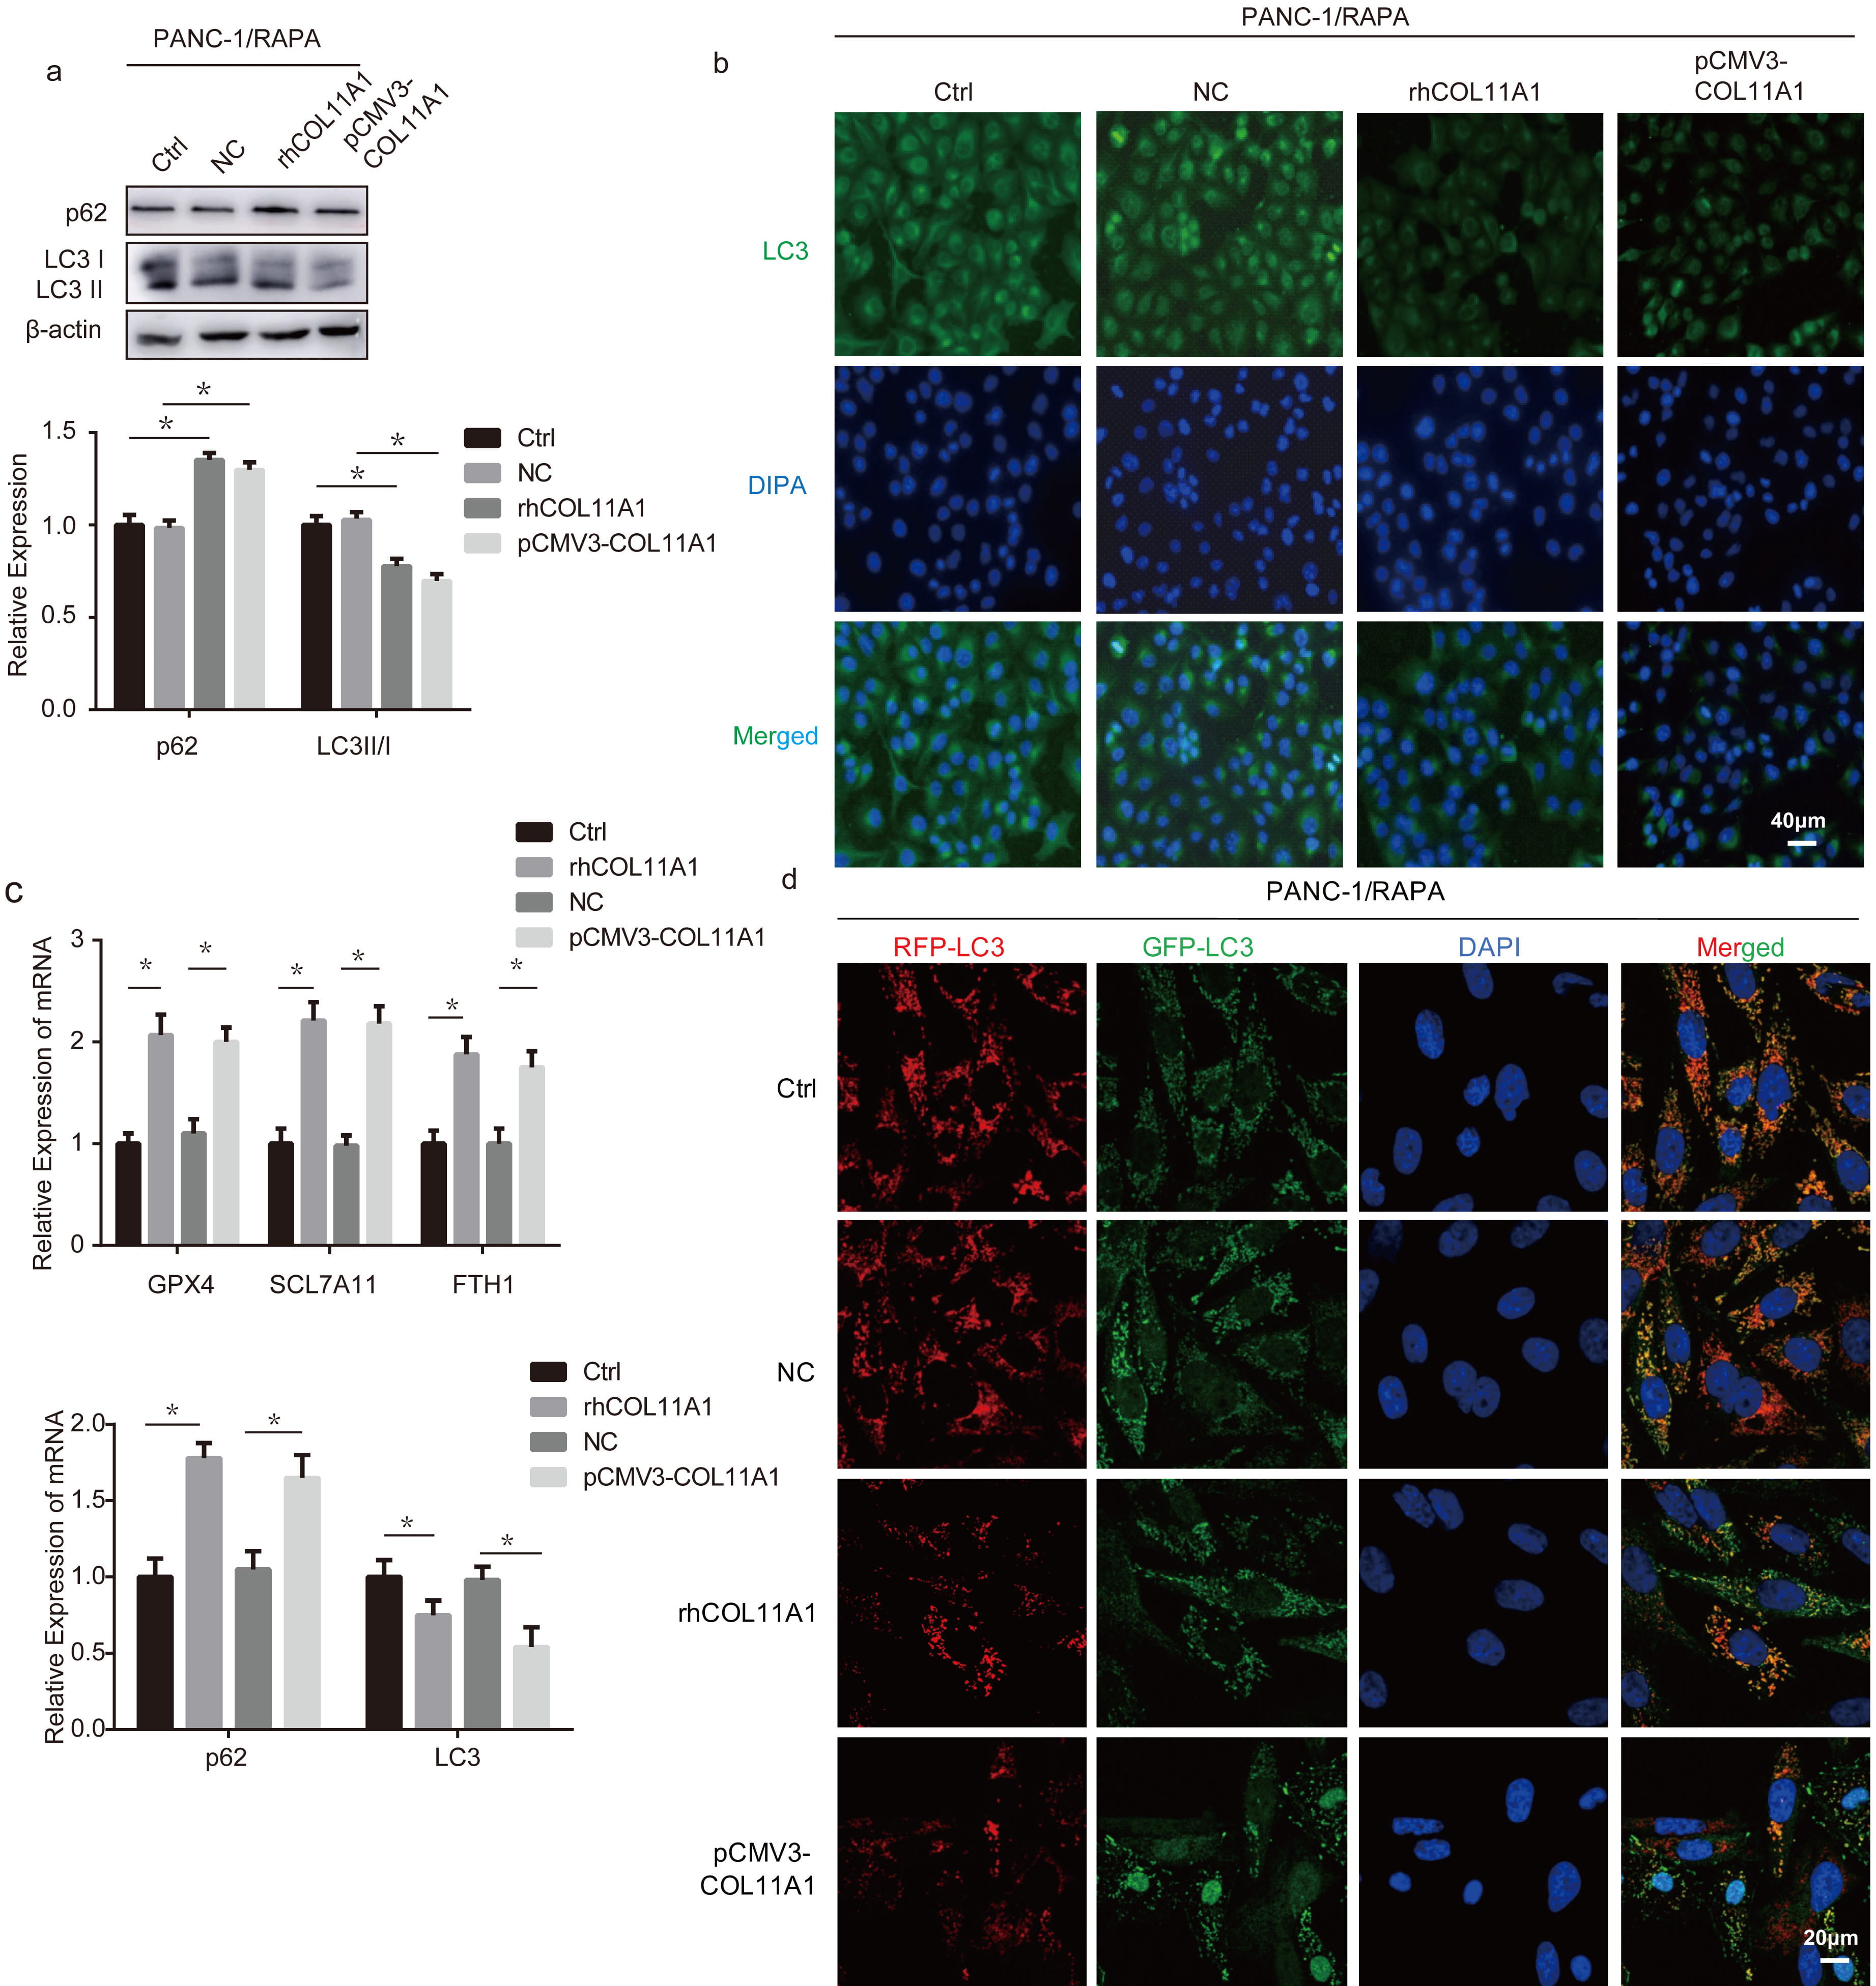 Fig. 3.
COL11A1 inhibited autophagy in pancreatic cancer cells. (a) Western
blotting was used to detect the expression levels of LC3 and p62 under treatment
with RAPA (100 nM) and transfected pCMV3-COL11A1 or rhCOL11A1. (b)
Immunofluorescence was used to detect the expression of LC3 under treatment with
RAPA (100 nM) and transfected pCMV3-COL11A1 or rhCOL11A1. Scale bar: 40
µm. (c) RT-PCR was used to detect the mRNA expression level of GPX4,
SLC7A11, FTH1, p62 and LC3 under treatment with erastin (10 µM) or RAPA
(100 nM) and transfected pCMV3-COL11A1, or rhCOL11A1. (d) rhCOL11A1 or pCMV3‑COL11A1 plasmid was co‑transfected with CMV-TurboRFP-EGFP-LC3-PGK-Puro plasmid into PANC‑1 cells, followed by treatment with 100 nM RAPA. The fluorescence spots were detected. Scale bar: 20 µm. n = 3,
*p
To further confirm that COL11A1 is involved in regulating autophagy in pancreatic cancer cells, we analyzed its effect on the expression of autophagy-related proteins. Western blotting analysis showed that COL11A1 reduced the conversion of LC3I to LC3II and increased p62 expression in PANC-1 cells (Fig. 3a). Immunofluorescence staining revealed decreased average fluorescence intensity of LC3 in COL11A1-treated PANC-1 cells (Fig. 3b). RT-PCR results showed that COL11A1 reduced the mRNA expression of LC3 and increased p62 mRNA expression in PANC-1 cells (Fig. 3c). Indeed, PANC-1 cells were transfected with CMV-TurboRFP-EGFP-LC3-PGK-Puro plasmid to detect autophagy flux, and the results showed that in COL11A1-overexpressing PANC-1 cells, there was a significant reduction in the number of both yellow and red-only puncta compared with wild-type cells. To monitor autophagic flux, PANC-1 cells were transfected with the CMV‑TurboRFP‑EGFP‑LC3‑PGK‑Puro plasmid. The results showed that both the pCMV3‑COL11A1 plasmid and rhCOL11A1 significantly blocked autophagic flux (Fig. 3d). Collectively, these results indicated that COL11A1 inhibits autophagy in PANC-1 cells.
Literature reports indicate that autophagy is involved in regulating the ferroptosis process of cells [9, 14]. To further explore the molecular mechanism by which COL11A1 regulates autophagy and ferroptosis in PANC-1 cells, we simultaneously co-treated the cells with 3-methyladenine (3-MA) (an autophagy inhibitor), RAPA (an autophagy inducer), and pCMV3-COL11A1. Changes in ferroptosis-related proteins were detected using western blotting and fluorescence assays. The results showed that 3-MA upregulated the expression of GPX4, FTH1, and SLC7A11, thereby enhancing the inhibitory effect of COL11A1 on ferroptosis in PANC-1 cells. By contrast, RAPA exerted the opposite effect, inhibiting the regulatory role of COL11A1 in ferroptosis (Fig. 4a). In addition, immunofluorescence results demonstrated that the levels of ROS and iron content were increased in the COL11A1+RAPA combined treatment group compared with the COL11A1 monotherapy group, whereas these levels were decreased in the COL11A1+3-MA combined treatment group (Fig. 4b,c). We further examined the effects of RAPA and 3-MA on COL11A1-induced changes in GSH and MDA levels. The results showed that RAPA attenuated the regulatory effect of COL11A1 on GSH and MDA levels, whereas 3-MA enhanced this regulatory effect of COL11A1 (Fig. 4d). Collectively, these findings demonstrated that autophagy inhibition partially alleviated ferroptosis in the context of COL11A1 exposure. In summary, COL11A1 diminishes cellular sensitivity to ferroptosis by inhibiting autophagy.
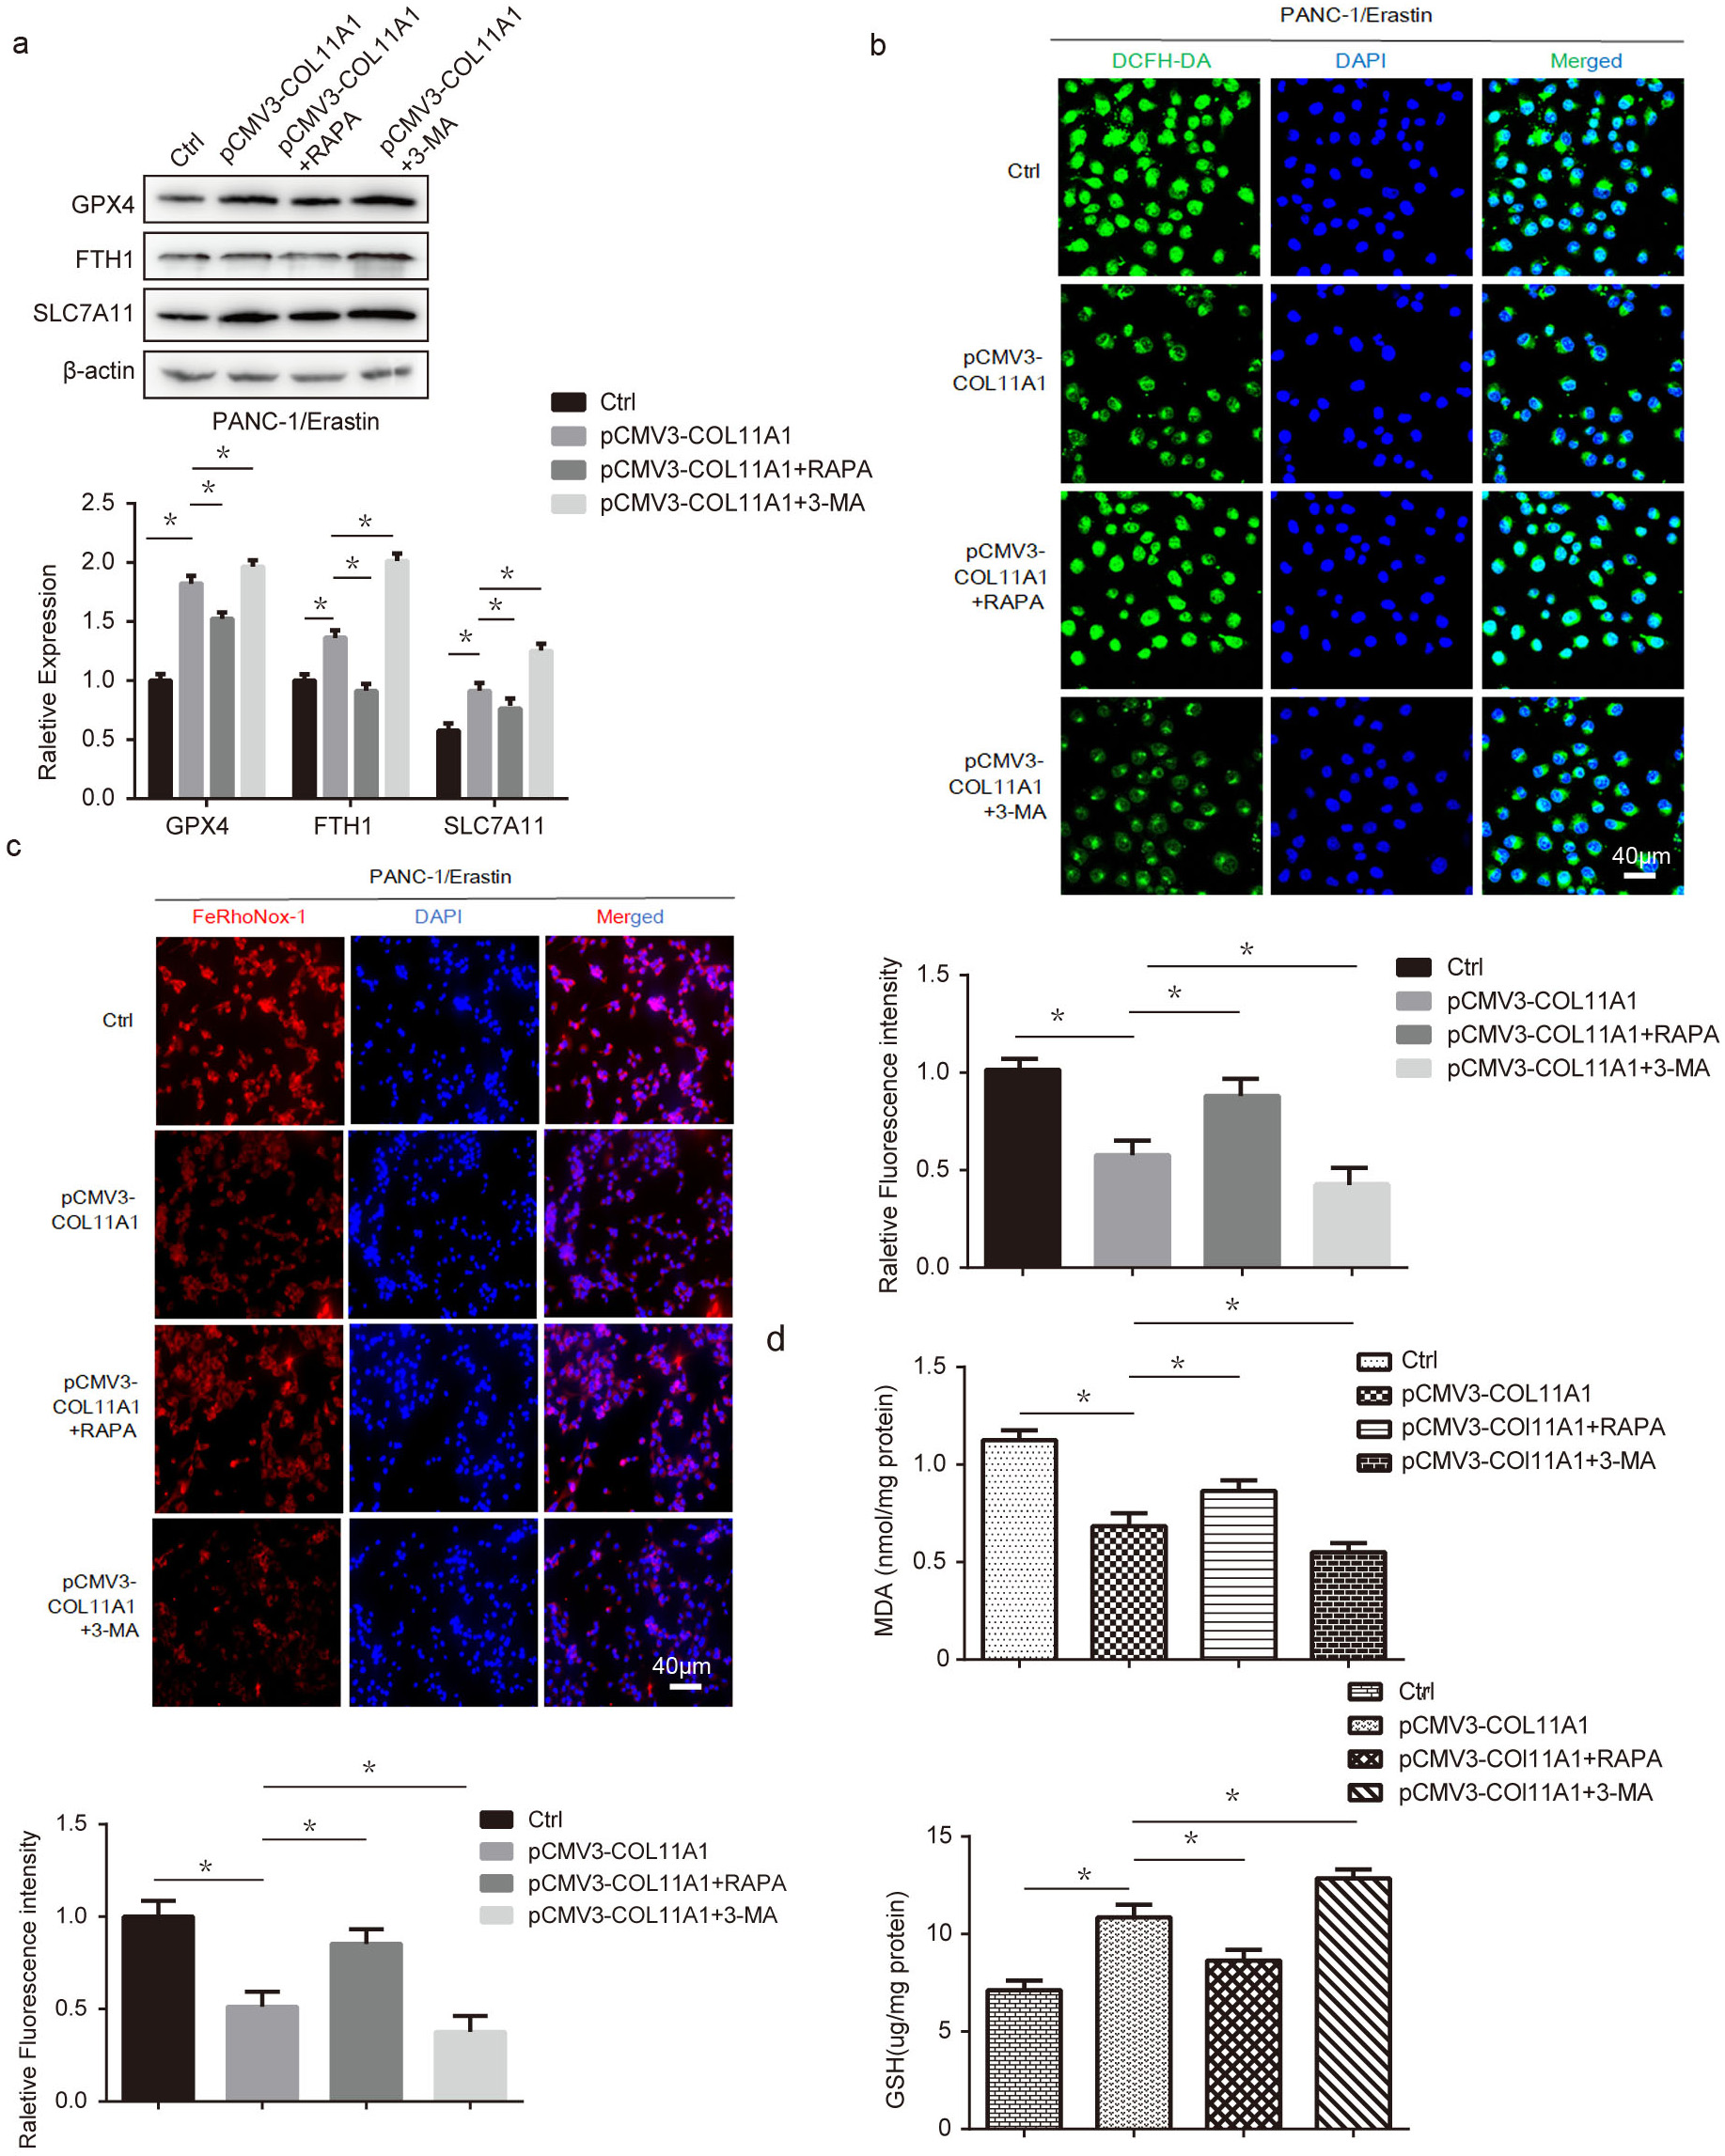 Fig. 4.
COL11A1 regulated the ferroptosis process of pancreatic cancer cells
through autophagy. (a) Western blotting was used to detect the expression levels
of GPX4, SLC7A11, and FTH1 under treatment with erastin (10 µM) and transfected
pCMV3-COL11A1, pCMV3-COL11A1+RAPA, or pCMV3-COL11A1+3-MA. (b) Immunofluorescence
was used to detect the expression of ROS by adding DCFH-DA under different
treatments. Scale bar: 40 µm. (c) Immunofluorescence was used to detect the expression level of
iron visualized with the FeRhoNox-1 probe under different treatments. Scale bar: 40 µm. (d) The
GSH/MDA kit was used to detect the expression level of GSH/MDA under transfected
pCMV3-COL11A1, pCMV3-COL11A1+RAPA, or pCMV3-COL11A1+3-MA.
n = 3, *p
Research has shown that autophagy is intertwined with the AKT/Beclin 1 signaling pathway [31]. To further explore the molecular mechanism by which COL11A1 regulates autophagy, we assessed the effect of COL11A1 on the AKT/Beclin 1 signaling pathway via western blotting, while additionally investigating its impact on phosphorylated mTOR (p-mTOR). The results showed that COL11A1 promoted the phosphorylation of AKT, mTOR, and Beclin 1 (Fig. 5a). Furthermore, western blotting analysis demonstrated that LY294002 attenuated the regulatory effect of COL11A1 on the expression levels of LC3, p62, and p-Beclin 1 (Fig. 5c). To further confirm that COL11A1 regulates autophagy via the AKT/Beclin 1 signaling pathway, we performed immunofluorescence experiments. The results demonstrated that LY294002 and siBeclin 1 attenuated the inhibitory effect of COL11A1 on LC3 expression (Fig. 5b). In addition, we assessed the effects of LY294002 and siBeclin 1 on COL11A1-induced changes in ROS and iron content via fluorescence-based assays. The results revealed that LY294002 and siBeclin 1 partially counteracted the regulatory effect of COL11A1 on ROS and iron content (Fig. 6a,b). Furthermore, the nude mouse tumor-bearing assay demonstrated that implantation of COL11A1-overexpressing PANC-1 cells significantly promoted in vivo tumor growth, whereas tumor volumes were markedly reduced following erastin or RAPA treatment (Fig. 6c). Collectively, these findings indicate that COL11A1 serves as a critical driver of pancreatic cancer progression, and its pro-tumorigenic function is closely associated with the ferroptosis and autophagy pathways. These data suggest that COL11A1 regulates the ferroptosis of pancreatic cancer cells through AKT/Beclin 1-dependent autophagy (Fig. 6d).
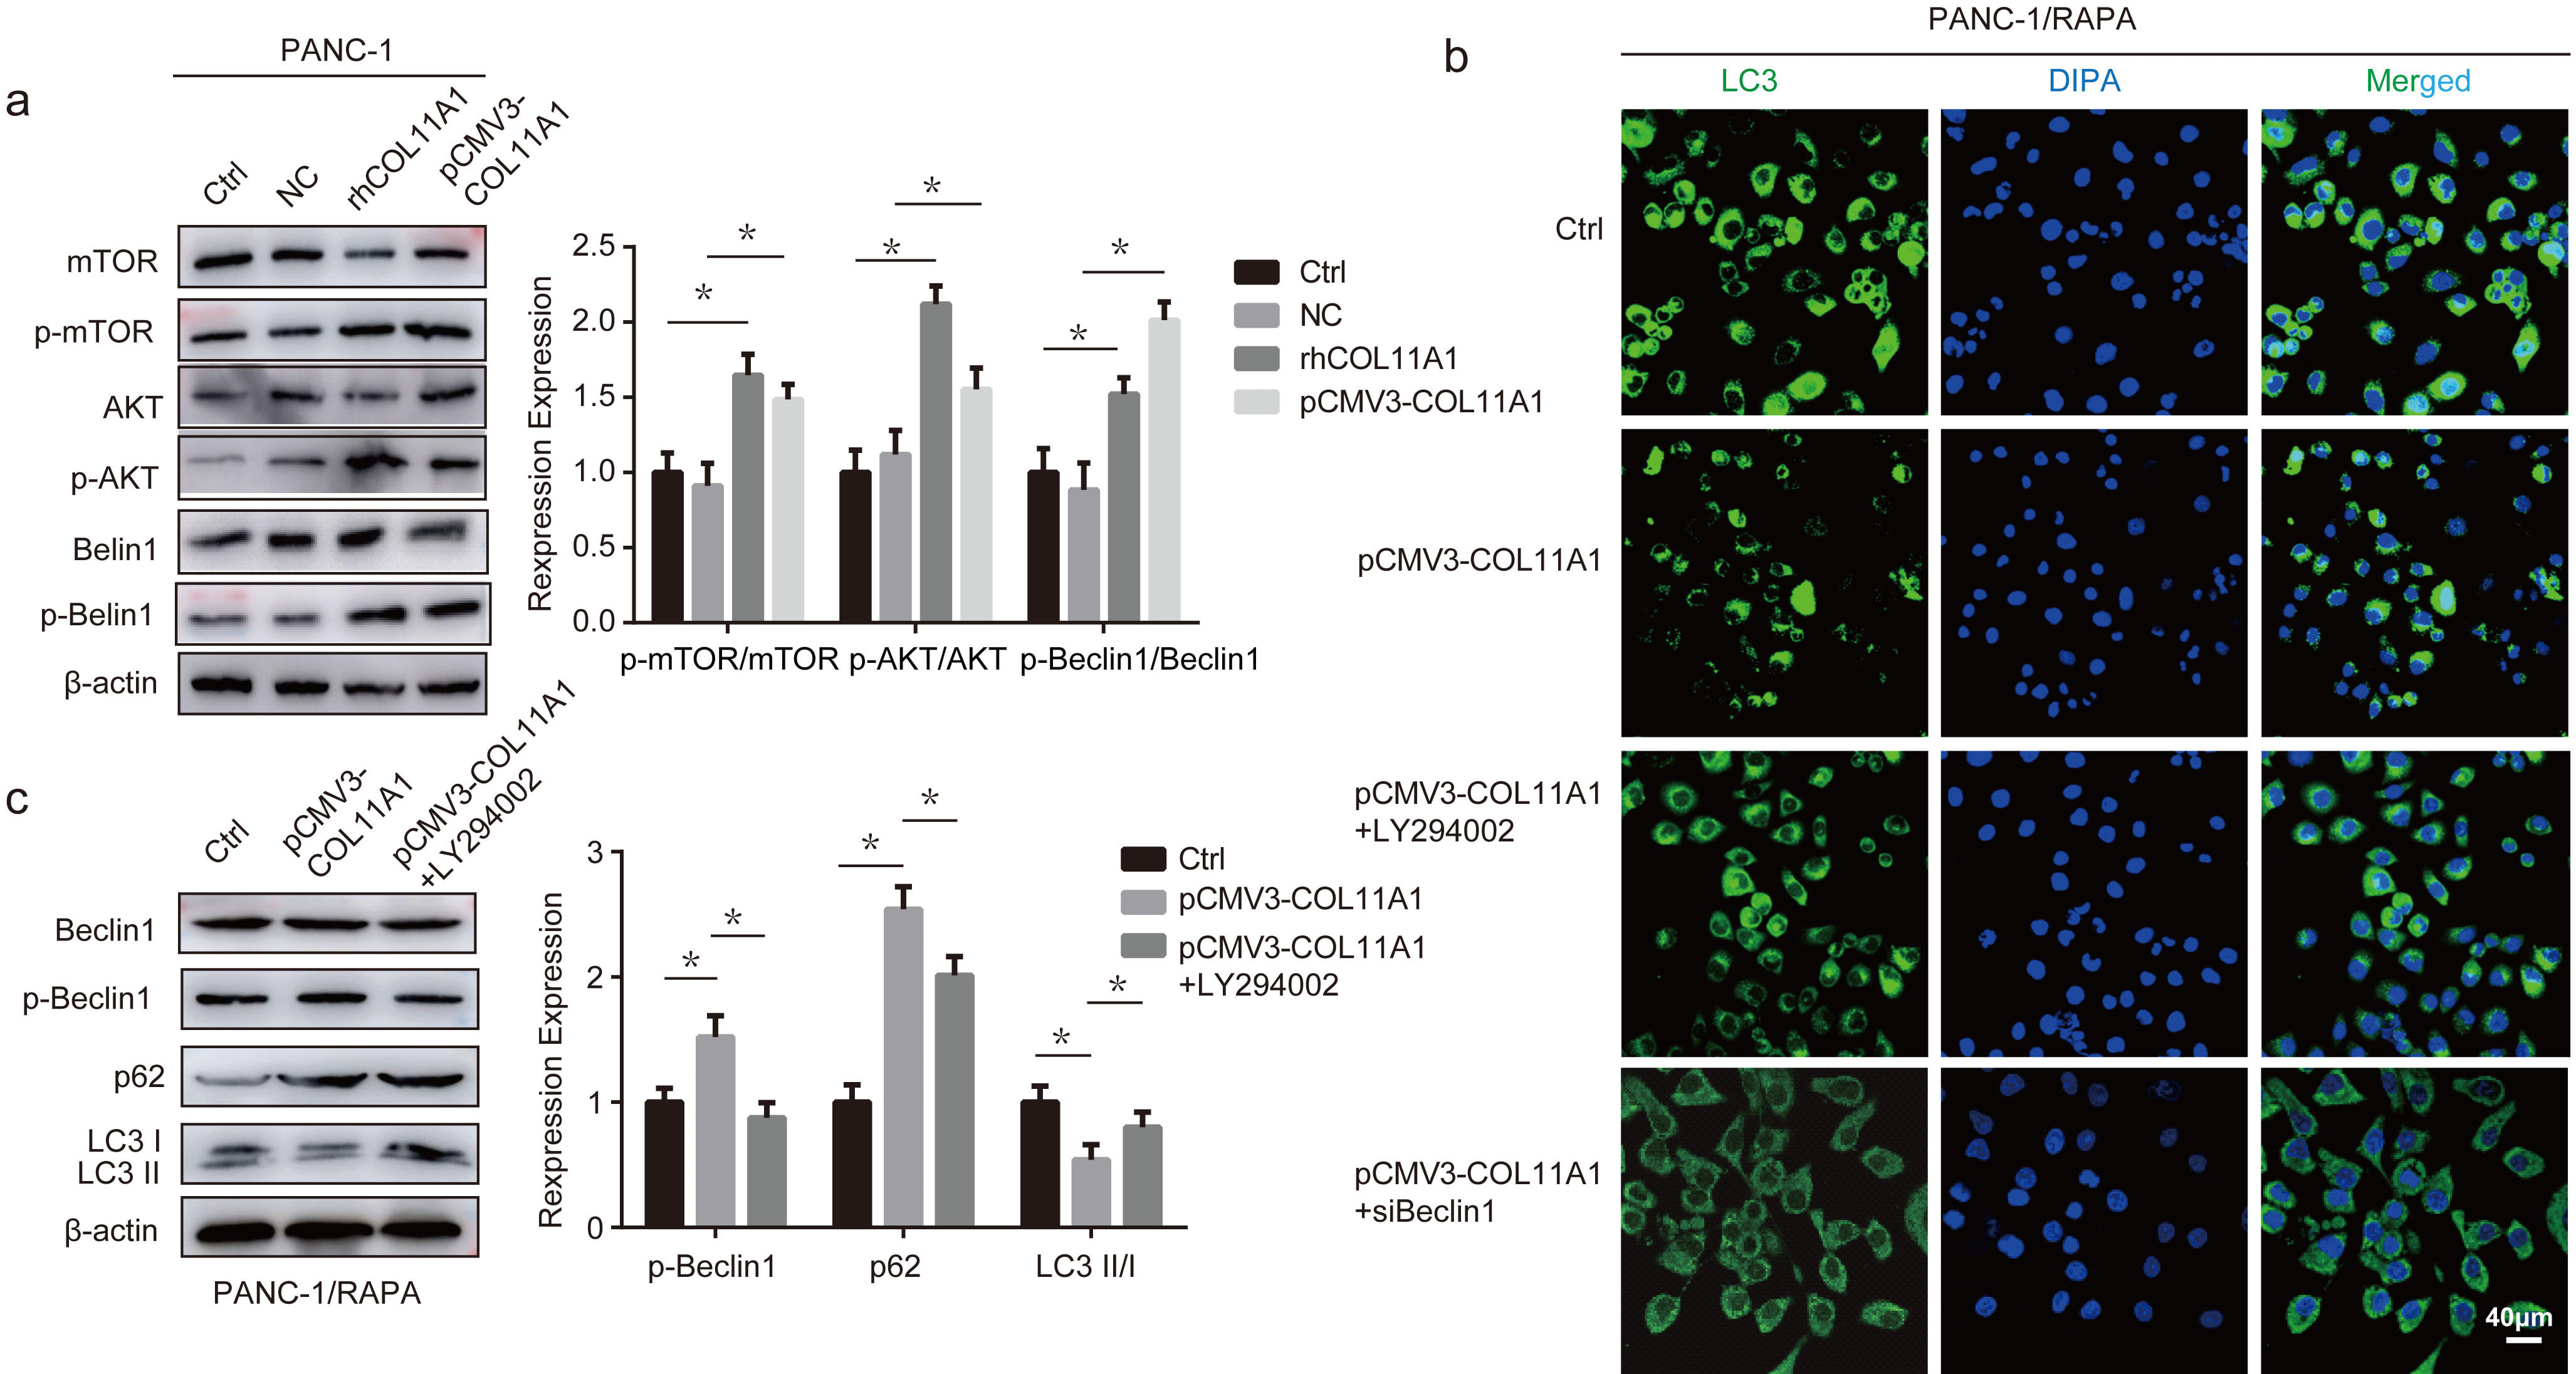 Fig. 5.
COL11A1 regulated the autophagy of pancreatic cancer cells through
the AKT/Beclin 1 signaling pathway. (a) Western blotting was used to detect the
expression levels of AKT, p-AKT, mTOR, p-mTOR, Beclin 1, and p-Beclin 1 under
treatment with pCMV3-COL11A1 or rhCOL11A1. (b) Immunofluorescence was used to
detect the expression of LC3 under treatment with RAPA (100 nM) and transfected
pCMV3-COL11A1, pCMV3-COL11A1+LY294002, or pCMV3-COL11A1+siBeclin 1. Scale bar: 40
µm. (c) Western blotting was used to detect the expression levels of Beclin
1, p-Beclin 1, p62, and LC3II/I under treatment with RAPA (100 nM) and
pCMV3-COL11A1 or pCMV3-COL11A1+LY294002. n = 3, *p
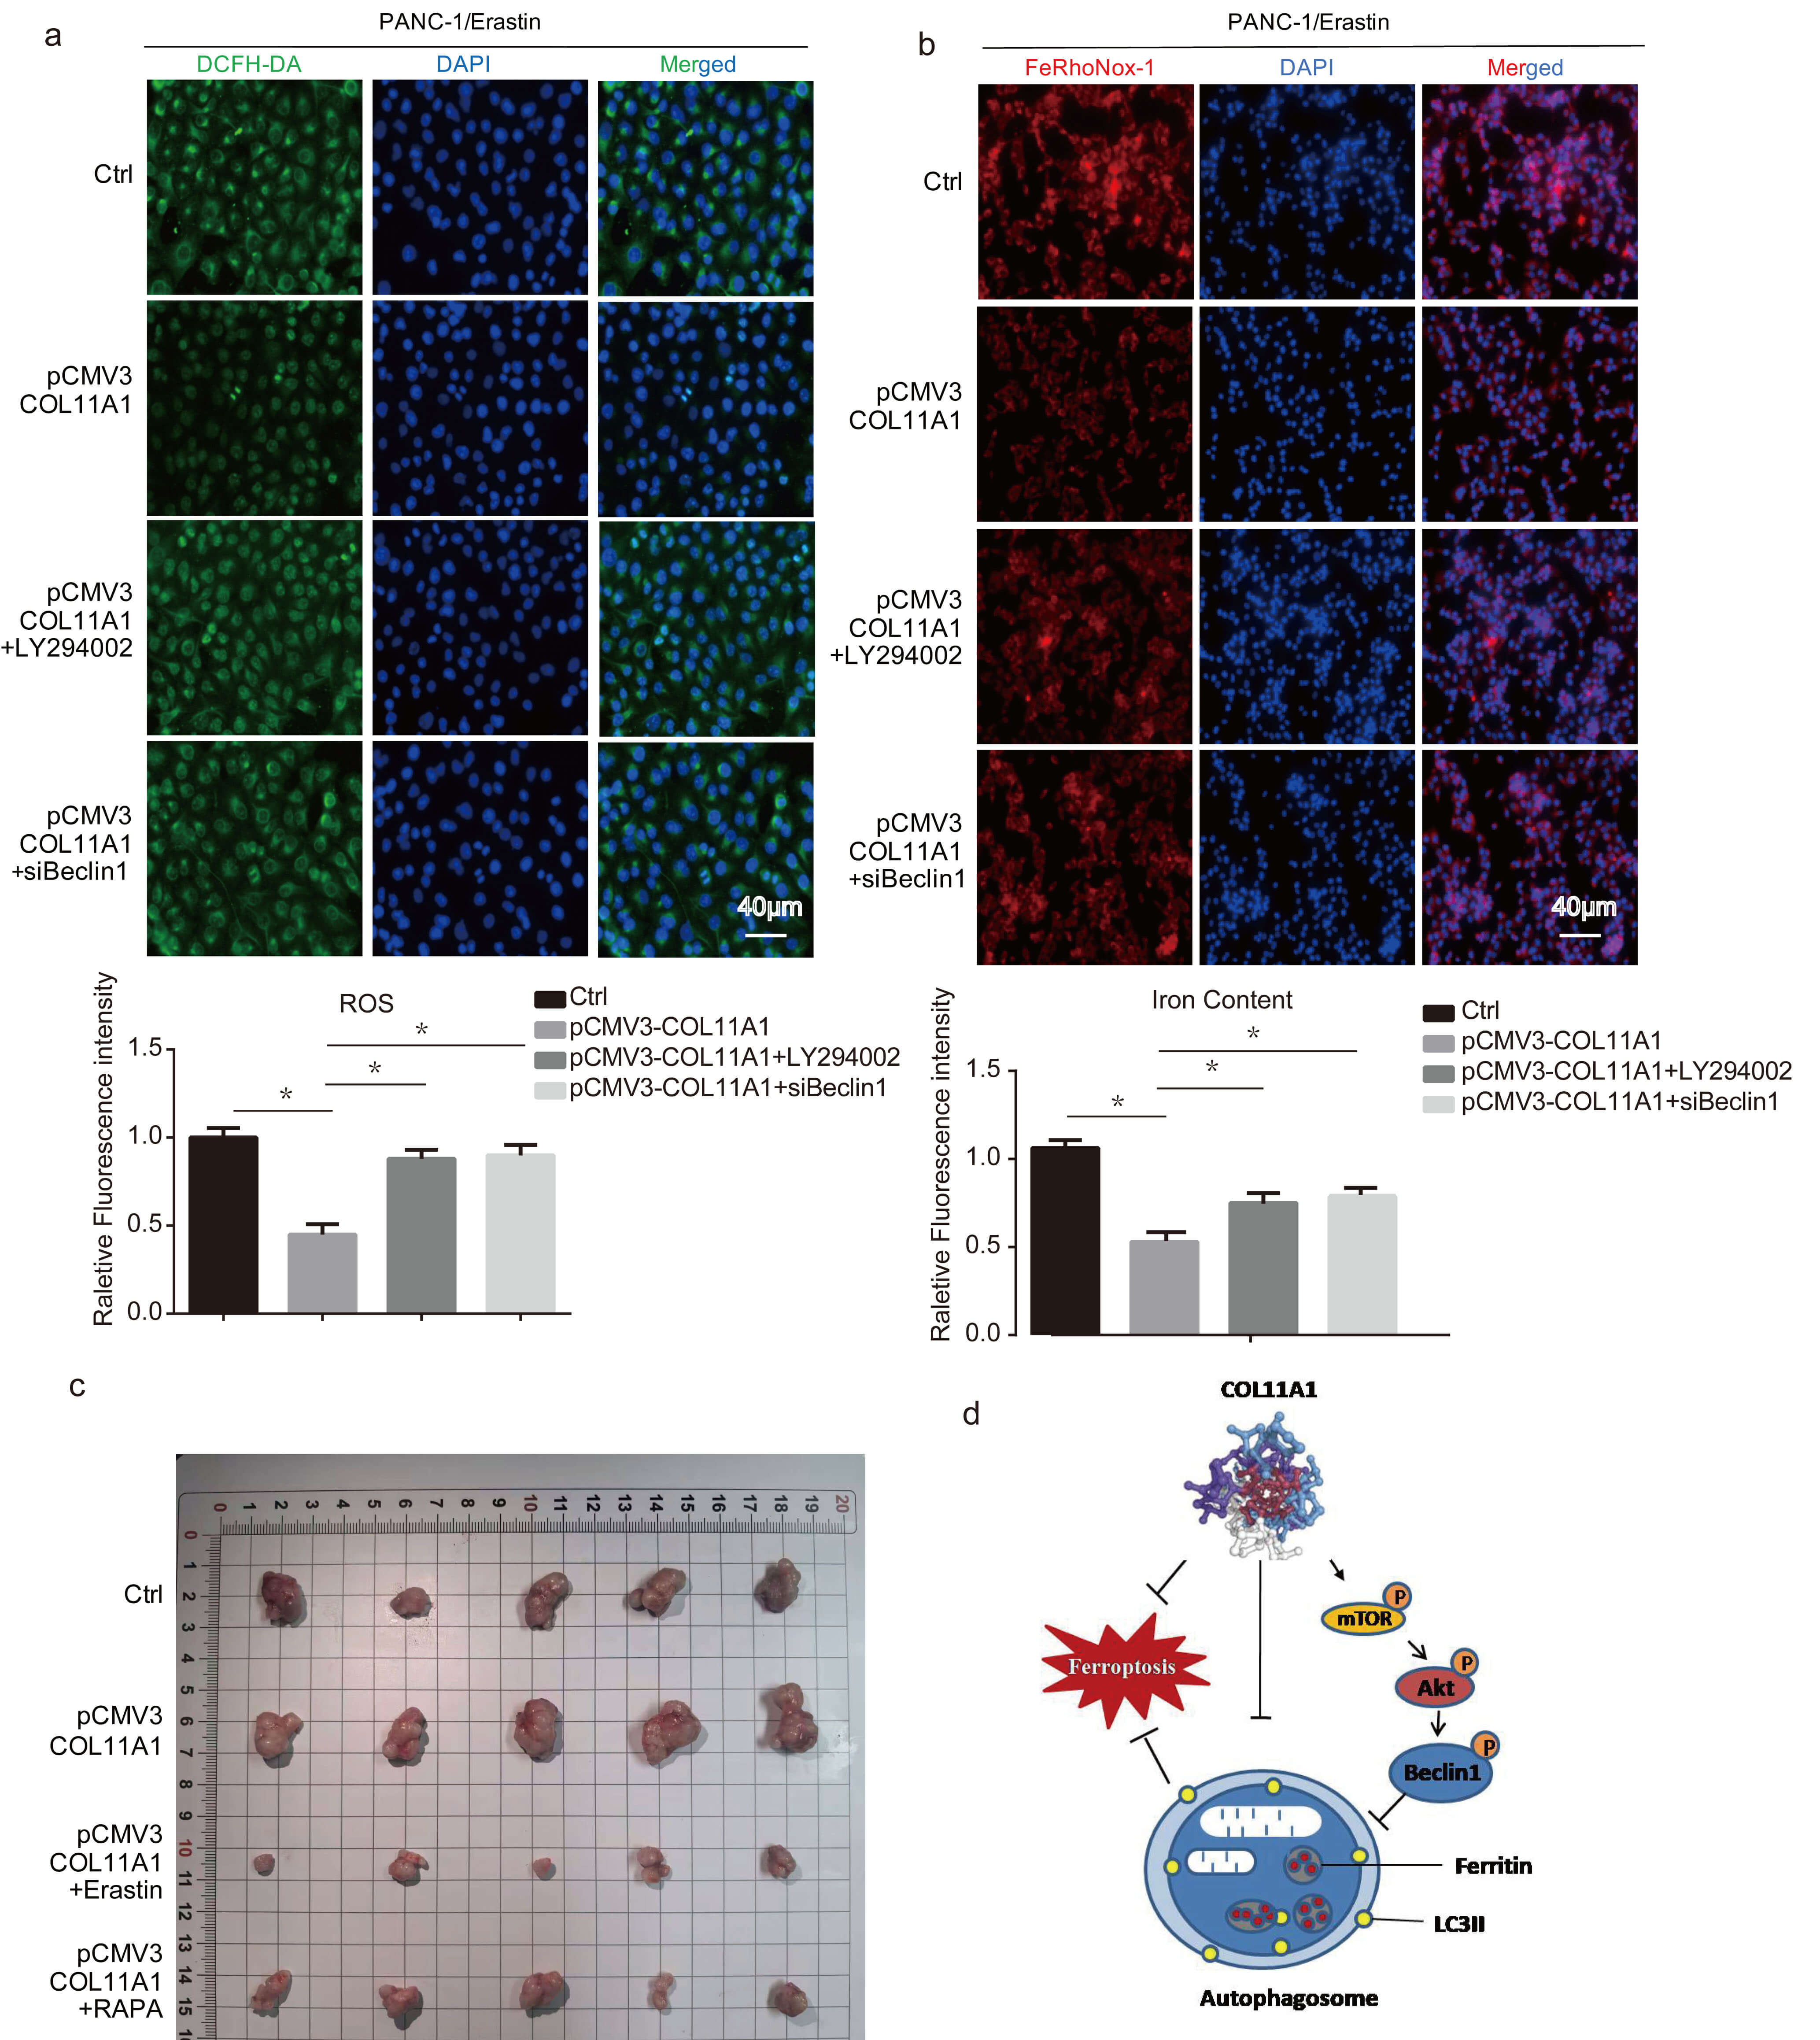 Fig. 6.
COL11A1 regulated ferroptosis of pancreatic cancer cells through the
AKT/Beclin 1 signaling pathway. (a) Immunofluorescence was used to detect the
expression of ROS by adding DCFH-DA under treatment with erastin (10 µM) and
pCMV3-COL11A1, pCMV3-COL11A1+LY294002, or pCMV3-COL11A1+siBeclin 1. Scale bar: 40
µm. (b) The results of immunofluorescence analysis of iron content in
PANC-1 cells following different treatments are shown iron was visualized
with FeRhoNox-1, and nuclei were stained with DAPI. Scale bar: 40 µm. (c)
Wild-type PANC-1 cells and COL11A1 stably overexpressing PANC-1 cells were
subcutaneously implanted into nude mice, respectively. In addition, two other
groups were established, in which nude mice bearing COL11A1 stably overexpressing
PANC-1 cell xenografts were treated with erastin (30 mg/kg) or RAPA (4 mg/kg),
separately. The tumors were obtained at the end of the experiment. (d) Mechanism
of COL11A inhibiting ferroptosis in pancreatic cancer by inhibiting AKT/Beclin 1
dependent autophagy. n = 3, *p
PDAC is highly resistant to chemotherapy drugs [32, 33], with a 5-year survival rate consistently ranging between 5% and 10%. There is an urgent need to explore new pathological mechanisms and therapeutic targets to overcome current treatment bottlenecks.
A growing body of prior evidence has unequivocally demonstrated the specific upregulation of COL11A1 in pancreatic cancer tissues relative to adjacent normal tissues. These studies, encompassing mRNA expression profiling, comprehensive bioinformatics analyses, and histopathological examinations of clinical sections, consistently identify COL11A1 as a promising prognostic biomarker for poor outcomes in pancreatic cancer patients [34, 35, 36]. This study systematically delineates the pivotal role of COL11A1 in regulating ferroptosis in PDAC, and found three key findings outlined below: First, the cancer genome atlas (TCGA) database validation showed that COL11A1 is significantly overexpressed in PDAC tissues relative to adjacent non-tumor tissues, and its expression negatively correlates with patient survival. Patients with high COL11A1 expression had a median survival time half that of the control group, indicating that COL11A1 may serve as an independent poor prognostic predictor for PDAC. Second, functional experiments verified that COL11A1 overexpression in PANC-1 pancreatic cancer cells reduced free iron content by 30–45% and MDA by 2–3 fold, while downregulating the key ferroptosis regulators GPX4 and SLC7A11. In summary, COL11A1 overexpression strongly antagonizes erastin-induced ferroptosis. Third, mechanistic investigations elucidated that COL11A1 activates the AKT signaling pathway, which promotes phosphorylation of its downstream molecule Beclin 1 and suppresses autophagic activity. Intervention using the AKT inhibitor LY294002 or Beclin 1 siRNA abrogated COL11A1-mediated ferroptosis inhibition, confirming that AKT/Beclin 1-dependent autophagy constitutes the core pathway through which COL11A1 regulates ferroptosis in PDAC.
Ferroptosis presents opportunities for mechanistic research due to its complex regulatory network, making it a promising area for potential therapeutic targeting in pancreatic cancer treatment. Previous studies have revealed that exosomes secreted by co-induced cancer-associated fibroblasts (CAFs) can suppress gemcitabine (GEM)-induced ferroptosis in PDAC cells [37]. Additionally, separate study has established that CAFs themselves exert a protective effect on PDAC cells against ferroptosis induced by the small-molecule agents erastin and RSL3 [38]. However, the functional relevance of CAF-secreted extracellular matrix (ECM) components in regulating ferroptosis remains largely underexplored. Collagen, the predominant component of the ECM, is critically involved in remodeling the tumor microenvironment and regulating malignant biological behaviors of cancer cells. As a member of the collagen family, COL11A1 has been previously confirmed to be closely associated with the invasion, metastasis, and chemoresistance of pancreatic cancer [39], but no studies have explored its association with ferroptosis. In the present study, we demonstrate that COL11A1 inhibits the occurrence of ferroptosis in pancreatic cancer cells. Given that ferroptosis is closely associated with GEM resistance, targeting COL11A1 may offer a novel therapeutic avenue for addressing pancreatic cancer progression and chemoresistance.
The precise role autophagy plays in PDAC tumorigenesis is complicated by several conflicting studies that have shown that autophagy can lead to both promotion and inhibition of tumor development. A tumor-promoting mechanism of autophagy has been described in mice with heterozygous deletions of mammalian Beclin 1. Deletion of this key autophagy promoting enzyme results in the development of malignant neoplasms in various organs in mice [40, 41]. It has been suggested that autophagy is a relatively weak tumor suppressor yet at the same time it is necessary for the progression of benign tumors to malignancy [42]. There is also evidence suggesting that defects in autophagy lead to increased dysfunctional or damaged mitochondria in tumor cells and impaired tumorigenesis [43]. The “bidirectional regulatory” characteristic of autophagy in regulating ferroptosis has become a research hotspot [44, 45]. This study found that COL11A1-mediated autophagy inhibition significantly reduced intracellular free iron accumulation and lipid peroxidation levels, which is consistent with the view that “a specific subtype of autophagy induces ferroptosis” [46]. From the perspective of signaling pathway crosstalk, the AKT/Beclin 1 pathway is a core node in autophagy regulation. Mechanistic studies revealed that COL11A1-activated AKT directly phosphorylates Beclin 1 at Ser-295, which suppresses autophagosome formation, thereby reducing ferritinophagy and the modulation of related processes, including iron metabolism, lipid peroxidation, and antioxidant activity. Ultimately, an inhibitory pathway of ferroptosis, namely, “COL11A1-AKT-Beclin 1-autophagy”, is formed. This finding refines the molecular mechanism of autophagy–ferroptosis crosstalk in pancreatic cancer and provides a new perspective for understanding how tumor microenvironment components regulate cell death modalities.
These findings are consistent with and further supported by multiple investigations in the field of pancreatic cancer. Regarding the oncogenic function of COL11A1, Yang et al. [47] demonstrated that COL11A1 promotes cancer metastasis via activation of the PI3K/AKT pathway. Building on this finding, the present study further confirms that the PI3K/AKT pathway can also mediate ferroptosis inhibition by regulating autophagy. These results collectively suggest that the AKT pathway acts as a critical signaling hub through which COL11A1 exerts its oncogenic effects. Regarding ferroptosis regulation, Zhu et al. [48] demonstrated that deletion of autophagy-related gene 5 potentiates the sensitivity of pancreatic cancer cells to ferroptosis inducers. This study established COL11A1 as an upstream regulator of this process, thereby enhancing the understanding of the upstream signaling network that links autophagy to ferroptosis. In addition, this study revealed that COL11A1’s regulation of ferroptosis depends on the AKT/Beclin 1 pathway, independent of the mitogen-activated protein kinase (MAPK) pathway. This finding complements the mechanism of MAPK regulating autophagy ferroptosis reported by Yang et al. [49], and highlights characteristics of parallel multiple pathways in ferroptosis regulation within pancreatic cancer.
The clinical significance of this study lies primarily in the development of biomarkers and optimization of treatment strategies. Specifically, for diagnosis and prognosis evaluation, the high expression of COL11A1 in pancreatic cancer tissue and its association with a poor prognosis suggest its potential as a valuable diagnostic marker for pancreatic cancer. In terms of treatment strategy, this study confirmed that COL11A1 knockdown can significantly enhance the sensitivity of PANC-1 cells to erastin, which suggests that the combined treatment strategy of targeting COL11A1 using a ferroptosis inducer may become a new direction for the treatment of pancreatic cancer, especially for patients with drug-resistant cancer who have high expression of COL11A1.
There are several limitations in the present study. First, the mechanism by which COL11A1 regulates ferroptosis via AKT/Beclin1dependent autophagy was only validated in the PANC-1 model; its generalizability in other pancreatic cancer subtypes requires further investigation. Second, our animal study only evaluated tumor growth, without detecting the expression of ferroptosis and autophagy markers in tumor tissues, which limits the translational potential. Third, mechanistic assays relied solely on pharmacological inhibitors rather than genetic knockout, which may influence the interpretation of our results.
In summary, COL11A1 is highly expressed in pancreatic cancer and inhibits ferroptosis by activating AKT/Beclin 1-dependent autophagy. Its expression level is closely related to the poor prognosis of patients. This study not only identified a new function and molecular mechanism for COL11A1 in pancreatic cancer, but also offered a novel molecular target for prognosis evaluation and targeted treatment. The findings provide an important theoretical and experimental basis for overcoming the current limitations of pancreatic cancer treatment.
The datasets used in this article are accessible from the corresponding author DDL upon request.
HW designed the research study and responsible for cell experiments and molecular biology experiments, wrote the main manuscript text. SZ, LLD and JW processed experimental data and summarized experimental results. ZBY, JC and NG prepared figures. DDL guided experimental design and paper writing. All authors have participated sufficiently in the work and agreed to be accountable for all aspects of the work. All authors contributed to editorial changes in the manuscript. All authors read and approved the final manuscript.
This study was conducted in strict compliance with the Guidelines for the Ethical Review of Animal Welfare in Laboratory Animals. All experimental protocols involving animals were reviewed and approved by the Ethics Committee of Tianjin Institute of Medical & Pharmaceutical Sciences (Ethics Approval No. IMPS-EAEP-Z-KTSB-202312). Throughout the research process, we adhered rigorously to relevant national and international animal welfare regulations and guidelines to ensure the welfare and humane treatment of the laboratory animals.
Not applicable.
This research endeavor was funded by the Science and Technology Project of Tianjin Health Commission, grant number TJWJ2023QN096; National Natural Science Foundation of China, grant number 82304797.
The authors declare no conflict of interest.
References
Publisher’s Note: IMR Press stays neutral with regard to jurisdictional claims in published maps and institutional affiliations.