


1 Department of Oncology, The Third Affiliated Hospital of Zunyi Medical University (The First People’s Hospital of Zunyi), 563099 Zunyi, Guizhou, China
2 Department of Medical Oncology, Guizhou Province People’s Hospital, 550002 Guiyang, Guizhou, China
3 Department of Oncology, The Eighth Affiliated Hospital, Southern Medical University (The First People’s Hospital of Shunde Foshan), 528399 Foshan, Guangdong, China
Abstract
Phosphatidylserine synthase 1 (PTDSS1) is a crucial enzyme involved in phospholipid synthesis. However, its role in the metabolic regulation of lung cancer remains unclear. This study hypothesized that PTDSS1 promotes lung cancer progression by regulating metabolic reprogramming through nuclear–mitochondrial crosstalk.
PTDSS1’s expression levels in lung cancer tissues and their correlation with patient prognosis were evaluated through bioinformatics analysis and immunohistochemistry. In vitro functional experiments, including cell proliferation, migration, invasion, and colony formation, were performed using PTDSS1-overexpressing lung cancer cell lines. Cellular glycolysis and mitochondrial oxidative phosphorylation levels were determined. PTDSS1’s subcellular localization was investigated through cellular fractionation and immunofluorescence. Its regulatory interaction with pyruvate kinase M2 (PKM2) was examined. Expression levels of metabolism-related genes and mitochondrial dynamics markers were analyzed by qRT-PCR and Western blot.
PTDSS1 was significantly overexpressed in lung cancer tissues. High PTDSS1 expression correlated with poor patient prognosis. PTDSS1 enhanced lung cancer cell proliferation, migration, and invasion capabilities. Metabolically, PTDSS1 promoted aerobic glycolysis. Mitochondrial oxidative phosphorylation was suppressed. Nuclear-localized PTDSS1 showed enhanced effectiveness in driving glycolysis and malignant progression. Mechanistically, PTDSS1 may accelerate glycolysis through PKM2 regulation. It may drive lung cancer progression through PKM2-mediated nuclear–mitochondrial homeostatic crosstalk.
PTDSS1 functions as a multifunctional oncogene. It drives lung cancer progression through PKM2-mediated nuclear–mitochondrial homeostatic crosstalk. PTDSS1 represents a potential prognostic biomarker and therapeutic target.
Keywords
- lung cancer
- PTDSS1
- glycolysis
- nuclear-mitochondrial crosstalk
- PKM2
Metabolic reprogramming in tumor cells is recognized as one of the hallmark features during cancer development and progression [1, 2]. The most characteristic phenomenon is the Warburg effect, whereby tumor cells preferentially obtain energy through glycolysis even under oxygen-sufficient conditions [3, 4]. This metabolic shift provides energy and biosynthetic precursors for tumor cell growth, proliferation, invasion, and metastasis, but the precise regulatory mechanisms remain incompletely elucidated [5]. In particular, the role of nuclear-mitochondrial communication and coordination in regulating tumor metabolism and promoting tumor progression continues to be a challenging focal point in cancer research [6, 7].
Phosphatidylserine synthase 1 (PTDSS1) is a critical enzyme located on the endoplasmic reticulum membrane that primarily catalyzes the synthesis of phosphatidylserine (PS), an essential component of cell membranes that plays significant roles in maintaining membrane integrity and cellular signal transduction [8, 9]. Phospholipid metabolism is closely associated with tumorigenesis and progression [8, 10]. Given the importance of lipid metabolism in cancer development, the present study investigated whether PTDSS1 plays a role in lung cancer progression. Limited studies have indicated that PTDSS1 expression is upregulated in certain tumor types, but its expression pattern and functional significance in lung cancer remain unclear. Recent research has shown that PTDSS1 expression levels correlate with tumor progression in some cancer types [10]. High PTDSS1 expression is associated with tumor invasion and poor prognosis. Additionally, studies suggest that PTDSS1 may participate in tumor progression by influencing lipid metabolism [10, 11]. Recent evidence suggests that enzymes involved in lipid metabolism, including PTDSS1, may have broader roles in cancer beyond their classical functions. However, the specific contribution of PTDSS1 to lung cancer remains largely unexplored.
Cellular metabolic reprogramming, particularly enhanced glycolysis, is a critical characteristic of tumor progression [12, 13, 14]. The relationship of PTDSS1 with key glycolytic enzymes was examined to understand the metabolic mechanisms underlying its potential oncogenic role. Pyruvate kinase M2 (PKM2), as one of the rate-limiting enzymes in glycolysis, plays a pivotal role in tumor metabolism [15, 16]. Unlike other pyruvate kinase isoforms, PKM2 is highly expressed in tumor cells and possesses unique regulatory properties, not only participating in glycolytic reactions in the cytoplasm but also translocating to the nucleus to function as a transcriptional co-activator, thus influencing the expression levels of various metabolism-related genes [17, 18]. However, how PKM2 expression and activity are regulated, especially the precise regulatory mechanisms during lung cancer development, remains incompletely understood.
Metabolic reprogramming in cancer involves glycolytic enhancement and
mitochondrial adaptation. The mitochondria are central to cellular energy
metabolism, and they serve as important regulatory organelles for apoptosis [19].
Recent studies have revealed that the balance of mitochondrial dynamics is
crucial for maintaining cellular energy supply and apoptotic regulation [20, 21].
Mitofusin 1/2 (MFN1/2) and peroxisome proliferator-activated receptor
On the basis of the evidence linking PTDSS1 to lipid metabolism and the critical role of metabolic reprogramming in cancer, PTDSS1 is hypothesized to be driving lung cancer progression by coordinating nuclear-mitochondrial communication to regulate glycolytic metabolism. Specifically, this study proposes that PTDSS1 promotes glycolysis through PKM2-mediated pathways while maintaining mitochondrial homeostasis to support tumor cell survival and metastasis.
This study utilized publicly available transcriptomic data from The Cancer
Genome Atlas (TCGA) database. Transcriptome data of patients with lung
adenocarcinoma were obtained from TCGA database to analyze PTDSS1
expression differences between tumor tissues and adjacent normal tissues, its
correlation with clinicopathological features, and its relationship with patient
survival. Data preprocessing included the following: (1) removal of samples with
missing clinical information, (2) log2 transformation of expression values,
and (3) filtering of genes with low expression (FPKM
The LinkedOmics database (http://www.linkedomics.org) provides multi-omics and
clinical data for 32 cancer types and 11,158 TCGA patients. It features tools for
analyzing multi-omics data and was used to study PTDSS1-associated co-expressed
genes in lung cancer. The screening steps in this database were as follows: (1)
select cancer cohort: Lung Adenocarcinoma (LUAD); (2) select search dataset:
Data, stype: RNAseq; (3) select sample dataset: No input; and (4) select search
dataset attribute: PTDSS1. Hierarchical clustering analysis of PTDSS1
co-expressed genes was performed using the LinkFinder module, with genes
clustered on the basis of Pearson’s correlation coefficients and visualized as
heatmaps with dendrograms. Differential expression analysis and volcano plots
were generated using the LinkCompare module, with significance determined by
Pearson’s correlation (
Human lung adenocarcinoma cell lines A549 and NCI-H1299 were purchased from the American Type Culture Collection. All cell lines were validated by Short Tandem Repeat (STR) profiling and tested negative for mycoplasma. The cells were cultured in complete medium consisting of 90% high-glucose Dulbecco’s Modified Eagle Medium (DMEM) (PM150210B; PronoCell, Heidelberg, Germany), 10% fetal bovine serum (Gibco, 10091148, Thermo Fisher Scientific, Waltham, MA, USA), and 1% penicillin–streptomycin (PB180120, PronoCell, Heidelberg, Germany) at 37 °C with 5% CO2 and passaged as required. When the cell density in the six-well plates reached 70%–80%, the cells were transfected with OE-PTDSS1 (OE: Overexpression) plasmid and Short hairpin RNA (sh-RNA) (shPKM2, 5′-GTTCGGAGGTTTGATGAAATC-3′) plasmid (GenePharma, Shanghai, China) by using Lipofectamine 3000 (Thermo Fisher Scientific, L3000015, Thermo Fisher Scientific, Waltham, MA, USA). For each well, 2.5 µg of plasmid DNA was mixed with 5 µL of Lipofectamine 3000 reagent in 125 µL of Optimized Minimal Essential Medium (Opti-MEM), incubated for 15 min at room temperature, and then added dropwise to the cells in fresh medium without antibiotics. The plasmids used were as follows: pCDH-CMV-MCS-EF1-PTDSS1-Puro: full-length PTDSS1 overexpression plasmid and pCDH-CMV-MCS-EF1-NLS-PTDSS1-Puro: PTDSS1 overexpression plasmid containing nuclear localization signal peptide. OE-NC (overexpression negative control) cells were generated via transfection with empty pcDNA3.1 vector, and they served as controls for PTDSS1 overexpression experiments. pLKO.1-shPKM2: RNA interference plasmid targeting PKM2 transfection was performed using Lipofectamine 3000 reagent in accordance with the manufacturer’s recommended protocol. Stable expression cell lines were obtained after 2 weeks of selection with 2 µg/mL of puromycin. Cisplatin (10 µM, 24 h, Sigma-Aldrich, C2211000, St. Louis, MO, USA) was used to induce cell apoptosis. 2-Deoxy-D-glucose (2-DG, 5 mM, 24 h, Sigma-Aldrich, D8375, St. Louis, MO, USA) was used as a glycolysis inhibitor. DMSO served as the control treatment group.
Total protein was extracted using Radioimmunoprecipitation Assay (RIPA) lysis
buffer (P0013B, Beyotime Biotechnology, Shanghai, China). After cellular debris
was removed, protein concentration was determined using BCA assay (P0012,
Beyotime Biotechnology, Shanghai, China) with bovine serum albumin (BSA)
standards ranging from 0 µg/mL to 2000 µg/mL. Proteins were denatured
at 100 °C for 10 min, mixed with 4
RNA was extracted and converted to cDNA using a reverse transcription kit
(15596026, Invitrogen, Carlsbad, CA, USA; reaction conditions: 37 °C for
45 min and 85 °C for 5 min; stored at 4 °C). RNA purity was
assessed by measuring the A260/A280 ratios (
| Gene | Forward Primer (5′-3′) | Reverse Primer (5′-3′) |
| PKM2 | ATGTCGAAGCCCCATAGTGAA | TGGGTGGTGAATCAATGTCCA |
| MFN1 | TGACTCCAGCCATGTCCATCT | ACAGTCGAGCAAAAGTAGCCA |
| MFN2 | CTCTCGATGCAACTCTATCGTC | TCCTGTACGTGTCTTCAAGGAA |
| PGC-1 |
TTCCACCAAGAGCAAGTATGACTC | GCCTGAGCTTGTCCTTTGTTC |
| CATGTACGTTGCTATCCAGGC | CTCCTTAATGTCACGCACGAT |
PKM2, pyruvate kinase M2; MFN1, Mitofusin 1; MFN2,
Mitofusin 2; pGC-1
Logarithmic phase cells were collected after trypsin digestion and centrifuged
at 1000 r/min for 5 min. The supernatant was discarded, and cells were
resuspended in fresh complete medium, adjusting the density to 5
Cell proliferation was measured using the Click-iT 5-ethyl-2’-deoxyuridine (EdU)
kit (C10340, Thermo Fisher Scientific Inc., Waltham, MA, USA). Cells were seeded
in confocal plates (5
Cells were seeded on glass coverslips at 1000 cells/well. After 7 days, the medium was removed, and cells were washed with Phosphate-Buffered Saline (PBS) and fixed with methanol for 20 min. Membranes were stained with a membrane dye for 30 min, and nuclei were counterstained with DAPI. Images were captured using an Olympus fluorescence microscope, and colonies were counted.
Each Matrigel-coated invasion chamber (BD Biosciences, #354234, Franklin Lakes,
NJ, USA) was hydrated with 50 µL of serum-free medium for 30 min before
aspirating the remaining medium. Cells were diluted in serum-free medium to 5
Glucose uptake was measured using the fluorescent glucose analog 2-NBDG (N13195, Thermo Fisher Scientific, Waltham, MA, USA). After 2 h of serum starvation, cells were incubated with 2-NBDG (100 µM) for 30 min and washed with PBS. Then, fluorescence intensity was detected. Lactate secretion was determined using a lactate detection kit. Cell culture supernatants were collected and processed in accordance with the kit’s instructions (MAK064, Sigma-Aldrich, St. Louis, MO, USA), and absorbance was measured at 570 nm by using a microplate reader (BioTek Instruments, Winooski, VT, USA).
Oxygen consumption rate (OCR) and extracellular acidification rate (ECAR) were
measured using a Seahorse XF96 analyzer (Agilent Technologies, Santa Clara, CA,
USA). Cells were processed according to the Seahorse XF Cell Mito Stress Test
(Agilent Technologies, 103020-100, Santa Clara, CA, USA) and Glycolysis Stress
Test protocols after being seeded at a density of 1
Cell coverslips were placed at the bottom of 24-well cell culture plates, and 1
mL of culture medium was added. The cells were seeded onto the coverslips at a
density of 5
After removal, cell coverslips were fixed with 4% formaldehyde solution and subsequently permeabilized with 0.5% Triton X-100 solution (A16046.AE, Thermo Fisher Scientific, Waltham, MA, USA). The cells were then immunofluorescently stained with rhodamine-labeled phalloidin (C2207S, Beyotime Biotechnology, Shanghai, China) to visualize the cytoskeleton. Finally, the cytoskeletal structures were observed, and the cell lengths were quantified using confocal microscopy (Nikon, Japan).
A549 and NCI-H1299 cells were cultured on coverslips and labeled with 100 nM MitoTracker Red CMXRos (M7512, Thermo Fisher Scientific, Waltham, MA, USA) at 37 °C for 30 min. Fixed with 4% paraformaldehyde, permeabilized with 0.2% Triton X-100 for 10 min, and blocked with 5% BSA for 1 h. They were then incubated overnight at 4 °C with rabbit anti-PTDSS1 antibody (ab157222, Abcam, Cambridge, UK, 1:200). Treated with Alexa Fluor 488-labeled secondary antibody (Thermo Fisher Scientific, A-11008, Waltham, MA, USA, 1:500) for 1 h at room temperature in the dark. Nuclei were stained with DAPI for 5 min before mounting. Three-channel fluorescence images (DAPI, PTDSS1-green, and mitochondria-red) were acquired.
A549 and NCI-H1299 cells were seeded at a density of 5
A549 cells were seeded at 2
Forty-two male BALB/c-nu nude mice (6–8 weeks old, 22.0
Patients with lung adenocarcinoma who underwent surgical treatment at our
hospital from January 2025 to April 2025 were included in this study. Twenty-five
pairs of matched lung cancer tissues and adjacent normal tissues (
Paraffin-embedded tissues were sectioned at 4 µm, deparaffinized with
xylene, and rehydrated with graded ethanol (100%, 95%, 75%, and 50%). After
Ethylenediaminetetraacetic acid (EDTA) (Thermo Fisher Scientific, Waltham, MA,
USA) antigen retrieval, endogenous peroxidase was quenched with 3% hydrogen
peroxide. Sections were blocked with 4% BSA (30 min, room temperature), then
incubated overnight at 4 °C with primary PTDSS1 antibody (1:200;
ab157222, Abcam, Cambridge, UK). Following PBS washes, secondary antibody
incubation (60 min, room temperature) and 3,3’-Diaminobenzidine (DAB) staining
were performed. Sections were counterstained with hematoxylin, blued, dehydrated
with graded alcohol and xylene, then mounted. Staining intensity was evaluated by
three pathologists across five high-power fields (
Data are presented as mean
PTDSS1 co-expressed proteins were first analyzed using the LinkedOmics database to investigate the expression characteristics and clinical significance of PTDSS1 in lung cancer. The volcano plot displays proteins associated with PTDSS1 expression (Fig. 1A), followed by cluster analysis identifying protein groups positively (Fig. 1B) and negatively (Fig. 1C) correlated with PTDSS1. Transcriptome data from patients with lung cancer in TCGA database were analyzed to validate the PTDSS1 expression levels in lung cancer. The results demonstrated upregulated PTDSS1 mRNA expression levels in the lung cancer tissues (Fig. 1D). Kaplan-Meier survival analysis showed patients with high PTDSS1 expression had shorter overall survival (Fig. 1E). Analysis of the TCGA database revealed that PTDSS1 expression levels positively correlate with lymph node metastasis (N stage) in lung cancer (Fig. 1F). Specifically, patients at N2 stage exhibited higher PTDSS1 expression levels than patients at N0-1 stage, indicating that PTDSS1 may promote lymph node metastasis in lung cancer and participate in malignant tumor progression. The PTDSS1 protein expression levels in 25 paired lung cancer tissues and adjacent normal tissues were detected using immunohistochemistry to further validate the PTDSS1 expression characteristics in lung cancer. The results showed higher PTDSS1 staining intensity in the lung cancer tissues than in the paired adjacent normal tissues (Fig. 1G).
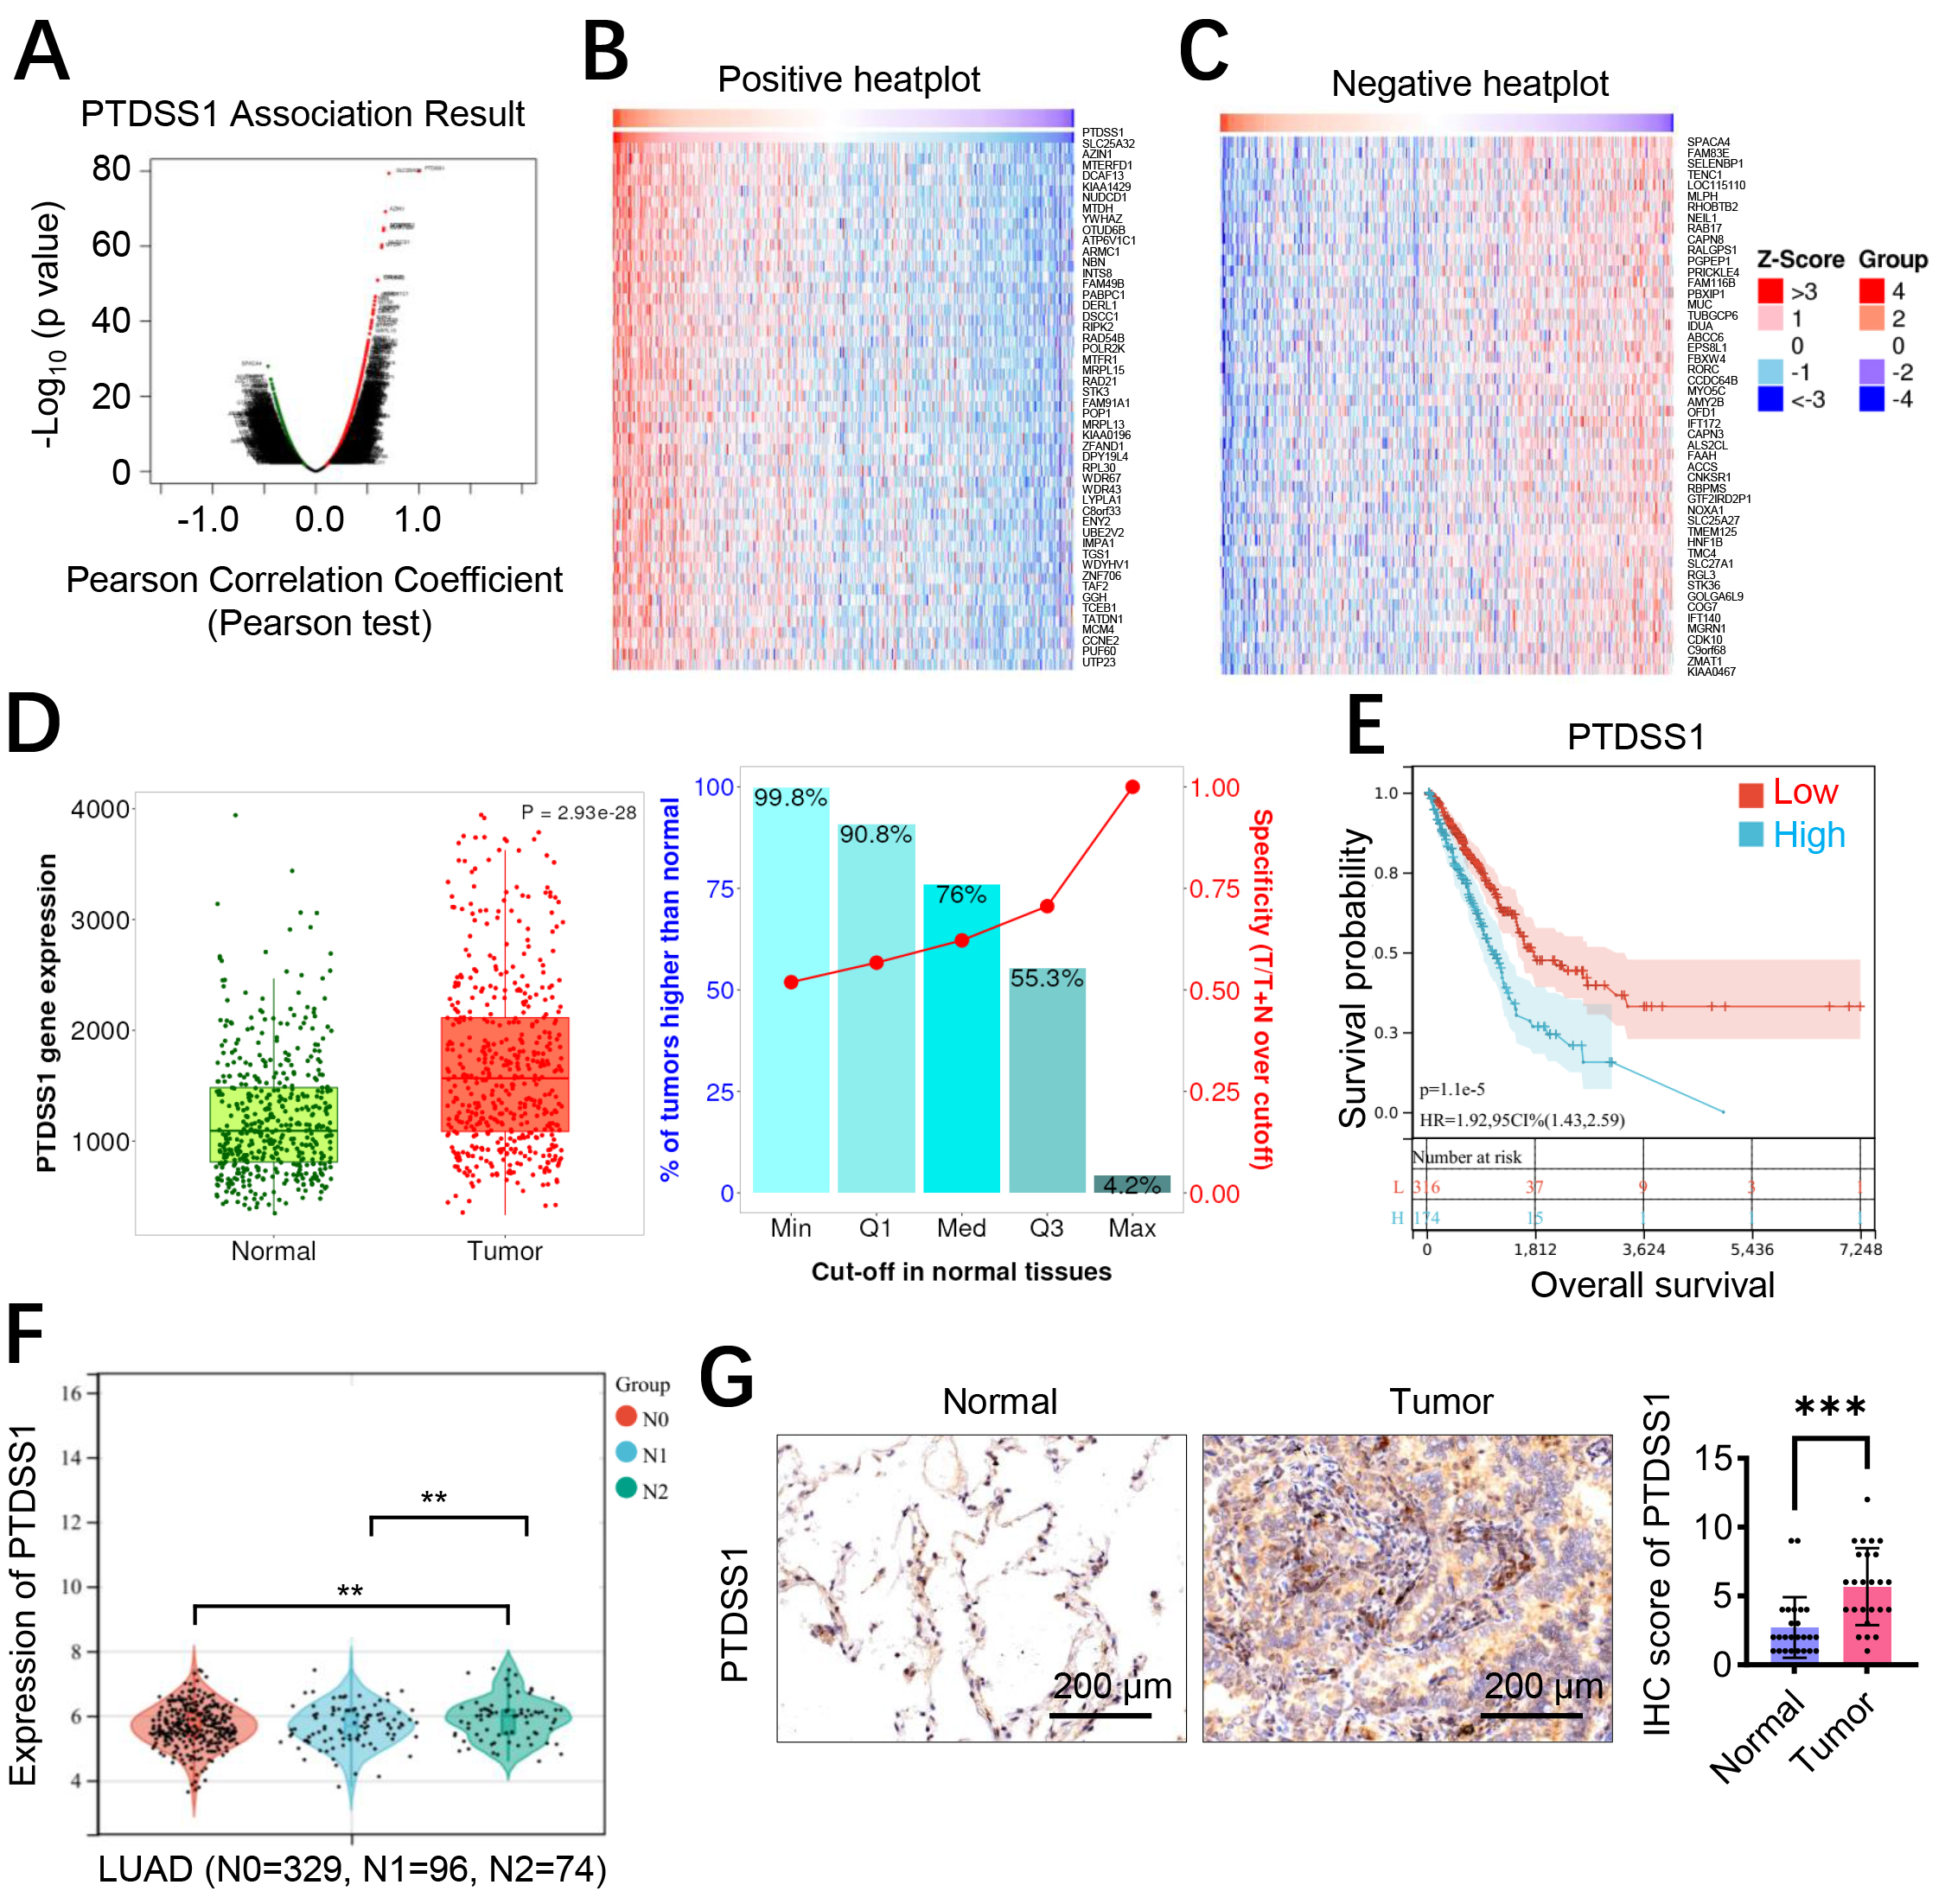 Fig. 1.
PTDSS1 is an oncogene associated with lung cancer progression
and poor clinical prognosis. (A–C) LinkedOmics database analysis of PTDSS1
co-expression correlation proteins. (A) Volcano plot of PTDSS1 co-expressed
proteins (X-axis: Pearson Correlation Coefficient; Y-axis: -log10
p-value). (B) Cluster analysis of proteins positively correlated with
PTDSS1 (Groups: functional protein clusters based on correlation coefficients
Western blot analysis demonstrated that the A549 and NCI-H1299 cells transfected
with OE-PTDSS1 plasmid had an increase in PTDSS1 protein expression levels
compared with the control group (OE-NC, Fig. 2A and Supplementary Fig.
2), confirming successful construction of the overexpression model. PTDSS1
overexpression significantly enhanced the proliferative capacity of A549 and
NCI-H1299 cells, as demonstrated by increased CCK-8 activity and EdU-positive
cell percentage and enhanced colony formation ability compared with the controls
(Fig. 2B–D). Transwell invasion assay results showed that PTDSS1 overexpression
increased the number of A549 and NCI-H1299 cells penetrating through the Matrigel
matrix (Fig. 2E), indicating that PTDSS1 enhances the invasive capacity of lung
cancer cells. Cytoskeletal staining revealed that the A549 and NCI-H1299 cells in
the PTDSS1 overexpression group exhibited typical spindle-shaped morphology with
increased cell length (Fig. 2F). A tail-vein-injection tumor metastasis model was
established to validate whether the in vitro findings of PTDSS1
promoting lung cancer metastasis are consistent in vivo. The A549 and
NCI-H1299 cells overexpressing PTDSS1 or control plasmid were injected into the
tail veins of BALB/c nude mice, and lung metastasis was evaluated after 6 weeks.
The histopathological analysis showed an increased number of metastatic foci in
the lung tissues of the PTDSS1 overexpression group (Fig. 2G). An increase in the
number of micrometastatic lesions was observed in the lung tissues of the PTDSS1
overexpression group, exhibiting distinct infiltrative growth characteristics.
SiRNA-mediated knockdown was performed in the A549 and NCI-H1299 cells to
validate PTDSS1 function. PTDSS1 silencing significantly reduced cell
proliferation (EdU assays: ~50% reduction, p
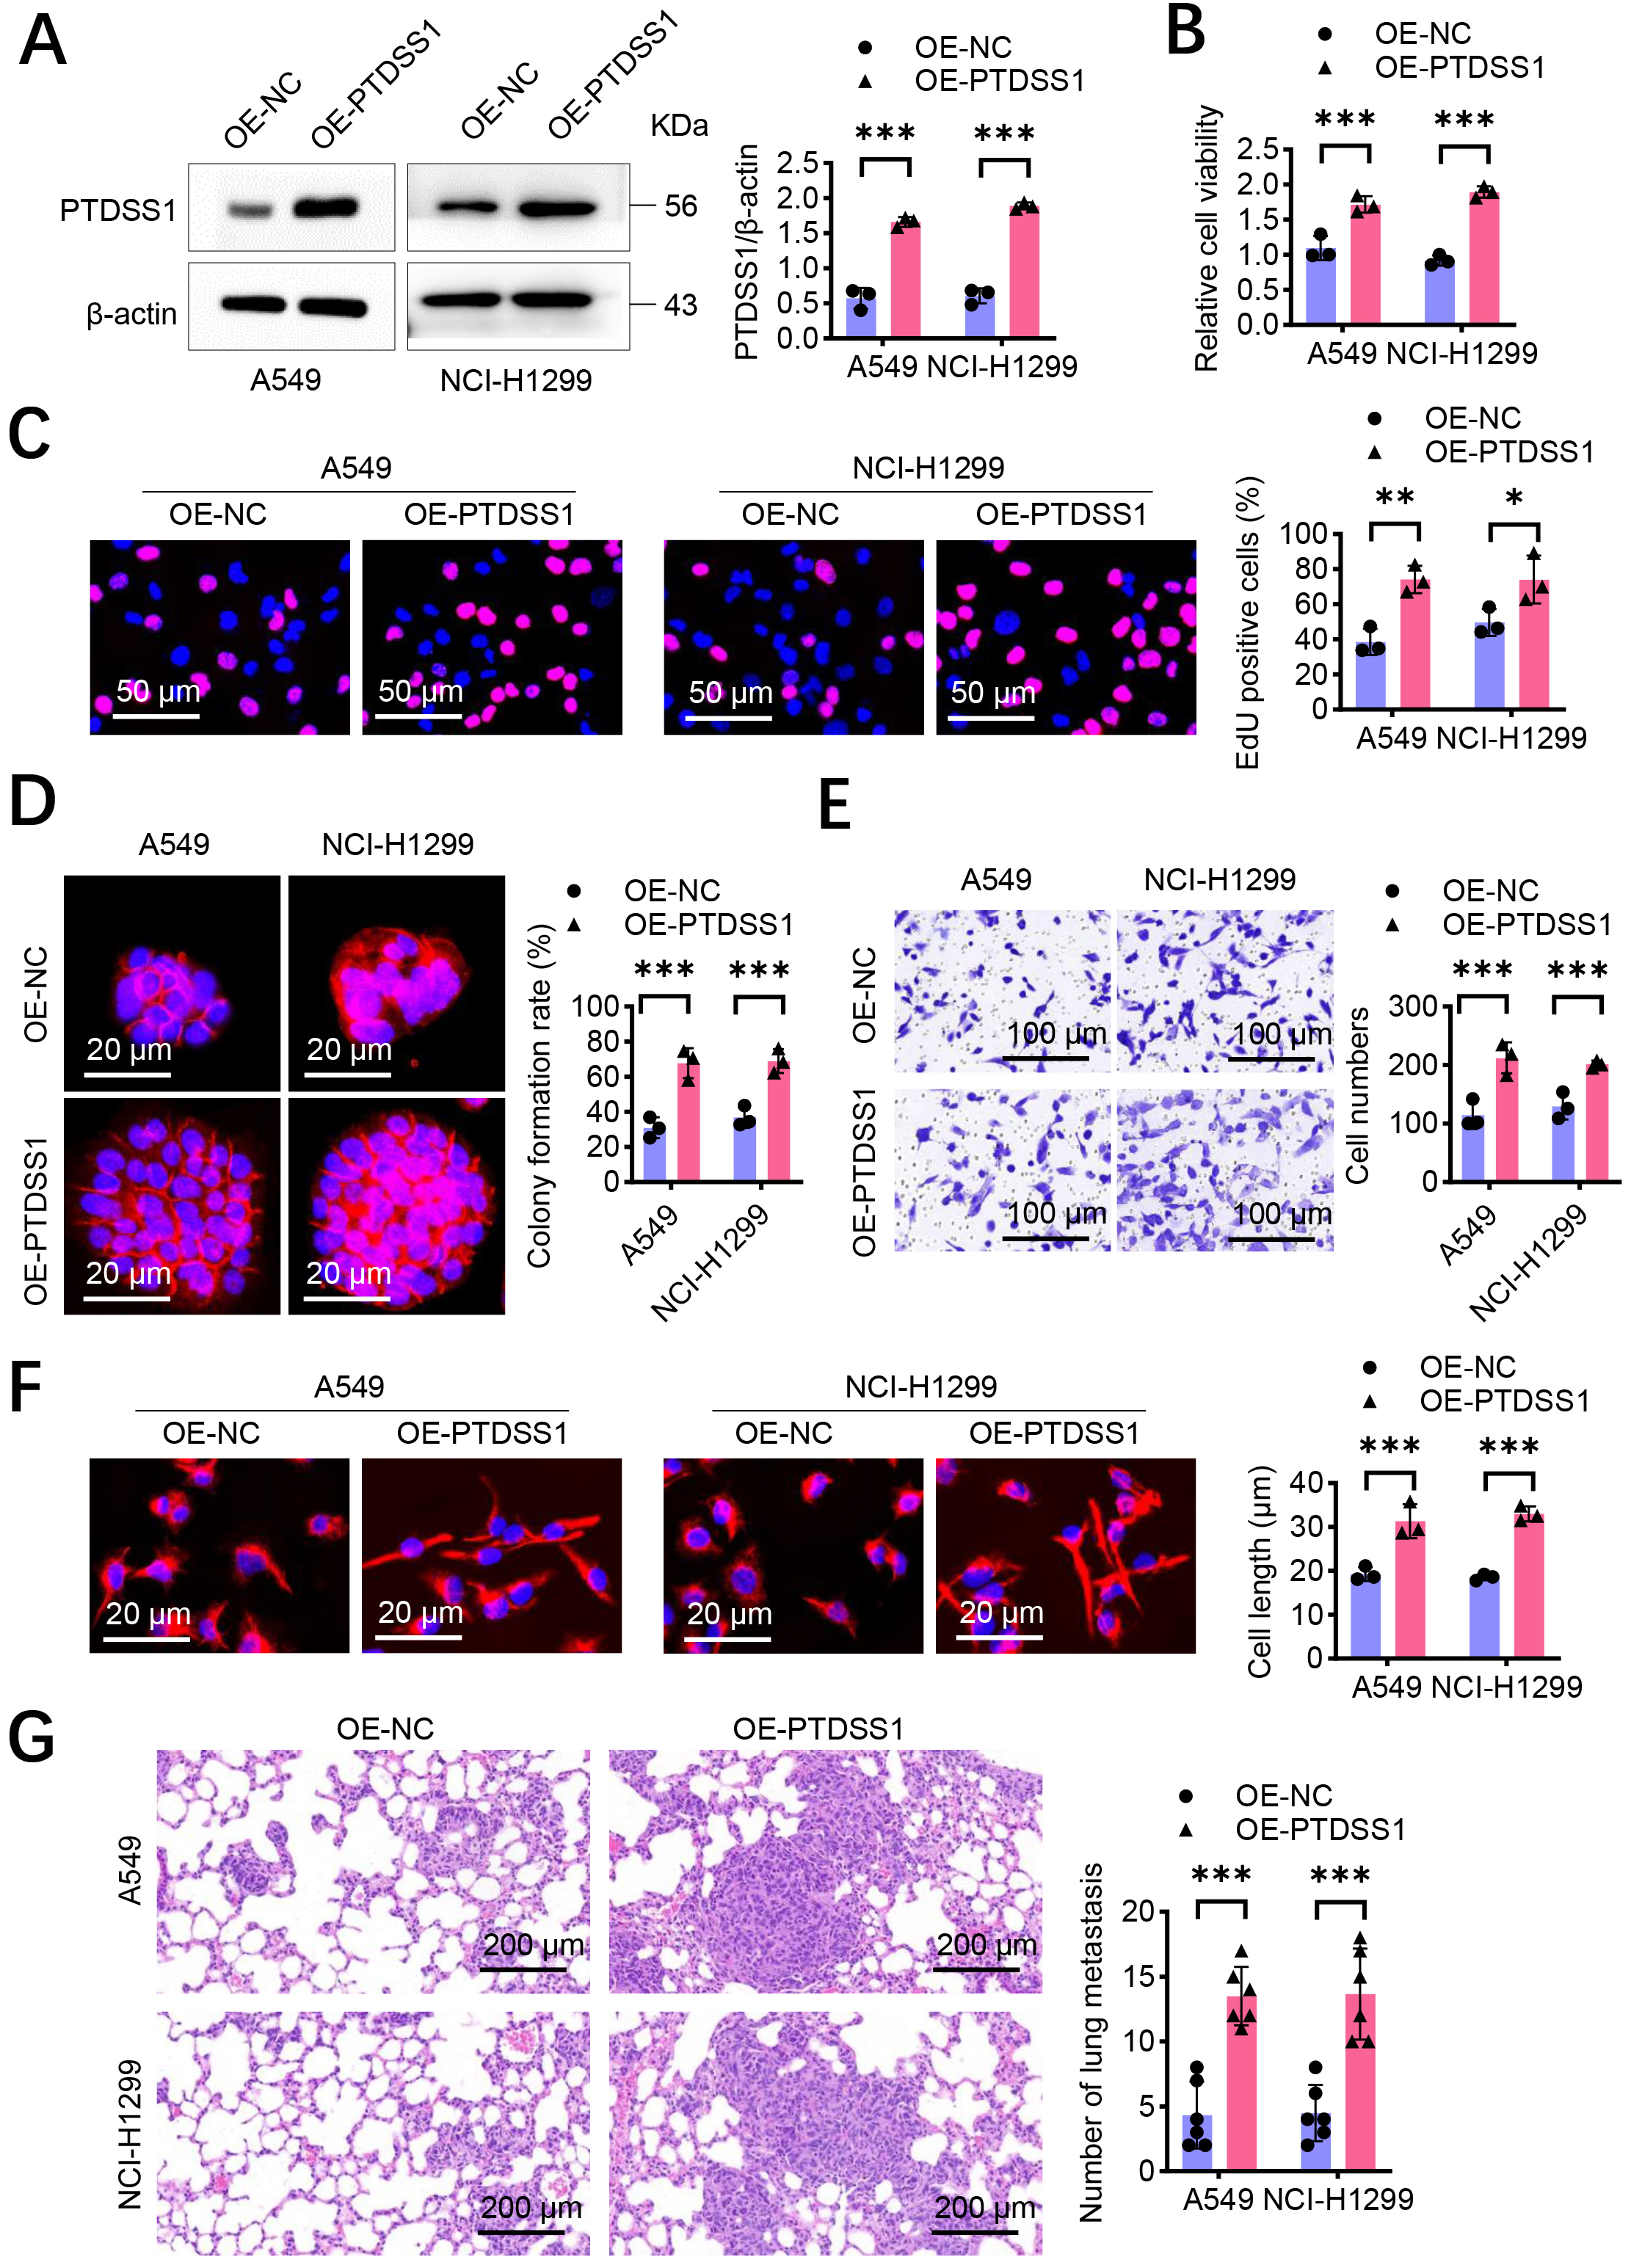 Fig. 2.
PTDSS1 promotes proliferation and metastasis of lung cancer
cells in vitro. (A) Western blot detection of transfection efficiency
in A549 and NCI-H1299 cells transfected with control vector OE-NC and
overexpression plasmid (OE-PTDSS1). (B) CCK-8 detection of cell viability in A549
and NCI-H1299 cells after PTDSS1 overexpression. (C) 5-ethyl-2’-deoxyuridine
(EdU) detection of proliferation capacity in A549 and NCI-H1299 cells after
PTDSS1 overexpression. Scale bar: 50 µm. (D) Colony formation assay measuring proliferation
capacity in A549 and NCI-H1299 cells after PTDSS1 overexpression, Y-axis: Clone
formation efficiency (% of seeded cells). Scale bar: 20 µm. (E) Transwell invasion assay
evaluating invasive capacity in A549 and NCI-H1299 cells after PTDSS1
overexpression. Scale bar: 100 µm. (F) Cytoskeletal staining in NCI-H1299 and A549 cells
demonstrating disappearance of spindle morphology and shortened cell length after
PTDSS1 overexpression. Scale bar: 20 µm. (G) Establishment of tail vein injection tumor metastasis
model in BALB/c nude mice (n = 6) using PTDSS1-overexpressing A549 and NCI-H1299
cells. Scale bar: 200 µm. Data were presented as means
Bioinformatic enrichment analysis of PTDSS1 co-expressed genes showed significant enrichment in energy metabolism-related pathways (Fig. 3A), suggesting the involvement of PTDSS1 in metabolic reprogramming of lung cancer. The effect of PTDSS1 on the expression levels of key glycolytic enzymes was further examined. RT-qPCR analysis revealed that PTDSS1 overexpression upregulated the mRNA expression levels of multiple key glycolytic enzymes in the A549 and NCI-H1299 cells. Specifically, lactate dehydrogenase A (LDHA, Fig. 3B), glucose transporter 1 (GLUT1, Fig. 3C), PKM2 (Fig. 3D), and phosphofructokinase muscle type (PFKM, Fig. 3E) showed upregulation in the PTDSS1 overexpression group. Cellular OCR and ECAR were measured using the Seahorse cellular energy metabolism analyzer to directly assess the impact of PTDSS1 on the metabolic phenotype of lung cancer cells. The OCR results showed that PTDSS1 overexpression reduced the basal respiration and maximum respiratory capacity of NCI-H1299 and A549 cells (Fig. 3F), indicating that PTDSS1 overexpression inhibited mitochondrial oxidative phosphorylation. Conversely, the ECAR measurement results showed that glycolysis rate and glycolytic capacity were higher in the PTDSS1 overexpression group than in the control group (Fig. 3G), indicating that PTDSS1 promoted glycolytic activity in lung cancer cells. PTDSS1 overexpression increased glucose uptake (Fig. 3H) and lactate secretion (Fig. 3I) in the NCI-H1299 and A549 cells. These results demonstrated that PTDSS1 promotes glucose uptake and utilization in lung cancer cells, enhancing aerobic glycolytic activity. Pearson’s correlation analysis showed that PTDSS1 expression positively correlated with PKM2, PFKM, LDHA, and GLUT1 in clinical lung cancer samples (Fig. 3J), supporting PTDSS1’s role in glycolytic reprogramming.
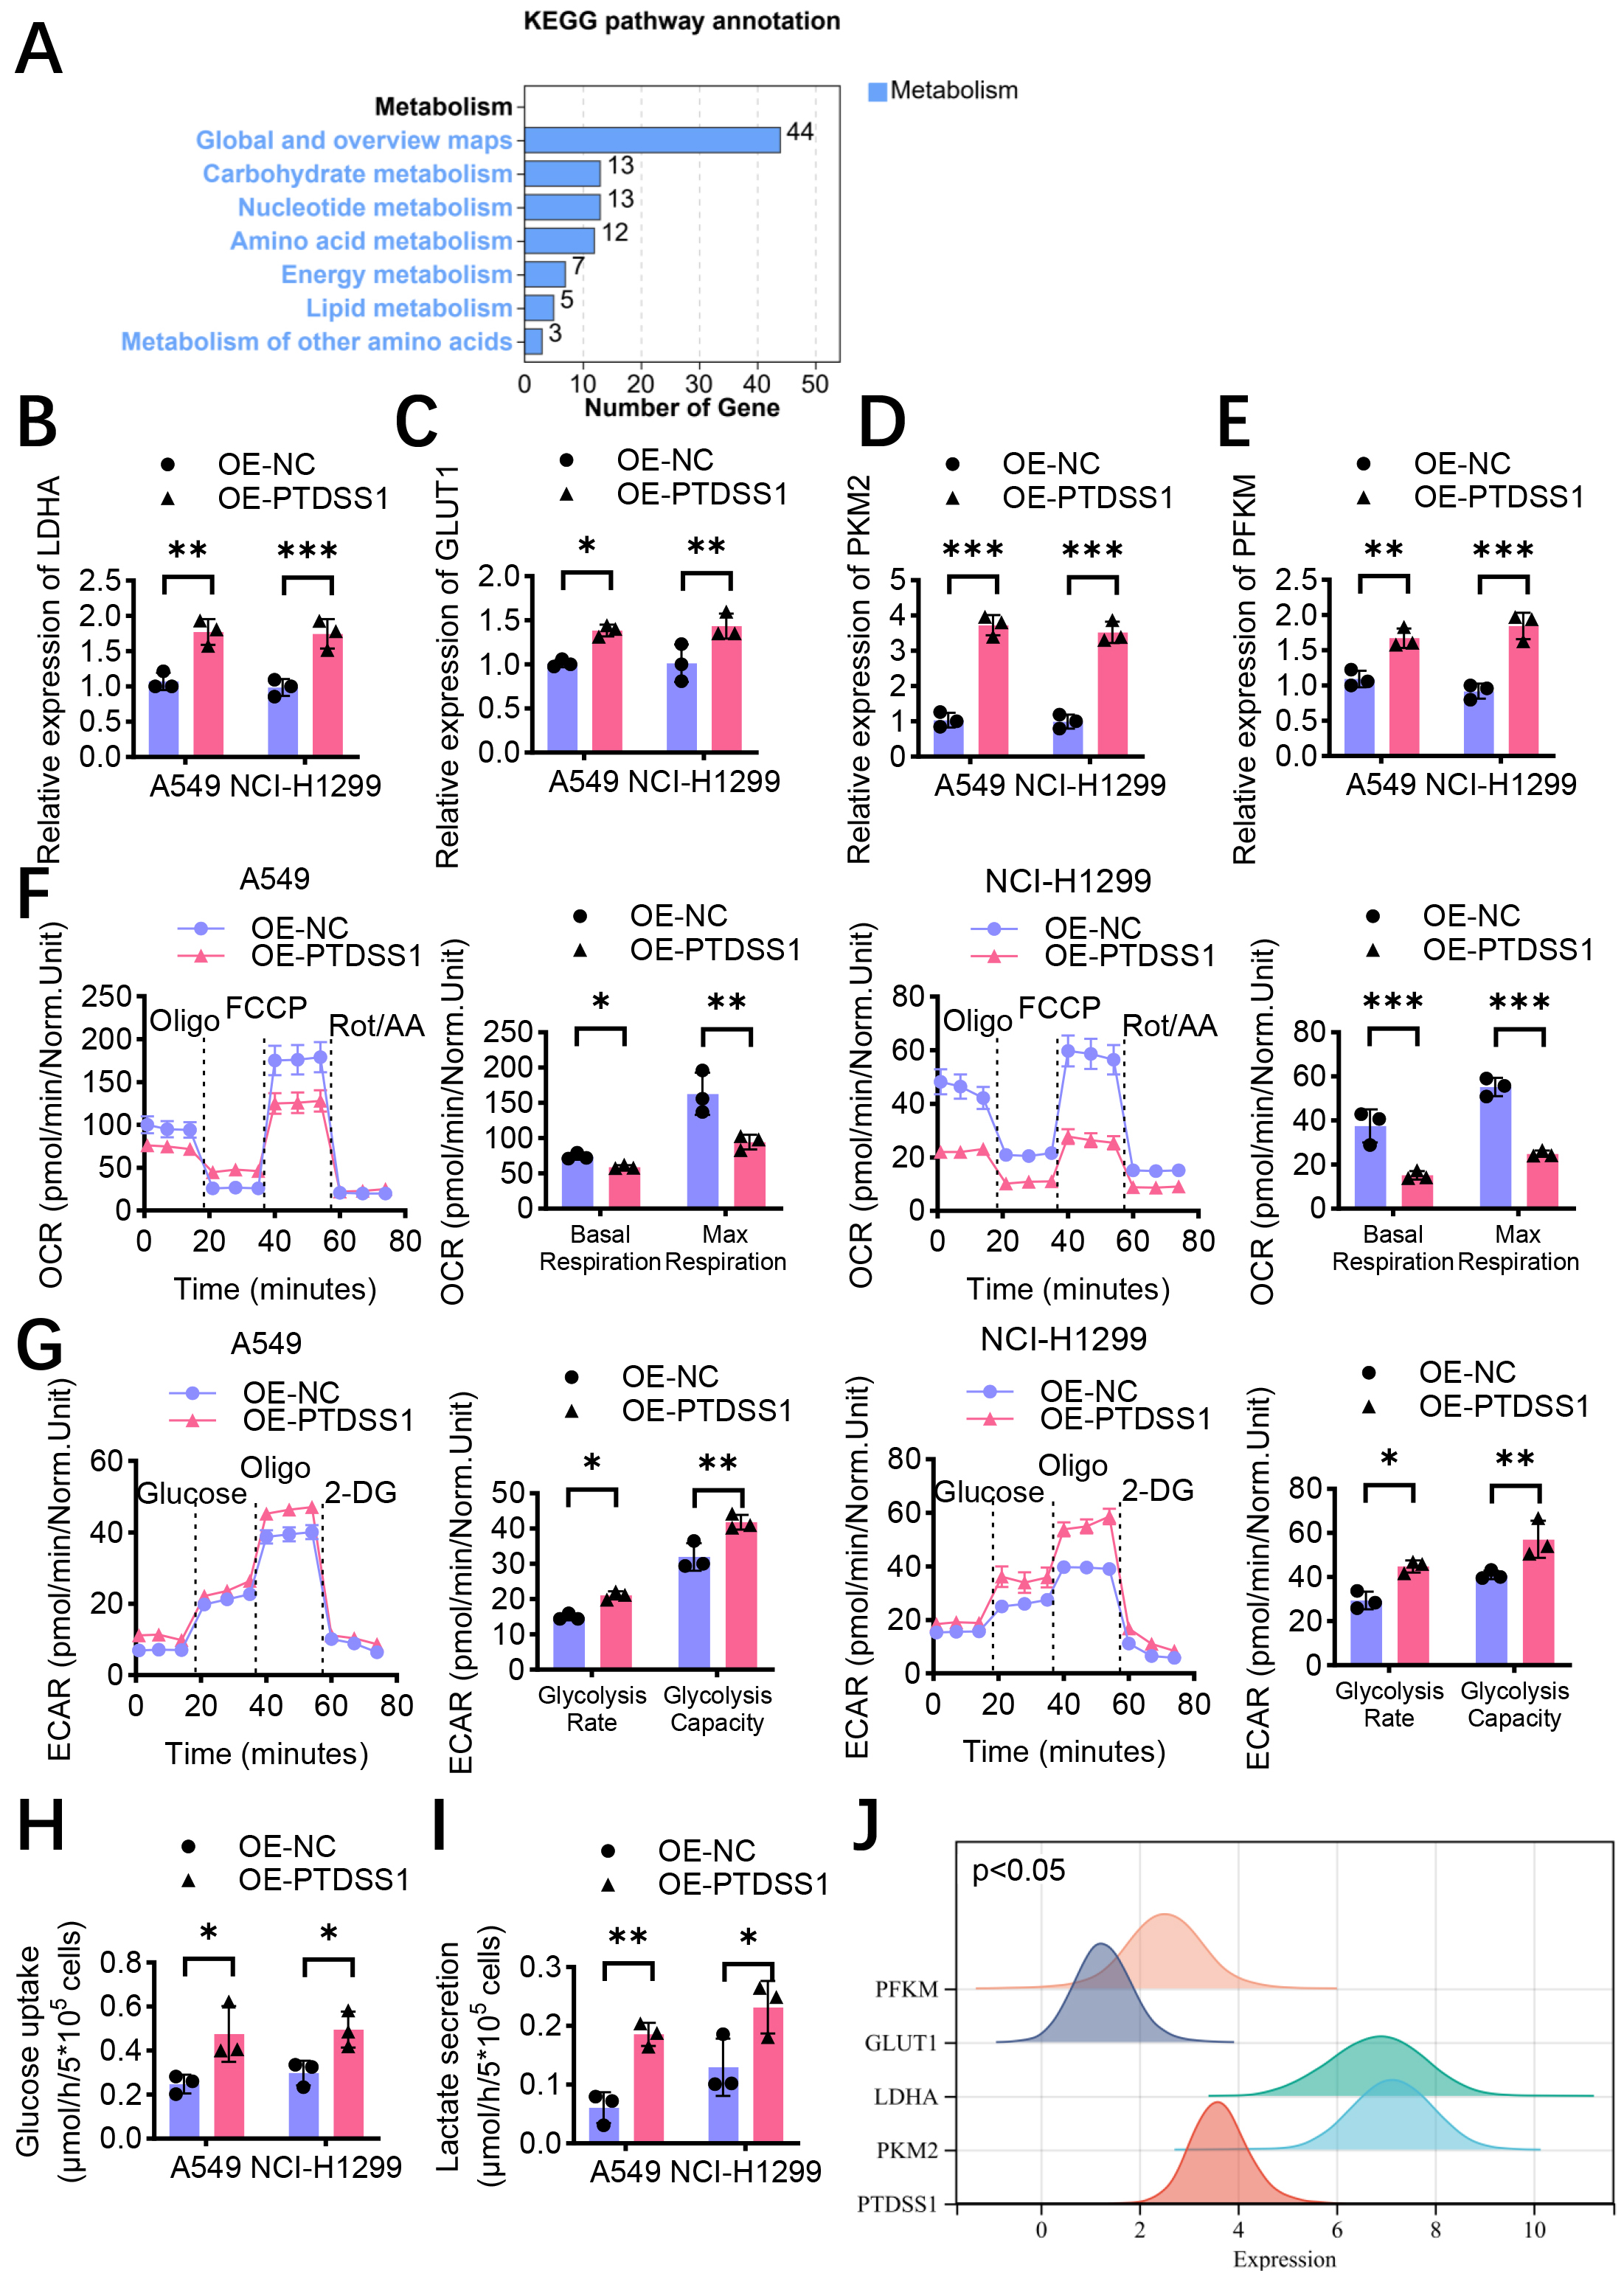 Fig. 3.
PTDSS1 promotes aerobic glycolysis in lung cancer in
vitro. (A) Enrichment analysis of PTDSS1 co-expressed genes shows significant
enrichment in energy metabolism-related pathways and functions. (B) RT-qPCR
detection of relative mRNA expression levels of glycolysis-related gene
LDHA in control and stable PTDSS1-overexpressing A549 and NCI-H1299
cells. (C) RT-qPCR detection of relative mRNA expression levels of
glycolysis-related gene GLUT1 in control and stable
PTDSS1-overexpressing A549 and NCI-H1299 cells. (D) RT-qPCR detection of relative
mRNA expression levels of glycolysis-related gene PKM2 in control and
stable PTDSS1-overexpressing A549 and NCI-H1299 cells. (E) RT-qPCR detection of
relative mRNA expression levels of glycolysis-related gene PFKM in
control and stable PTDSS1-overexpressing A549 and NCI-H1299 cells. (F)
Measurement of oxygen consumption rate (OCR) in control and stable
PTDSS1-overexpressing NCI-H1299 and A549 cells. Analysis of basal respiration and
maximal respiration. (G) Measurement of extracellular acidification rate (ECAR)
in control and PTDSS1-overexpressing NCI-H1299 and A549 cells. Analysis of
glycolytic rate and glycolytic capacity. (H) Detection of glucose uptake in
control and stable PTDSS1-overexpressing NCI-H1299 and A549 cells. (I) Detection
of lactate secretion in control and stable PTDSS1-overexpressing NCI-H1299 and
A549 cells. (J) Ridge plot analysis showing expression distribution patterns of
PTDSS1 and key glycolysis-related genes (PKM2, PFKM,
LDHA, and GLUT1) in lung cancer patients from TCGA dataset
(X-axis: Gene expression level, log2 TPM+1; Y-axis: Gene names; density curves
show expression distribution for each gene). Data were presented as means
On the basis of previous findings that PTDSS1 promotes glycolysis and malignant progression in lung cancer, and the important role of nuclear proteins in metabolic regulation in recent years, this study hypothesized that PTDSS1 may possess subcellular compartment-specific functions. A PTDSS1 overexpression vector with a nuclear localization signal peptide (NLS-PTDSS1), directing PTDSS1 specifically to the nucleus, was constructed to verify this hypothesis. Immunofluorescence was conducted to validate the successful construction of the experimental model. Compared with the control group and the full-length PTDSS1 overexpression group (OE-PTDSS1All), the A549 cells transfected with NLS-PTDSS1 (OE-PTDSS1N) displayed significantly enhanced nuclear PTDSS1 fluorescence signals, primarily localized within the nucleus (Fig. 4A). The results showed that glucose uptake and lactate secretion increased in the OE-PTDSS1All group. The glucose uptake (Fig. 4B) and lactate secretion (Fig. 4C) levels in the OE-PTDSS1N group further increased, exceeding those in the OE-PTDSS1All group. The EdU incorporation assay results showed an increase in the EdU-positive rate of the OE-PTDSS1All group. The EdU-positive rate of the OE-PTDSS1N group further increased, exceeding that of the OE-PTDSS1All group (Fig. 4D). The colony formation assays further confirmed that the OE-PTDSS1N group exhibited stronger colony-forming ability than the OE-PTDSS1All and control groups (Fig. 4E). These results indicated that nuclear PTDSS1 effectively promotes lung cancer cell proliferation, possibly due to its enhanced glycolysis regulatory capability. The OE-PTDSS1N group exhibited more prominent spindle-shaped morphology and increased cell length than the OE-PTDSS1All group (Fig. 4F). A lung metastasis model was established by injecting the three treatment groups of A549 cells into the tail veins of BALB/c nude mice to validate the role of nuclear PTDSS1 in promoting tumor metastasis in vivo. The pathological analysis results after 6 weeks showed an increase in the number of metastatic foci in the lung tissues of the OE-PTDSS1N group compared with that in the control and OE-PTDSS1All groups (Fig. 4G). More and larger micrometastatic lesions were observed in the lung tissues of the OE-PTDSS1N group, exhibiting a more pronounced invasive growth pattern.
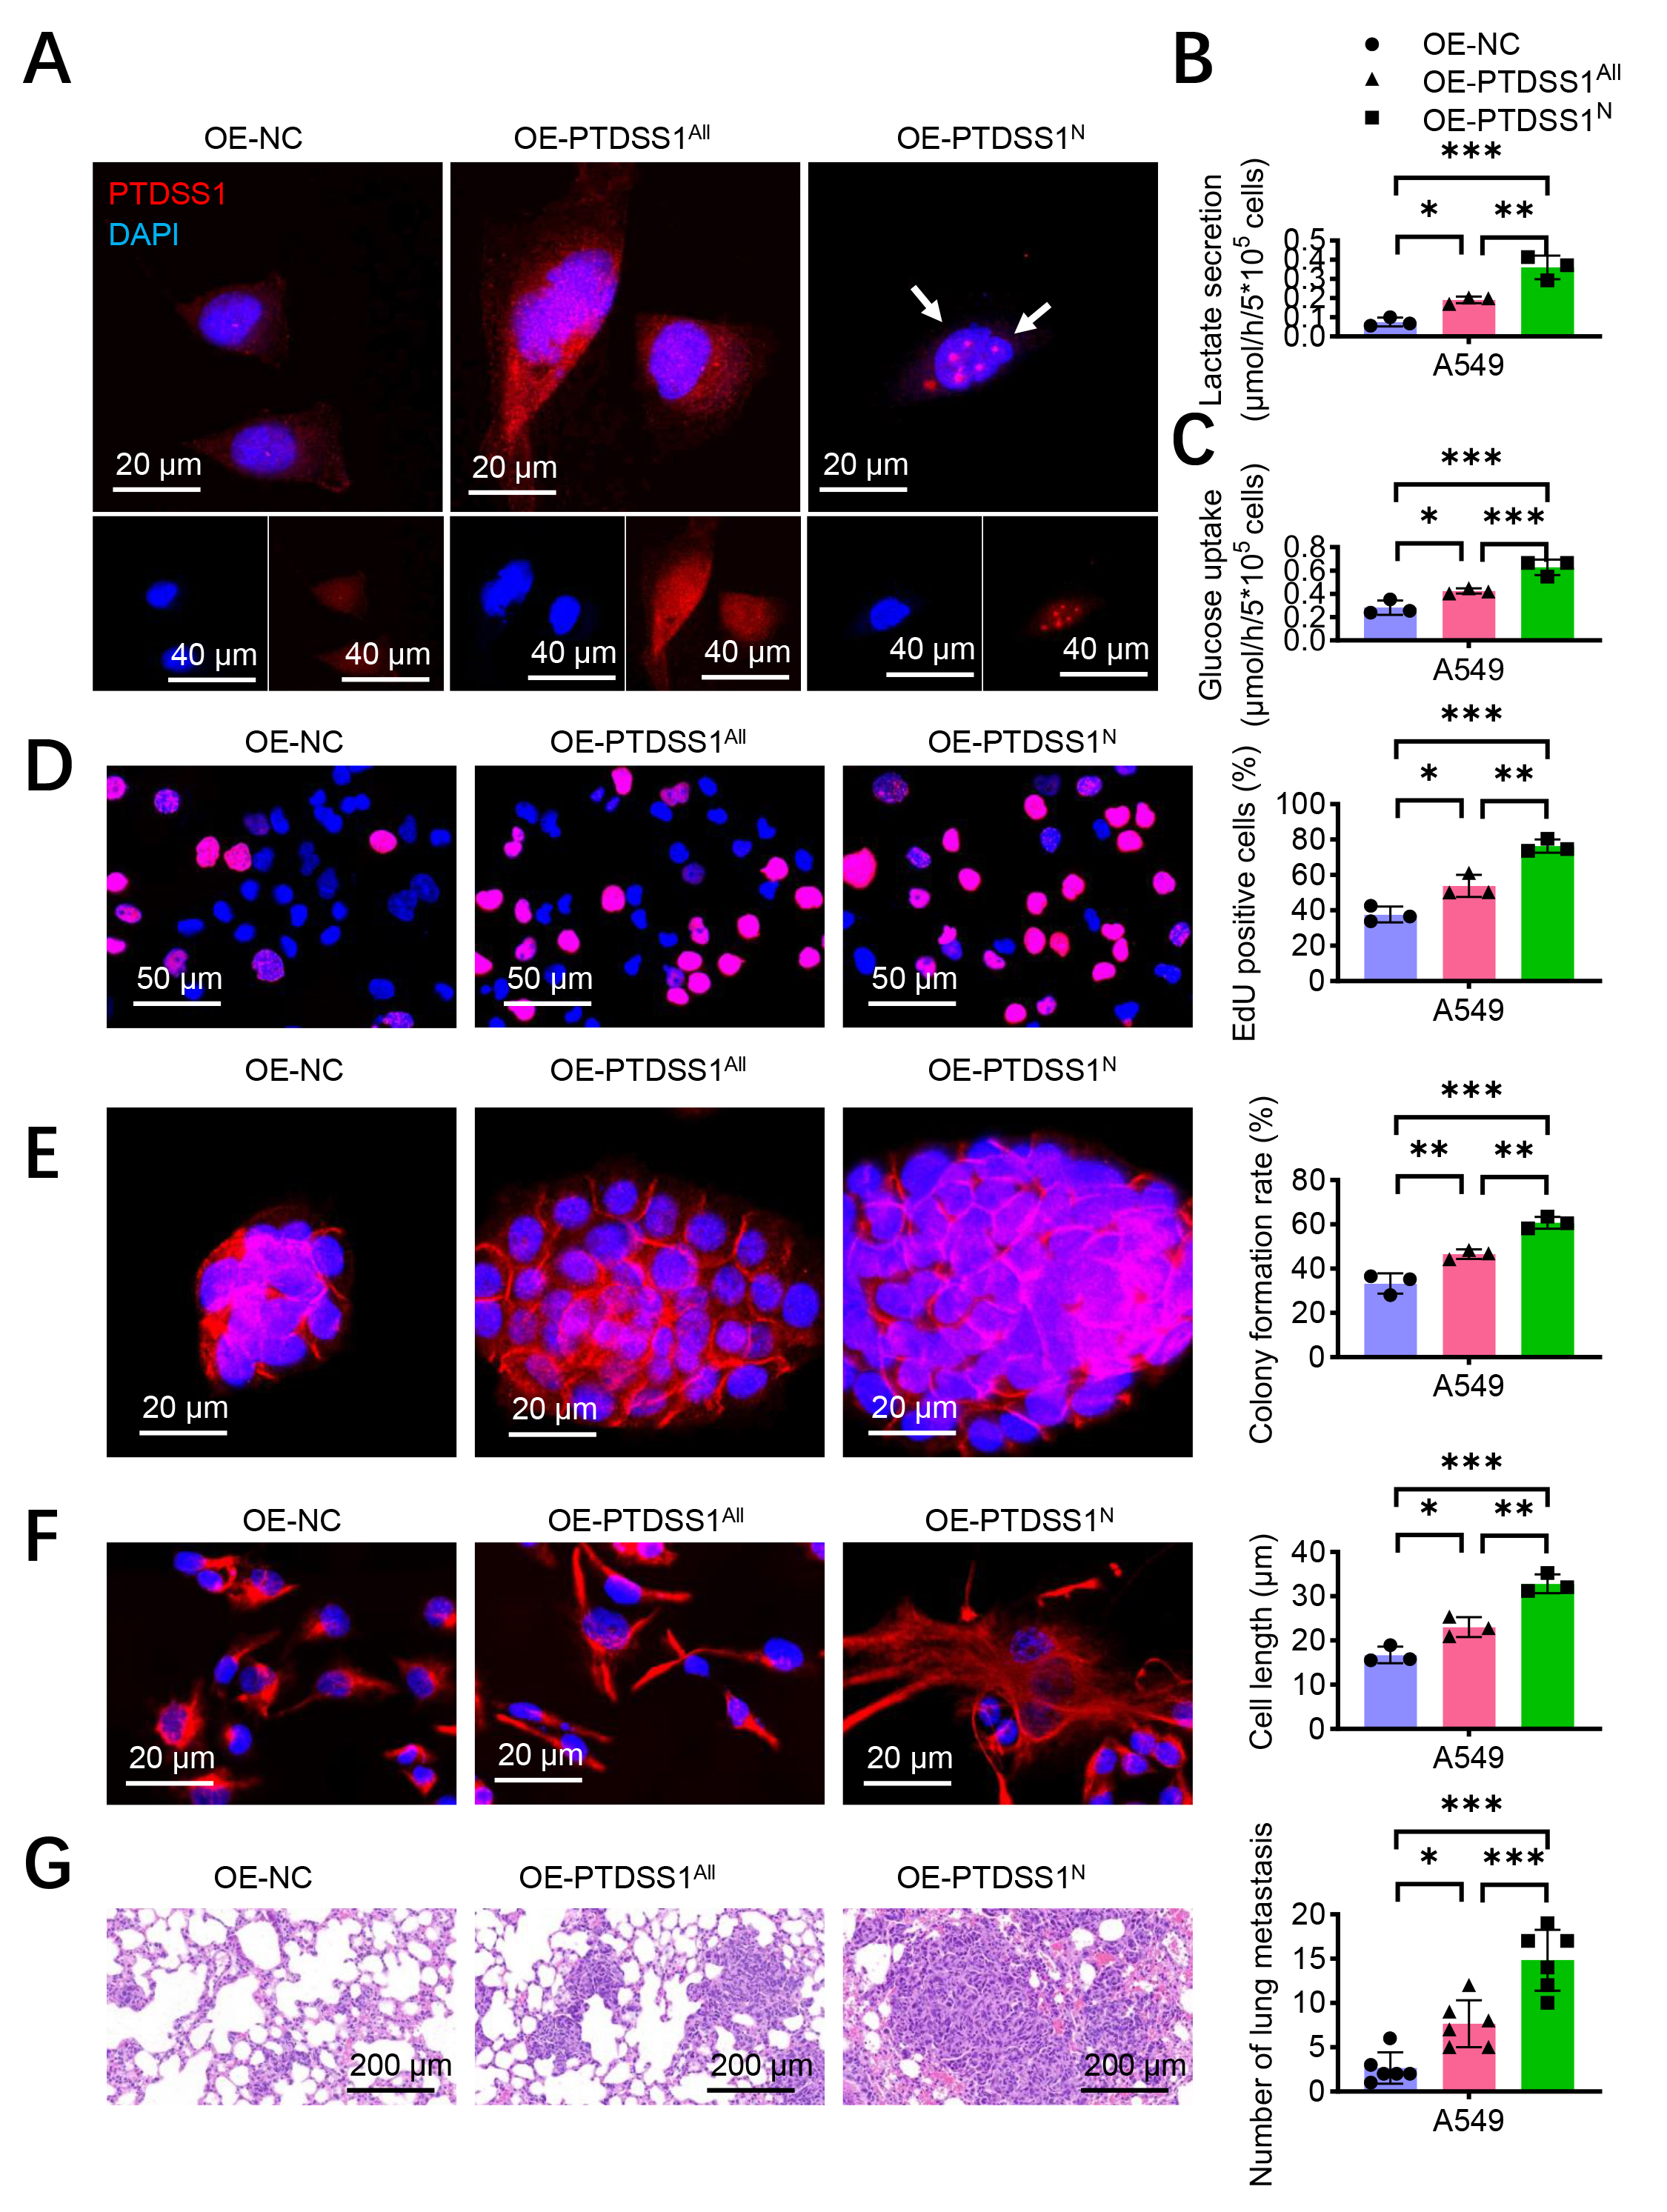 Fig. 4.
Nuclear PTDSS1 plays a more critical role in promoting lung
cancer progression through glycolysis. (A) Construction of PTDSS1 nuclear
localization signal peptide (NLS-PTDSS1) transfected in A549 cells, with
immunofluorescence detection of PTDSS1 localization. Scale bar: 20 µm (upper); scale bar: 40 µm (lower). (B) Detection of glucose
uptake in control and stable PTDSS1-overexpressing A549 cells. (C) Detection of
lactate secretion in control and stable PTDSS1-overexpressing A549 cells. (D) EdU
assay evaluating proliferation capacity in control and stable
PTDSS1-overexpressing A549 cells. Scale bar: 50 µm. (E) Colony formation assay examining
proliferation capacity in control and stable PTDSS1-overexpressing A549 cells. Scale bar: 20 µm.
(F) Detection of cytoskeletal changes in control and stable PTDSS1-overexpressing
A549 cells. Scale bar: 20 µm. (G) Establishment of tail vein injection tumor metastasis model in
BALB/c nude mice (n = 6) using control and stable PTDSS1-overexpressing A549
cells. Scale bar: 200 µm. Data were presented as means
The functional relationship of PTDSS1 and PKM2 was investigated given the co-expression correlation between them. Immunofluorescence showed co-localization of PTDSS1 and PKM2 in the A549 cells (Fig. 5A). The PKM2 in PTDSS1-overexpressing cells was silenced to examine PKM2’s role in PTDSS1-mediated glycolysis. The metabolic analysis revealed that PTDSS1 overexpression increased glucose uptake (Fig. 5B) and lactate secretion (Fig. 5C) compared with control treatment. However, simultaneous silencing of PKM2 with PTDSS1 overexpression (OE-PTDSS1 + shPKM2) reversed the promotive effect of PTDSS1 on glucose uptake and lactate secretion. This result indicated that PTDSS1’s promotion of glycolysis primarily depends on PKM2. Subsequently, the role of PKM2 in PTDSS1-promoted lung cancer cell proliferation was assessed. PTDSS1 overexpression increased the DNA synthesis activity in A549 cells (Fig. 5D), whereas silencing PKM2 inhibited this pro-proliferative effect. PTDSS1 overexpression significantly enhanced the colony formation ability of A549 cells, and silencing PKM2 effectively blocked this effect (Fig. 5E). These results indicated that PKM2 is a key molecule mediating the pro-proliferative effects of PTDSS1. Moreover, PTDSS1 overexpression caused the A549 cells to transform toward a spindle shape with increased cell length, whereas silencing PKM2 in the PTDSS1-overexpressing cells reduced cell length (Fig. 5F), suggesting that PKM2 also plays an important role in PTDSS1-promoted cell invasion and metastatic potential. The PTDSS1-overexpressing A549 cells were treated with the glycolysis inhibitor 2-DG to further verify the critical role of glycolysis in PTDSS1-promoted malignant phenotypes in lung cancer. The results showed that compared with control treatment, 2-DG treatment inhibited the PTDSS1 overexpression-induced increase in glucose uptake (Fig. 5G) and enhanced lactate secretion (Fig. 5H), confirming that 2-DG effectively inhibits PTDSS1-promoted glycolytic activity. Furthermore, 2-DG treatment reversed the PTDSS1-enhanced proliferation (EdU assays), colony formation, and morphological changes in A549 cells (Fig. 5I–K), indicating that glycolysis inhibition blocks PTDSS1’s oncogenic effects and confirming glycolysis as a key pathway for PTDSS1-mediated malignant progression.
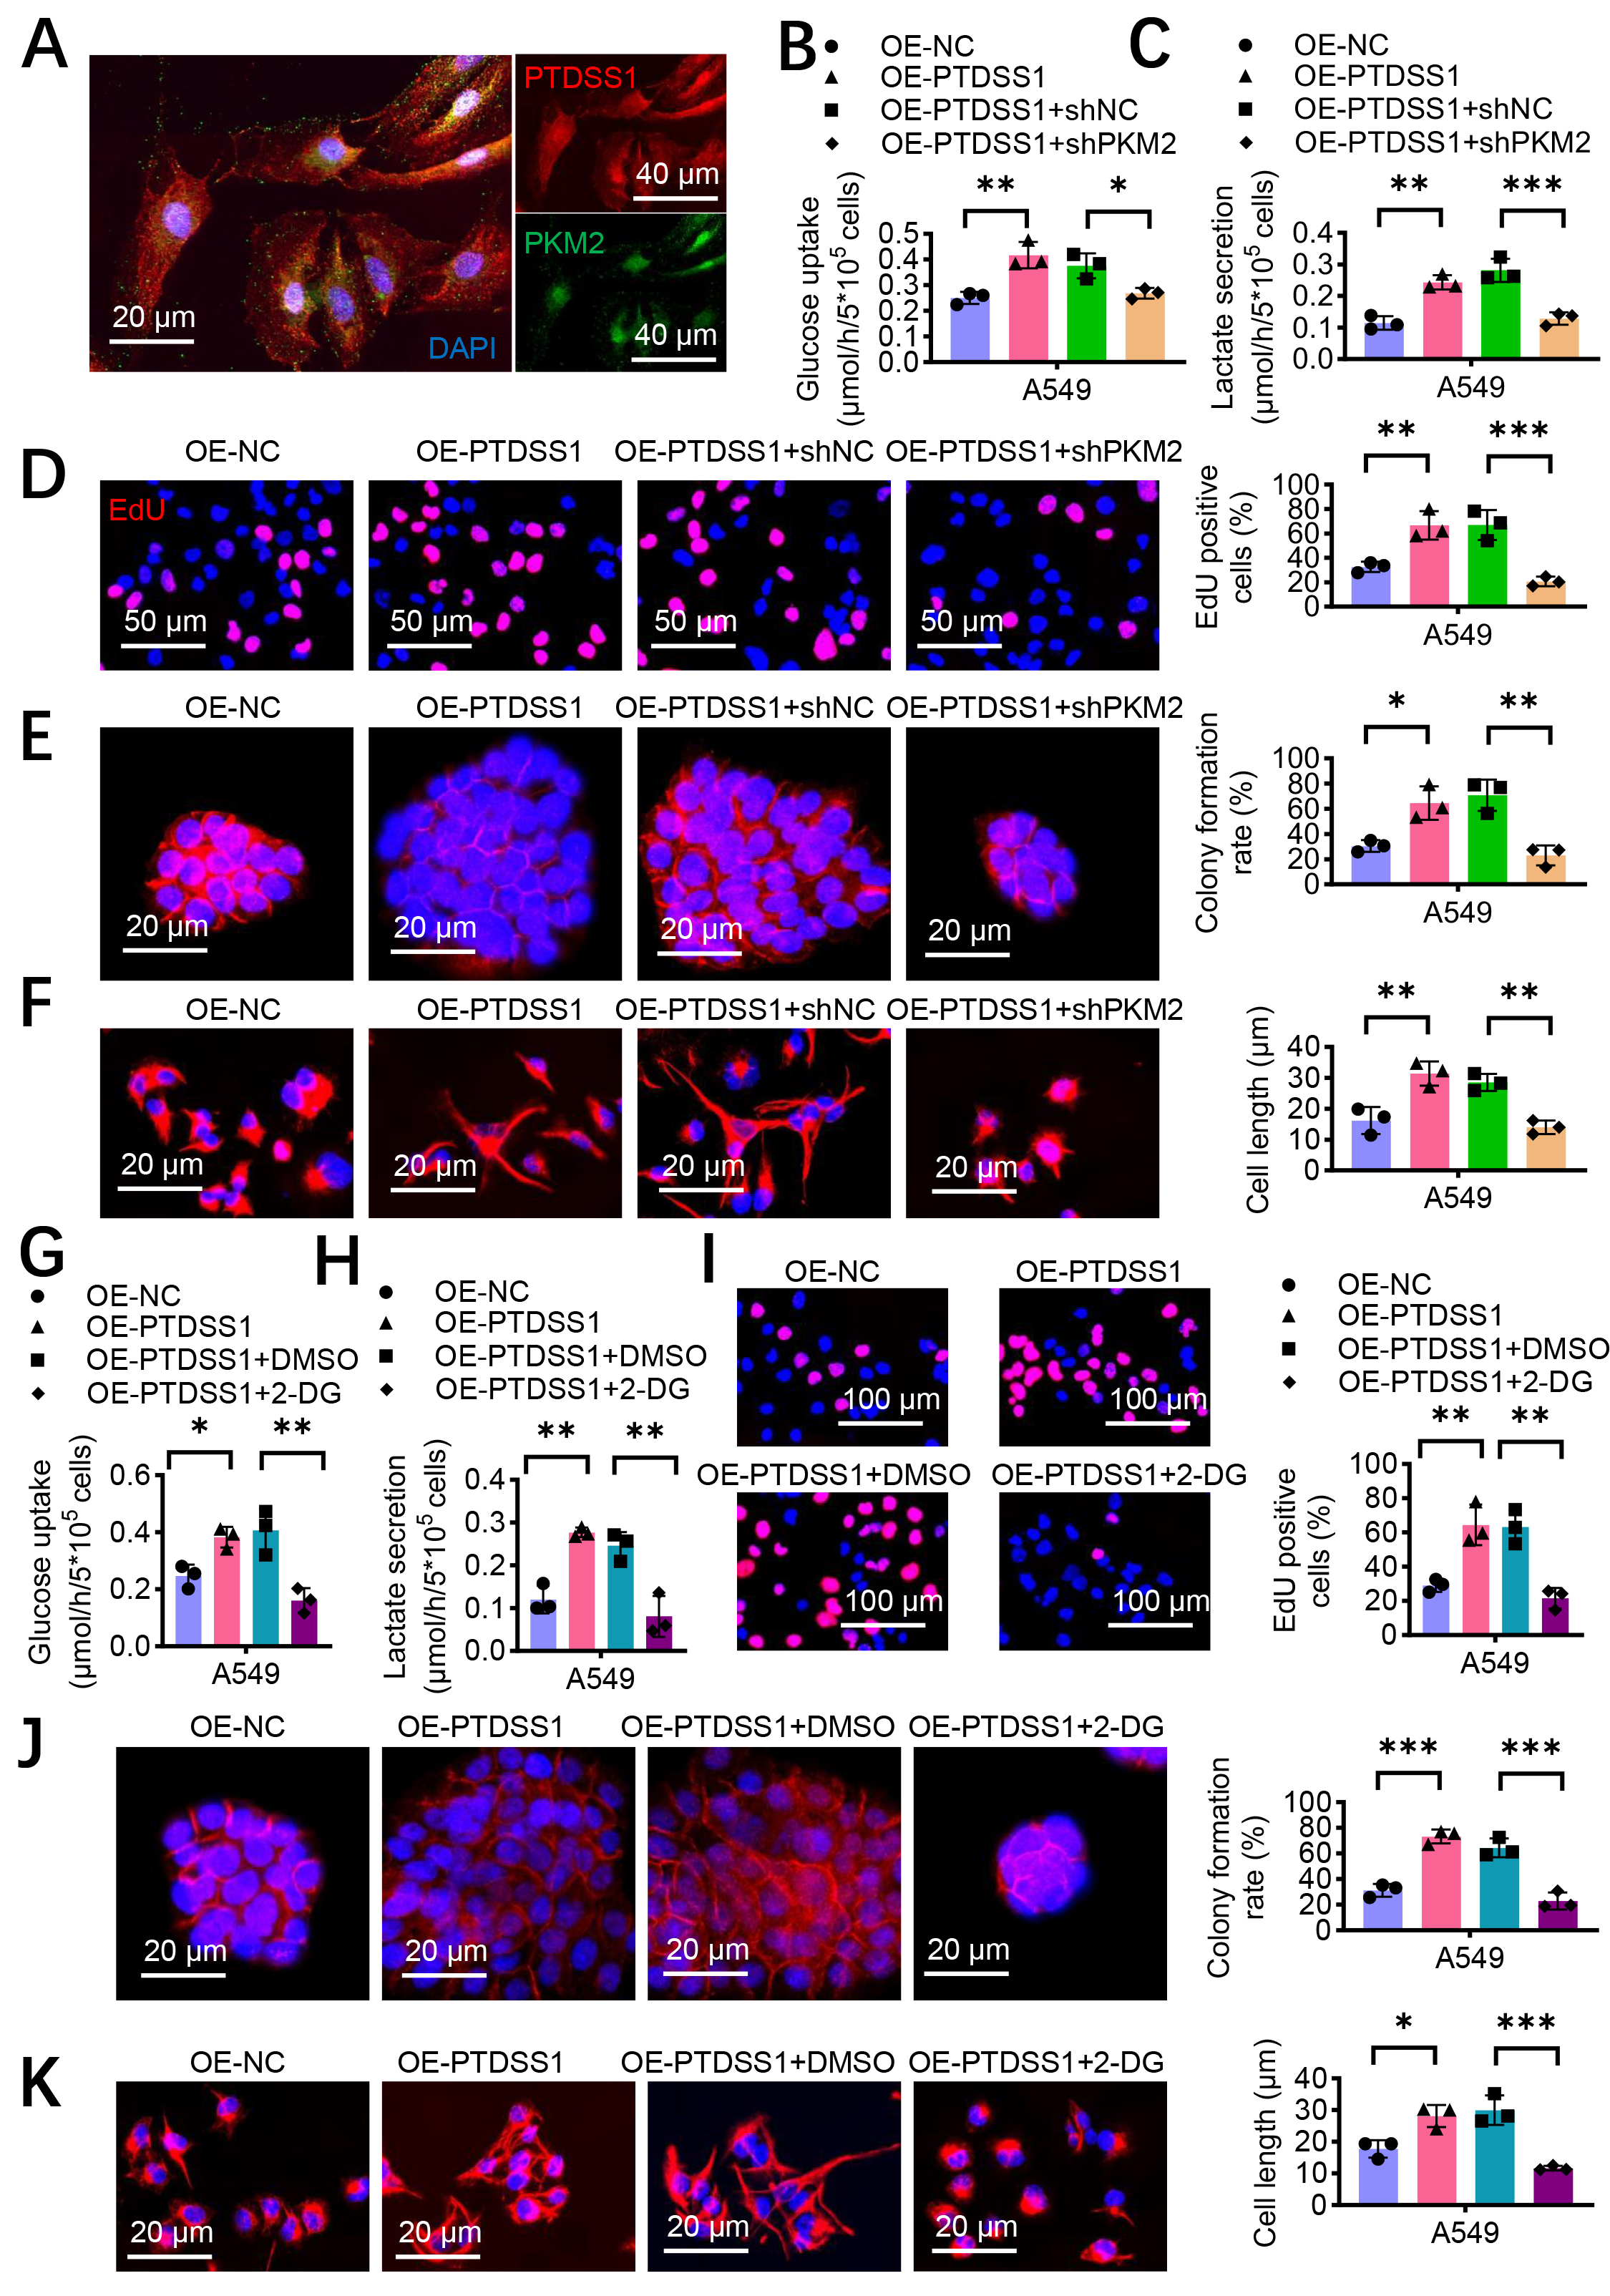 Fig. 5.
PTDSS1 accelerates glycolysis through PKM2. (A) Representative
images of PTDSS1 and PKM2 co-localization in A549 cells. Scale bar: 20 um (left); scale bar: 40 um (right)
. (B) Silencing PKM2
reduces the promoting effect of PTDSS1 on glucose uptake in A549 cells. (C)
Silencing PKM2 reduces the promoting effect of PTDSS1 on lactate secretion in
A549 cells. (D) EdU assay examining proliferation capacity in A549 cells with
different treatments. Scale bar: 50 µm. (E) Colony formation assay evaluating proliferation
capacity in A549 cells with different treatments. Scale bar: 20 µm. (F) Detection of cytoskeletal
changes in A549 cells with different treatments. Scale bar: 20 µm. (G) Glycolysis inhibitor 2-DG
treatment inhibits the promoting effect of PTDSS1 on glucose uptake in A549
cells. (H) Glycolysis inhibitor 2-DG treatment inhibits the promoting effect of
PTDSS1 on lactate secretion in A549 cells. (I) EdU assay evaluating proliferation
capacity in A549 cells with different treatments. Scale bar: 100 µm. (J) Colony formation assay
examining proliferation capacity in A549 cells with different treatments. Scale bar: 20 µm. (K)
Detection of cytoskeletal changes in A549 cells with different treatments. Scale bar: 20 µm. Data
were presented as means
Mitotracker staining showed significant co-localization of PTDSS1 with the
mitochondria (Fig. 6A). The TUNEL assays revealed that PTDSS1 overexpression
reduced cisplatin-induced apoptosis in the A549 and NCI-H1299 cells compared with
control treatment (Fig. 6B), suggesting that PTDSS1 enhances apoptosis resistance
through mitochondrial function regulation. A key marker of the
mitochondrion-mediated apoptosis pathway is the release of cytochrome c (Cyt c)
from the mitochondria to the cytoplasm. Cytoplasmic and mitochondrial fractions
were separated, and the distribution of Cyt c after cisplatin treatment was
examined to confirm the effect of PTDSS1 on the mitochondrial apoptosis pathway.
The results showed that the PTDSS1 overexpression group had reduced Cyt c levels
in the cytoplasm while maintaining higher levels of Cyt c in the mitochondria
(Fig. 6C). This result indicated that PTDSS1 can prevent the release of Cyt c
from the mitochondria to the cytoplasm, thereby inhibiting the activation of the
mitochondrion-dependent apoptosis pathway. Considering PTDSS1’s role in promoting
glycolysis, the relationship between glycolysis and PTDSS1-maintained
mitochondrial homeostasis was further explored. By treating PTDSS1-overexpressing
A549 cells with 2-DG, PTDSS1’s protective effect against cisplatin-induced
apoptosis was attenuated (Fig. 6D). The TUNEL staining showed that the apoptosis
rate in the 2-DG treatment group (OE-PTDSS1 + 2-DG) was higher than that in the
control group. This result indicated that PTDSS1 inhibits lung cancer cell
apoptosis by promoting glycolysis. The analysis of JC-1 fluorescent probe found
that PTDSS1 overexpression could maintain mitochondrial membrane potential in
A549 cells after cisplatin treatment, manifested as enhanced red fluorescence
(J-aggregates) and reduced green fluorescence (J-monomers). Meanwhile, 2-DG
treatment reversed PTDSS1’s protective effect, resulting in an increase in JC-1
monomer/aggregate ratio (Fig. 6E), indicating decreased mitochondrial membrane
potential and impaired mitochondrial function. This result further confirmed that
PTDSS1 maintains mitochondrial functional homeostasis by promoting glycolysis.
The expression levels of factors related to mitochondrial biogenesis and dynamics
were examined to explore the molecular mechanisms by which PTDSS1 maintains
mitochondrial homeostasis. RT-qPCR showed that PTDSS1 overexpression upregulated
the mitochondrial biogenesis regulator PGC-1
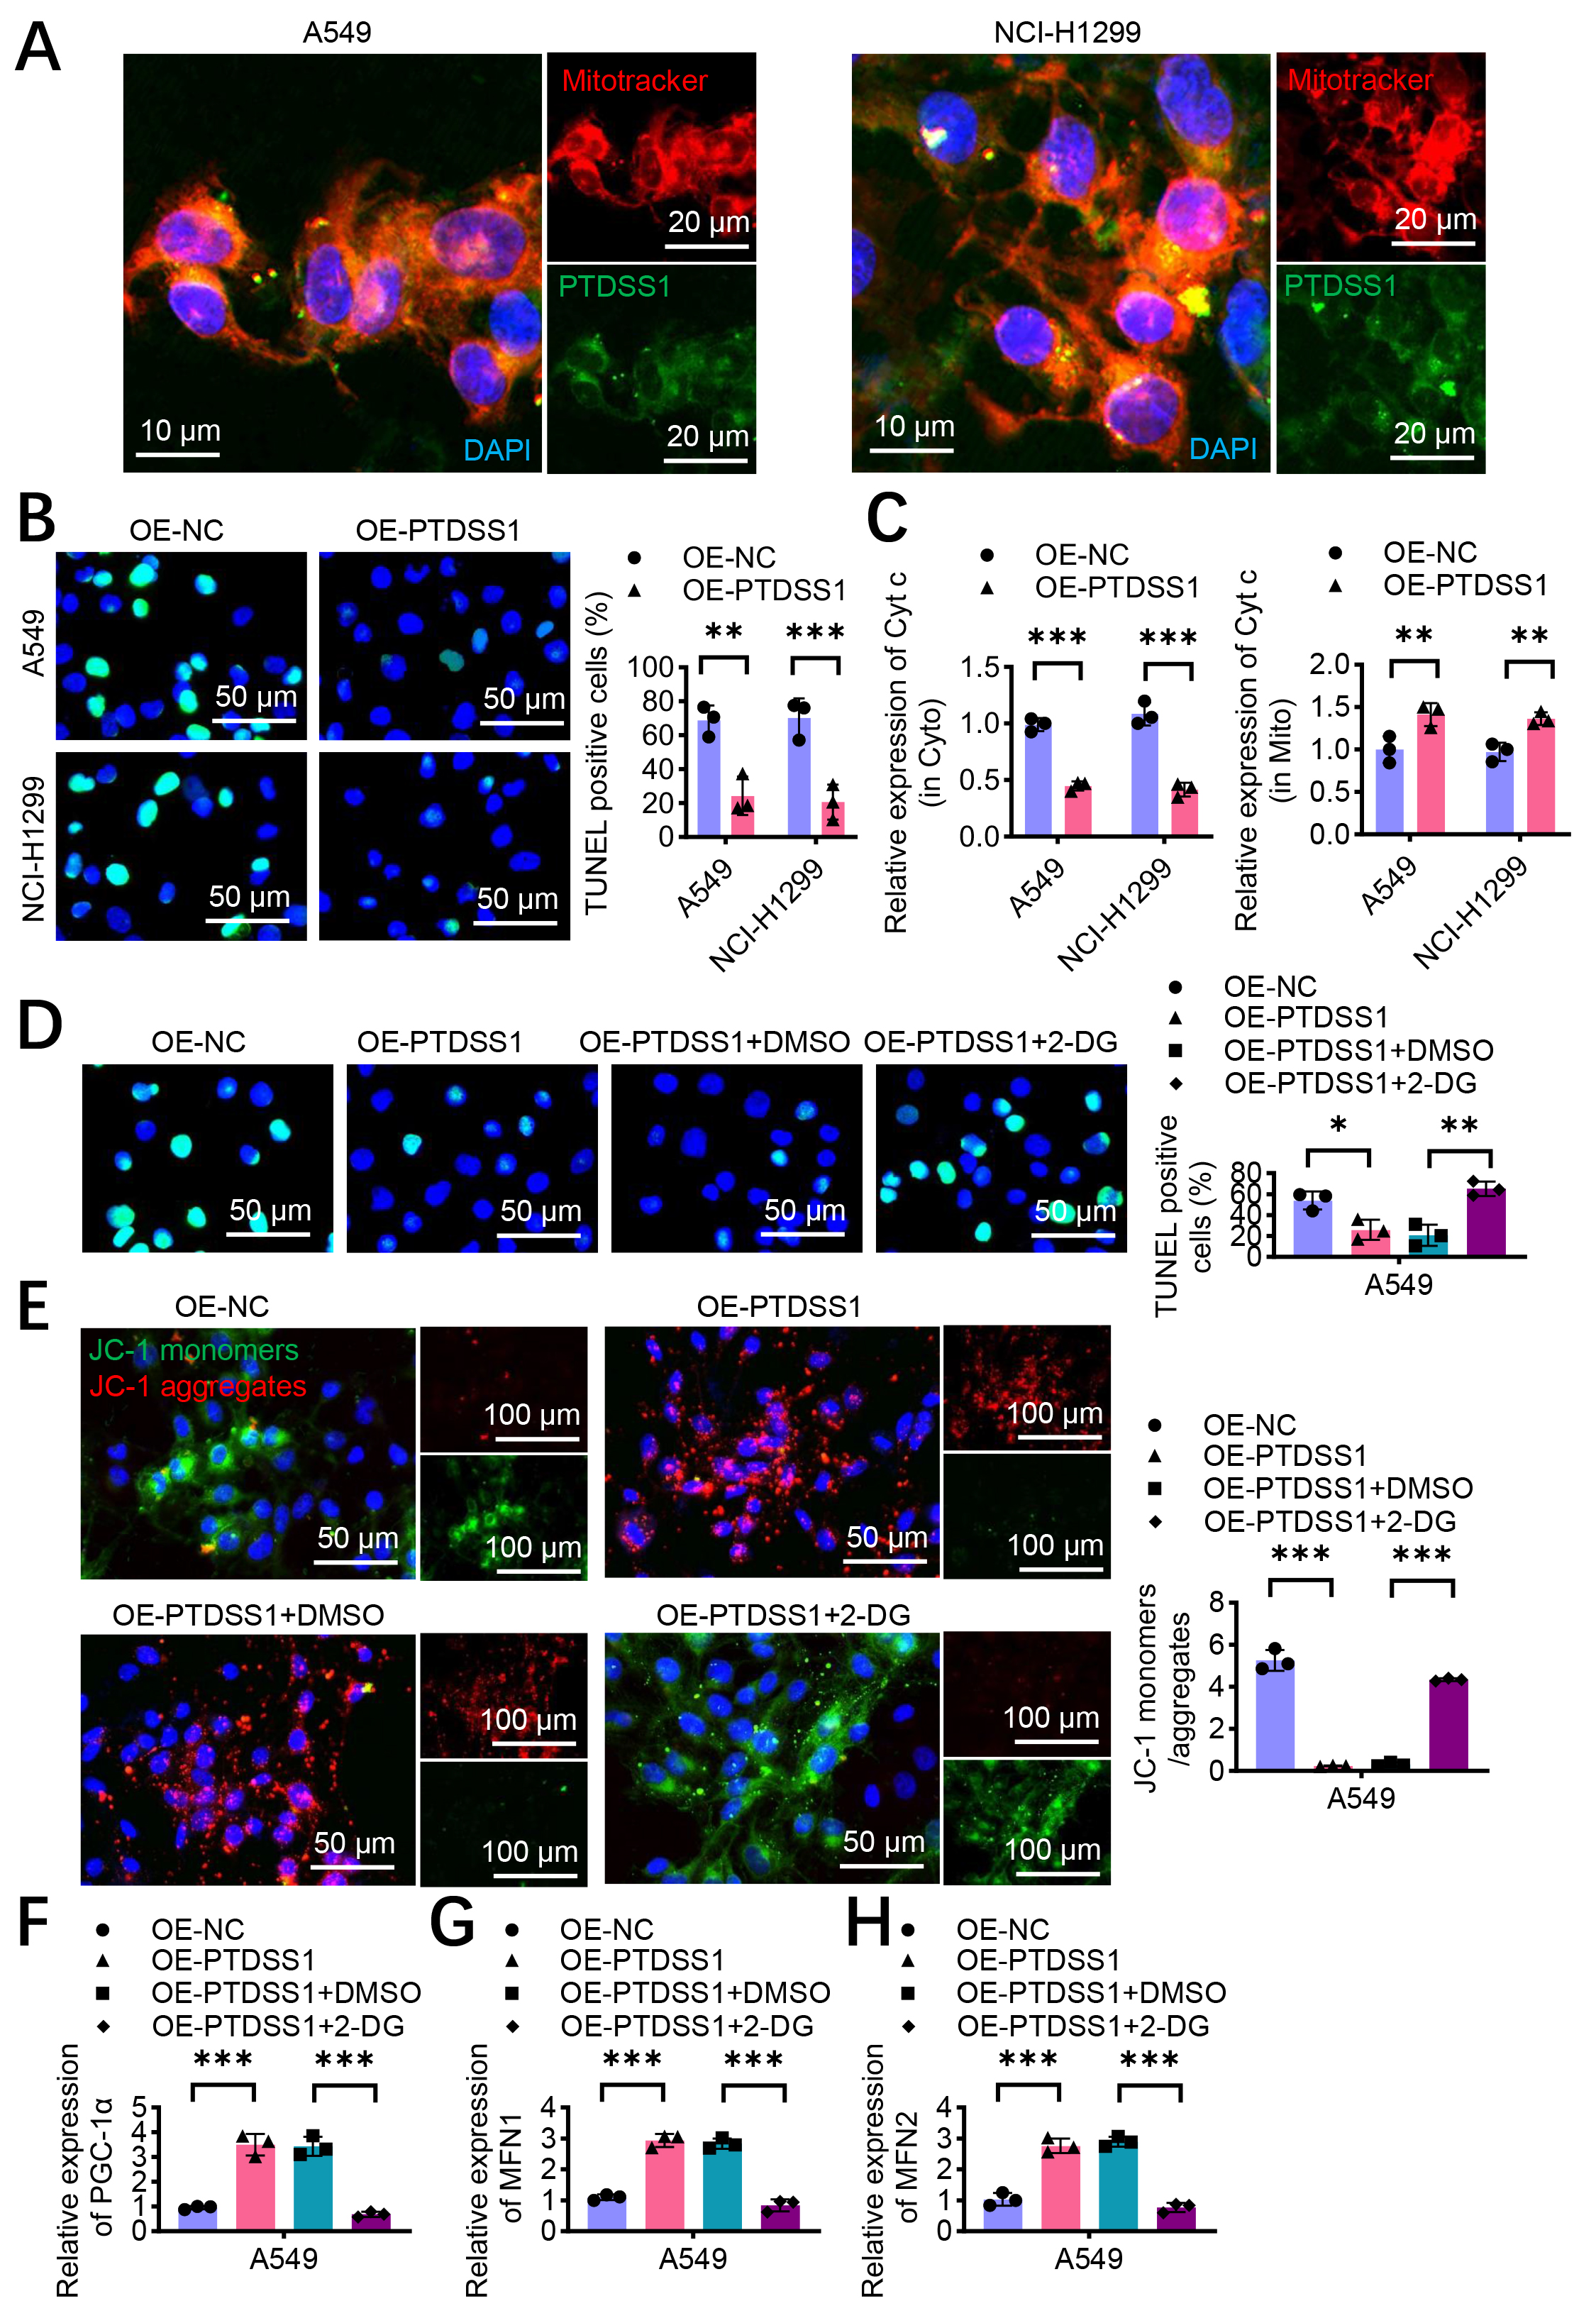 Fig. 6.
PTDSS1 maintains mitochondrial homeostasis and inhibits
oxidative phosphorylation and apoptosis in lung cancer cells. (A)
Immunofluorescence co-localization analysis of PTDSS1 and mitochondria in A549
and NCI-H1299 cells. Cells were stained with MitoTracker Red (mitochondrial
marker, red fluorescence) and anti-PTDSS1 antibody (green fluorescence), with
DAPI for nuclear counterstaining (blue fluorescence). Scale bar: 10 um (left); scale bar: 20 um (right). (B)
Terminal deoxynucleotidyl transferase dUTP nick end labeling (TUNEL) analysis of
apoptosis in A549 and NCI-H1299 cells after cisplatin treatment (10 µM, 24
hours). Scale bar: 50 µm. (C) PTDSS1 inhibits cytoplasmic Cyt c expression, maintains mitochondrial
Cyt c expression, and suppresses oxidative phosphorylation (cisplatin treatment,
10 µM, 24 hours). (D) TUNEL assay examining apoptosis in A549 cells with
different treatments. Scale bar: 50 µm. (E) JC-1 fluorescent probe detection of mitochondrial
membrane potential in A549 cells with different treatments. Scale bar: 50 µm (left); scale bar: 100 µm (right). (F–H) PCR analysis
of PGC-1
Immunohistochemistry of 25 paired lung cancer and adjacent normal tissues showed
enhanced PKM2 staining in cancer tissues (Fig. 7A,B). Correlation analysis was
performed between PTDSS1 and PKM2 protein expression levels in these tumor
samples. As shown in Fig. 7C, the expression levels of PTDSS1 and PKM2 in tumor
tissues were positively correlated (r2 = 0.234, p
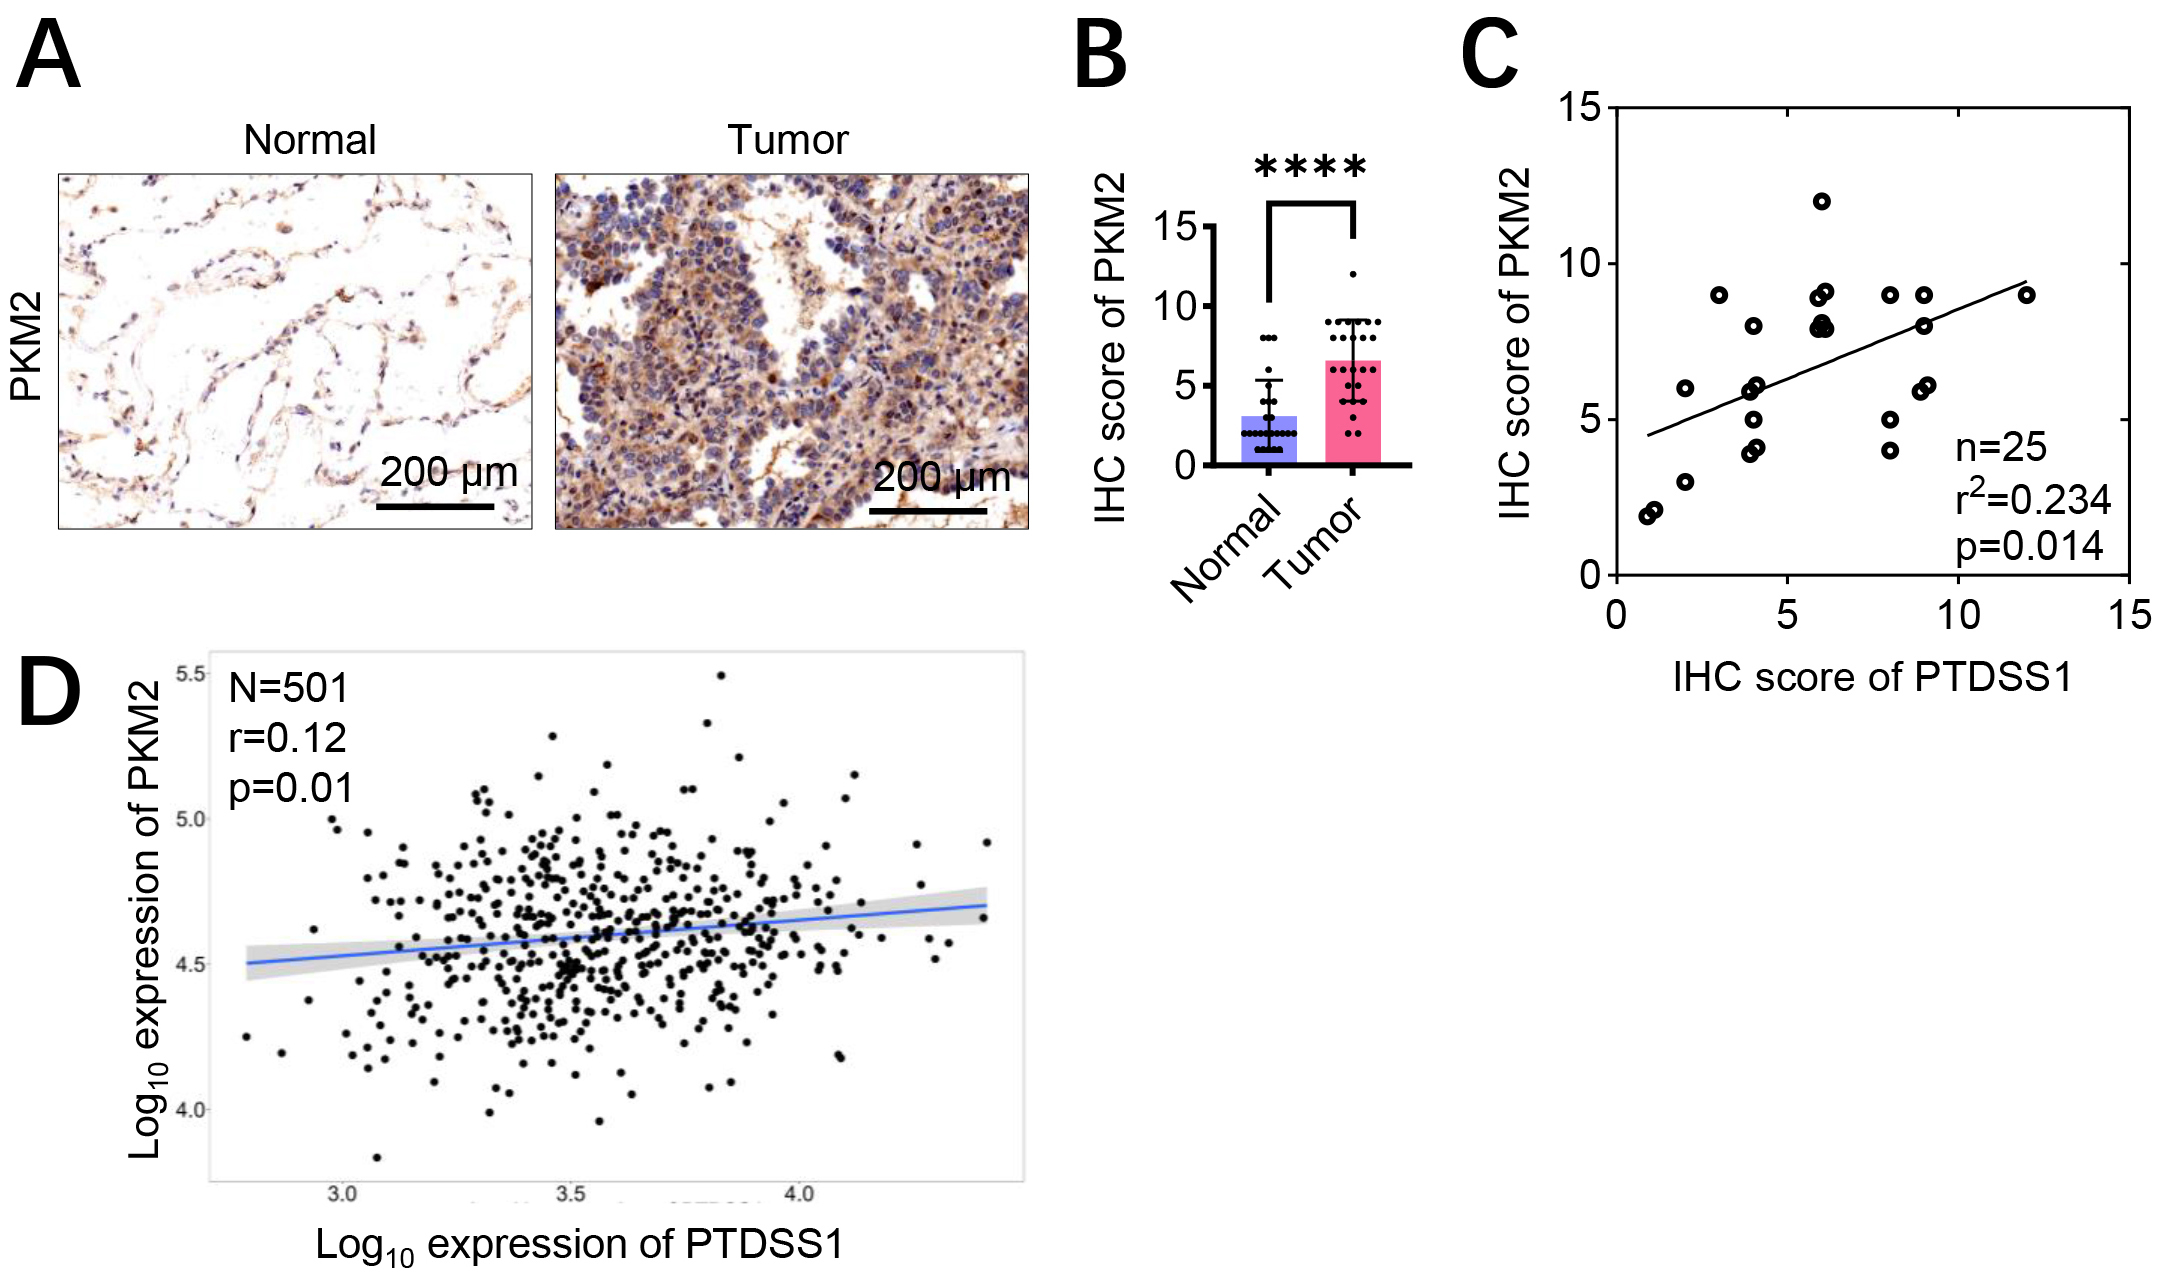 Fig. 7.
PTDSS1 exhibits co-expression correlation with glycolysis
pathway-related proteins. (A,B) Assessment of PKM2 protein levels in lung cancer
patient specimens by immunohistochemistry (IHC) staining. Scale bar: 200 µm (A). (C) Positive
correlation of PTDSS1 and PKM2 co-expression in tumor tissues from 25 patients
(Data points were jittered slightly (
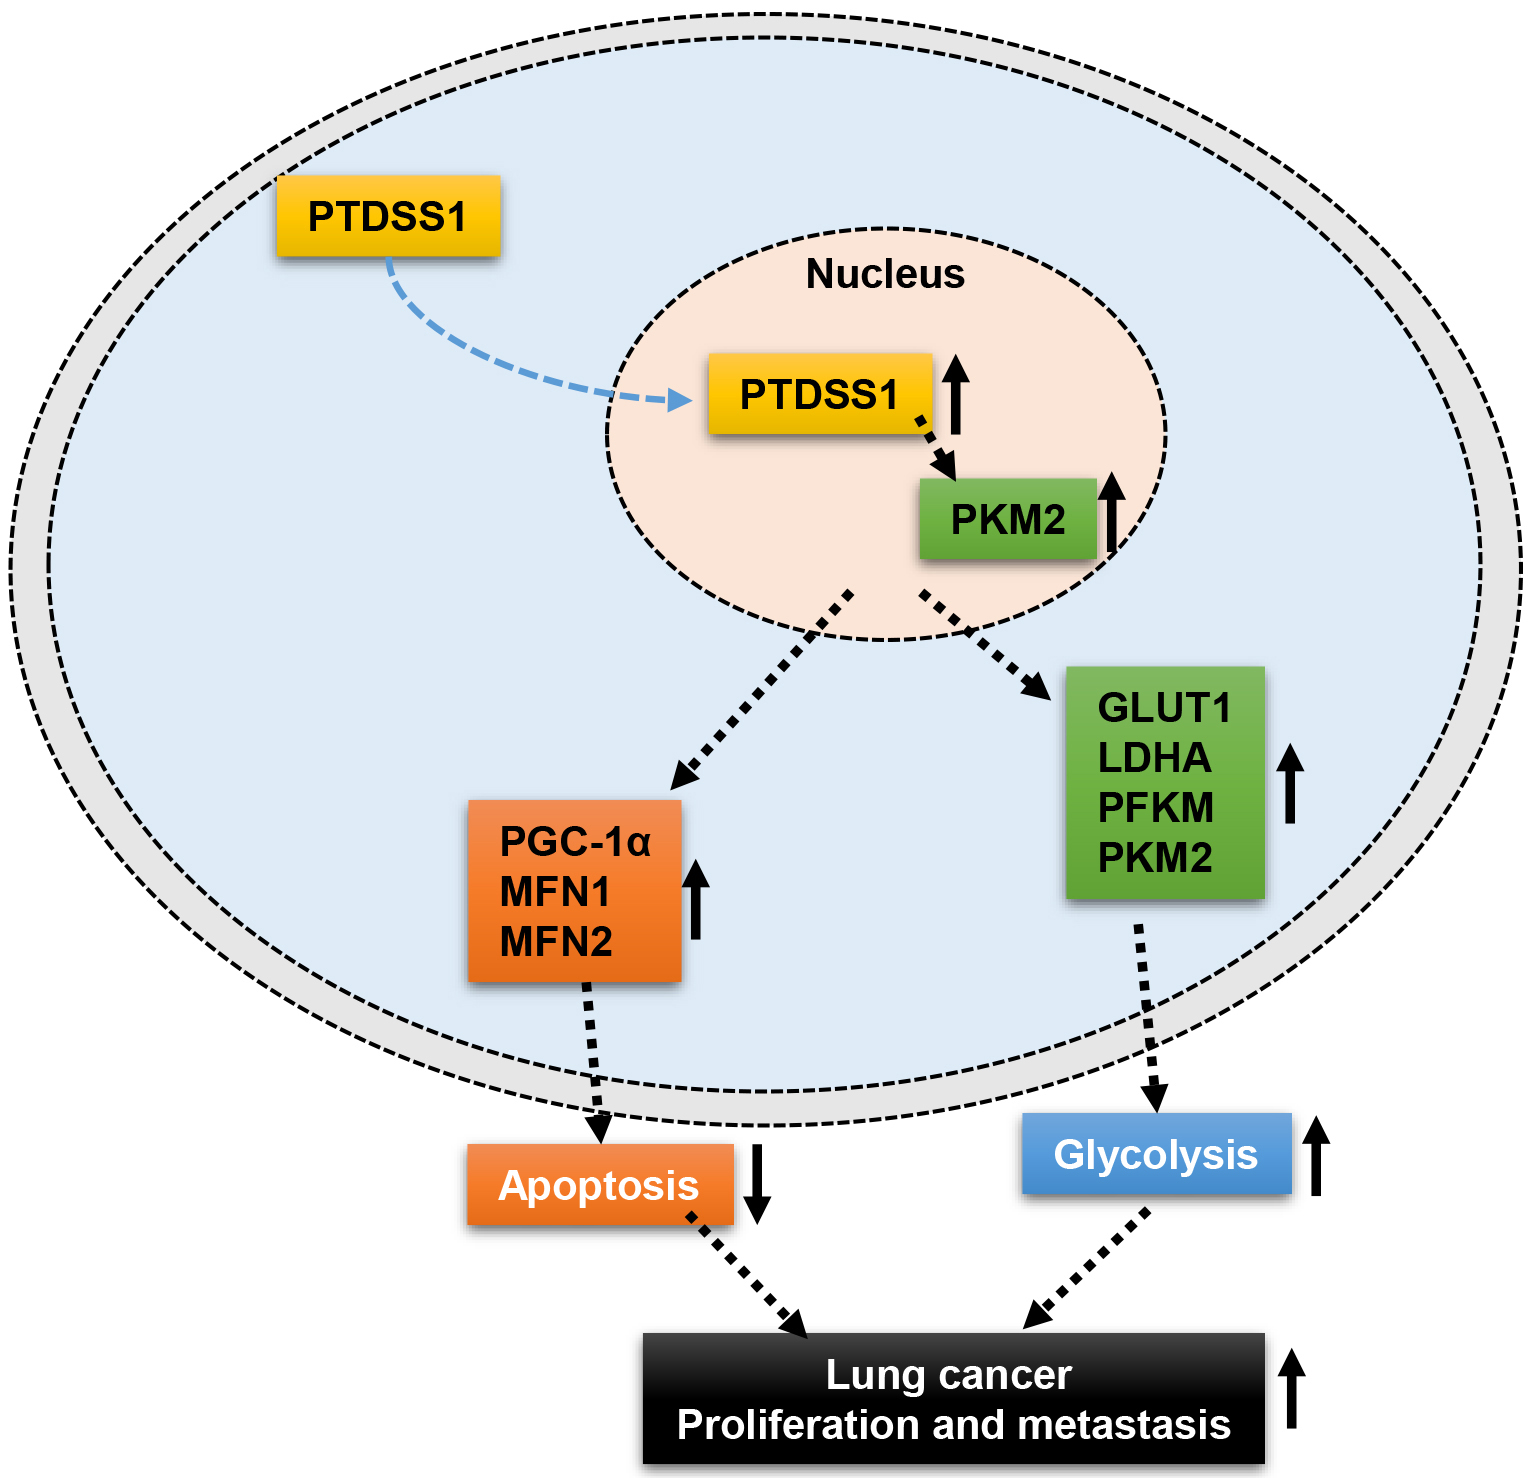 Fig. 8.
Schematic diagram illustrating the current hypothesis of the mechanism by which PTDSS1 may regulate mitochondrial homeostasis, drive glycolysis, and promote lung cancer progression. ↑, indicates upregulated expression or enhanced function; ↓, indicates downregulated function.
This study provides evidence that PTDSS1, a PS synthesis enzyme, correlates with malignant progression in lung cancer and shows associations with altered cellular metabolism. While PTDSS1 has been traditionally studied for its role in membrane phospholipid synthesis [10], the findings of the present study suggest potential connections to metabolic regulation in lung cancer, expanding the functional scope of this enzyme beyond its canonical lipid biosynthetic role. The results demonstrated that PTDSS1 upregulation in lung cancer tissues correlates with enhanced cellular proliferation and metabolic alterations, particularly increased glycolytic activity. This observation aligns with emerging evidence highlighting the multifaceted roles of lipid metabolism enzymes in tumor progression [8].
Research indicates that PTDSS1 participates in multiple biological processes, including cell membrane assembly, apoptosis, immune regulation, and neural development [26]. PTDSS1 plays a key role in cell membrane assembly by catalyzing the conversion of PS to phosphatidylcholine (PC), an essential component of cell membranes [27]. Studies have shown that PTDSS1 deficiency or dysfunction can lead to abnormal cell membrane assembly, thereby affecting cellular function. Additionally, PTDSS1 plays an important role in the apoptosis process [10]. Apoptosis is a normal mode of cell death, and PTDSS1 participates in apoptotic signal transduction by regulating PS content on the cell membrane. Research has found that PTDSS1 deficiency can lead to abnormal transmission of apoptotic signals, thereby affecting cell survival and death decisions. PTDSS1 also participates in immune regulation processes [28]. Studies have shown that PTDSS1 plays an important role in lymphocyte activation and differentiation. PTDSS1 deficiency can lead to immune cell dysfunction, potentially causing immune system dysregulation and increasing the risk of autoimmune diseases.
Tumor metabolic reprogramming, particularly the Warburg effect, is one of the critical characteristics of tumor cells [29, 30, 31]. PTDSS1 may be a key molecule regulating this metabolic feature. The present study revealed that nuclear PTDSS1 plays a more crucial role in promoting lung cancer progression through glycolysis, providing a new perspective on the classical understanding of PTDSS1 function. Traditional views hold that PTDSS1 is primarily localized to the endoplasmic reticulum membrane and participates in membrane phospholipid synthesis, whereas the present study indicated that its nuclear localization may possess novel functions related to transcriptional regulation. These findings suggest a potential functional relationship between PTDSS1 and PKM2 in lung cancer progression, though the precise mechanistic basis of this interaction requires further investigation. While PKM2 silencing attenuated PTDSS1-mediated oncogenic effects, it could reflect general glycolytic inhibition rather than PKM2-specific mechanisms. The observed correlation between PTDSS1 and PKM2 expression in patient tissues and TCGA datasets, combined with co-localization studies demonstrating spatial proximity, supports potential molecular interaction. However, a definitive proof of direct binding and determination of regulatory directionality awaits future Co-immunoprecipitation (Co-IP) or Glutathione S-transferase (GST) pull-down experiments. Importantly, the relationship between PTDSS1 and PKM2 may be more complex than simple unidirectional regulation. Given PKM2’s role as an allosteric target of serine and PTDSS1’s involvement in serine-dependent phospholipid synthesis, both proteins may be co-regulated by metabolic factors rather than exhibiting direct regulatory control. Furthermore, the possibility of reverse regulation, where PKM2 influences PTDSS1 activity, cannot be excluded on the basis of current evidence. These mechanistic uncertainties highlight the correlative rather than causative nature of the present findings and underscore the need for comprehensive functional studies to establish definitive molecular relationships.
Another significant finding of this study is that PTDSS1 maintains mitochondrial
homeostasis, inhibiting oxidative phosphorylation and apoptosis in lung cancer
cells [24]. As the center of cellular energy metabolism and apoptotic regulation,
mitochondrial dysfunction is closely associated with the development of various
tumors [32, 33]. Tumor cells typically maintain sufficient mitochondrial function
and relatively low levels of oxidative phosphorylation, allowing them to adjust
their metabolic patterns according to microenvironmental changes [34, 35, 36]. By
maintaining mitochondrial homeostasis, PTDSS1 may provide tumor cells with this
metabolic plasticity, conferring survival advantages in different
microenvironments. PTDSS1 overexpression is predicted to significantly alter
cellular phospholipid composition by increasing PtdSer synthesis from PtdEtn and
PtdCho substrates. Such compositional changes could profoundly impact membrane
biophysical properties, including fluidity, curvature, and protein–lipid
interactions, with particular importance for mitochondrial function where precise
lipid composition is essential for optimal respiratory chain activity. The
observed reduction in OCR following PTDSS1 overexpression may result from altered
mitochondrial membrane composition that impairs respiratory chain efficiency
rather than, or in addition to, metabolic reprogramming toward glycolysis. The
compensatory upregulation of PGC1-
Recent studies have found that PTDSS1 plays important roles in numerous tumors. Research has shown that inhibiting PTDSS1 expression can suppress lymphoma growth [8]. PS exposed on the cell surface has been targeted by the monoclonal antibody bavituximab in multiple ongoing clinical trials [37]. Studies have demonstrated that targeting PS in breast cancer can significantly inhibit tumor growth [38], indicating that while targeting PTDSS1’s end product PS can inhibit tumor growth, PTDSS1 itself may also have potential as a therapeutic target. Therefore, identifying the role of targeting the PS-synthesizing enzyme PTDSS1 may have potential significance for tumor therapy. The finding that nuclear-targeted PTDSS1 exhibits enhanced oncogenic activity compared with native PTDSS1 distribution raises fundamental questions about the mechanistic basis of this compartment-specific function. This enhanced effect could result from several non-mutually exclusive mechanisms: (1) local nuclear PtdSer synthesis that modulates nuclear membrane composition, chromatin organization, or lipid-dependent nuclear signaling pathways; (2) catalytic activity-independent functions, where PTDSS1 serves as a scaffolding protein or direct regulator of nuclear transcriptional machinery; or (3) influence on nuclear-cytoplasmic metabolite gradients that affect gene expression programs. The distinction between these mechanisms has profound implications for understanding PTDSS1’s role in cancer biology. Currently demonstrated in A549 cells only, this nuclear compartmentalization phenotype requires validation across multiple lung cancer cell lines to establish generalizability. The mechanistic basis of enhanced nuclear PTDSS1 activity represents one of the most important unresolved questions from this study and a high-priority direction for future investigation.
This study has several important limitations that must be acknowledged. The findings primarily demonstrated correlations rather than definitive causal relationships between PTDSS1 and PKM2 because the precise molecular mechanism underlying their interaction remains unclear, and the observed effects could reflect direct regulatory interactions or indirect consequences of altered cellular metabolism given PKM2’s multifaceted regulatory roles. Additionally, the experimental design has notable gaps, including lack of direct evidence for physical PTDSS1-PKM2 interaction, uncertainty whether effects depend on PTDSS1’s enzymatic activity or represent moonlighting functions, and 2-DG experiments lacking proper controls in non-overexpressing cells that may confound interpretation of glycolysis-specific versus general cytotoxic effects. Furthermore, expected phospholipid class distribution changes following PTDSS1 overexpression were not examined, and these changes could impact membrane composition and mitochondrial function through biophysical rather than transcriptional mechanisms. The reliance on cell line models may not fully recapitulate tumor heterogeneity and microenvironmental complexity despite including xenograft experiments and patient tissue correlation studies. The subcellular localization findings may be confounded by PTDSS1’s known ER localization, particularly at mitochondrion-associated membranes, without appropriate ER marker controls. Future investigations should prioritize direct protein interaction studies, enzymatic versus non-enzymatic function assessment, comprehensive phospholipid profiling, and bidirectional functional studies to establish causal rather than associative relationships.
This study establishes PTDSS1 as a critical oncogenic driver in lung cancer
through a previously uncharacterized dual regulatory mechanism. PTDSS1
overexpression correlates with poor clinical outcomes and drives malignant
progression by orchestrating metabolic reprogramming via PKM2-mediated glycolytic
enhancement while simultaneously maintaining mitochondrial homeostasis through
upregulation of PGC-1
The datasets used and analyzed during the current study are available from the corresponding author on reasonable request.
YL: Investigation, Data curation. HW: Formal analysis, Data curation. QW: Data curation. YH: Data curation. XP: Data curation. YL: Validation, Project administration. HW: Writing – original draft, Project administration. YL: Writing – review & editing. All authors contributed to editorial changes in the manuscript. All authors read and approved the final manuscript. All authors have participated sufficiently in the work and agreed to be accountable for all aspects of the work.
Human clinical samples: This study involving human participants was conducted in accordance with the Declaration of Helsinki. This study was approved by the hospital Ethics Committee of The Eighth Affiliated Hospital, Southern Medical University (The First People’s Hospital of Shunde Foshan) (Approval No. 20250106-116). All patients voluntarily participated in the study and signed informed consent forms. Animal experiments: All animal experiments were conducted in accordance with the National Guidelines for Welfare and Ethics of Experimental Animals and the Guidelines for the Humane Treatment of Experimental Animals of China. The animal experiments met the ethical requirements and were approved by the Ethics Committee of The Third Affiliated Hospital of Zunyi Medical University (Approval No. (2023)-2-295).
Not applicable.
This work was supported by the Natural Science Foundation of Guizhou Province (Grant No. ZK[2023]486).
The authors declare no conflict of interest.
Supplementary material associated with this article can be found, in the online version, at https://doi.org/10.31083/FBL45020.
References
Publisher’s Note: IMR Press stays neutral with regard to jurisdictional claims in published maps and institutional affiliations.