


 , Li Zhou 1,†, Suyu Wang 1, Di Yao 1, Jun Ma 1, Xiaoyan Hu 1, Wencheng Zhang 1, Mengyuan Tao 1, Min Wang 1,*
 , Weiping Lu 1,*
1 Department of Endocrinology and Metabolism, The Affiliated Huai’an No.1 People’s Hospital of Nanjing Medical University, 223300 Huai’an, Jiangsu, China
†These authors contributed equally.
Abstract
Thyroid cancer progression involves cell-state plasticity in the form of epithelial–mesenchymal transition (EMT), and defects in DNA damage response (DDR), both of which are linked to metastasis and treatment failure. The role of pituitary tumor transforming 1 interacting protein (PTTG1IP/PBF) in these processes remains insufficiently defined.
Transcriptomes from The Cancer Genome Atlas (TCGA) and Gene Expression Omnibus (GEO) (GSE138042) datasets were analyzed to prioritize EMT-associated genes and to assess correlations with EMT regulators, junction markers, and matrix metalloproteinases. PTTG1IP expression was measured by quantitative real‐time reverse transcriptase PCR (qRT-PCR) in thyroid cancer cell lines and normal thyroid HTori-3 cells. Cell viability (Cell Counting Kit-8 (CCK-8)) and apoptosis (terminal deoxynucleotidyl transferase dUTP nick end labeling, TUNEL) assays were performed following shRNA knockdown of PTTG1IP. The PTTG1IP–CTTN association was examined by co-immunoprecipitation and immunofluorescence. Chromatin immunoprecipitation (ChIP)-qPCR was used to investigate PTTG1IP occupancy at DDR gene promoters. Radiosensitivity was evaluated by loss of cell viability, flow-cytometric cell death, and phosphorylated H2AX (p-H2AX) immunofluorescence after irradiation.
PTTG1IP emerged as a top EMT-linked candidate across cohorts, with elevated mRNA and protein expression in thyroid cancers and cell lines. Silencing of PTTG1IP reduced viability and increased apoptosis in human thyroid cancer cell lines TPC-1 and KTC-1. PTTG1IP expression aligned with canonical EMT transcription factors and with DDR genes. Biochemically, PTTG1IP formed an endogenous complex with cortactin (CTTN) and co-localized in cancer cells. Mechanistically, PTTG1IP occupied the BRCA1, BRCA2, RAD51, RAD51-associated protein 1 (RAD51AP1), and ATM serine/threonine kinase (ATM) promoters. Functionally, depletion of PTTG1IP led to increased radiation-induced DNA damage and cell death, resulting in a greater post-irradiation loss of viability.
PTTG1IP is a multifunctional node in thyroid cancer, coupling cytoskeletal programs with DDR control, and supporting cell growth and treatment tolerance. The targeting of PTTG1IP, particularly to enhance radiosensitivity, may provide a novel therapeutic strategy for thyroid cancer.
Keywords
- epithelial-mesenchymal transition (EMT)
- DNA damage response
- thyroid cancer
- PTTG1IP
- cortactin (CTTN)
- radiosensitivity
Epithelial-mesenchymal transition (EMT) is a pivotal developmental program exploited by tumor cells and widely implicated in the progression of thyroid cancer [1, 2]. During EMT, epithelial junctions and apico-basal polarity are dismantled, and mesenchymal traits that support cell motility and invasion emerge [3]. This transition is accompanied by a characteristic marker pattern (loss of E-cadherin, and induction of N-cadherin and vimentin) and is coordinated by EMT-activating transcription factors such as snail family transcriptional repressor 1/2 (SNAI1/2), zinc finger E-box-binding homeobox 1/2 (ZEB1/2), and twist family bHLH transcription factor 1/2 (TWIST1/2) that suppress epithelial programs and induce mesenchymal gene expression [2]. In addition to facilitating dissemination from the primary site, EMT promotes resistance to apoptosis, immune evasion, and decreased responsiveness to therapy, which collectively lead to unfavorable outcomes in thyroid cancer [4, 5]. Identifying the regulators for EMT therefore presents an opportunity to constrain cancer dissemination and improve therapeutic response.
Among the candidates implicated in oncogenesis, Pituitary Tumor Transforming 1 Interacting Protein (PTTG1IP, also known as PBF) has attracted increasing attention [6, 7, 8, 9, 10]. Dysregulated PTTG1IP expression is associated with the progression of thyroid cancer [11, 12, 13], and elevated levels have been reported in tumor tissue, suggesting involvement in tumor development and prognosis [6, 7]. PTTG1IP has been linked to proliferative signaling, suppression of apoptosis, enhanced motility/invasion, and pro-angiogenic activity, highlighting its multifaceted impact on tumor biology [6, 8, 14]. However, it remains unclear how PTTG1IP connects these phenotypes in thyroid cancer, and whether it coordinates broader stress-response pathways.
To address these knowledge gaps, we integrated public cohorts to prioritize EMT-associated genes in thyroid cancer and identified PTTG1IP as a top, cross-dataset candidate. We found that PTTG1IP is upregulated in thyroid cancer at the transcript and protein levels, and that its depletion limits growth and increases apoptosis in thyroid cancer cells. Mechanistically, PTTG1IP associates with cortactin (CTTN), a cytoskeletal regulator linked to cell migration, to form a connection with motility-related programs. In addition to its association with EMT, we observed that PTTG1IP aligns with DNA damage response (DDR) networks. The expression of PTTG1IP correlates with that of DDR genes, PTTG1IP knockdown reduces DDR gene expression, and PTTG1IP binds to the promoters of key DDR components. Given that TP53 alterations commonly disrupt DDR in thyroid cancer [15, 16], these observations suggest that PTTG1IP may couple cytoskeletal remodeling with genomic-stress control. Consistent with this model, silencing of PTTG1IP increases radiation-induced DNA damage and cell death, thus identifying it as a potential therapeutic node for radiosensitization. Collectively, our findings suggest that PTTG1IP may be a biomarker and candidate target with relevance to both tumor growth/survival and treatment responsiveness in thyroid cancer.
Transcriptomic data for thyroid cancer were obtained from The Cancer Genome
Atlas (TCGA) via the Genomic Data Commons (GDC) portal, and from the Gene
Expression Omnibus (GEO) database (GSE138042, n = 95). Raw count data were
normalized using the transcripts per million (TPM) method. EMT scores for each
sample were calculated based on the expression levels of a predefined set of
epithelial and mesenchymal marker genes, as previously described [16]. Pearson
correlation analysis was performed between the expression levels of all genes and
the EMT scores across samples. Genes with correlation coefficients greater than
0.8 (R
The thyroid cancer cell lines used in this study (KTC-1, BCPAP, BHT-101) were purchased from the Cell Bank of the Chinese Academy of Sciences, Shanghai. TPC-1 cell line was obtained from Haixing Biosciences Co., Ltd. The human normal thyroid epithelial cell line (HTori-3) was purchasded from Shanghai Enzyme-linked Biotechnology Co., Ltd. The cancer cell and HTori-3 cells were maintained in RPMI-1640 (11875093, Gibco, Waltham, MA, USA) or DMEM (11965092, Gibco, Waltham, MA, USA) supplemented with 10% fetal bovine serum (SH30071.03, HyClone, Cytiva, Logan, UT, USA). Cultures were incubated at 37 °C in a humidified 5% CO2 atmosphere and passaged at 70–80% confluence using standard trypsinization. The cells were routinely confirmed as mycoplasma-negative and maintained with 1% penicillin–streptomycin (15140122, Gibco, Waltham, MA, USA). Antibiotics were omitted during transfection. All cell lines were validated by STR profiling.
For shRNA-mediated knockdown, cells were seeded 24 h before transfection to reach 40–60% confluence. Plasmid-encoded PTTG1IP shRNA (OriGene, Rockville, MD, USA) was introduced with Lipofectamine 3000 (L3000008, Invitrogen, Waltham, MA, USA) prepared in Opti-MEM (31985062, Gibco, Waltham, MA, USA) according to the manufacturer’s instructions. Medium was replaced with complete growth medium after 6–8 h, and cells were collected 3–5 days later for downstream assays.
Cells were seeded into 96-well plates at 2000 cells per well in 100 µL growth medium and cultured for 5 days. For each condition, 5 technical replicates were set up per experiment, with the experiments repeated independently three times. On the day of measurement, CCK-8 reagent (CK04-01, Dojindo Laboratories, Kumamoto, Japan) was added directly to the culture medium at 10% v/v (10 µL per well). After 60 min incubation at 37 °C, absorbance at 450 nm was recorded using a microplate reader. Blank wells containing medium plus CCK-8 (no cells) were used for background subtraction. Values were normalized to vehicle controls and reported as fold changes relative to the control.
Cells were washed with ice-cold PBS (ST476, Beyotime Biotechnology, Shanghai,
China) and lysed in RIPA buffer (P0013B, Beyotime Biotechnology, Shanghai, China)
freshly supplemented with a protease inhibitor cocktail (P1005, Beyotime
Biotechnology, Shanghai, China). Lysates were cleared (12,000
Total RNA was extracted with the QIAGEN Total RNA Purification Kit (74104, Qiagen, Hilden, Germany) and treated on-column with DNase I (79254, Qiagen, Hilden, Germany) to remove genomic DNA. RNA (500 ng per sample) was reverse-transcribed using the Vazyme Reverse Transcription Kit (R423-01, Vazyme Biotech, Nanjing, China) according to the manufacturer’s protocol. Quantitative PCR was performed with Vazyme SYBR Green reagent (Q712-02, Vazyme Biotech, Nanjing, China) in 10–20 µL reactions on a real-time cycler, using the following primer pairs: PTTG1IP: F-5′-GTCTGGACTACCCAGTTACAAGC-3′, R-5′-CGCCTCAAAGTTCACCCAA-3′; BRCA1: F-5′-GAAACCGTGCCAAAAGACTTC-3′, R-5′-CCAAGGTTAGAGAGTTGGACAC-3′; BRCA2: F-5′-CACCCACCCTTAGTTCTACTGT-3′, R-5′-CCAATGTGGTCTTTGCAGCTAT-3′; RAD51: F-5′-CAACCCATTTCACGGTTAGAGC-3′, R-5′-TTCTTTGGCGCATAGGCAACA-3′; RAD51D: F-5′-CCAGCACTCGGATTCTCCTG-3′, R-5′-TTGGCTGTCGGGAAGATTTGG-3′; RAD51AP1: F-5′-TGGTGGTGTTCAAGGGAAAAG-3′, R-5′-AGGTGCAAAGTCTGGTTCAGT-3′; FANCA: F-5′-GGCACACAGTATGTTCTCCCG-3′, R-5′-TTGTACGTGAAGATGCCACAC-3′; FANCI: F-5′-CCACCTTTGGTCTATCAGCTTC-3′, R-5′-CAACATCCAATAGCTCGTCACC-3′; POLD1: F-5′-ATCCAGAACTTCGACCTTCCG-3′, R-5′-ACGGCATTGAGCGTGTAGG-3′; GAPDH: F-5′-GGAGCGAGATCCCTCCAAAAT-3′, R-5′-GGCTGTTGTCATACTTCTCATGG-3′. Ct values were normalized to GAPDH, and relative expression was calculated using the 2-ΔΔCt method.
Cells were seeded onto glass coverslips and allowed to adhere overnight. After fixation with 4% paraformaldehyde for 20 min at room temperature, the cells were rinsed with PBS and permeabilized with 0.3% Triton X-100 in PBS for 10 min. Non-specific binding was blocked using 5% BSA for 1 h at room temperature. Samples were subsequently incubated overnight at 4 °C with primary antibodies: PTTG1IP (1:200, 12575-1-AP, Proteintech, Rosemont, IL, USA), CTTN (1:200, 11381-1-AP, Rosemont, IL, USA), and p-H2AX (1:200, 9718S, Cell Signaling Technology, Danvers, MA, USA). They were then washed with PBS and incubated with species-appropriate, fluorophore-conjugated secondary antibodies for 2 h at room temperature, followed by 4′,6-diamidino-2-phenylindole (DAPI) counterstaining for 10 min. Coverslips were mounted in anti-fade medium before imaging. Negative controls without primary antibody were included to assess background fluorescence.
To examine PTTG1IP occupancy at selected loci, ChIP was carried out with the Transcription Factor iDeal ChIP-seq Kit (Diagenode, Denville, NJ, USA) as recommended by the supplier. Cells were fixed in 4% paraformaldehyde for 10 min at room temperature, nuclei were isolated, and chromatin was sonicated into 200–500 bp fragments. Aliquots of sheared chromatin were incubated overnight at 4 °C with anti-PTTG1IP antibody or control immunoglobulin G (IgG). After sequential washes, immune complexes were eluted and cross-links reversed with proteinase K treatment. DNA was purified and analyzed by SYBR Green qPCR using locus-specific primers. Enrichment was quantified relative to the input and IgG controls. All ChIP-qPCR reactions were run in technical replicates, and amplicon specificity was verified by melt-curve analysis.
After harvesting, cells were rinsed three times in chilled 1
Analyses were performed with GraphPad Prism v10 (GraphPad Software, San Diego,
CA, USA) and R (version 4.3, R Foundation for Statistical Computing, Vienna,
Austria)). Data are reported as the mean
We prioritized EMT-related genes by deriving an EMT score for every sample [17] in two independent datasets—The Cancer Genome Atlas–Thyroid Carcinoma
(TCGA-THCA) and GEO GSE138042 (n = 95)—followed by gene-wise Pearson
correlation analysis. Genes showing strong associations (
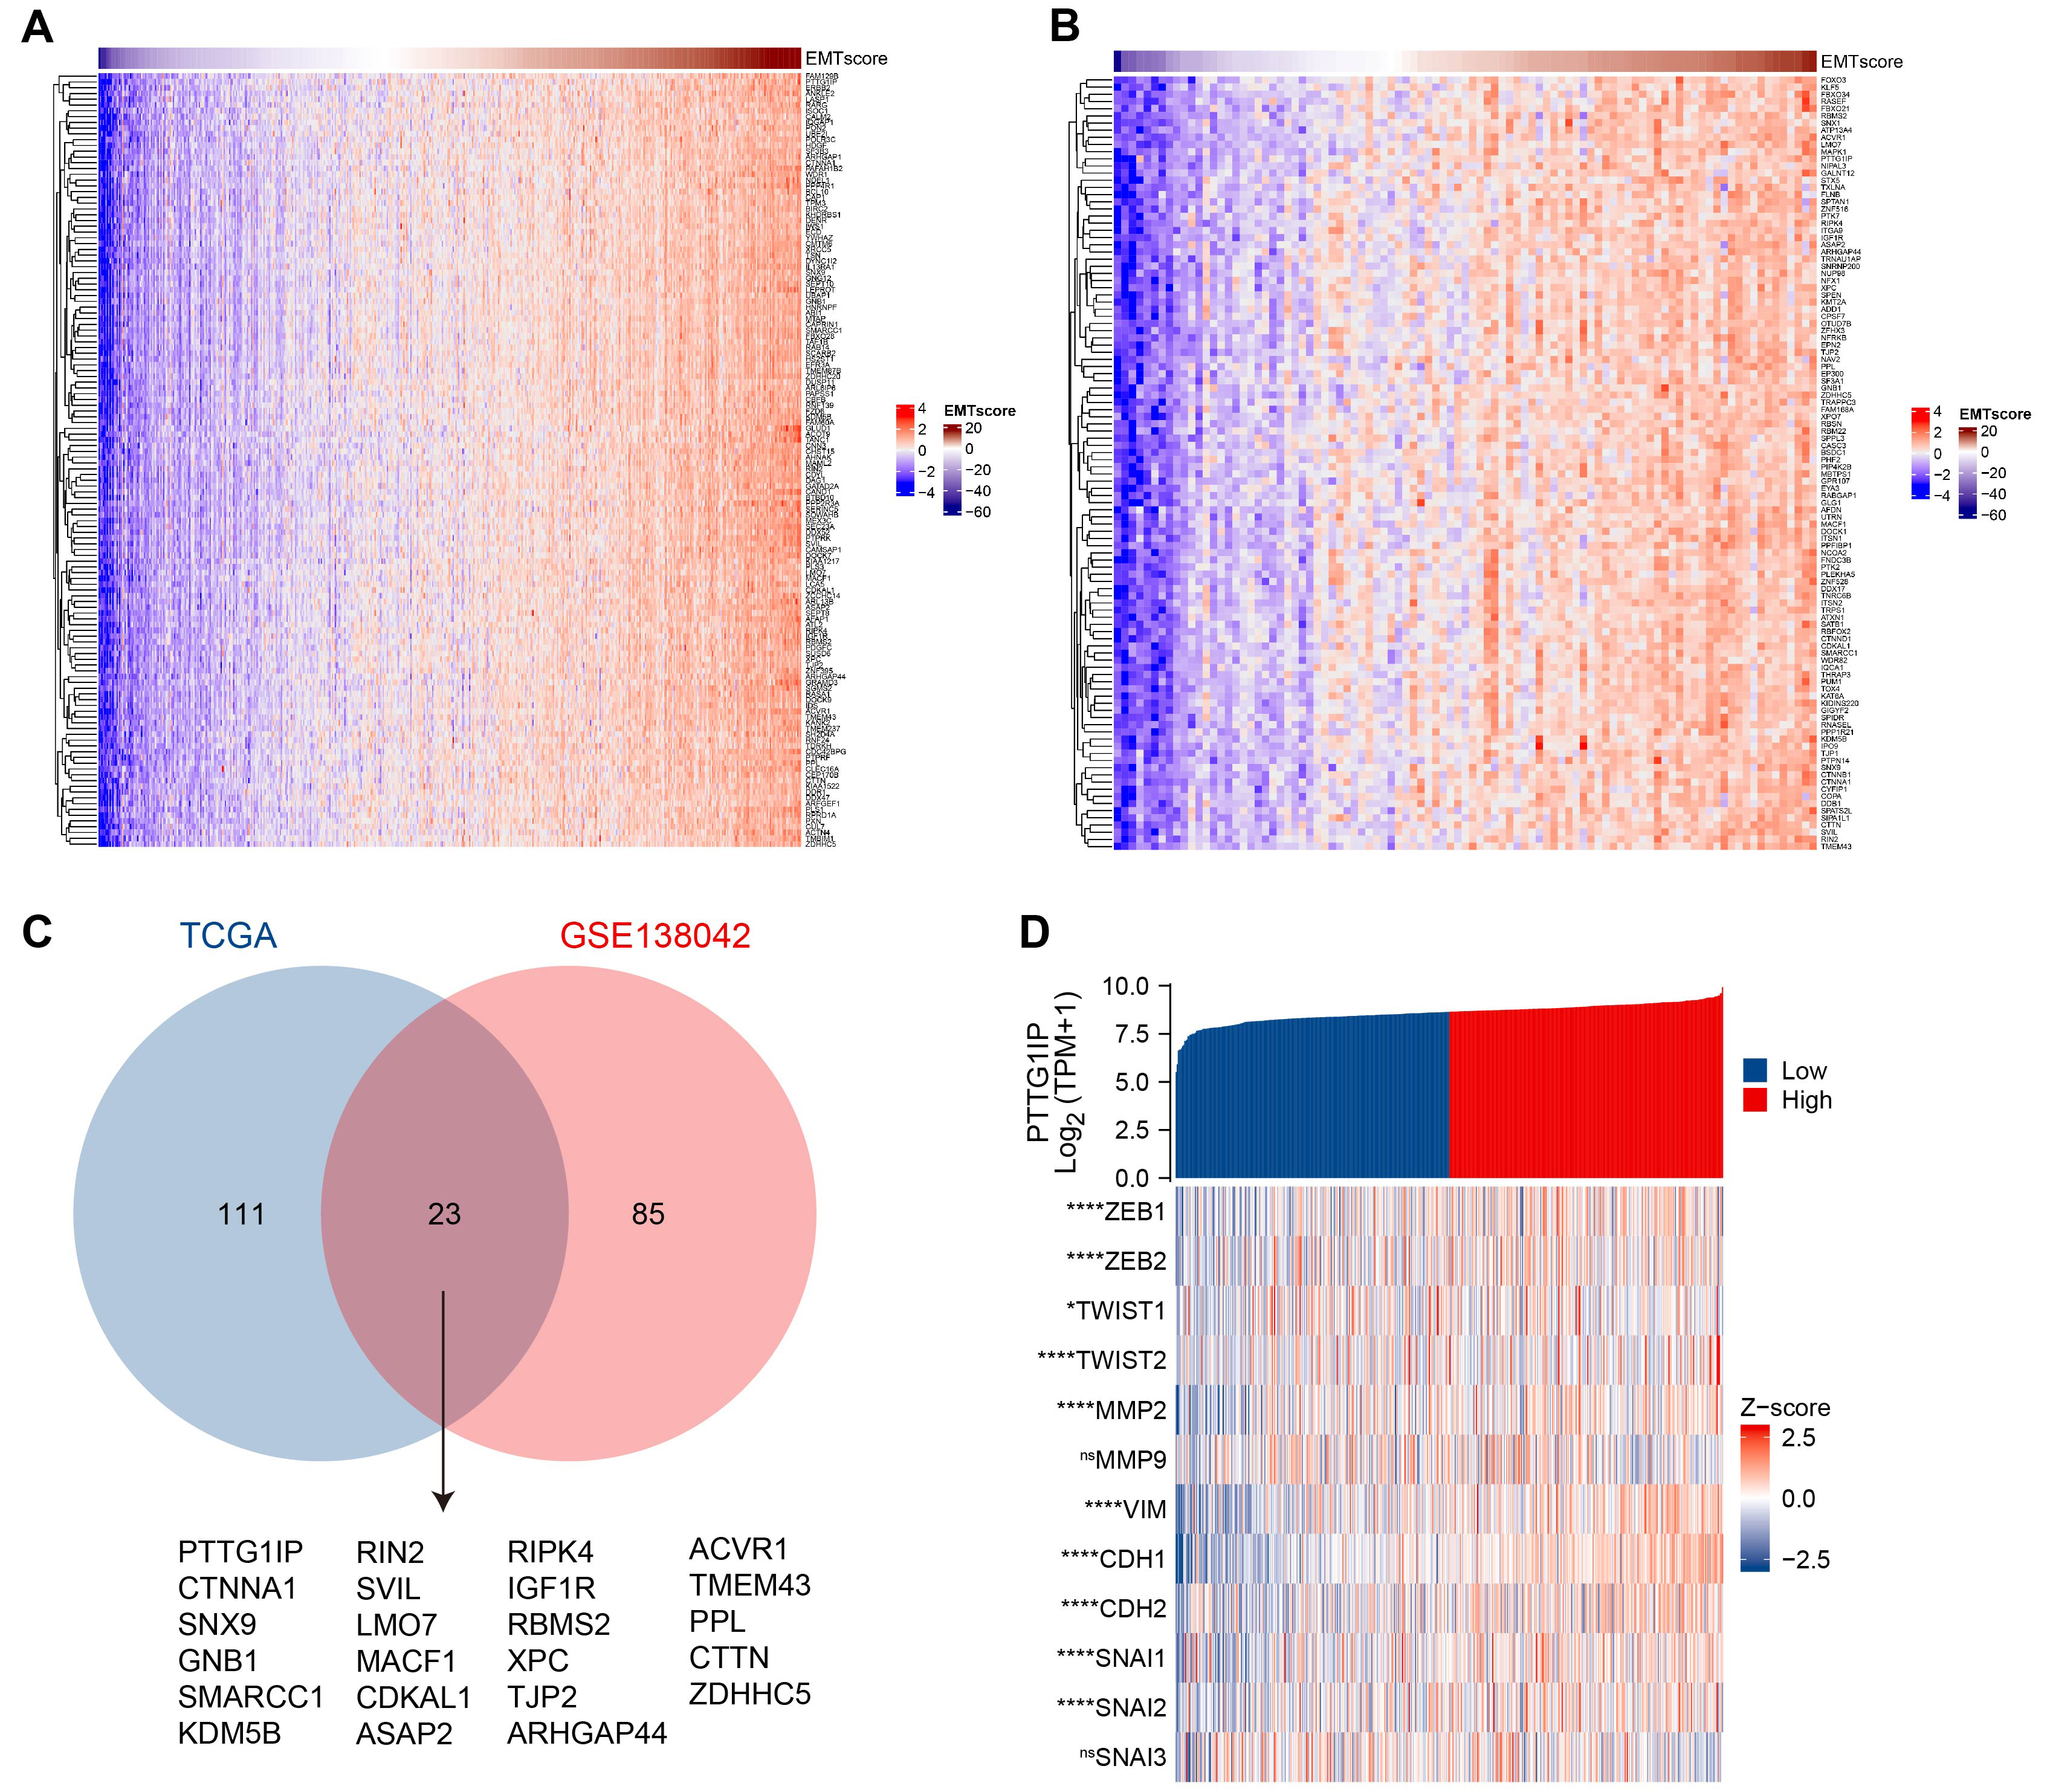 Fig. 1.
PTTG1IP emerges as a leading EMT-associated gene in thyroid
cancer. (A) Heatmap of genes most strongly correlated with the EMT score in the
TCGA-THCA cohort. (B) Heatmap of EMT-correlated genes in the GEO cohort GSE138042
(n = 95), using the same pipeline as in (A). (C) Venn diagram showing the overlap
of EMT-associated genes between TCGA-THCA and GSE138042. PTTG1IP was among the
top shared candidates. (D) Correlation map for PTTG1IP versus key EMT regulators
in TCGA-THCA, including transcription factors (ZEB1/2, TWIST1/2, SNAI1/2/3),
epithelial/mesenchymal markers (CDH1, CDH2, VIM), and matrix metalloproteinases
(MMP2, MMP9). Pearson’s R values (and p-values, where indicated)
summarize the association strength. PTTG1IP, Pituitary Tumor Transforming 1
Interacting Protein; EMT, epithelial-mesenchymal transition; TCGA, The Cancer
Genome Atlas; THCA, Thyroid Carcinoma; ZEB1/2, zinc finger E-box-binding homeobox
1/2; TWIST1/2, twist family bHLH transcription factor 1/2; SNAI1/2/3, snail
family transcriptional repressor 1/2; CDH, cadherin; VIM, vimentin. ns, no
significant; *, p
We then examined how PTTG1IP relates to the canonical EMT circuitry. PTTG1IP expression aligned positively with EMT-activating transcription factors (ZEB1, ZEB2, TWIST1, TWIST2, SNAI1, SNAI2, SNAI3) and mesenchymal markers (CDH2, VIM), while showing an inverse relationship with the epithelial determinant CDH1. It also correlated with matrix-remodeling enzymes (MMP2, MMP9) (Fig. 1D). Together, these patterns support a model in which PTTG1IP associates with mesenchymal programs and extracellular-matrix dynamics that are characteristic of EMT in thyroid cancer.
We next examined whether PTTG1IP is dysregulated in tumors. Analysis of bulk RNA-seq from TCGA-THCA showed higher PTTG1IP mRNA levels in thyroid carcinoma than in normal thyroid tissue (Fig. 2A). A patient-matched comparison yielded the same pattern: in paired samples, tumors generally exhibited increased expression relative to adjacent normal counterparts (Fig. 2B). Consistent with the transcript data, protein-level evidence from the Human Protein Atlas indicated stronger PTTG1IP immunoreactivity in thyroid cancer tissues than in normal thyroid (Fig. 2C). Together, these orthogonal readouts support the recurrent upregulation of PTTG1IP in thyroid cancer, consistent with a role in disease pathogenesis.
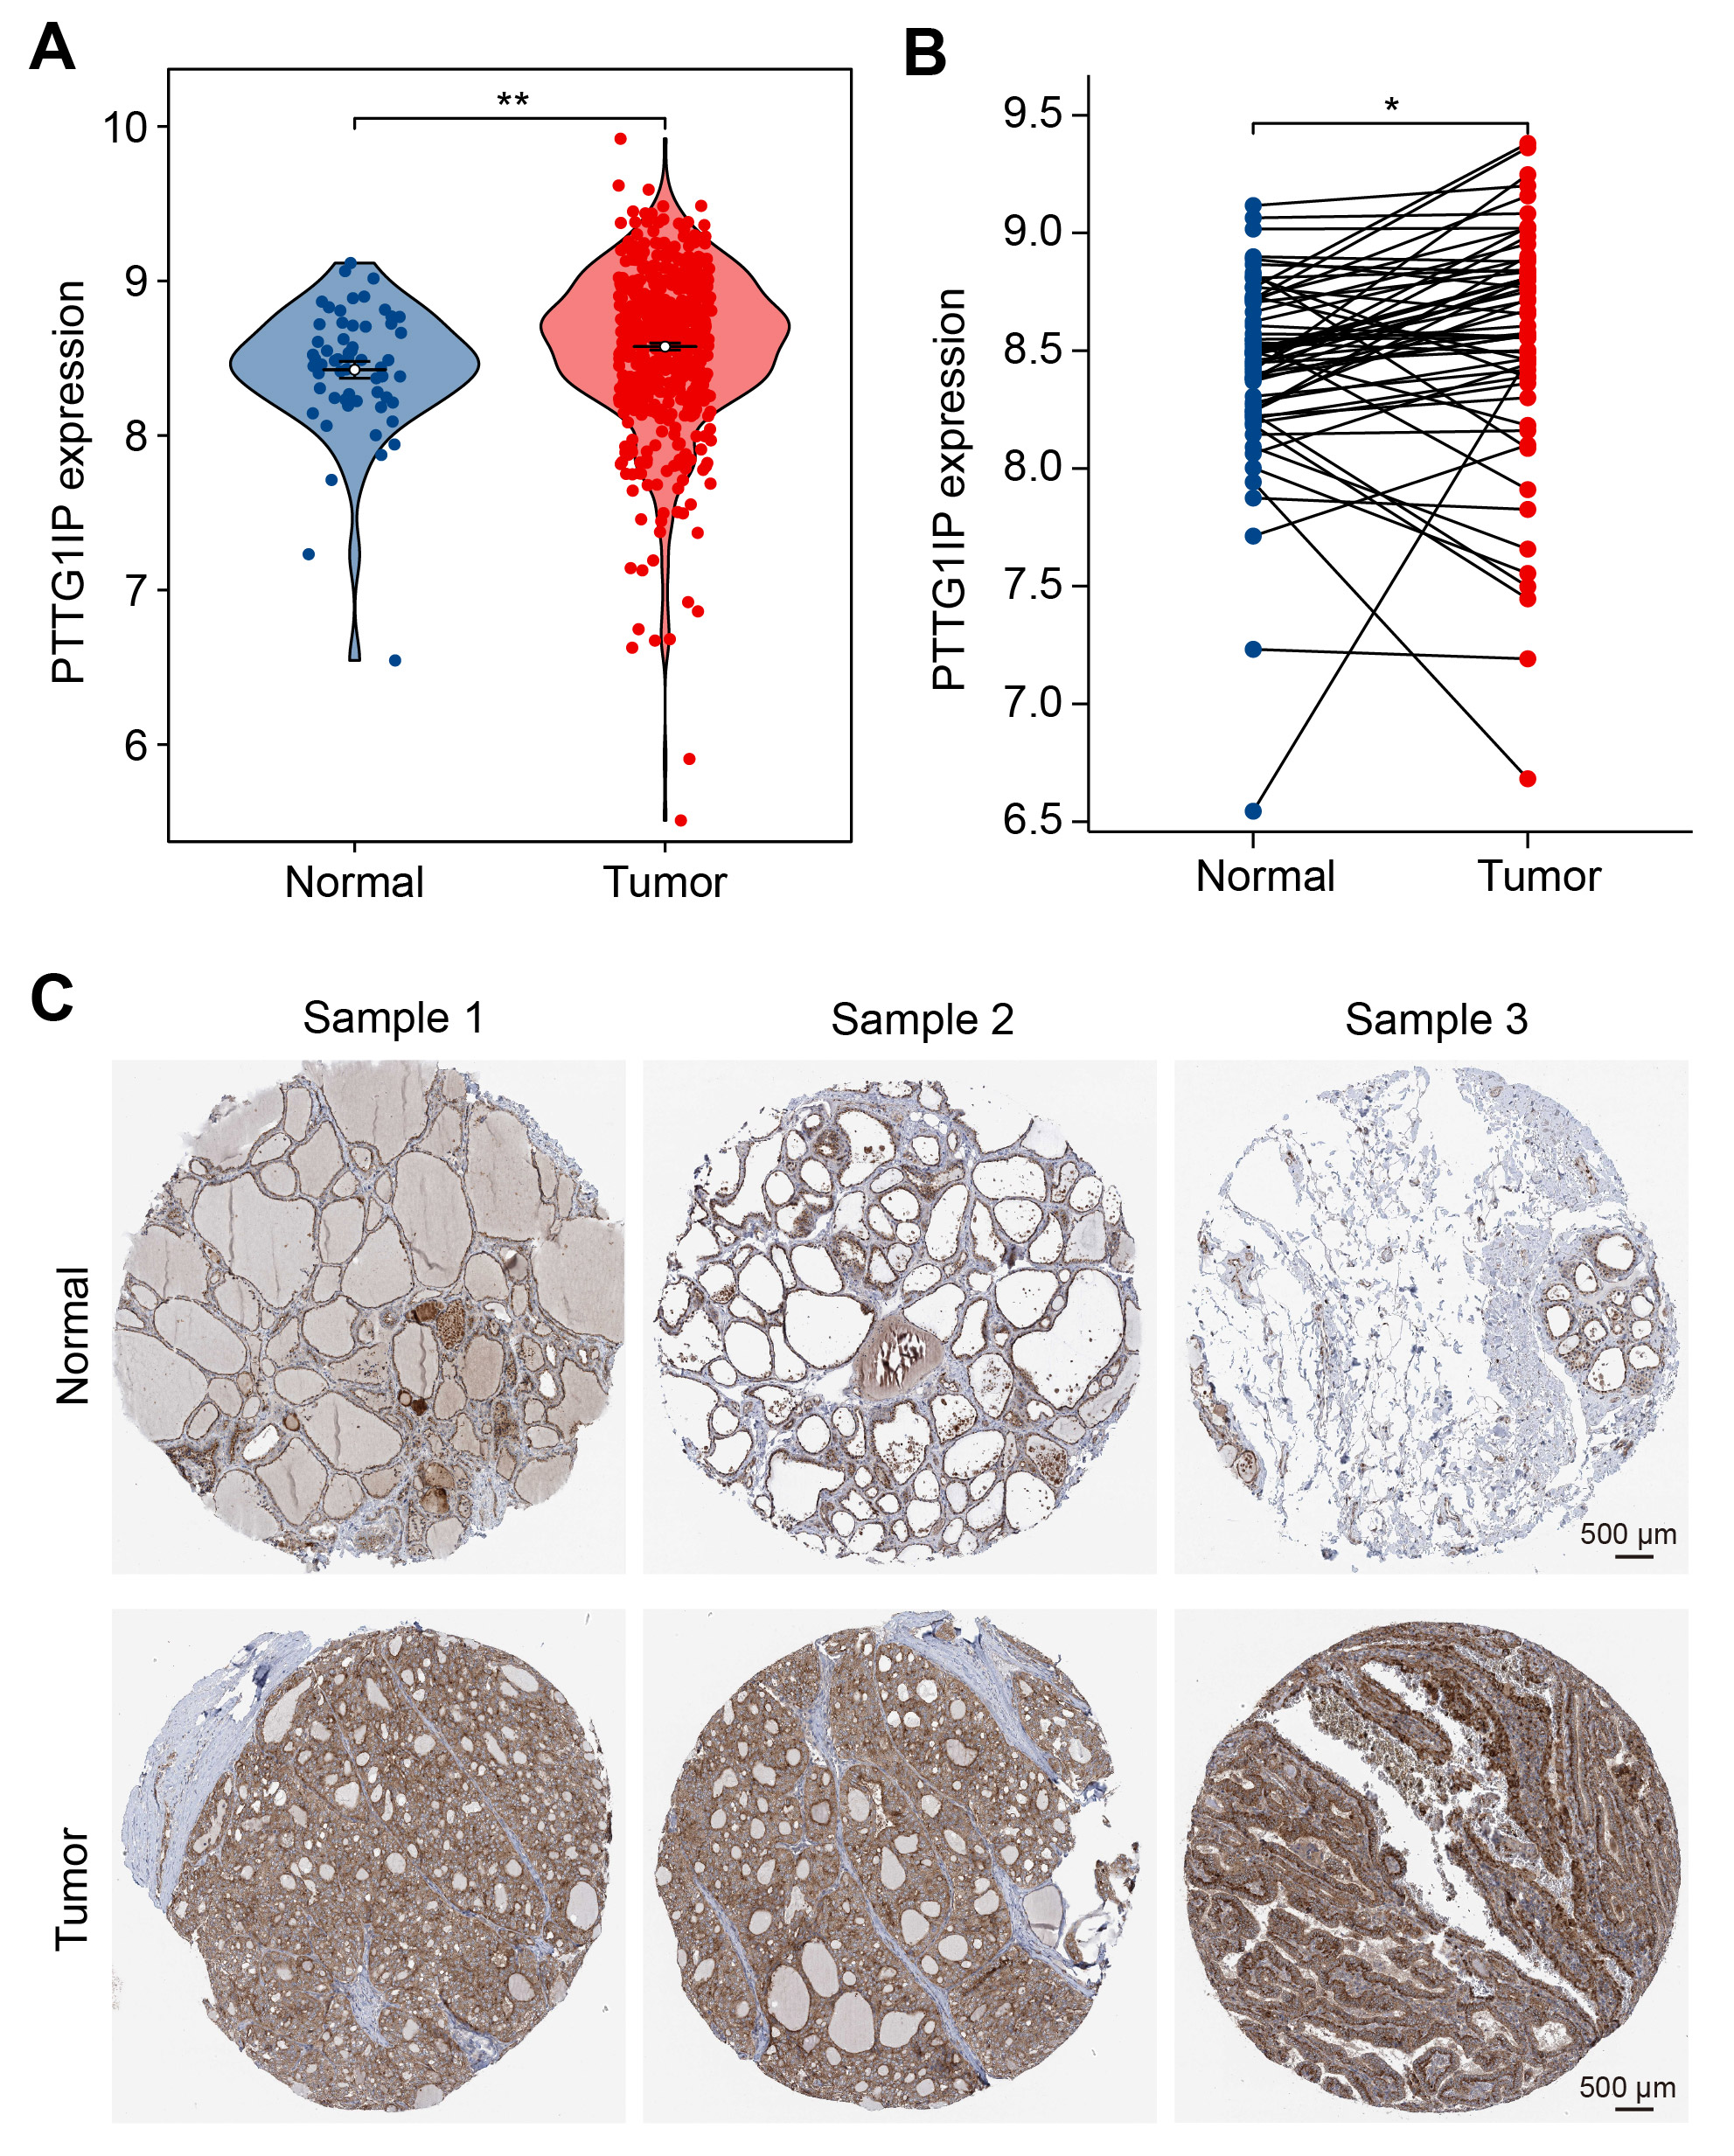 Fig. 2.
PTTG1IP is elevated in thyroid cancer at both RNA and protein
levels. (A) Normalized PTTG1IP mRNA expression in normal thyroid versus thyroid
carcinoma samples from the TCGA-THCA cohort. (B) Paired tumor–adjacent normal
analysis within TCGA-THCA; each line connects samples from the same patient,
illustrating the within-patient increase. (C) Representative immunohistochemistry (IHC) images from the Human Protein Atlas (HPA; https://www.proteinatlas.org/) showing stronger PTTG1IP immunostaining in thyroid cancer compared with normal thyroid tissue (scale bar = 500 μm). *,
p
We first profiled PTTG1IP across models and found higher mRNA levels in thyroid cancer cell lines (TPC-1, KTC-1, BCPAP) than in non-malignant thyroid cells (HTori-3) (Fig. 3A). To assess function, PTTG1IP was silenced using shRNA and the knockdown efficiency validated by qRT-PCR (Fig. 3B). Loss of PTTG1IP resulted in cell growth inhibition, as reflected by the CCK-8 assay result for TPC-1 and KTC-1 cells (Fig. 3C,D). Moreover, TUNEL assays revealed a significant increase in the percentage of apoptotic cells in PTTG1IP-silenced TPC-1 and KTC-1 cells compared to control cells (Fig. 3E), indicating that knockdown of PTTG1IP effectively promotes apoptosis. Taken together, these results indicate that PTTG1IP supports proliferative capacity and protects against apoptosis in thyroid cancer cells.
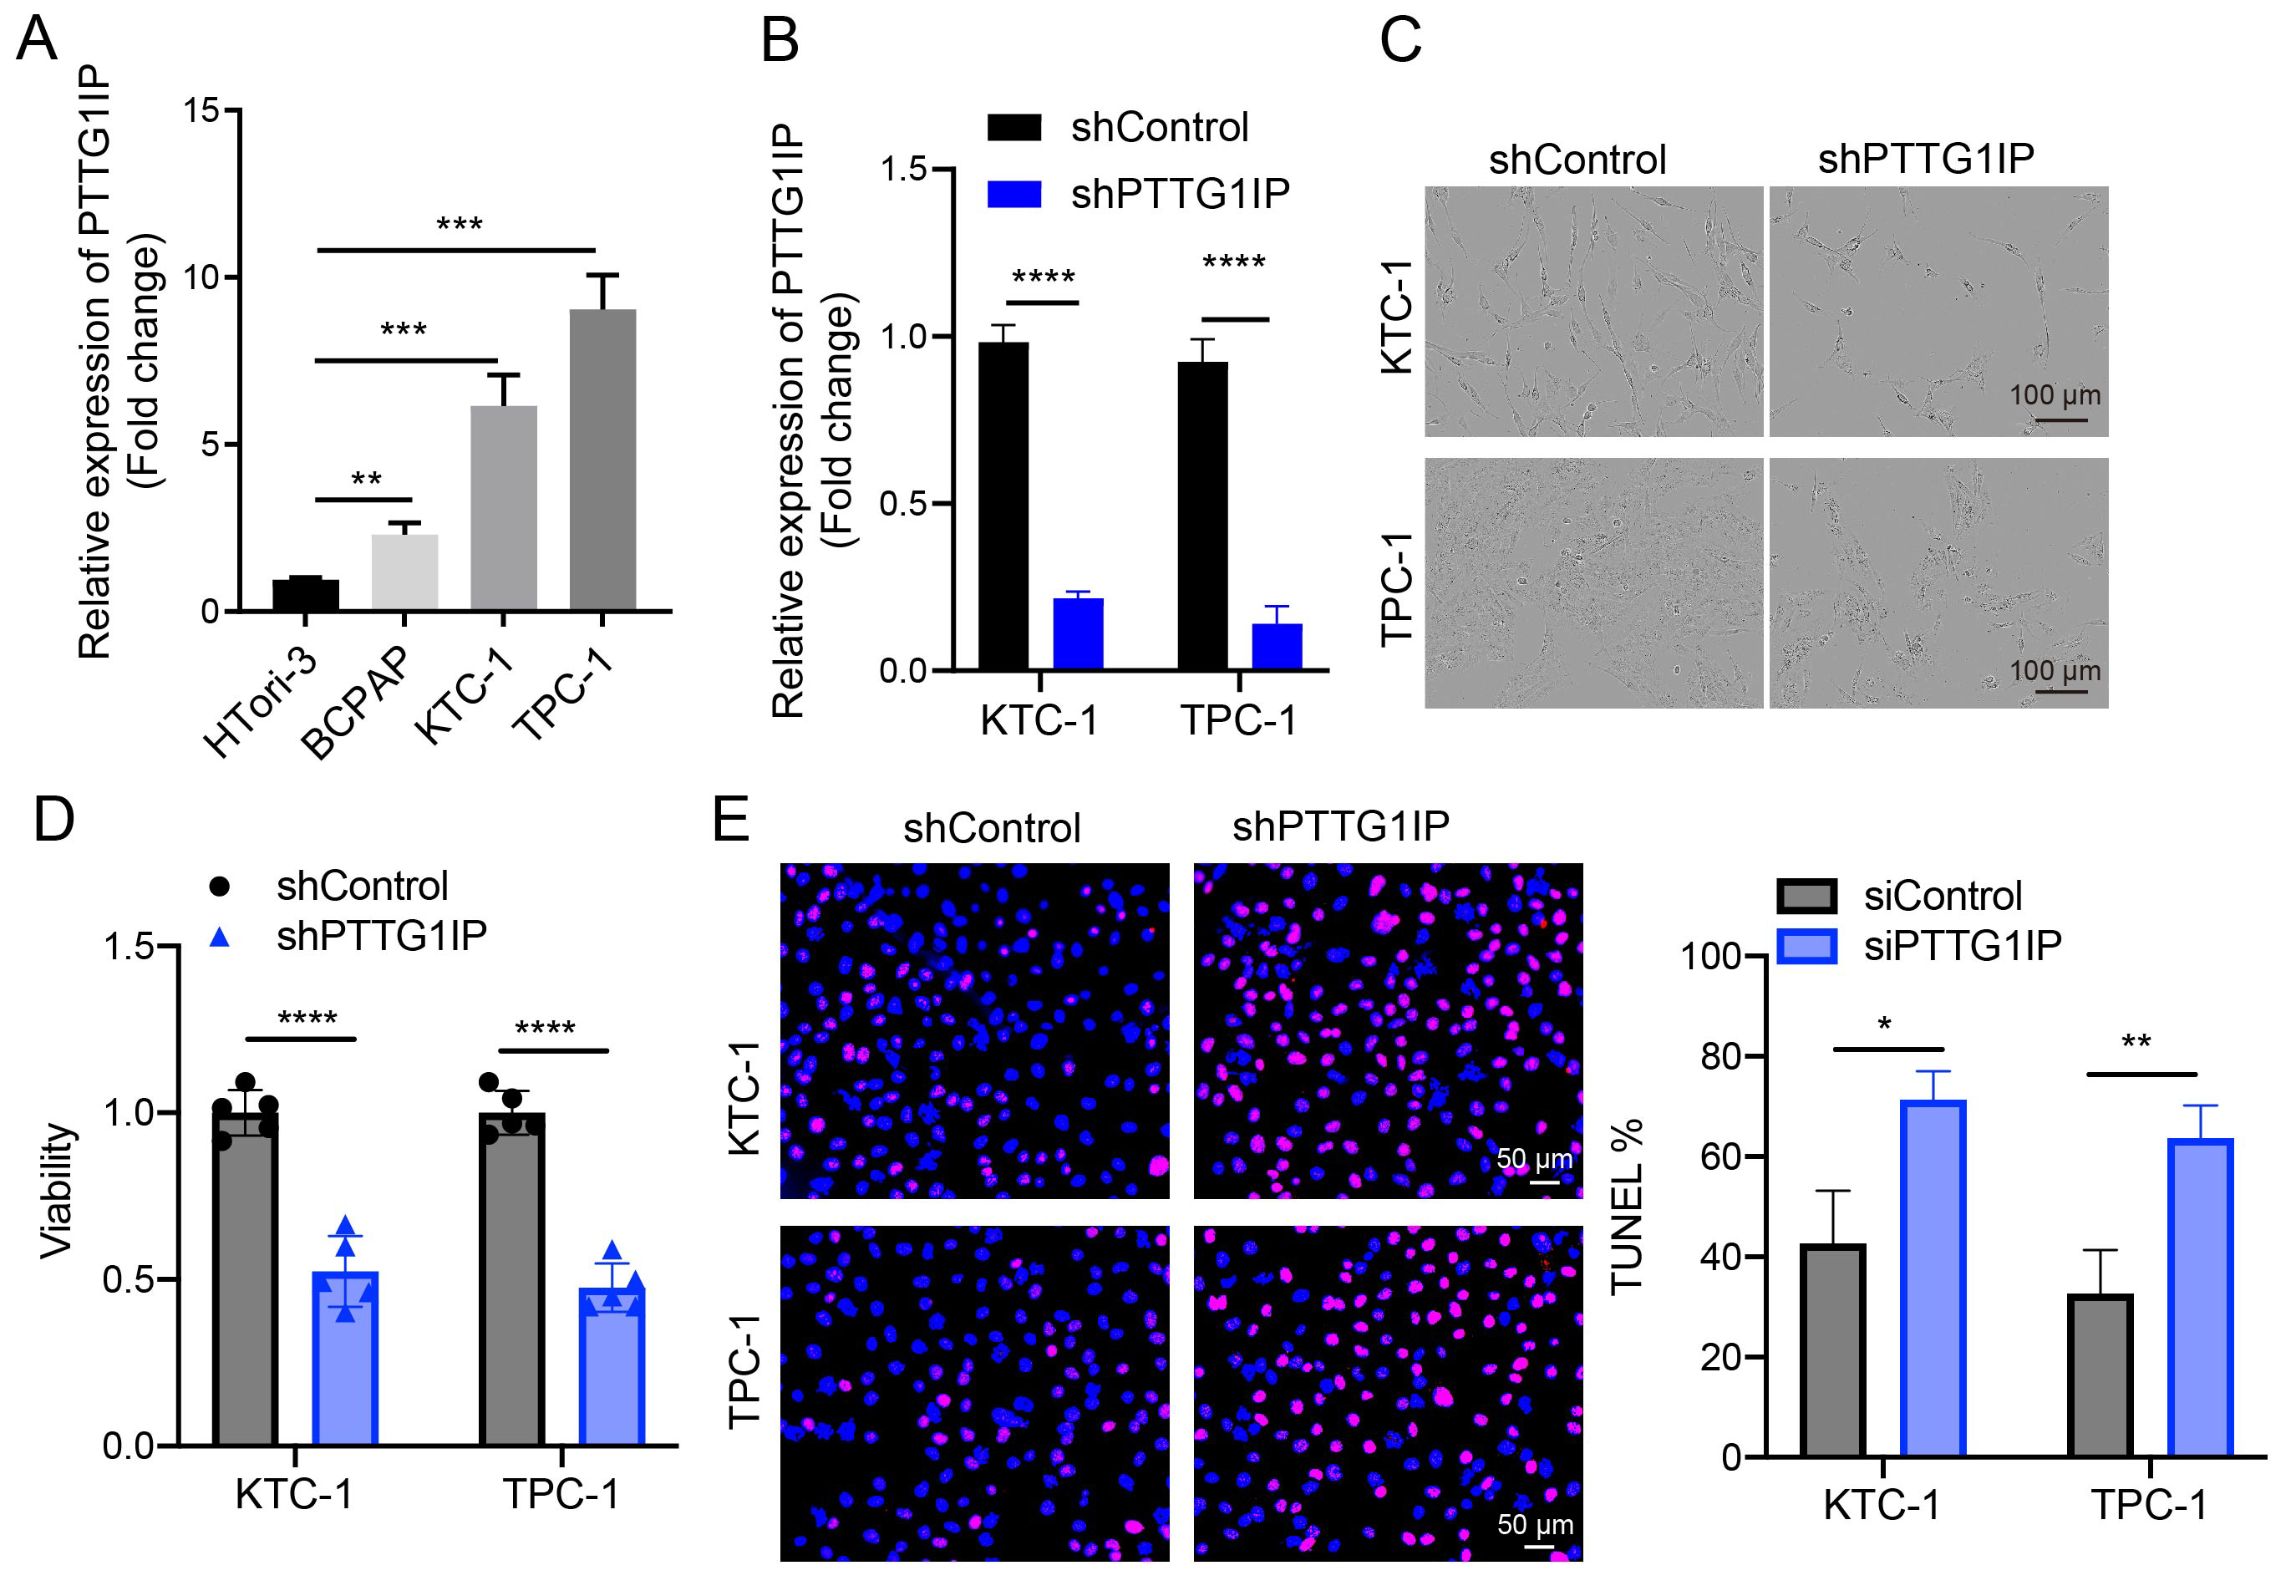 Fig. 3.
PTTG1IP promotes growth and cell survival in thyroid cancer
cells. (A) qRT-PCR comparison of PTTG1IP mRNA in HTori-3 versus thyroid cancer
lines (TPC-1, KTC-1, BCPAP) (n = 3). (B) The knockdown efficiency of PTTG1IP was
demonstrated by qRT-PCR assay (n = 3). (C,D) Control or PTTG1IP-knockdown TPC-1
and KTC-1 cells were transfected and their viability assessed by CCK8 assay at
Day 5 (n = 5; scale bar = 100 μm). (E) Apoptosis was quantified by TUNEL staining in control and
shPTTG1IP TPC-1/KTC-1 cells (n = 3; scale bar = 50 μm). qRT-PCR, quantitative real-time reverse
transcriptase PCR; HTori-3, human thyroid follicular epithelial cell line; TPC-1,
KTC-1, BCPAP, human thyroid carcinoma cell lines; TUNEL, Terminal
deoxynucleotidyl transferase dUTP nick end labeling. *, p
To clarify how PTTG1IP engages the EMT circuitry, we focused on its reported
binding partners, CTTN (cortactin) and p53 [18, 19]. Consistent with the known
roles of CTTN in actin dynamics, migration, and adhesion remodeling [20, 21], our
cross-cohort screen also identified CTTN as an EMT-associated candidate (Fig. 1C). In TCGA-THCA, mRNA expression of PTTG1IP correlated positively with that of
CTTN (Pearson R = 0.572, p
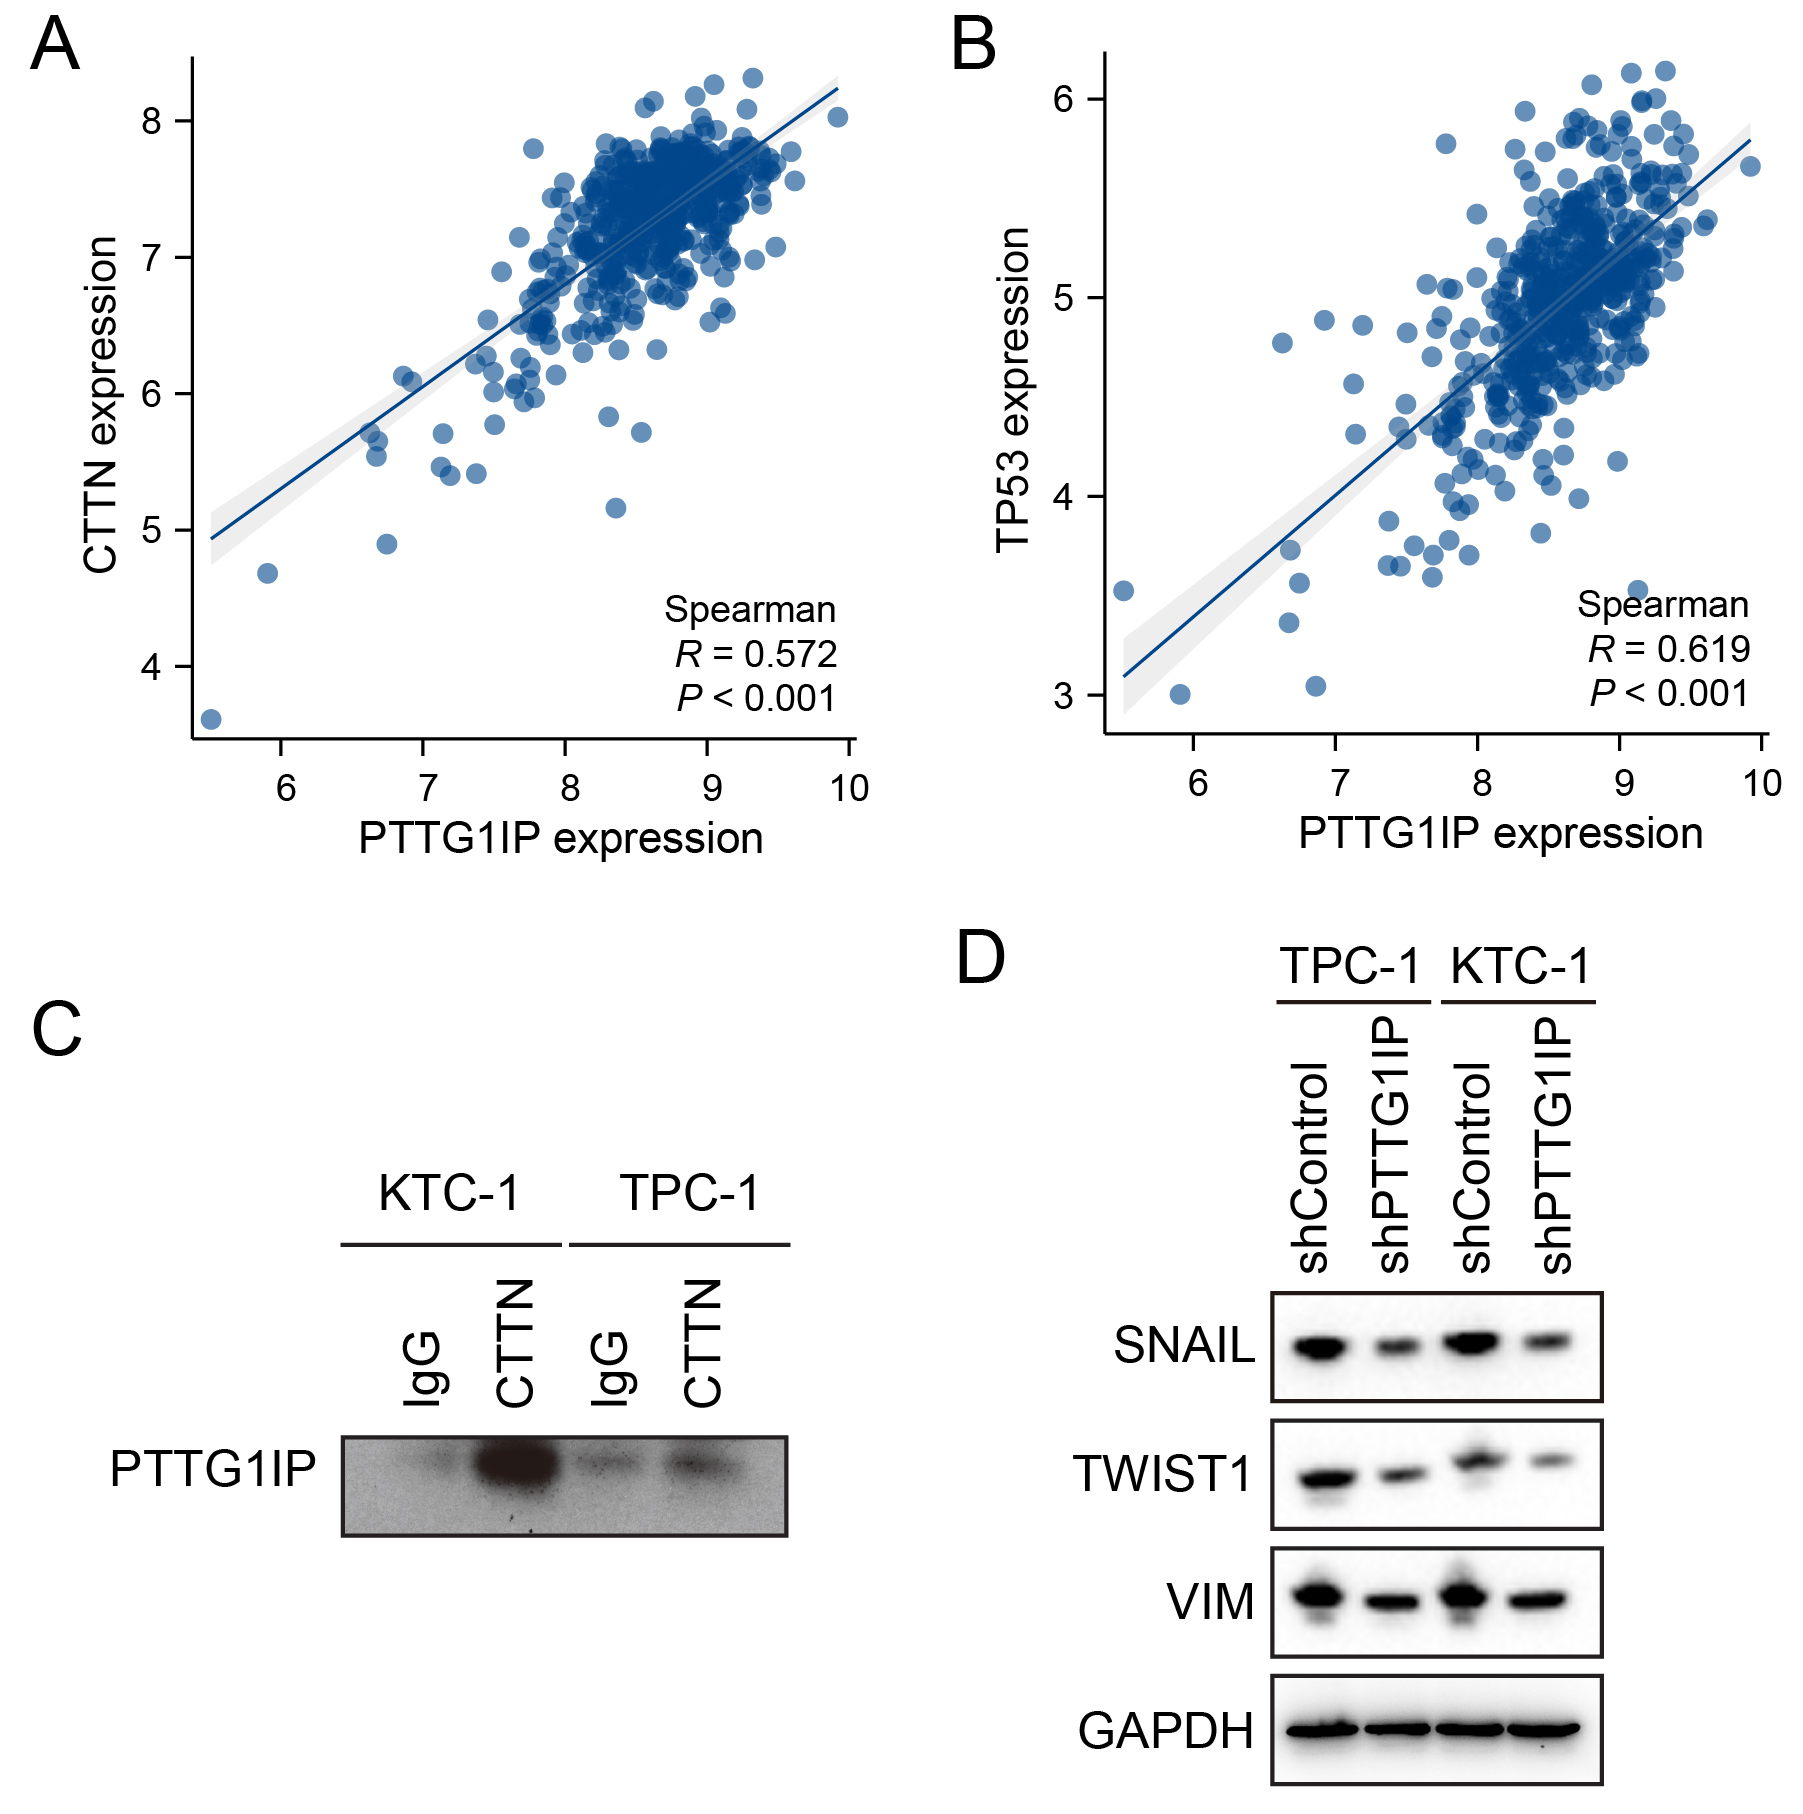 Fig. 4.
PTTG1IP physically associates with CTTN and aligns with EMT
programs. (A) Scatter plot of PTTG1IP versus CTTN mRNA in TCGA-THCA (Pearson R =
0.572, p
TP53 mutations are common in thyroid cancer and compromise the DNA damage response (DDR) to facilitate tumor progression [22, 23]. Building on prior reports that PTTG1IP can associate with p53 [14, 15, 17], as well as our evidence of a PTTG1IP–CTTN complex (Fig. 4C), we next investigated whether PTTG1IP can influence DDR programs. In TCGA-THCA, PTTG1IP expression showed positive correlations with key DDR genes, including BRCA1, BRCA2, RAD51, and FANCA (Fig. 5A). Notably, its binding partner CTTN exhibited similar correlations with the same DDR genes (Fig. 5B), suggesting the PTTG1IP–CTTN axis may align with DDR activity. Functionally, shRNA-mediated knockdown of PTTG1IP in thyroid cancer cells reduced DDR gene expression at both the mRNA level (qPCR; Fig. 5C,D) and protein level (Western blot; Fig. 5E). Mechanistically, ChIP–qPCR demonstrated occupancy of PTTG1IP at the promoter regions of BRCA1, BRCA2, RAD51, RAD51AP1 and ATM in TPC-1 and KTC-1 cells (Fig. 5F,G). Collectively, these results identify PTTG1IP as a modulator of DDR, potentially acting through its association with CTTN and direct engagement with DDR gene promoters. Such features may contribute to genomic instability and treatment resistance in thyroid cancer.
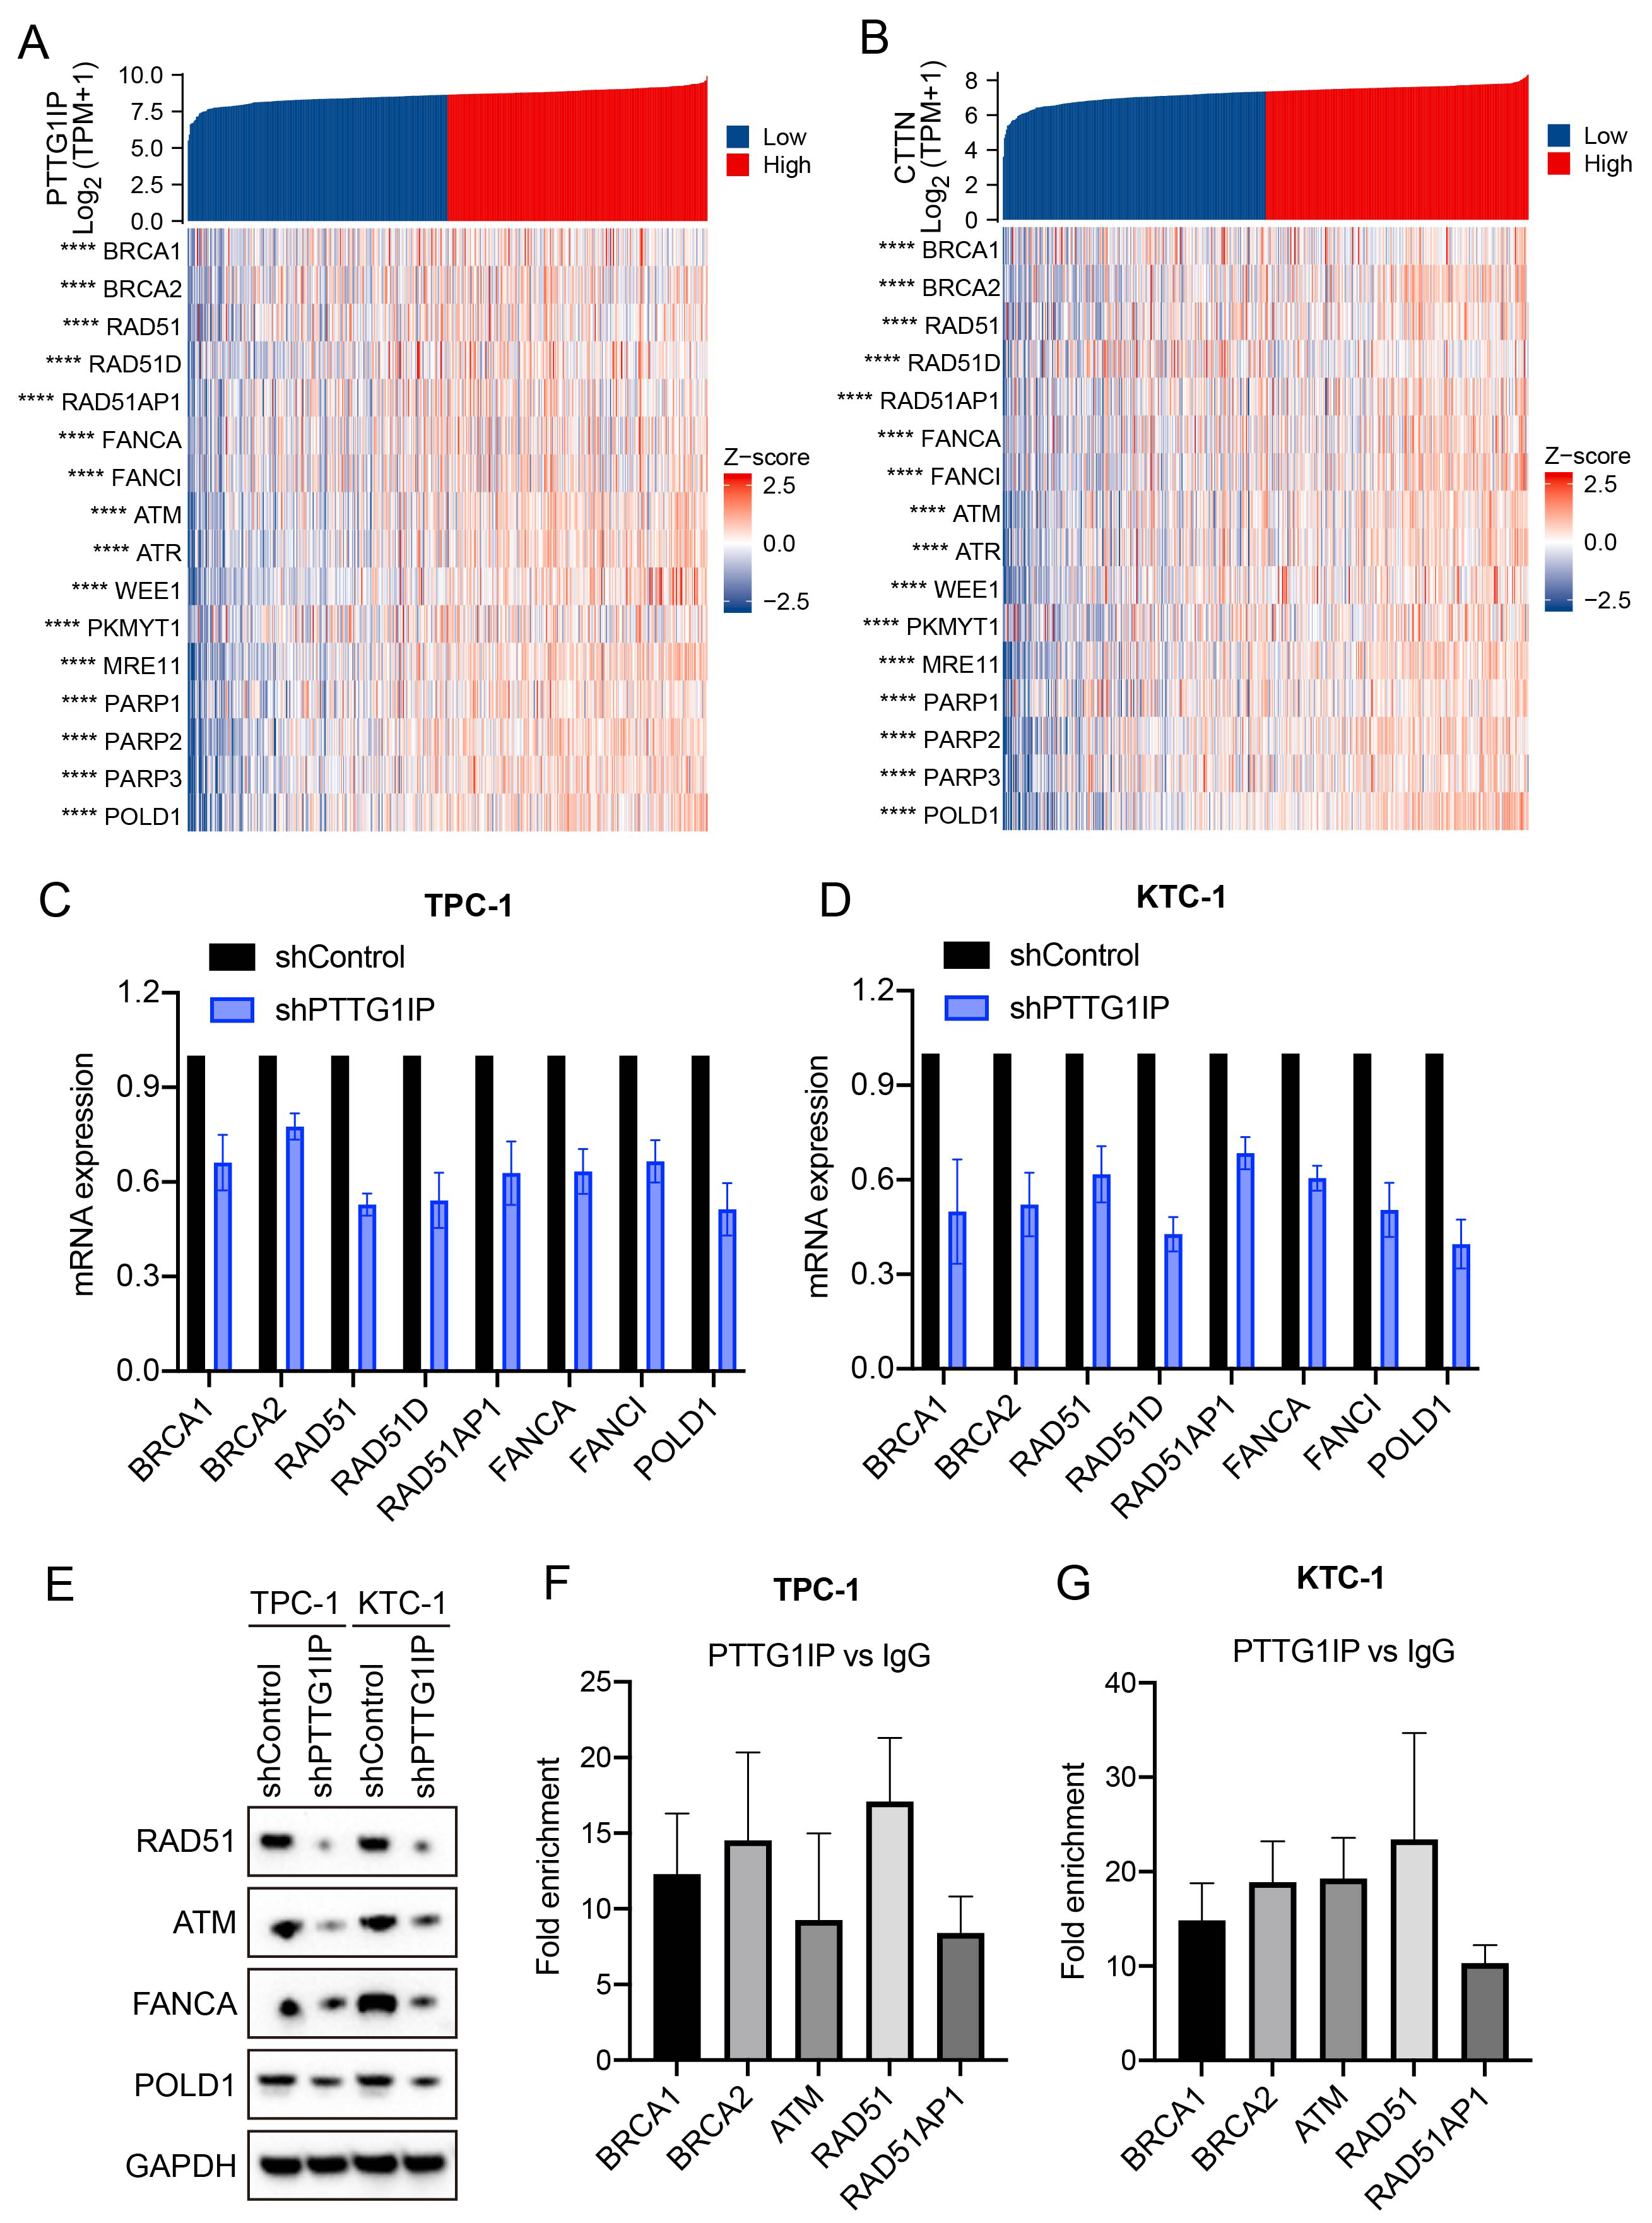 Fig. 5.
PTTG1IP modulates the DNA damage response via association with
CTTN. (A) Correlation matrix showing PTTG1IP versus DDR genes in TCGA-THCA. (B)
Correlation matrix showing CTTN versus the same DDR genes in TCGA-THCA. (C,D)
qPCR analysis showing decreased mRNA levels for DDR genes after PTTG1IP knockdown
in TPC-1 and KTC-1 cells (n = 3). (E) Western blot analyses showing reduced DDR
protein levels following PTTG1IP knockdown. (F,G) ChIP–qPCR confirming PTTG1IP
occupancy at the BRCA1, BRCA2, ATM, RAD51 and RAD51AP1 promoters in TPC-1 and
KTC-1 cells (n = 3). RAD, radiation-sensitive; DDR, DNA damage response. ****,
p
Given the connection between PTTG1IP and DDR pathways, we next examined whether the loss of PTTG1IP alters cellular responses to irradiation. Viability assays showed that irradiated cells with PTTG1IP knockdown displayed a more pronounced decrease in survival than irradiated controls (Fig. 6A). To determine if this effect was conserved in a more aggressive, TP53-mutant context, we repeated this experiment in BHT-101 anaplastic thyroid cancer cells and observed a similarly significant reduction in viability (Fig. 6A). Consistent with this observation, flow cytometry revealed a higher fraction of dead cells in the knockdown group after radiation exposure (Fig. 6B), a finding that was recapitulated in the TP53-mutant BHT-101 cell line (Fig. 6B). In addition, immunofluorescence for the double-strand break marker p-H2AX showed stronger DNA-damage signals in PTTG1IP-silenced cells following irradiation (Fig. 6C). Together, these findings indicate that suppression of PTTG1IP enhances radiation-induced cytotoxicity and DNA damage, suggesting this gene may be a potential target for improving the effectiveness of radiation therapy in thyroid cancer.
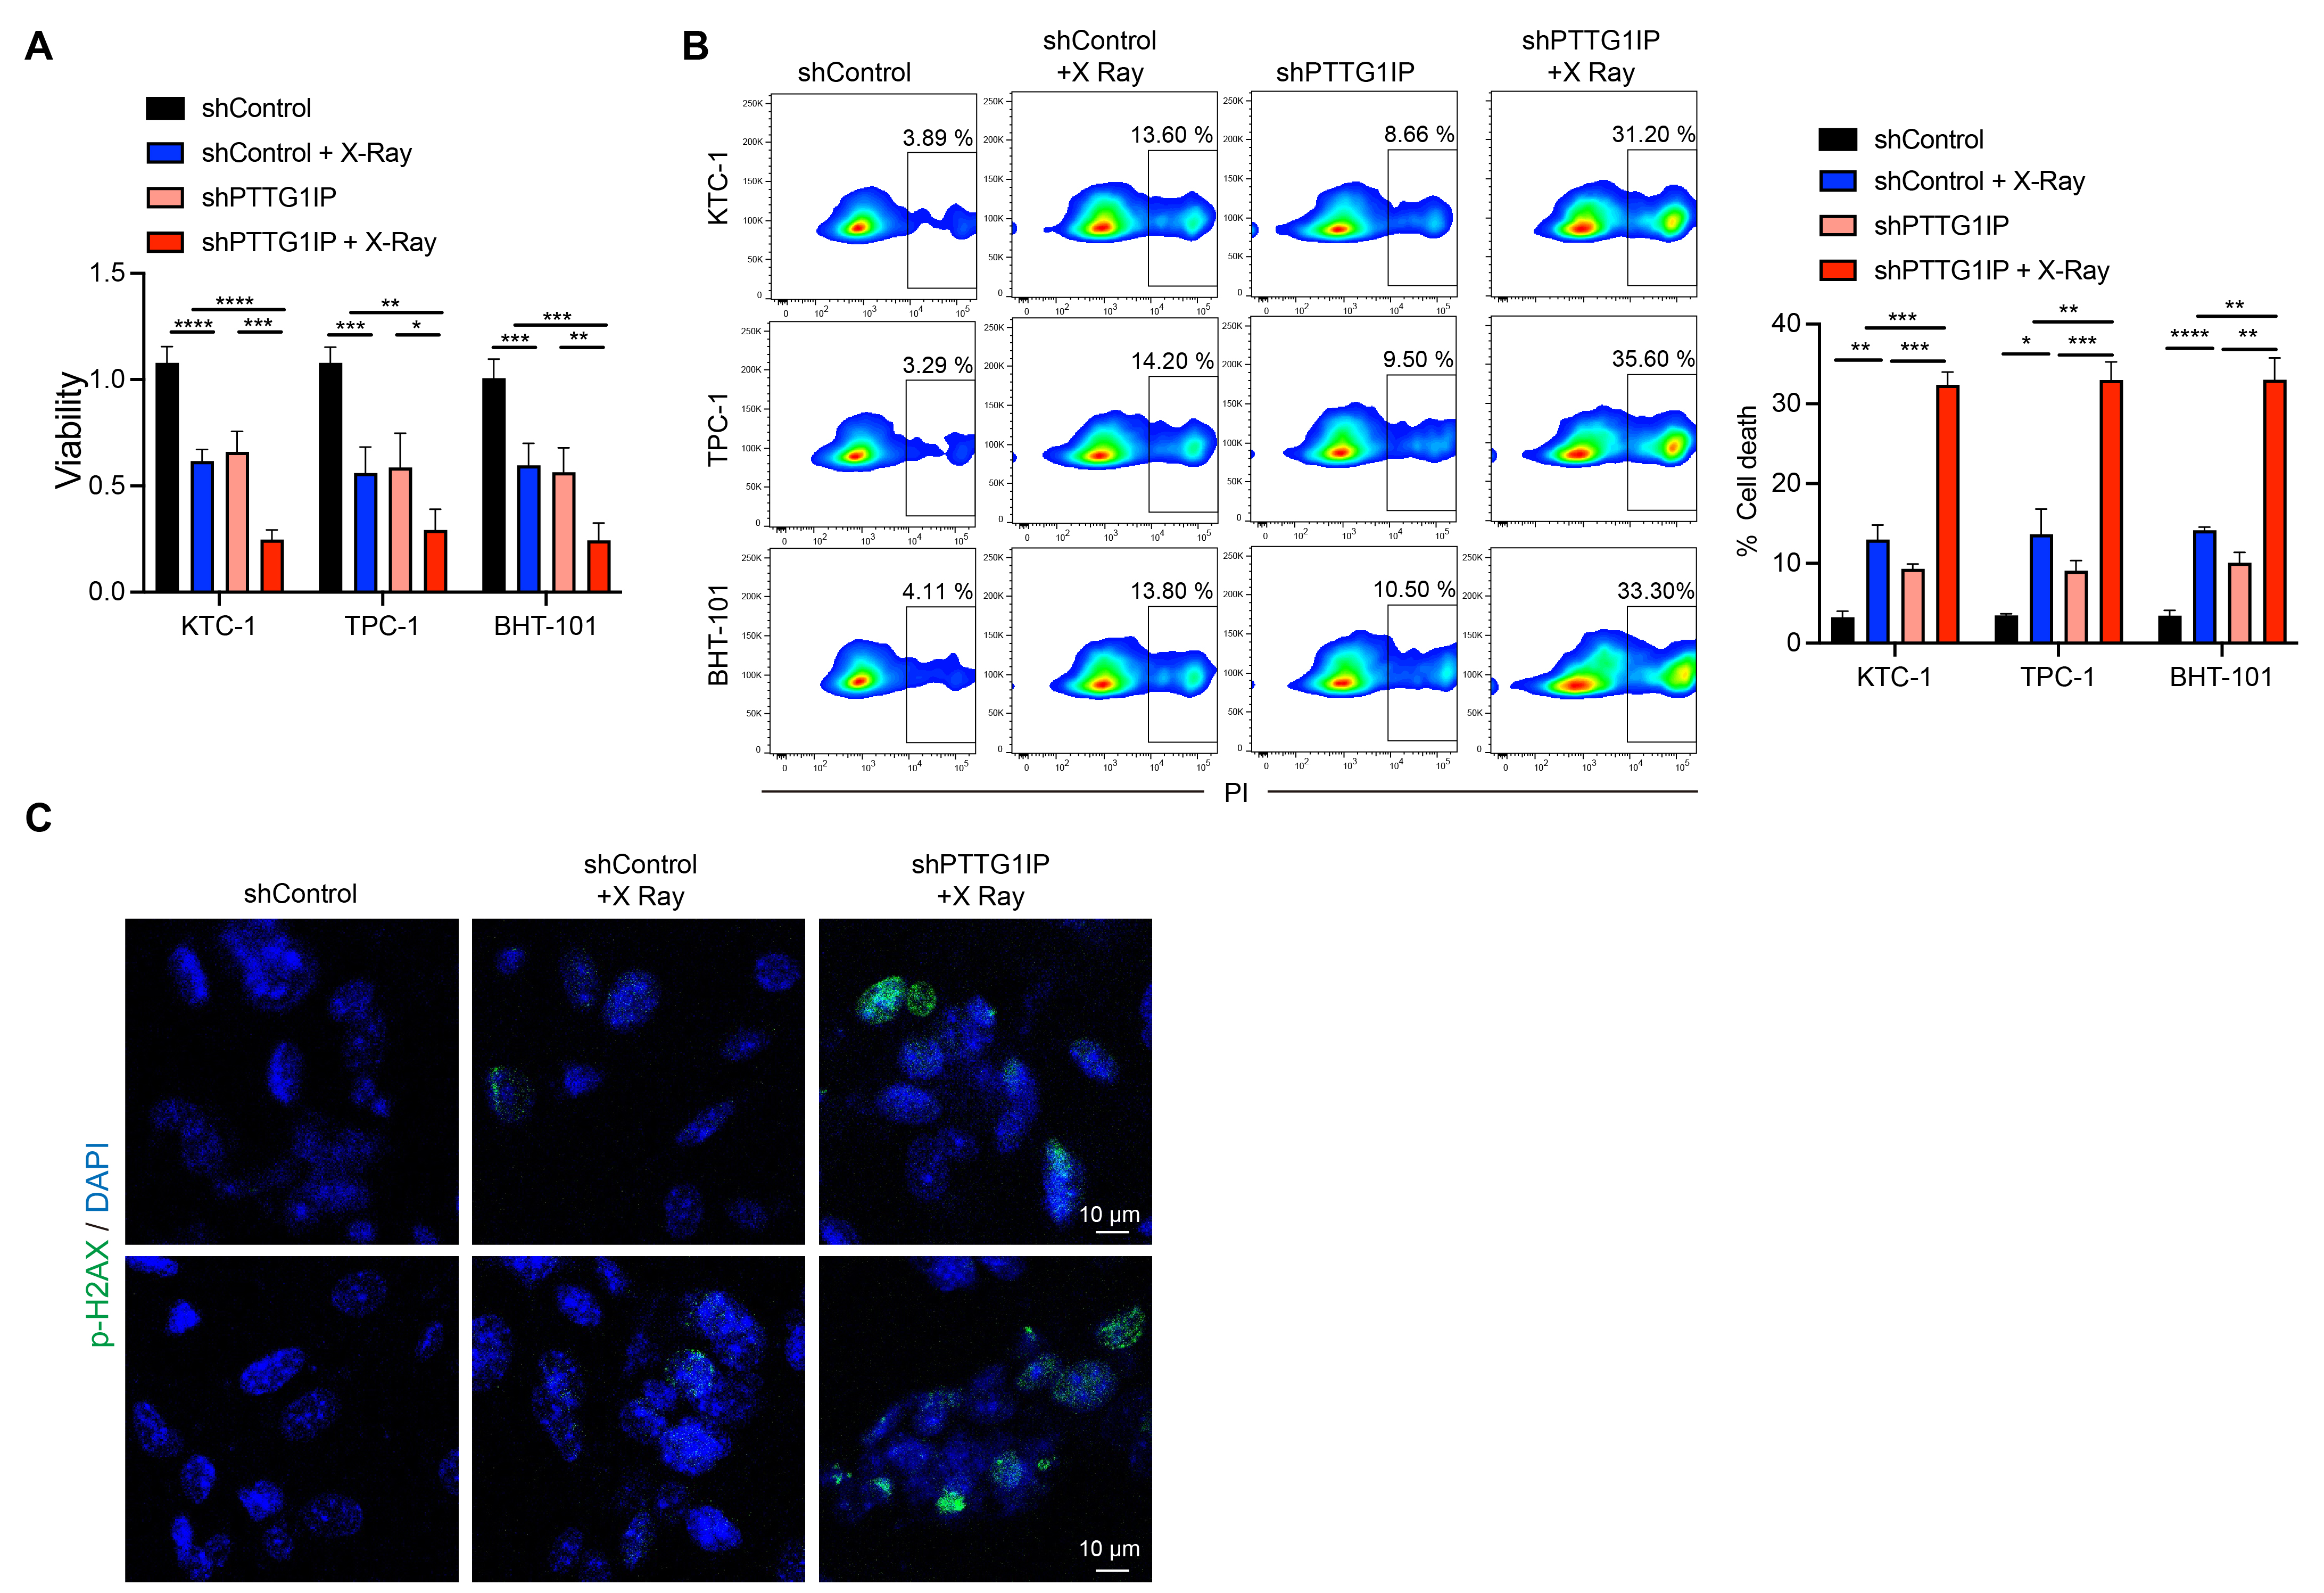 Fig. 6.
PTTG1IP knockdown sensitizes thyroid cancer cells to radiation.
(A) Cell viability after irradiation with or without PTTG1IP knockdown. The
knockdown group shows greater loss of viability (n = 5). (B) Flow-cytometric
quantification of cell death following irradiation, showing higher death rates in
cells with PTTG1IP knockdown (n = 3). (C) Immunofluorescence assessment of p-H2AX
after irradiation, indicating increased DNA-damage signals in PTTG1IP-silenced
cells (scale bar = 10 μm). *, p
In this study, we systematically examined EMT-associated genes in thyroid cancer by integrating the TCGA and GEO datasets (GSE138042), leading to the identification of PTTG1IP (PBF) as a prominent candidate. Although this gene has not been characterized as extensively as classical EMT regulators, prior reports have linked it to invasion, metastasis, and unfavorable prognosis in a number of tumor types [6, 7, 8, 9, 24]. Our data now extend these observations to thyroid cancer by showing that PTTG1IP expression is elevated at the transcript and protein levels in representative cell lines, and functional perturbation by shRNA reduces cell viability and increases apoptosis. Together, these findings support the view that PTTG1IP contributes to the disease biology of thyroid cancer, warranting deeper mechanistic investigation.
The tumor suppressor TP53 is central to DDR, cell-cycle control, and apoptosis [25, 26]. Earlier studies suggested that PTTG1IP can associate with TP53 and influence diverse pathways 3 [19]. In our thyroid cancer models, we observed concordant expression patterns between PTTG1IP and TP53, consistent with a functional relationship. Moreover, we obtained biochemical evidence of a PTTG1IP–CTTN (cortactin) complex, as revealed by co-immunoprecipitation and co-localization. Given that CTTN orchestrates actin dynamics, adhesion remodeling, and cell motility [27, 28, 29], its interaction with PTTG1IP provides a structural link between cytoskeletal regulation and EMT-aligned programs. In line with the transcriptomic analyses, the expression of EMT-related markers decreased following PTTG1IP knockdown, suggesting engagement of EMT circuitry at the molecular level. Nonetheless, migration/invasion phenotypes were not the primary endpoints in this study and should be addressed explicitly in future work.
Beyond its connection with EMT-aligned states, our results highlight a role for PTTG1IP in regulating the DDR. PTTG1IP expression correlated with the expression of canonical DDR genes, while its depletion lowered their mRNA and protein levels. Importantly, ChIP-qPCR demonstrated PTTG1IP occupancy at the BRCA1, BRCA2, RAD51, RAD51AP1, and ATM promoters, pointing to a transcriptional interface with DDR machinery. Our finding that PTTG1IP co-regulates both EMT and DDR is particularly noteworthy. While our study does not establish a direct causal chain from EMT to DDR, this dual regulatory function positions PTTG1IP as a central molecular hub. This finding is interesting in the context of literature reports that EMT can perturb DNA repair and stress checkpoints [30, 31], and with the relatively high prevalence of TP53 alterations in thyroid cancer [22, 32] which could modulate reliance on PTTG1IP-driven DDR support. Mechanistically, PTTG1IP may function as a scaffold or co-regulator that bridges cytoskeletal cues (via CTTN) with nuclear DDR control. The mapping of interaction domains and partner complexes should lead to further clarification of this model.
The therapeutic implications of our findings are notable. Loss of PTTG1IP can increase radiosensitivity, as evidenced by greater post-irradiation loss of cell viability, higher cell-death fractions, and enhanced p-H2AX signals. These data suggest that PTTG1IP sustains DDR competence, and that its inhibition can expose a vulnerability to radiation. Conceptually, the targeting of PTTG1IP could be explored as a radiosensitizing strategy, potentially improving outcomes when combined with standard radiation regimens in thyroid cancer.
Several limitations should be acknowledged. First and foremost, our study relies on bioinformatics analyses and in vitro cell line models. While these approaches provide valuable mechanistic insights, a crucial next step is to validate our findings in human clinical specimens. Future studies using patient-derived thyroid cancer tissues are essential to confirm the expression patterns of PTTG1IP and its correlation with EMT and DDR markers, which would substantially strengthen the clinical relevance of our conclusions. Second, although the EMT component is supported by transcriptomic alignment and marker modulation, the causal reprogramming of EMT states remain to be proven with rescue experiments, gain-of-function studies, and in vivo validation. Fourth, while we demonstrated promoter occupancy at DDR genes, it remains to be determined whether PTTG1IP binds to DNA directly or acts within a larger transcriptional complex. Third, while our study establishes PTTG1IP’s role in both EMT and DDR, the precise causal relationship between these two programs was not directly investigated. Whether PTTG1IP regulates these pathways in parallel, or if one is downstream of the other, remains an important question for future studies. Fifth, dependence on PTTG1IP may vary with the genomic context (including TP53 status) and tumor subtype, underscoring the need for broader panels and isogenic systems. Finally, although multiple shRNA sequences and appropriate controls were used to mitigate off-target effects, CRISPR-based approaches and orthogonal rescue should further strengthen specificity.
In summary, our data indicate that PTTG1IP is a multifunctional coordinator located at the intersection of EMT-aligned programs and DDR control in thyroid cancer. By coupling cytoskeletal remodeling through CTTN with the transcriptional regulation of DNA repair genes, PTTG1IP supports tumor cell fitness and influences treatment response. These insights motivate further studies to elucidate the relevant mechanism (complex composition, chromatin engagement, and downstream effectors) and to evaluate PTTG1IP as a biomarker and therapeutic entry point for the clinical management of thyroid cancer, particularly in combination with radiation.
PTTG1IP (PBF) is upregulated in thyroid cancer and is required for tumor cell fitness. Its knockdown was shown to reduce cell viability and increase apoptosis in vitro. Mechanistically, PTTG1IP interacts with cortactin (CTTN) and aligns with EMT-related programs. Moreover, it demonstrates engagement with DDR pathways through correlation with key DDR genes and occupation of their promoters (BRCA1, BRCA2, RAD51, RAD51AP1, ATM). Functionally, the depletion of PTTG1IP enhances radiosensitivity, leading to increased radiation-induced DNA damage and cell death. These findings indicate that PTTG1IP may serve as a biomarker and therapeutic entry point—particularly as a radiosensitization target—in thyroid cancer.
The datasets analyzed in this study are available from the corresponding author on reasonable request.
WL, MW, HZ and LZ designed the research study. WL and MW conceived and supervised the study. HZ, LZ and SW performed experiments and data collection. DY, JM, SW and XH analyzed the data. WZ and MT performed visualization. HZ wrote the manuscript. All authors contributed to manuscript revisions, read, and approved the final manuscript, and agree to be accountable for all aspects of the work. All authors agree to the submission and publication of the manuscript.
Not applicable.
We thank the TCGA Research Network, the Gene Ontology Consortium, and the Human Protein Atlas for making their data and resources publicly available. We are grateful to the reviewers for their constructive feedback. We also thank Ejear for professional English-language editing; the company had no role in study design, data collection, analysis, interpretation, or the decision to publish.
This work was supported by the Scientific Research Initiation Funding Project of the Affiliated Huai’an No.1 People’s Hospital of Nanjing Medical University (TCT201802).
The authors declare no conflict of interest.
Artificial intelligence (AI) and AI-assisted technologies were used in the preparation of this manuscript for purposes such as language editing, grammar checking, and improving clarity of expression. All content was reviewed and verified by the authors to ensure accuracy and compliance with academic standards. No generative AI tools were used for data analysis, scientific interpretation, or creation of original results.
References
Publisher’s Note: IMR Press stays neutral with regard to jurisdictional claims in published maps and institutional affiliations.