


 , Ai Tarao 1, Yasuko Ichinose 2, Naomi Iwasa 2, Fumi Tanaka 1, Yuhki Yanase 1, Koichiro Ozawa 1
1 Department of Pharmacotherapy, Graduate School of Biomedical and Health Sciences, Hiroshima University, 734-8553 Hiroshima, Japan
2 School of Pharmaceutical Sciences, Hiroshima University, 734-8553 Hiroshima, Japan
Abstract
Steroid hormones are widely used as anti-allergic drugs because of their potent anti-inflammatory properties and ability to suppress histamine release by 60–80%. Ursodeoxycholic acid (UDCA; 3α,7β-dihydroxy-5β-cholan-24-oic acid), used to treat liver disease, exerts immunosuppressive effects by binding to glucocorticoid receptors and inhibiting histamine release from mast cells. In contrast, other bile acids, such as chenodeoxycholic acid (CDCA; 3α,7α-dihydroxy-5β-cholan-24-oic acid) and deoxycholic acid (DCA; 3α,12α-dihydroxy-5β-cholan-24-oic acid), have been reported to promote histamine release. The mechanisms underlying these divergent effects remain unclear, raising questions regarding structural differences, receptor interactions, and downstream signaling. To address this knowledge gap, we examined the effects of several bile acids and C24 bile alcohols on the degranulation of rat basophilic leukemia (RBL-2H3) cells, a model for mast cell activation.
The effects of bile acids and alcohols on degranulation were tested in stimulated RBL-2H3 cells; furthermore, whether they affected store-operated calcium (SOC) channel-mediated Ca2+ entry—a critical step in mast cell degranulation—was investigated. To identify molecular targets, biotinylated bile acids were immobilized on magnetic beads and incubated with lipid raft fractions from RBL-2H3 cells to capture the interacting proteins.
All tested bile acids and alcohols significantly suppressed RBL-2H3 cell degranulation, thereby correlating with reduced extracellular Ca2+ influx via SOC channels. Further analysis revealed interference by Orai1, a key subunit of calcium release-activated calcium (CRAC) channels. This interaction appears to be mediated by the steroidal structures of the bile acids and alcohols.
These findings demonstrate that bile acids and alcohols inhibit SOC-mediated Ca2+ entry by directly interacting with Orai1, thereby blocking mast cell degranulation. Although the concentrations required for this effect were near cytotoxic levels owing to detergent-like properties, the results uncovered a novel molecular interaction between steroid structures and Orai1. This mechanistic insight provides a foundation for the development of targeted small molecule modulators of Orai1-mediated calcium entry, offering potential therapeutic strategies for allergic and inflammatory disorders.
Graphical Abstract
Keywords
- bile acid
- bile alcohol
- degranulation
- Orai1
- bile acid biotin derivative
- RBL-2H3 cells
Rat basophilic leukemia (RBL-2H3) cells exhibit many phenotypic and functional characteristics of mast cells and are widely used as in vitro models in the study of mast cell activation. Histamine release, degranulation, and other characteristic reactions in mast cells are initiated by the interaction of antigens with antibodies, followed by the generation of inositol 1,4,5-trisphosphate (IP3), which interacts with the IP3 receptor in the endoplasmic reticulum (ER) membrane, triggering the release of Ca2+ from the ER [1, 2, 3]. The resulting depletion of intra-ER calcium concentration ([Ca2+]ER) promotes the aggregation of the ER calcium sensor protein, stromal interaction molecule 1 (STIM1); then aggregated STIM1 physically interacts with Orai1, the protein responsible for calcium release-activated calcium (CRAC) channel [1, 2, 3]. This interaction opens the CRAC channel and allows extracellular calcium ions to flow into the cells.
The STIM1-Orai1 interaction is essential for the activation of RBL-2H3 cells [4]. In addition, the aggregated STIM1 can associate with transient receptor potential channels (TRPCs) and induces store-operated calcium entry (SOCE) [4]. However, CRAC channel activity is a prerequisite for transient receptor potential channel (TRPC) opening [5, 6, 7], and Orai1 serves as a critical regulator of TRPC-mediated Ca2+ influx [8, 9, 10]. Importantly, electrophysiological studies have demonstrated that CRAC channel currents remain unaffected in cells lacking all seven TRPC isoforms, highlighting the fundamental role of Orai1-mediated Ca2+ influx in mast cell activation [11, 12].
Steroid drugs are anti-allergic and have strong anti-inflammatory effects and
efficacious histamine release of 60–80% [13, 14]. Interestingly,
ursodeoxycholic acid (UDCA;
3
However, the biological effects of bile acids are not uniformly anti-inflammatory. Certain bile acids, notably chenodeoxycholic acid (CDCA) and deoxycholic acid (DCA), activate mast cells, induce colonic secretion, and promote intestinal mucosal injury, in stark contrast to the inhibitory effects of UDCA on mast cell degranulation [20, 21]. These opposing outcomes suggest that structure and functional groups may critically influence the effects of bile acids on mast cell activation; however, the underlying mechanisms have not been comprehensively elucidated.
In this study, we aimed to reconcile these discrepancies by systematically examining the effects of bile acids and their reduced derivatives (C24 bile alcohols) on stimulated RBL-2H3 cells. Our results demonstrate that all tested bile acids and alcohols effectively inhibited degranulation owing to reduced extracellular Ca2+ influx in the presence of Ca2+. Evidence suggests that this inhibition is mediated through the modulation of store-operated calcium (SOC) channels, likely via direct interaction with Orai1 rather than through alterations in downstream signal transduction. We propose that the steroid nucleus, which is common to these bile acids and alcohols, is a key structural determinant of their Orai1-binding and inhibitory activity.
The following chemicals were used. RPMI-1640 powder (Cytiva, Tokyo, Japan);
fetal bovine serum (FBS), goat anti-rabbit immunoglobin (Ig) G (H+L)
cross-adsorbed secondary antibody, Alexa Fluor™ 594 (Thermo Fisher
Scientific, Waltham, MA, USA); thapsigargin (Tg), Tween20 (Fujifilm Wako
Chemicals, Osaka, Osaka, Japan); A23187 (Cayman Chemicals, Ann Arbor, MI, USA);
rabbit polyclonal anti-Orai1 antibody against 18 amino acid peptide from near the
amino terminus (ANA SPEC, Fremont, CA, USA), mouse monoclonal anti-STIM1 antibody
(Santa Cruz Biotechnology, Dallas, TX, USA), goat polyclonal anti-Orai1 antibody
against extracellular loop between transmembrane (TM)3 and TM4, C-KKQPGQPRPTSKP
(Abnova, Neihu District., Taipei, Taiwan); anti-rabbit secondary antibody
conjugated to horse radish peroxidase (HRP) (MBL, Tokyo, Japan); ImmunoStar LD,
MagCapture™ TamavidinR2-Rev (Fuji Film Wako Chemicals, Osaka,
Osaka, Japan); Fluo8/acetoxy methyl (AM) (AAT Bioquest, Pleasanton, CA, USA);
cholic acid (CA;
3
CDCA (3
Taurine-conjugated CA (TC), taurine-conjugated UDCA (TUDC), taurine-conjugated CDCA (TCDC), taurine-conjugated DCA (TDC), glycine-conjugated CA (GC), glycine-conjugated UDCA (GUDC), glycine-conjugated CDCA (GCDC), and glycine-conjugated DCA (GDC) were provided by Dr. T. Hoshita (Hiroshima University, Hiroshima, Japan).
All bile acids and alcohols are presented in Fig. 1. Bile alcohols were synthesized according to a previously reported method [22, 23].
 Fig. 1.
Chemical structure of bile acids and bile alcohols.
The bile acids presented in Fig. 1 (5 g) were dissolved in 100 mL anhydrous tetrahydrofuran; 3 mL triethylamine was added, and 2 mL ethyl chlorocarbonate was added dropwise. After stirring at room temperature (~20 °C) for 2 h, 6 g NaBH4 in 35 mL water was added gradually. The reaction mixture was stirred at room temperature for 12 h, after which 35 mL of water was added, and the mixture was stirred at room temperature for 5 min. Next, 100 mL of 1 M HCl was added to the reaction mixture; the acidified reaction mixture was extracted using ethyl acetate ester, and washed with water to neutral pH. Subsequently, 5% NaHCO3 was added to remove unreacted bile acids, followed by washing with water, which was removed using anhydrous Na2SO4. The solvent was evaporated, and ethyl acetate ester was added to the residue to obtain crystals or precipitates. The purity of each sample was determined using thin-layer chromatography (TLC). (development solvent: benzene: isopropanol: acetic acid = 3:1:0.1).
Rf values: 5
Purity: C-OH 98%, UDC-OH 90%, CDC-OH 98%, DC-OH 98%
The synthesis route is illustrated in Fig. 2. Briefly, bile acid, CA, CDCA,
UDCA, and DCA (1.0 g) [1] were dissolved in anhydrous dioxan (20 mL),
0.28 mL tributylamine was added, and 0.25 mL ethyl chlorocarbonate was added
dropwise [22, 23] [2]. After stirring the reaction mixture at room
temperature for 2 h, 0.25 mL 30% ammonia solution was added dropwise. After
extraction with ethyl acetate ester and evaporation of the solvent, each 0.7–0.8
g 24-amido 5
 Fig. 2.
The synthesis of bile acid-biotin derivatives. Synthesis route
of biotinylated bile acid derivatives. Briefly, bile acids (CA, chenodeoxycholic
acid (CDCA), ursodeoxycholic acid (UDCA), and deoxycholic acid (DCA)) [1] were
reacted with ethyl chlorocarbonate in the presence of tributylamine
([1]
All compounds (CA biotin derivative (C-biotin), UDCA biotin derivative (UDC-biotin), CDCA biotin derivative (CDC-biotin), DCA biotin derivative (DC-biotin)) were confirmed to be biotinylated based on the presence of a peak at ppm specific to biotin in the Nuclear Magnetic Resonance apparatus (ECA600, Akishima, Tokyo, JEOL).
RBL-2H3 cells were cultured in RPMI-1640 medium supplemented with 15% fetal
bovine serum (FBS), 2 mM glutamine, 100 U/mL penicillin, 100 µg/mL
streptomycin, and 250 ng/mL amphotericin. The RBL-2H3 cells were donated to Prof.
Ozawa by Dr. Beven, who was studying overseas. A mycoplasma test using a fluorescence staining method was performed for the RBL-2H3 cells, and the cells were found to be mycoplasma-free. We confirmed their identity by functional characterization.
Specifically, the cells released
We measured the activity of released
The intracellular calcium concentration [Ca2+]i was measured using Fura2/AM as an intracellular calcium indicator in the presence of Ca2+. RBL-2H3 cells sensitized on glass-bottom dishes as mentioned earlier were loaded with 1 µM Fura2/AM and bile acid or bile alcohol in prepared Siraganian buffer containing 1 mM CaCl2 and incubated for 30 min at 37 °C and 95% CO2. After washing twice with the prepared Siraganian buffer, 900 µL prepared Siraganian buffer was added. The cells were excited every 10 s at 340/380 nm and fluorescence images were captured at 510 nm using an ARGUS HiSCA calcium imaging system (Hamamatsu Photonics, Iwata, Shizuoka, Japan). Three minutes after the start of capture, the RBL-2H3 cells were stimulated with 20 ng/mL DNP–BSA [27].
[Ca2+]i was measured using Fluo8/AM under Ca2+-free conditions. RBL-2H3 cells in glass-bottom dishes overnight at 37 °C and 95% CO2 were loaded with 1 µM Fluo8/AM as an intracellular calcium indicator and bile acid or bile alcohol in Siraganian buffer containing 1 mM CaCl2 for 30 min at 37 °C and 95% CO2. After washing twice with Siraganian buffer without CaCl2, 900 µL of Ca-free Siraganian buffer with 0.1 mM EGTA was replaced. Every 10 s, the fluorescence image was captured using a fluorescence microscope equipped with excitation (490 nm) and emission (520 nm) filters (BIOREVO 9000; Keyence, Osaka, Osaka, Japan). Then, 2.0 µM Tg was added to RBL-2H3 cells 1 min after capture, and 1 mM CaCl2 was added 4 min later.
RBL-2H3 cells grown on glass coverslips were used for fluorescence staining. RBL-2H3 cells sensitized as mentioned earlier were washed twice with the prepared Siraganian buffer, pretreated with CA, UDCA, CDCA, DCA, C-OH, UDC-OH, CDC-OH or DC-OH for 10 min, and stimulated with Ag for 2.5 min. The cells were washed with PBS and fixed with 4% paraformaldehyde in PBS for 10 min at room temperature followed by washed three times with 10 mM Glycine-PBS for 3 min, permeabilized with 0.1% Triton X-100 for 5 min, washed three times again, blocked with 3% BSA–PBS for 10 min, and incubated with anti-STIM1 antibody (1:100) in 1% BSA–PBS overnight at 4 °C. After washing with 0.1% BSA–PBS four times for 3 min each, the cells were incubated with anti-rabbit IgG (H+L) Secondary Antibody, Alexa Fluor™ 594 (1:2000, Thermo Fisher Scientific, Waltham, MA, USA) and Hoechst33342 for 1 h at room temperature. After washing four times for 3 min each, the cells were mounted in mounting medium Moiwol 4-88 Reagent and prepared as a slide.
A fluorescence microscope (BZ-X810; Keyence, Osaka, Osaka, Japan) equipped with excitation/emission (360/460, 560/630 nm) filters was used to capture the images.
Fig. 3 indicates Bile Acid Biotin Derivative-binding Protein Extraction and
Analysis. The ULTRARIPA® Kit for Lipid Raft extracts cell
membrane lipid rafts under non-denaturing conditions [28]. After washing, the
RBL-2H3 cells were lysed using RIPA A buffer, sonicated for 10 min, and
centrifuged at 18,000
 Fig. 3.
Purification of binding protein to BA-biotin derivative by Tamavidin® 2-REV magnetic beads. Isolation of lipid raft fractions and analysis of proteins bound to biotinylated bile acid derivatives. Lipid rafts from rat basophilic leukemia (RBL-2H3) cell membranes were extracted under non-denaturing conditions using the ULTRARIPA® Kit. Biotinylated bile acid derivatives were incubated with MagCapture Tamavidin2-REV for 30 min. After washing three times with PBS containing 0.025% Tween-20, the MagCapture Tamavidin2-REV–bound bile acid derivatives were incubated with lipid raft fractions. Proteins bound to the steroidal nucleus were then analyzed by SDS-PAGE and western blotting. Detailed experimental procedures are provided in the Methods and Materials section.
MagCapture™ TamavidinR2-Rev was used to purify the biotinylated molecules using a competitive biotin elution method [29].
The bead suspension (40 µL) was washed with washing buffer, and each bile acid biotin derivative which were used at approximate amounts: C-biotin and CDC-biotin ~24 nmol, UDC-biotin and DC-biotin ~12 nmol was added to the washed beads, rotated for 30 min, and washed three times with 0.05% Tween20 in PBS after adding the lipid raft, including the collected supernatant. The solution was resuspended in a rotator for 1 h at 4 °C, the supernatant was removed, and the beads were washed three times with washing buffer.
The beads obtained in the first round, 2
The beads obtained in the second round were mixed well with 15 µL of excess biotin solution (2 mM biotin in PBS) and incubated for 15 min at 4 °C. The tube was placed on a magnetic stand, and the supernatant was recovered. The supernatant was subjected to western blot analysis. Laemmli sample buffer was added to the supernatant, boiled for 3 min, loaded, and separated using 10% SDS-PAGE for analysis of proteins bound to the steroidal nucleus of each bile acid biotin derivative. Proteins were separated by electrophoresis and transferred to polyvinylidene difluoride (PVDF) membranes. After blocking with 5% skimmed milk, the membrane was treated with a 1:200-diluted anti-Orai1 antibody and a 1:20,000-diluted secondary rabbit antibody. The membranes were analyzed by chemiluminescence using an Immuno Star LD system with a chemiluminescence detector (LAS 4000 Mini; Cytiva, Tokyo, Japan).
The cells were treated overnight with or without 0.5 µg/mL anti-Orai1 antibody against the extracellular loop between transmembrane domains (TM)3 and TM4 of the Orai1 subunit before stimulation with Ag-Ab, Tg or A23187 to investigate the interaction between bile alcohols and the Orai1 extracellular loop. For Ag-Ab stimulation, the cells were sensitized to 0.5 µg/mL anti-DNP IgE and 0.5 µg/mL anti-Orai1 antibody overnight. For Tg and A23187 stimulation, the cells were used without prior sensitization. These cells were then subjected to degranulation.
The experimental results were expressed as mean
We investigated whether bile acids and their C24 bile alcohols suppress mast
cell activation across different activation pathways, Ag–Ab crosslinking, Tg, or
the calcium ionophore A23187. All tested bile acids and C24 bile alcohols
inhibited the degranulation of RBL-2H3 cells by up to 10% stimulated with the
Ag–Ab, Tg, and A23187 (Fig. 4). Bile acids and alcohols significantly inhibited
the degranulation induced by all stimuli. The inhibitory effects of bile acids
paralleled the hydrophobicity of each bile acid. The order of
hydrophobicity, determined via chromatography using a reverse-phase column, was
CA
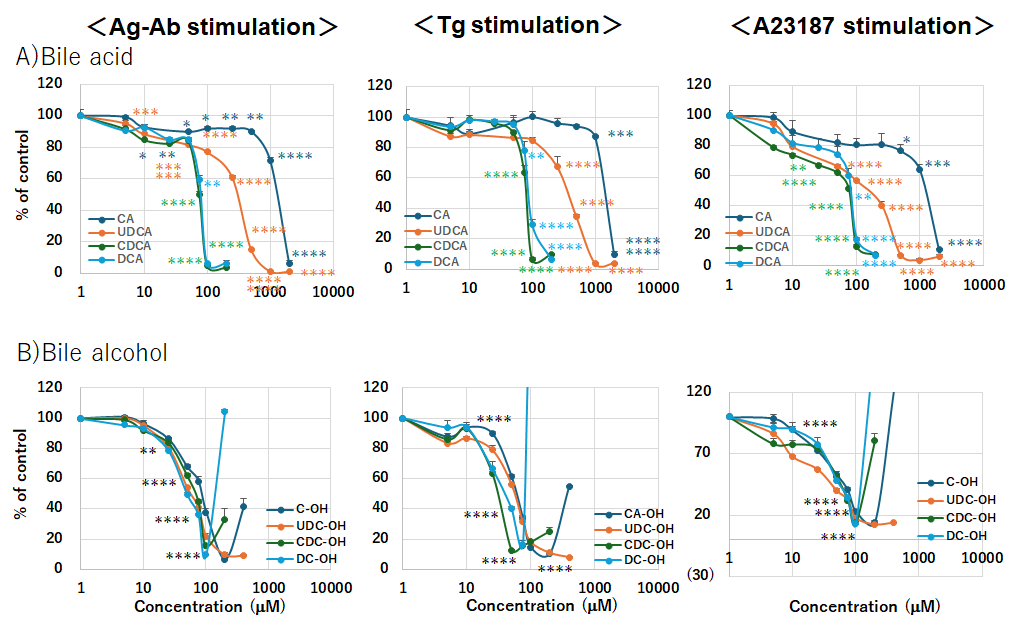 Fig. 4.
Bile acids and bile alcohols inhibit degranulation.
Degranulation of RBL-2H3 cells treated with bile acids or bile alcohols.
Treatment: Cells sensitized with anti-DNP IgE were incubated with the
indicated bile acids (CA, UDCA, CDCA, DCA; (A)) or bile alcohols
(5
To examine the inhibitory mechanism of bile acids and alcohols on degranulation, we investigated whether the inhibition of degranulation was due to reduced intracellular Ca2+ ([Ca2+]i) elevation after Ag–Ab stimulation with or without bile acid/alcohol pretreatment. The increase in [Ca2+]i is essential for mast cell degranulation, and the immediate increase in [Ca2+]i after stimulation decreased rapidly following treatment with all bile acids or alcohols at concentrations that inhibited degranulation (Fig. 5). The increase in [Ca2+]i associated with Ag–Ab stimulation involves Ca2+ efflux from the ER, followed by extracellular Ca2+ influx. Bile acids and alcohols inhibit the extracellular Ca2+ influx.
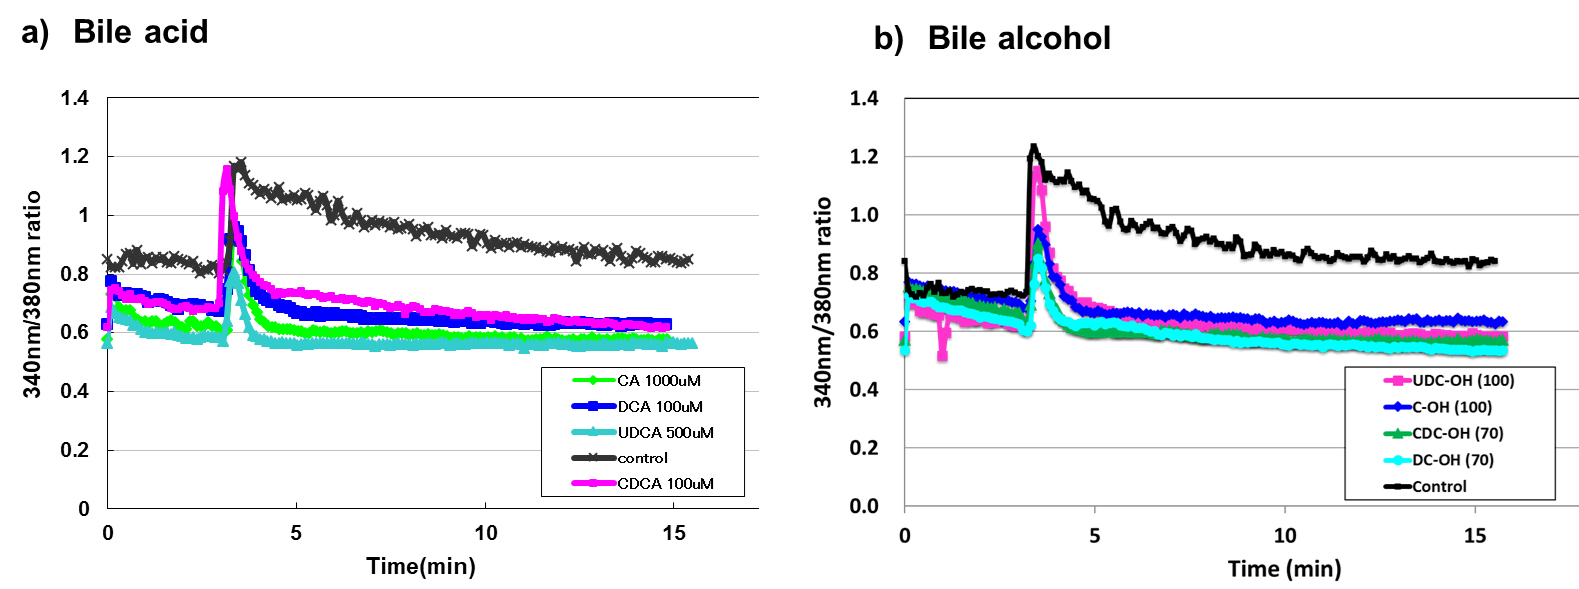 Fig. 5.
Pre-treatment with bile acid and bile alcohol inhibited the sustained increase in [Ca2+]𝐢 induced by Ag-Ab stimulation. Calcium imaging of RBL-2H3 cells treated with bile acids or bile alcohols. Treatment: Cells sensitized with anti-DNP IgE were loaded with 1 µM Fura2/AM and pretreated with the indicated bile acids (a) or bile alcohols (b) in Ca2+ (+, 1 mM) Siraganian buffer. After washing, cells were maintained in Ca2+ (+, 1 mM) buffer. Stimulation: Three minutes after image capture, cells were stimulated with DNP-BSA (20 ng/mL). Detection: Changes in intracellular calcium were monitored using a Calcium Imaging System ARGUS HiSCA (Hamamatsu Photonics, Japan). Data representation: (a) Bile acids: black, green, azure, pink, and mazarine lines represent control, CA 1000 µM, UDCA 500 µM, CDCA 100 µM, and DCA 100 µM, respectively. (b) Bile alcohols: black, mazarine, pink, green, and azure lines represent control, C-OH 100 µM, UDC-OH 100 µM, CDC-OH 70 µM, and DC-OH 70 µM, respectively. Detailed experimental procedures are provided in the Methods and Materials section.
These results indicated that bile acids and alcohols primarily interfered with the influx phase, possibly by disrupting STIM1 aggregation, STIM1–Orai1/TRPC coupling, or SOC channel function.
We evaluated whether bile acid and bile alcohols could open SOC channels in 2.0 µM Tg-stimulated RBL-2H3 cells in Ca2+-free Siraganian buffer, followed by Ca2+ re-addition (Fig. 6). Upon Ca2+ loading, bile acid-pretreated cells showed increased intracellular Ca2+ levels, comparable to those in control cells. However, [Ca2+]i in bile alcohol-pretreated cells after Ca2+ loading decreased by 25–37% compared to [Ca2+]i in control cells (Area under the curve: Control 1.0, CA 1.18, UDCA, 1.11, CDCA 0.91, DCA 0.81, C-OH 0.75, UDC-OH 0.63, CDC-OH 0.66, DC-OH 0.66). These results indicated that bile acids cannot inhibit SOC channel opening, whereas bile alcohols can partially inhibit SOC channels. However, in the presence of Ca2+, bile acids and alcohols completely inhibited Ca2+ entry into the cells (Fig. 5).
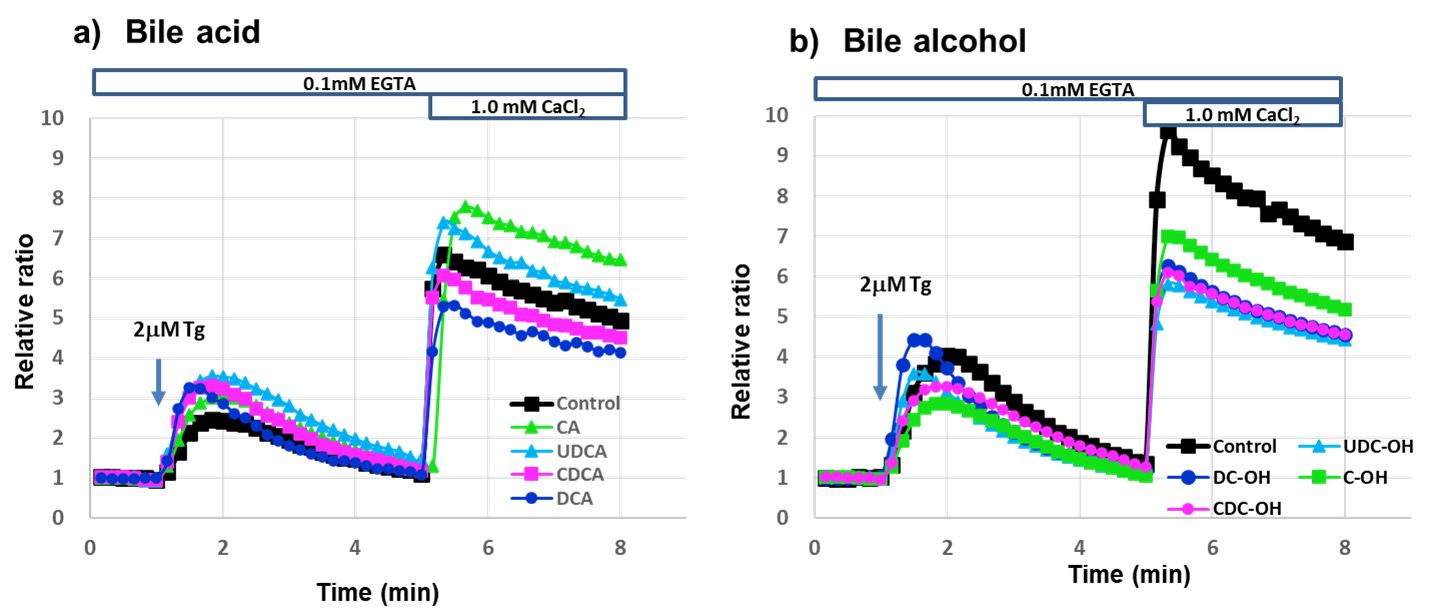 Fig. 6.
1.0 mM Ca2+ Addition to RBL-2H3 cells stimulated with 2 µM Tg in Ca2+-free buffer increased [Ca2+]𝐢 with or without bile acid or bile alcohol. Time course of cytosolic Ca2+ concentration changes in RBL-2H3 cells treated with bile acids or bile alcohols and stimulated with thapsigargin (Tg). Treatment and Stimulation: Cells were treated with the indicated bile acids (a) or bile alcohols (b). In Ca2+-free extracellular solution, 2 µM Tg was added at 1 min to induce Ca2+ release from the endoplasmic reticulum, followed by addition of 1.0 mM Ca2+ at 5 min. Detection: Changes in fluorescence over time were monitored using a fluorescence microscope (BIOREVO 9000, Keyence, Osaka, Osaka, Japan). Data representation: (a) Bile acids: black, green, azure, pink, and mazarine lines represent control, CA 1000 µM, UDCA 500 µM, CDCA 100 µM, and DCA 100 µM, respectively. (b) Bile alcohols: black, green, azure, pink, and mazarine lines represent control, C-OH 100 µM, UDC-OH 100 µM, CDC-OH 70 µM, and DC-OH 70 µM, respectively. Detailed experimental procedures are provided in the Methods and Materials section.
In an antigen-antibody reaction, the following events occur in sequence: STIM1 aggregation, interaction with Orai1, and then interaction with TRPCs [9, 10, 11]. However, in the case of Tg stimulation in the calcium-free state shown in Fig. 6, both interactions, STIM1 with Orai1 or TRPCs, occur, then calcium is added to the buffer, which may result in calcium influx from Orai1 and TRPCs. Further the differences between the effects of bile acids and alcohols were probably caused by differences in the side chains. SOC entry involves the CRAC and TRPCs channels. However, TRPC1, which acts as an SOC channel, does not induce SOCE on its own [6, 31]. More hydrophobic bile alcohols may have a higher affinity for CRAC channels than bile acids, and may block CRAC channels.
We investigated the effects of UDCA and UDC-OH on STIM1 aggregation in Ag-Ab-stimulated RBL-2H3 cells (Fig. 7). We compared STIM1 aggregation in Ag–Ab-stimulated RBL-2H3 cells pretreated with 250 µM UDCA, 30 µM UDC-OH, or the control. Other tested bile acids and bile alcohols results are shown in Supplementary Fig. 2. We did not observe any apparent effects of tested bile acids or alcohols on STIM1 aggregation in the Ag-Ab-stimulated RBL-2H3 cells.
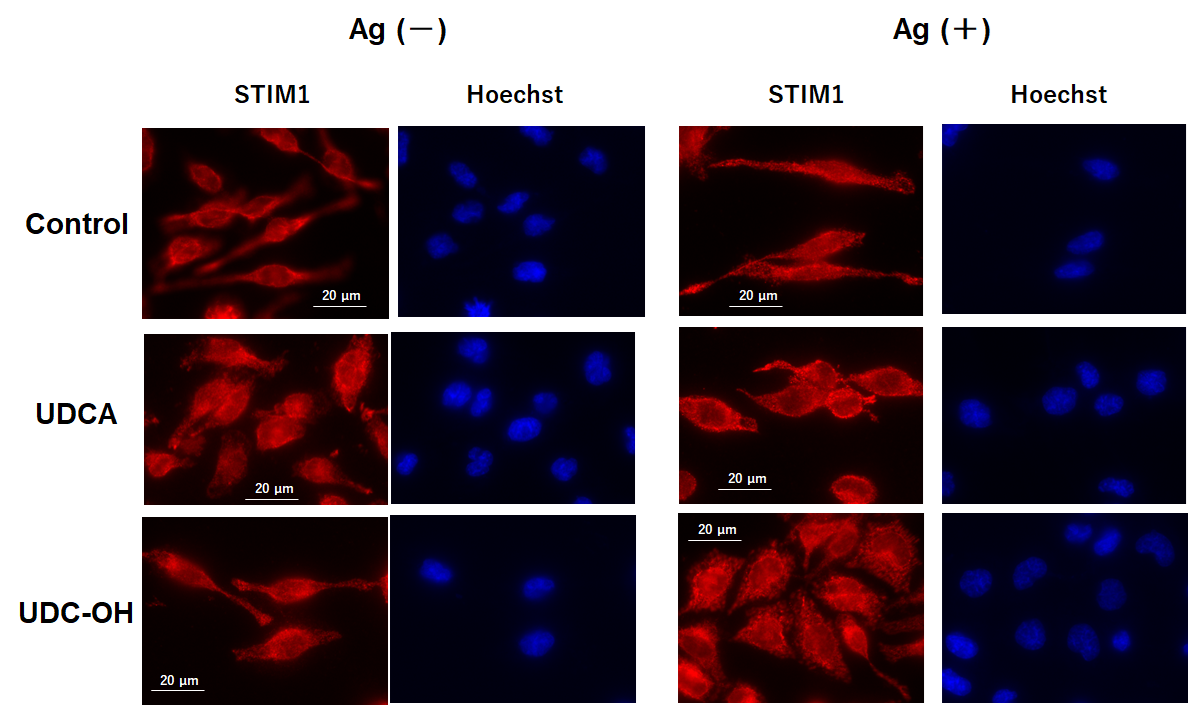 Fig. 7.
UDCA and UDC-OH did not inhibit antigen antibody-induced stromal interaction molecule 1 (STIM1) aggregation. Immunofluorescence analysis of STIM1 in RBL-2H3 cells treated with UDCA or UDC-OH. Treatment and Staining: Sensitized cells were pretreated with UDCA (250 µM) or UDC-OH (30 µM) and then stimulated with DNP-BSA. Cells were fixed, permeabilized, blocked, and immunostained with anti-STIM1 antibody and Alexa Fluor™ 594-conjugated secondary antibody. Imaging: Images were captured using a fluorescence imaging microscope (BZ-X810, KEYENCE, Osaka, Osaka, Japan). Scale bar, 20 µm. Detailed experimental procedures are provided in the Methods and Materials section.
The inhibitory mechanism likely acts downstream of STIM1 activation, consistent with interference at the Orai1/TRPC channel level and SOC function.
Initially, bile acids had hydrophilic and hydrophobic portions; therefore, they were amphipathic in nature. Taurine- and glycine-conjugated bile salts (TC, TCDC, TDC, GC, GCDC, and GDC) were more hydrophilic than unconjugated bile acids. However, they also had weak but significant inhibitory effects (10–37%) on the degranulation of stimulated RBL-2H3 cells with Ag-Ab and Tg (Supplementary Fig. 3).
These results support the hypothesis that bile acid and alcohol steroid nuclei inhibit the degranulation of activated RBL-2H3 cells.
We synthesized bile acid-biotin derivatives because the inhibitory effect of bile acid and bile alcohol on degranulation is likely derived from the hydroxylated steroid nucleus. Fig. 2 shows the synthetic route in which the carboxyl group [1] is converted to an amido group [3] after adding biotin [4].
C-biotin, UDC-biotin, CDC-biotin, DC-biotin, biotin derivatives of the four bile acids, CA, UDCA, CDCA, and DCA, exerted similar inhibitory effects on degranulation following stimulation (Ag–Ab, Tg, and A23187) (Fig. 8). These results indicate the significance of the structure of the steroid nucleus in the inhibition of degranulation.
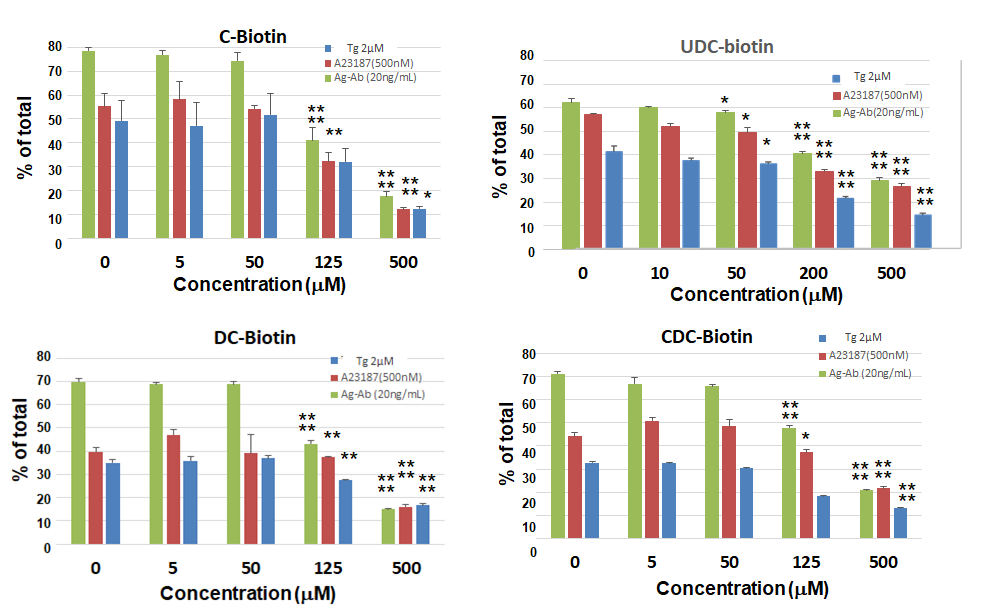 Fig. 8.
Bile acid-biotin derivatives also inhibit histamine release.
Degranulation assay of RBL-2H3 cells treated with biotinylated bile acid
derivatives. Treatment and Stimulation: Sensitized cells were pretreated
with C-biotin, UDC-biotin, CDC-biotin, or DC-biotin and stimulated with DNP-BSA
(20 ng/mL). Non-sensitized cells were treated similarly and stimulated with Tg (2
µM) or A23187 (0.5 µM). Assay:
Orai1 protein exists in lipid rafts that form the CRAC channel. Fig. 3 shows a scheme for lipid raft fractionation and bile acid-binding lipid raft protein purification. The lipid raft and detergent-resistant membranes were solubilized with less degeneration using the ULTRARIPA B buffer from the ULTRARIPA® Kit for Lipid Raft, and the supernatant contained the lipid raft fraction after centrifugation. The supernatant was incubated with MagCapture™ Tamavidin®2-Rev, which binds to the bile acid biotin derivative via biotin overnight at 4 °C. Protein binding to the bile acid biotin derivative was eluted with a 0.2 M biotin solution (Fig. 3). Samples treated with bile acid derivatives showed a band of approximately 50 kDa. Therefore, an anti-Orai1 antibody was used for western blotting, and each derivative bound to Orai1, although the amount varied (Fig. 9). The binding of Orai1 to each bile acid derivative may induce bile acid and bile alcohol inhibitory effects on degranulation.
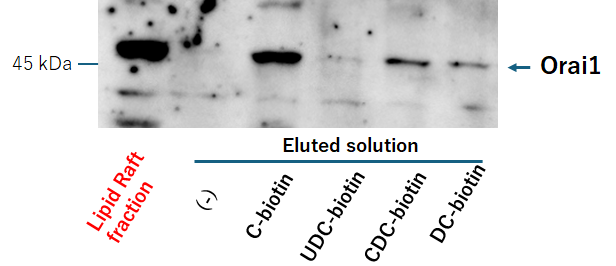 Fig. 9.
Bile acid-biotin derivative binds to Orai1. Analysis of proteins bound to bile acid biotin derivatives in lipid raft fractions. Lipid raft fractions were incubated with MagCapture™ Tamavidin®2-Rev beads bound to the indicated bile acid biotin derivatives. Proteins bound to the derivatives were eluted with biotin and analyzed by SDS-PAGE and western blotting (the procedure shown in Fig. 3). Detailed experimental procedures are provided in the Methods and Materials section.
As bile acid biotin derivatives can bind to the Orai1 protein, this binding site is probably involved in Ca2+ entry. To investigate the inhibitory site, RBL-2H3 cells were pretreated overnight with an anti-Orai1 antibody against the extracellular loop between TM3 and TM4 (C-KKQPGQPRPTSKP). The results showed that CDC- and DC-OH induced the inhibition of Ag–Ab- and Tg-induced degranulation was not observed in anti Orai1 antibody-sensitized cells. Moreover, C- and UDC-OH-induced inhibition of Ag–Ab- and Tg-induced degranulation were observed in anti Orai1 antibody-sensitized cells (Fig. 10). This result indicates that the CDC- and DC-OH steroidal structure binding site of Orai1 is within the TM3–TM4 extracellular loop, and the C- and UDC-OH steroidal structure binding site is not an anti-Orai1 antibody binding site within TM3–TM4, but may reside in the TM1–TM2 extracellular loop.
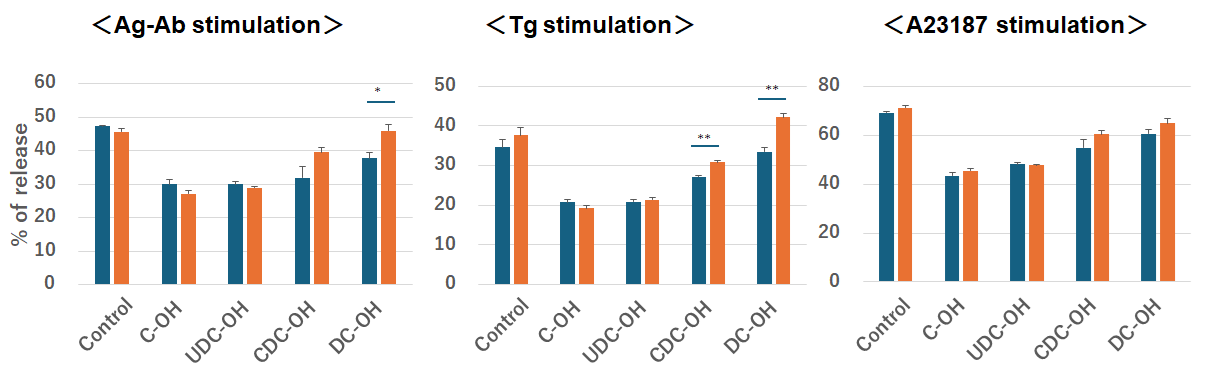 Fig. 10.
Bile alcohol binding sites to Orai1 is not anti-Orai1 antibody
against the extracellular loop between transmembrane (TM)3 and TM4 binding sites.
Effect of anti-Orai1 antibody on degranulation of RBL-2H3 cells treated with
bile alcohols. Treatment: Cells were incubated overnight with anti-Orai1
antibody targeting the extracellular loop between TM3 and TM4. Anti-Orai1
antibody-treated (orange bars) and untreated (blue bars) cells were pretreated
with the indicated bile acids or bile alcohols and then stimulated with Ag-Ab (20
ng/mL), Tg (2 µM), or A23187 (0.5 µM) for 15 min. Assay:
Steroid hormones, which are widely used as antiallergic drugs, can effectively inhibit histamine release by 60–80% [13, 14]. UDCA, which is widely used to treat liver disease symptoms, exerts an immunosuppressive effect by binding to the glucocorticoid receptor, similar to steroid hormone drugs [15].
We investigated whether four bile acids and their reduced forms, four C24 bile
alcohols, inhibit the degranulation of stimulated RBL-2H3 cells in a manner
similar to that of steroid hormones, which can also effectively inhibit
degranulation. Similar to the findings of Kim et al. [19], our results
revealed that UDCA reduced
In this study, the calcium ionophore A23187 was used to stimulate RBL-2H3 cells. Like ionomycin, which affects both calcium-induced calcium release and store-operated calcium entry [33], A23187 initially releases calcium from the endoplasmic reticulum, allowing subsequent calcium influx via Orai1 and TRPCs, similar to Tg. A23187 then forms a complex with entering Ca2+, inhibiting plasma membrane Ca2+-ATPases activity and abolishing its function. This explains why the effects of A23187 resemble those of Tg.
Furthermore, the steroid nuclei of bile acids and alcohols may significantly influence this inhibitory effect. Therefore, we biotinylated the side chain and examined the inhibitory effect of bile acid-biotin derivatives on degranulation, which was similar to that of bile alcohols (Fig. 8). The protein Orai1, to which this bile acid biotin derivative binds (Fig. 9) may be the main agent responsible for this inhibitory effect.
Blocking the extracellular loop of TM3–TM4 with the anti-Orai1 antibody could relieve the inhibitory effects of CDC- and DC-OH, suggesting that this antibody binding site of loop of TM3–TM4 has this inhibitory effect. The same blockage did not relieve the inhibitory effects of C- and UDC-OH (Fig. 10), suggesting that either other regions of the TM3-TM4 loop or another extracellular loop, TM1–TM2, may have an inhibitory effect. Bile alcohols were used to evaluate the antibody effect, as they are known to interact more strongly with Orai1 proteins than bile acids (Fig. 6).
The Orai1 channel is formed from a hexamer of six Orai1 subunits [34], has a Ca2+ selective filter formed by a glutamate side chain ring (Glu106 in human Orai1) [35, 36], and has a calcium-accumulating region, CAR (Asp110, Asp112, and Asp114 in human Orai1), that enhances the local extracellular Ca2+ concentration [37]. Glu and Asp residues, as well as bile acids, are negatively charged. Our results show that bile acids completely inhibit Ca2+ influx from outside the cells (Fig. 4), indicating inhibition of Ca2+ entry via Orai1. Interaction analysis (Fig. 6) suggests that the steroidal structure of bile acids can interact with Orai1. However, bile acids do not inhibit influx through activated Orai1 and TRPCs (Fig. 5), implying that the interaction between bile acids and Orai1 is relatively weak. This limited interaction may be due to electrostatic repulsion between the negatively charged extracellular loop between TM1 and TM2 and the carboxylate groups of bile acids. Taken together, these observations suggest that while bile acids are capable of partially interacting with Orai1, the strength of this interaction, including the repulsive forces, is possibly a key factor distinguishing their effect from the inhibitory effect of bile alcohols.
The inhibitory mechanisms by which bile acids and bile alcohols modulate mast cell activation are distinct from those of glucocorticoids, operating instead through suppression of Ca2+ influx via Orai1 channels. Their clinical applicability, however, is constrained by a narrow therapeutic window between efficacious concentrations and those exerting detergent-like cytotoxicity. Nonetheless, the recognition of Orai1 as a bile acid–sensitive Ca2+ channel provides a mechanistic basis for the rational development of novel anti-allergic therapeutics with enhanced selectivity and potency.
In this study, we investigated the inhibitory effects of bile acids and alcohols on the degranulation of stimulated RBL-2H3 cells. This inhibitory effect is likely induced by the binding of the nucleus structure of bile acids and alcohols to Orai1 and inhibiting Ca2+ influx. However, the use of bile acids and alcohols as anti-allergic drugs is difficult because their concentrations for degranulation inhibition are high and are adjacent to those for the detergent effect. These findings provide a mechanistic basis for designing drugs that regulate calcium influx via Orai1.
All data points generated or analyzed during this study are included in this article, and no further underlying data is needed to reproduce the results.
MY designed the research study. MY, AT, YI, NI, and FT performed the research and analyzed the data. YY had substantial contributions to analysis, and interpretation of microscopic data. KO advised regarding experiments, and had substantial contributions to analysis, and interpretation of data. All authors contributed to the editorial changes in the manuscript. All the authors have read and approved the final version of the manuscript. All authors participated sufficiently and agreed to be accountable for all aspects of the study.
Not applicable.
Part of this study was conducted at the Natural Science Center for Basic Research and Development at Hiroshima University. We would like to thank Editage (https://www.editage.jp) for English language editing.
A part of this research, Tamavidin-related experiments were funded by JT, grant number A1600134.
The authors declare no conflict of interest.
Supplementary material associated with this article can be found, in the online version, at https://doi.org/10.31083/FBL44504.
References
Publisher’s Note: IMR Press stays neutral with regard to jurisdictional claims in published maps and institutional affiliations.