


 , Pengyu Zhang 3,*
1 Department of Pathology, Shaanxi Provincial People’s Hospital, 710068 Xi’an, Shaanxi, China
2 Department of Pathology, The Second Hospital of Tianjin Medical University, 300211 Tianjin, China
3 Department of Blood Transfusion, Tianjin Medical University Cancer Institute & Hospital, National Clinical Research Center for Cancer, Tianjin’s Clinical Research Center for Cancer, Key Laboratory of Cancer Prevention and Therapy, Tianjin, 300060 Tianjin, China
Abstract
Bladder cancer (BCa) is a highly heterogeneous malignancy, and precision treatment remains challenging. Identifying molecular biomarkers and risk factors is essential for improving prognosis and therapeutic strategies.
We integrated expression quantitative trait loci (eQTL) data with Mendelian randomization (MR) analysis to identify candidate risk genes associated with BCa. Subsequently, a prognostic risk model was developed using machine learning methods to explore its correlation with molecular features, immune cell infiltration, and ferroptosis-related pathways. Based on these findings, the Tripartite Motif Containing 59 (TRIM59) protein was selected for further experimental validation. The functional role of TRIM59 in BCa progression was further investigated using MTT assays in BCa cell lines. Additionally, western blotting (WB) was conducted to confirm the potential association between TRIM59 expression and ferroptosis regulation.
The risk model identified distinct signaling pathways that differentiate the high-risk and low-risk BCa groups. The low-risk group demonstrated greater infiltration of CD8+ T cells. Conversely, the high-risk group exhibited enhanced immune evasion, as evidenced by increased infiltration of macrophages and fibroblasts. Furthermore, TRIM59 exerts a regulatory influence on ferroptosis progression in BCa by modulating key genes involved in this process, including Solute Carrier Family 7 Member 11 (SLC7A11), Glutathione Peroxidase 4 (GPX4), and Acyl-CoA Synthetase Long Chain Family Member 4 (ACSL4).
Our integrative approach highlights the potential of genomic and immune microenvironment data in developing personalized risk models for BCa, offering insights into individualized treatment strategies. Importantly, TRIM59 is involved in ferroptosis resistance in BCa. These findings have potential implications for identifying diagnostic biomarkers and therapeutic targets for BCa treatment.
Keywords
- BCa
- MR
- immune
- TRIM59
- biomarkers
- ferroptosis
Bladder cancer (BCa) is one of the most prevalent malignancies affecting the urinary system and is particularly common among men worldwide [1]. The development of BCa is influenced by a combination of environmental and genetic factors, with well-established risk factors including smoking, chronic bladder inflammation, and exposure to certain chemicals, such as aromatic amines [2]. BCa is primarily categorized into two types: non-muscle-invasive bladder cancer (NMIBC) and muscle-invasive bladder cancer (MIBC), with NMIBC accounting for the majority of cases [2]. Early diagnosis and timely intervention are critical for improving patient survival outcomes. Standard treatment modalities include surgical resection, intravesical therapy, radiotherapy, and chemotherapy. Although conventional treatment approaches have demonstrated some effectiveness, the prognosis for advanced-stage BCa, especially in patients with MIBC, remains unsatisfactory, and the development of more effective therapeutic strategies continues to pose significant clinical challenges [3, 4, 5]. The optimal selection and application of immunotherapy regimens remain important clinical challenges that warrant further research [6].
The development of BCa is governed by a range of molecular mechanisms, among which gene mutations, epigenetic modifications, and remodeling of the tumor microenvironment serve as key driving forces [7, 8]. Frequently mutated genes in BCa include Tumor Protein P53 (TP53), Fibroblast Growth Factor Receptor 3 (FGFR3), and RB Transcriptional Corepressor 1 (RB1), and alterations in these genes are strongly linked to tumor initiation, progression, and therapeutic response. Notably, TP53 mutations are recognized as a critical pathogenic event in BCa progression [9]. Furthermore, BCa exhibits distinct epigenetic profiles, such as aberrant DNA methylation and histone modifications, which play a significant role in tumor aggressiveness and patient prognosis [10]. Central to this process are immune evasion mechanisms, primarily mediated through suppression of T cell activity and the accumulation of immunosuppressive cell populations, including regulatory T cells (Tregs) and myeloid-derived suppressor cells (MDSCs) [11]. High expression levels of immune checkpoint molecules, such as Programmed Cell Death 1 (PD-1) and CD274 Molecule (PD-L1), in BCa cells contribute to immune escape, thereby promoting tumor growth and metastasis. In recent years, immunotherapeutic approaches, particularly PD-1/PD-L1 inhibitors, have demonstrated clinical promise in the treatment of BCa, especially in advanced-stage patients [12]. Previous studies have indicated that increased expression of SLC7A11 promotes resistance to ferroptosis in BCa by modulating glutathione metabolism. Moreover, research has found that inhibiting GPX4 can restore sensitivity to chemotherapy in BCa cells that are resistant to ferroptosis. Despite these advances, not all patients exhibit a positive response to immunotherapy, suggesting that the tumor’s immunological landscape and its underlying molecular characteristics play a crucial role in determining treatment effectiveness. Consequently, a deeper understanding of the molecular pathways and immune escape mechanisms in BCa is vital for developing more precise, individualized therapies and improving patient outcomes. Through the application of multi-omics approaches, subtype-specific therapeutic targets have been identified in MIBC, with the basal-like subtype showing significant enrichment in genes related to immune checkpoints and ferroptosis.
This study integrates expression quantitative trait loci (eQTL) data with Mendelian randomization (MR) analysis to identify risk genes associated with BCa. Furthermore, a prognostic risk model for BCa is developed using machine learning techniques. Through comprehensive analyses of gene expression and biomarkers, we investigate the relationships between the risk model and BCa subtypes, immune cell infiltration, chemotherapy drug sensitivity, as well as evaluate the model’s accuracy and prognostic value. Our findings offer valuable insights that may contribute to more precise classification and tailored treatment strategies for BCa patients.
Gene expression and clinical information for BCa were obtained from The Cancer
Genome Atlas (TCGA) database (https://portal.gdc.cancer.gov/), comprising 412 BCa
samples together with their associated clinical details. Furthermore, gene
expression profiles and clinical data for an additional 476 cases of urothelial
carcinoma (E-MTAB-4321) were also gathered. eQTL data were downloaded from the
IEU OpenGWAS initiative (https://gwas.mrcieu.ac.uk/), covering a total of 19,942
genes (Supplementary Table 1). Single Nucleotide Polymorphisms (SNPs)
with a p-value threshold of less than 5
This research employed the “TwosampleMR” R package (v0.5.6). To minimize any potential effects of linkage disequilibrium and ensure instrumental variables (IVs) independence, the clustering function was set with parameters r2 = 0.1 and kb = 10,000, specifically for European populations. Prior to conducting the MR analysis, palindromic SNPs were removed. For each SNP, Wald ratio estimates were calculated to generate estimates unaffected by confounding factors. Subsequently, a meta-analysis was conducted using several approaches.
The R packages ‘survival’ and ‘survminer’ (v4.1-8, v0.4.9) were employed. Univariate Cox regression analysis was conducted using the coxph function to pinpoint genes that had a significant impact on the prognosis of BCa patients. These identified genes were then cross-referenced with the eQTL genes obtained from Mendelian randomization analysis, ultimately yielding a refined list of genes used for model construction. Using the selected prognostic features, we built a machine learning-based prognostic model. Machine learning algorithms, including Lasso combined with StepCox, survival-SVM, CoxBoost paired with survival-SVM, Ridge regression, Lasso combined with survival-SVM, and SuperPC, were assessed to determine the most effective model and its corresponding riskScore for predicting patient outcomes. Additional details about the classifiers and algorithms used are provided (Supplementary Table 2).
Functional enrichment analysis was conducted using configuration files including “c2.cp.kegg_legacy.v2024.1.Hs.symbols.gmt”, “c5.go.v2024.1.Hs.symbols.gmt”, and “h.all.v2024.1.Hs.symbols.gmt”, implemented through the GSEA function. The ssGSEA enrichment analysis for both groups was carried out utilizing the ‘limma’ (v3.58.1), ‘GSEABase’ (v1.60.0), and ‘GSVA’ (v1.46.0) packages. Pathway ssGSEA scores were calculated using the ‘gsva’ function and subsequently normalized with the ‘normalize’ function. To delve deeper into the association between sample riskScores and pathway ssGSEA scores, a Spearman correlation analysis was conducted. Additionally, a collection of 12 BCa signature features was assembled, and GSVA analysis was applied to all 412 samples. The results were visualized employing the ‘ggridge’ package.
BCa can be classified into distinct molecular subtypes using various methods, such as Cartes d’Identité des Tumeurs (CIT), Lund, MD Anderson Cancer Center (MDA), TCGA, Baylor, University of North Carolina (UNC), and Consensus [13, 14, 15, 16, 17, 18]. In this study, we performed subtype classification of 412 BCa samples using the “ConsensusMIBC” (v1.1.0) and “BLCAsubtyping” (v2.1.1) R packages [19]. The molecular subtypes were subsequently analyzed by comparing different groups.
Specifically, to evaluate immune cell infiltration, we utilized several algorithms including Quantiseq, Timer, Mcp_counter, Xcell, Cibersort, and Epic, which were implemented through the “immunedeconv” (v2.1.0) R package. Additionally, ssGSEA was applied using previously established gene signatures specific to immune cell types [20]. To evaluate tumor purity, the “estimate” R package was used. Additionally, Tumor Immune Dysfunction and Exclusion (TIDE) scores were computed for a cohort of 412 BCa patients using an online platform developed [21]. These scores serve as important indicators of immunotherapy response, with elevated TIDE values suggesting a stronger ability of tumor cells to evade immune detection. Differences in TIDE scores between groups were analyzed using the Wilcoxon rank-sum test (‘wilcox.test’).
Genetic variation characteristics within the TCGA-BLCA were analyzed by R package ‘maftools’ (v2.18.0). To visualize the genetic alterations, Single Nucleotide Variation (SNV) waterfall plots and gene co-mutation heatmaps were generated.
Subsequently, a correlation analysis was conducted between drug sensitivity and the riskScore, as the criterion for statistical significance, implemented through the “pRRophetic” R package (v0.5) [22].
The BCa cell lines 5637 and EJ were provided by the Tianjin Medical University. The cell cultures were kept in a humidified environment containing 5% carbon dioxide (37 °C). All cell lines were validated by STR profiling and tested negative for mycoplasma.
Proteins were extracted from cell lysates, and their concentrations measured with a Bicinchoninic Acid Assay (BCA) protein assay kit. Subsequently, 35 µg of protein per sample was subjected to sodium dodecyl sulfate polyacrylamide gel electrophoresis (SDS-PAGE). Protein expression levels were evaluated using primary antibodies targeting TRIM59, SLC7A11, GPX4, ACSL4, and GAPDH, each at a dilution of 1:1000 (Abcam, Waltham, MA, USA). Ultimately, the protein bands were evaluated and converted into digital format using ImageJ software (v154-win-java8, Bethesda, MD, USA).
EJ and 5637 cells were transfected using a variety of reagents, including a negative control siRNA, two distinct siRNAs targeting TRIM59 (siRNA-1 and siRNA-2), an empty vector (Ev), and two wild-type TRIM59 expression constructs (WT1 and WT2), and then cultured for a period of 48 hours. Following this, around 2500 cells were plated into each well of a 96-well plate and allowed to incubate at 37 °C for a duration of 1 to 4 days. At predetermined time points each day, 30 µL of MTT solution was added to each well, and the plate was further incubated at 37 °C for 2 hours. Once the MTT solution was removed, 150 µL of DMSO was added to each well, followed by an additional incubation period of 15 minutes at 37 °C.
BCa cells were cultured in 6-well plates. Following a 24-hour incubation period, a negative control siRNA, siRNA-1 and siRNA-2, Ev, or WT1 and WT2 were introduced into the system. A 10-µL pipette tip was then used to create a linear wound across the center of each well. The cells were subsequently rinsed thoroughly and returned to the incubator for an additional 24 to 72 hours. Images of the cell migration were captured at 0, 24, and 72 hours post-treatment using a microscope.
EJ and 5637 cells were introduced into negative control siRNA, siRNA-1 and siRNA-2, Ev, or WT1 and WT2. Subsequently, 20,000 cell were seeded into transwell inserts and were incubated for 48 hours at 37 °C under standard culture conditions. After incubation, the chambers were rinsed twice with PBS. The cells fixed with paraformaldehyde, followed by two additional PBS washes.
Female BALB/c nude (immunocompromised) mice were used in the study. The animals
were 6–8 weeks old and weighed 18–22 g. The injection was administered
subcutaneously on the right lower abdominal side. The injection volume was
adjusted to 100 µL, with a 1:1 ratio of Matrigel to medium, which
included 2
A total of 19,942 genes were examined using eQTL analysis, with significant
eQTLs identified through p-value thresholding and clumping techniques.
Following this, F-statistics-based filtering and ID conversion were employed,
resulting in the retention of 15,307 eQTLs, which included gene names, and 52,674
SNPs, providing comprehensive coverage of the genome (Supplementary Table
2). Subsequently, each eQTL-associated SNP was compared to BCa GWAS data,
yielding a final set of 49,823 SNPs. All retained SNPs demonstrated strong
instrument validity with F-statistics exceeding 10. A total of 15,035 genes were
included in the MR analysis (Supplementary Table 3). A total of 313
genes were found to be significantly associated with BCa based on
Inverse-Variance Weighted (IVW) analysis. Among these genes, 170 were linked to a
higher risk of BCa (OR
| Exposure | Outcome | Method | nsnp | OR | p-value |
| SHROOM4 | BCa | IVW | 3 | 2.282725735 | 0.002874680 |
| IGHG4 | BCa | IVW | 3 | 2.212232996 | 0.007854922 |
| MXD4 | BCa | IVW | 4 | 2.211653888 | 0.001252362 |
| CHD3 | BCa | IVW | 3 | 2.177813144 | 0.002600537 |
| TUBB4B | BCa | IVW | 3 | 2.006432255 | 0.010138824 |
| ATP6V0C | BCa | IVW | 3 | 1.844112493 | 0.035992092 |
| SNX13 | BCa | IVW | 3 | 1.749801894 | 0.003751934 |
| CCNDBP1 | BCa | IVW | 3 | 1.725627987 | 0.020568438 |
| ISY1 | BCa | IVW | 4 | 1.686991123 | 0.038477973 |
| ZNF644 | BCa | IVW | 3 | 1.679697555 | 0.044952987 |
| PAFAH1B3 | BCa | IVW | 3 | 1.675820497 | 0.015235574 |
| ADRA2A | BCa | IVW | 5 | 1.668737363 | 0.007811729 |
| KIRREL3 | BCa | IVW | 3 | 1.653559093 | 0.011245868 |
| ZNF254 | BCa | IVW | 3 | 1.628996476 | 0.030128596 |
| OXSR1 | BCa | IVW | 5 | 1.621258359 | 0.008803783 |
| JUND | BCa | IVW | 3 | 1.595327921 | 0.020217129 |
| SLC2A3 | BCa | IVW | 3 | 1.573354989 | 0.028600952 |
| EBF1 | BCa | IVW | 9 | 1.567697269 | 0.026571650 |
| DENND2C | BCa | IVW | 3 | 1.529153776 | 0.005074320 |
| AGPAT1 | BCa | IVW | 4 | 1.518592588 | 0.002107553 |
| SLC12A9 | BCa | IVW | 4 | 1.517706490 | 0.000716704 |
| GPR183 | BCa | IVW | 4 | 1.502956961 | 0.044233749 |
| LIPH | BCa | IVW | 5 | 1.493282379 | 0.008303005 |
| CAPN5 | BCa | IVW | 5 | 1.491629797 | 0.006488212 |
| MST1 | BCa | IVW | 4 | 1.486326594 | 0.043811420 |
| AKR7A3 | BCa | IVW | 3 | 1.464063269 | 0.029710515 |
| UBALD2 | BCa | IVW | 3 | 1.463006629 | 0.026593285 |
| CFH | BCa | IVW | 7 | 1.430153681 | 0.025987911 |
| PDGFRB | BCa | IVW | 7 | 1.416422219 | 0.008498805 |
| LYL1 | BCa | IVW | 5 | 1.410700163 | 0.024353035 |
| CHIT1 | BCa | IVW | 4 | 1.410424624 | 0.004675523 |
| TOR2A | BCa | IVW | 3 | 1.408130191 | 0.047575015 |
| LRMDA | BCa | IVW | 7 | 1.398522837 | 0.039392456 |
| TXNDC16 | BCa | IVW | 3 | 1.390219142 | 0.047665048 |
| ZER1 | BCa | IVW | 5 | 1.389190778 | 0.030827892 |
| CCDC117 | BCa | IVW | 4 | 1.386048300 | 0.003798672 |
| TRIM51BP | BCa | IVW | 4 | 1.381350065 | 0.044375130 |
| ZNF93 | BCa | IVW | 3 | 1.359740799 | 0.047631251 |
| CYP2E1 | BCa | IVW | 3 | 1.355640630 | 0.032567057 |
| RAB11A | BCa | IVW | 7 | 1.346870088 | 0.030646713 |
| ZNF101 | BCa | IVW | 3 | 1.344689384 | 0.025154497 |
| KIR2DL1 | BCa | IVW | 4 | 1.342334528 | 0.028900689 |
| RIPK3 | BCa | IVW | 4 | 1.340880155 | 0.033160539 |
| GPR108 | BCa | IVW | 4 | 1.327089726 | 0.012373898 |
| B4GALT3 | BCa | IVW | 13 | 1.326277866 | 0.001747056 |
| FAM53C | BCa | IVW | 8 | 1.322251690 | 0.023944002 |
| LSM8 | BCa | IVW | 4 | 1.312782793 | 0.000018383 |
| HDGF | BCa | IVW | 6 | 1.312375898 | 0.019868296 |
| ZNF90 | BCa | IVW | 3 | 1.310915264 | 0.044349693 |
| ECHS1 | BCa | IVW | 3 | 1.307398168 | 0.020623222 |
eQTL, expression quantitative trait loci; GWAS, genome-wide association study; MR, Mendelian randomization; BCa, Bladder cancer; nsnp, number of snps; OR, odds ratio; IVW, Inverse-Variance Weighted.
Using univariate Cox regression analysis, we examined the association between TCGA BCa RNA expression and patient prognosis, identifying 5331 prognostically relevant genes (Supplementary Table 6). By intersecting the hazard ratios (HR) and odds ratios (OR) of risk genes derived from both unicox and MR analyses, we identified 34 genes significantly linked to BCa. Among these, 24 were classified as high-risk genes, while 10 were protective genes for BCa (Fig. 1A,B, Supplementary Table 7). The genomic locations of these 34 genes are depicted in a chromosomal circular plot (Fig. 1C). MR analysis suggested that the eQTLs of these genes may be significantly associated with BCa prognosis (Fig. 1D). We conducted machine learning analysis on gene expression data from the TCGA and E-MTAB-4321 datasets, employing 101 algorithms to build predictive models and score each sample across all methods (Supplementary Tables 8,9). Model validation using the concordance index (C-index) demonstrated that the plsRcox method attained the highest C-index value (Fig. 1E).
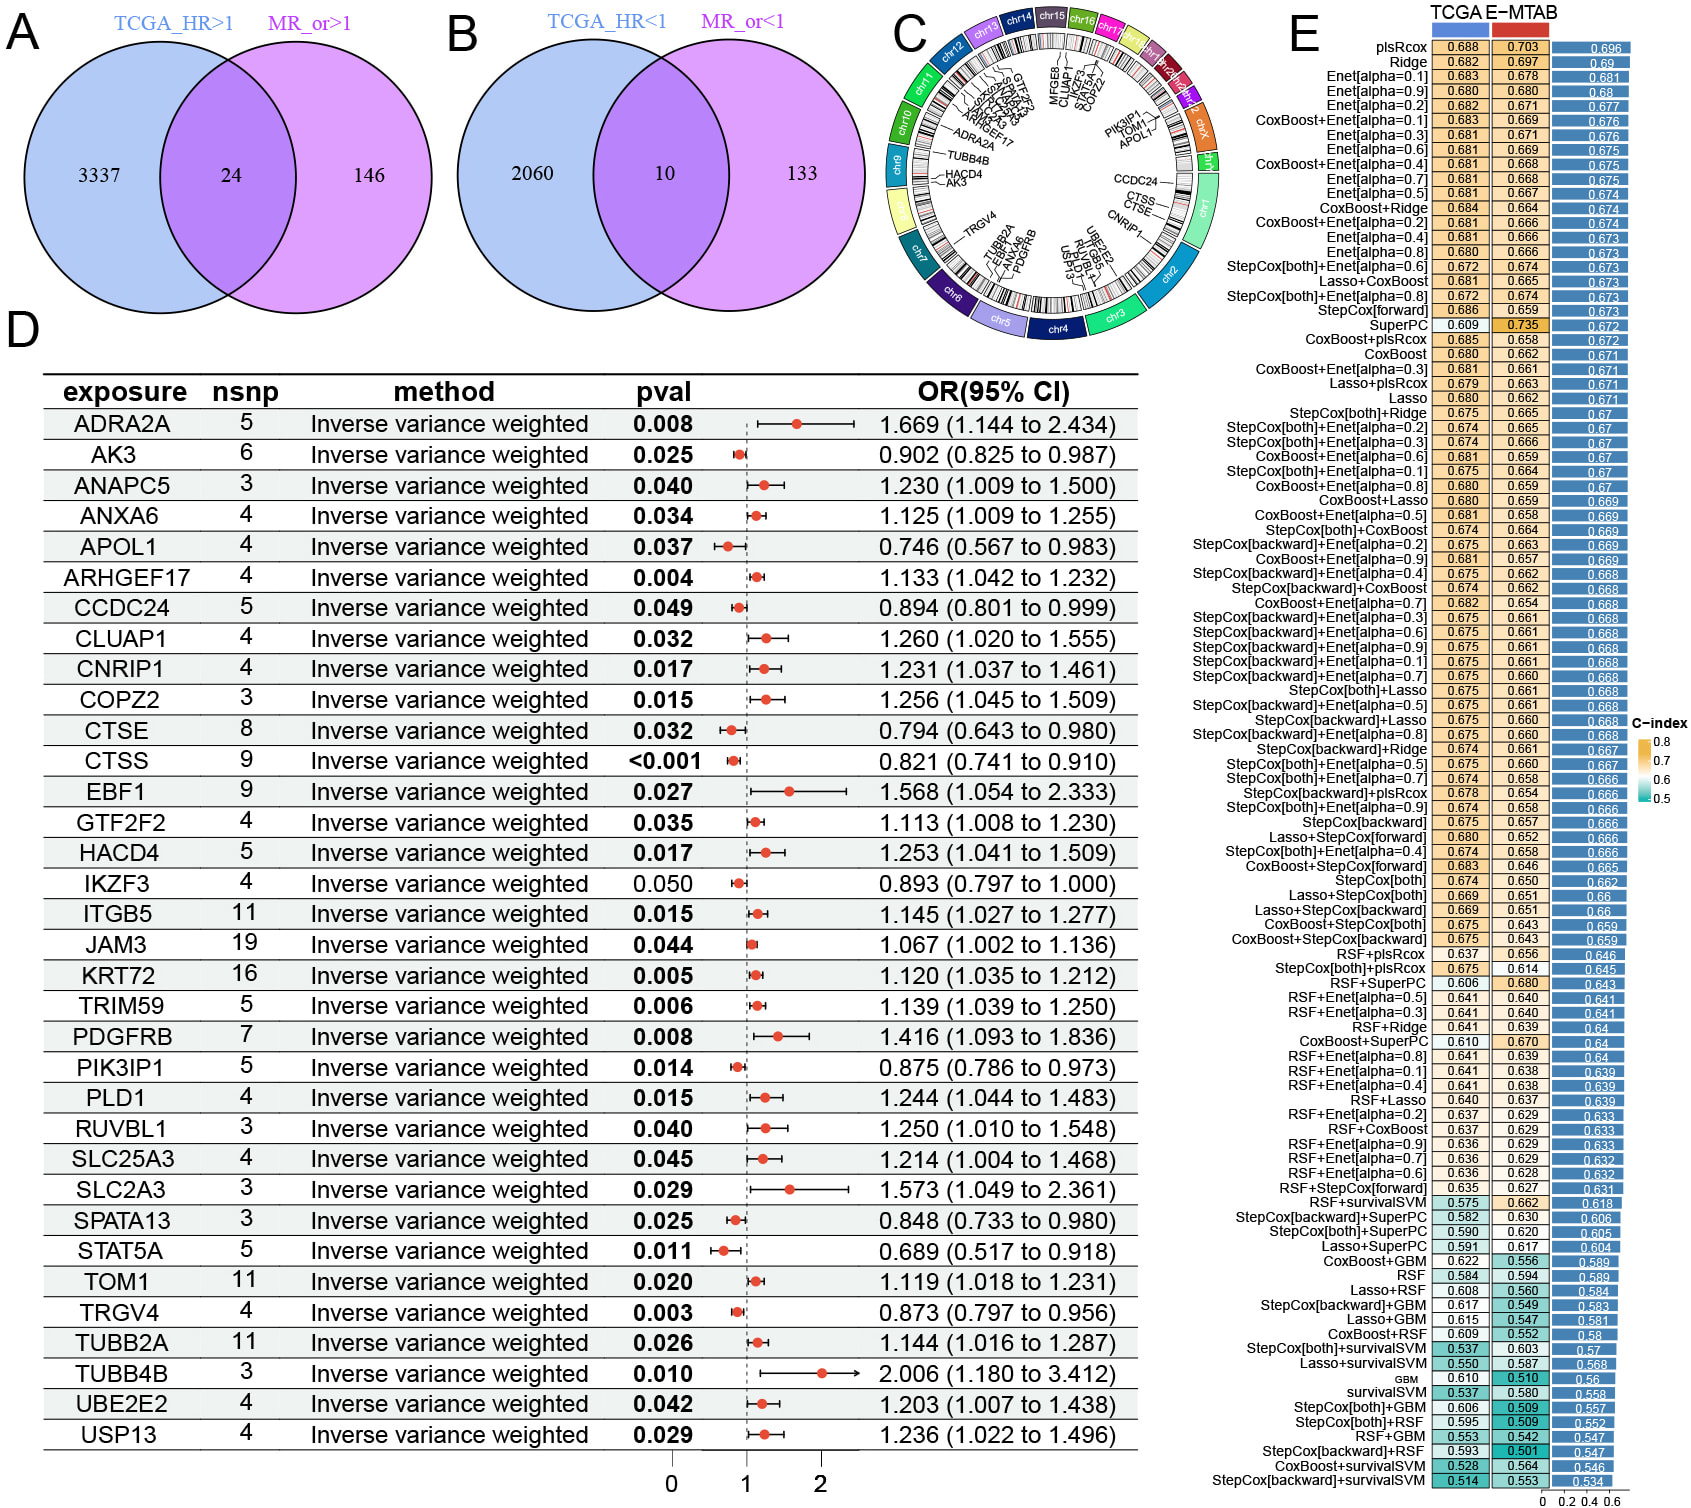 Fig. 1.
Candidate gene screening and machine learning model construction. (A,B) Intersection of genes were identified by selecting MR risk genes and unicox prognostic genes. (C) The genomic locations of each feature gene on the chromosome. (D) MR analysis results of eQTL for intersection genes in BCa. (E) Analysis results of intersection genes using 101 machine learning methods in TCGA and E-MTAB-4321.
The plsRcox-derived model was selected as our predictive model. Patients in the
TCGA cohort were classified into low-risk and high-risk groups based on the
optimal cutoff value of the riskScore. The survival outcomes for patients in the
high-risk group were notably worse compared to those in the low-risk group (Fig. 2A, Supplementary Table 10). The clinical risk model
incorporated variables such as pathological stage, gender, and age. Its
predictive performance was evaluated through ROC curve analysis, which
demonstrated that the riskScore exhibited greater predictive accuracy compared to
conventional clinical indicators, including pathological stage (Fig. 2B).
Furthermore, the riskScore demonstrated effectiveness in forecasting patient
probabilities at 1-year, 3-year, and 5-year intervals (Fig. 2C). The Concordance
Index (C-index) was further utilized to assess the model’s predictive
performance, confirming that the riskScore offers reliable and consistent
survival predictions (Fig. 2D). When validated using the E-MTAB-4321 dataset, the
high-risk group again exhibited significantly poorer survival outcomes than the
low-risk group (Fig. 2E, Supplementary Table 10).
Additionally, riskScore showed excellent predictive performance in the
E-MTAB-4321 cohort (Fig. 2F–H). Univariate analysis of age, gender, pathological
stage, and riskScore confirmed that plsRcox effectively distinguishes between
patients with different prognoses (Fig. 2I,K). Multivariate regression analysis,
adjusted for age, gender, and pathological stage, confirmed that riskScore
significantly predicts patient survival (HR
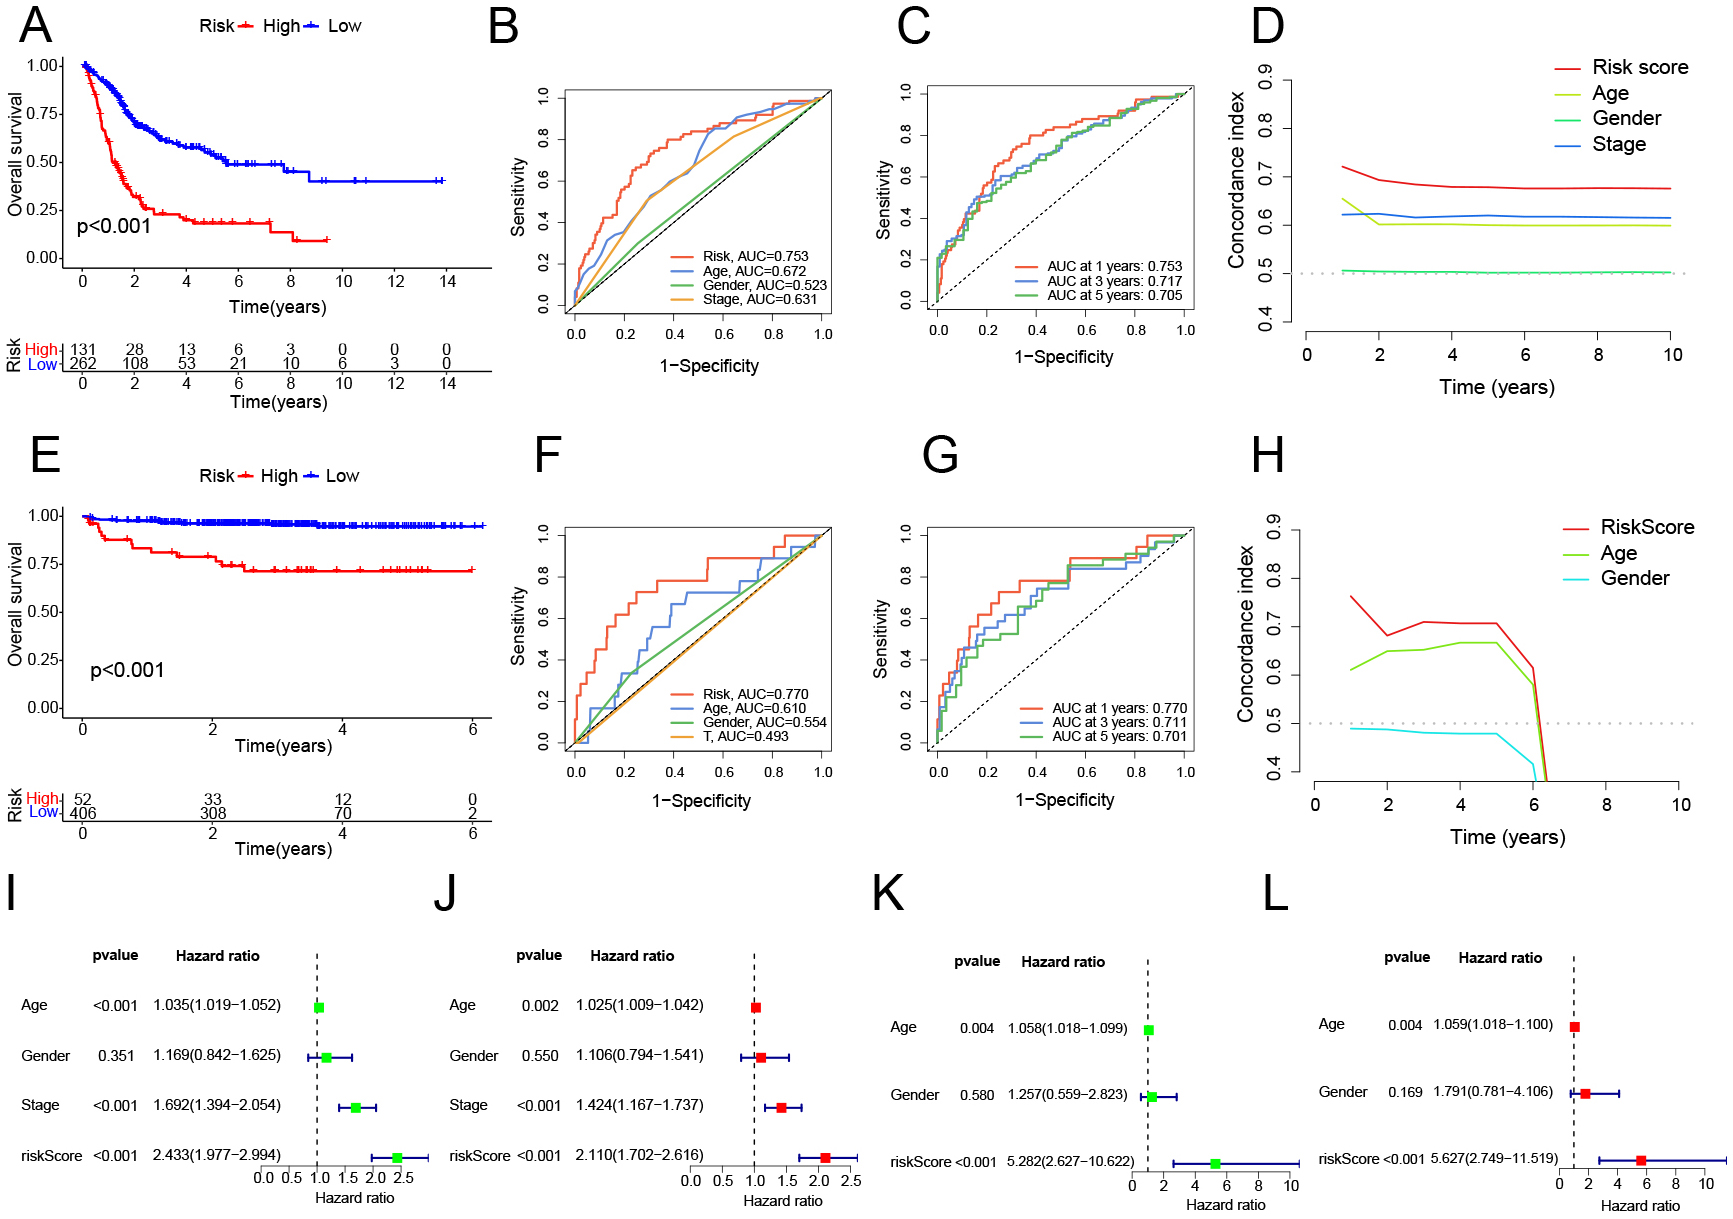 Fig. 2.
Survival analysis and accuracy validation using the plsRcox method. (A,E) Survival curves between high-risk and low-risk groups in TCGA and E-MTAB-4321. (B,C,F,G) ROC curves for different clinical indicators and risk models at different time points in TCGA and E-MTAB-4321, with higher AUC values indicating greater predictive accuracy of the model. (D,H) C-index for different clinical indicators and risk models at different time points in TCGA and E-MTAB-4321. (I,K) Univariate Cox analysis of different clinical indicators and risk models in TCGA and E-MTAB-4321. (J,L) Multivariate Cox analysis of different clinical indicators and risk models in TCGA and E-MTAB-4321.
Through various gene expression analyses, we identify the molecular characteristics that differentiate the two groups (high-risk and low-risk group). In high-risk group, Gene Ontology (GO) analysis revealed that critical tumor-related pathways, negative regulation of the canonical Wingless/Integrated (WNT) signaling pathway and positive regulation of G protein-coupled receptor signaling pathway. Additionally, pathways linked to tumor development, cell-cell adhesion mediator activity was also more prominent in this group. Conversely, in low-risk group, metabolic processes such as arachidonic acid, estrogen, and uronic acid are enriched. When examining immune-related pathways, in high-risk group, we found that fibroblast-associated functions, like response to fibroblast growth factor were more common. In low-risk group, T-cell-related pathways, T cell receptor complex were predominantly enriched (Fig. 3A). The Kyoto Encyclopedia of Genes and Genomes (KEGG) analysis corroborated the findings from the GO analysis, in low-risk group, showing significant enrichment of metabolic pathways like linoleic acid and ascorbate and aldarate. In contrast, pathways associated with tumor progression, including focal adhesion, cell cycle, and mismatch repair, were more prevalent in high-risk group (Fig. 3B, Supplementary Table 11). Subsequently, we examined the enrichment of HallMark gene sets between the two groups. Analysis showed that the high-risk group was distinct in showing significant activation of major tumor-associated pathways, for example, epithelial mesenchymal transition (EMT), G2/mitosis (G2M) checkpoint, Kirsten rat sarcoma viral oncogene homolog (KRAS) signaling down, and E2F transcription factor checkpoint (E2F) targets (Fig. 3C, Supplementary Table 11). We assembled a collection of BCa differentiation-related genes (Supplementary Table 12) and conducted Gene Set Enrichment Analysis (GSEA) to evaluate the molecular features of the two subgroups. In low-risk group, gene sets for luminal differentiation and urothelial differentiation were mainly enriched, whereas in high-risk group, those related to basal differentiation, EMT, myofibroblasts, and additional pathways were enriched (Fig. 3D, Supplementary Table 13).
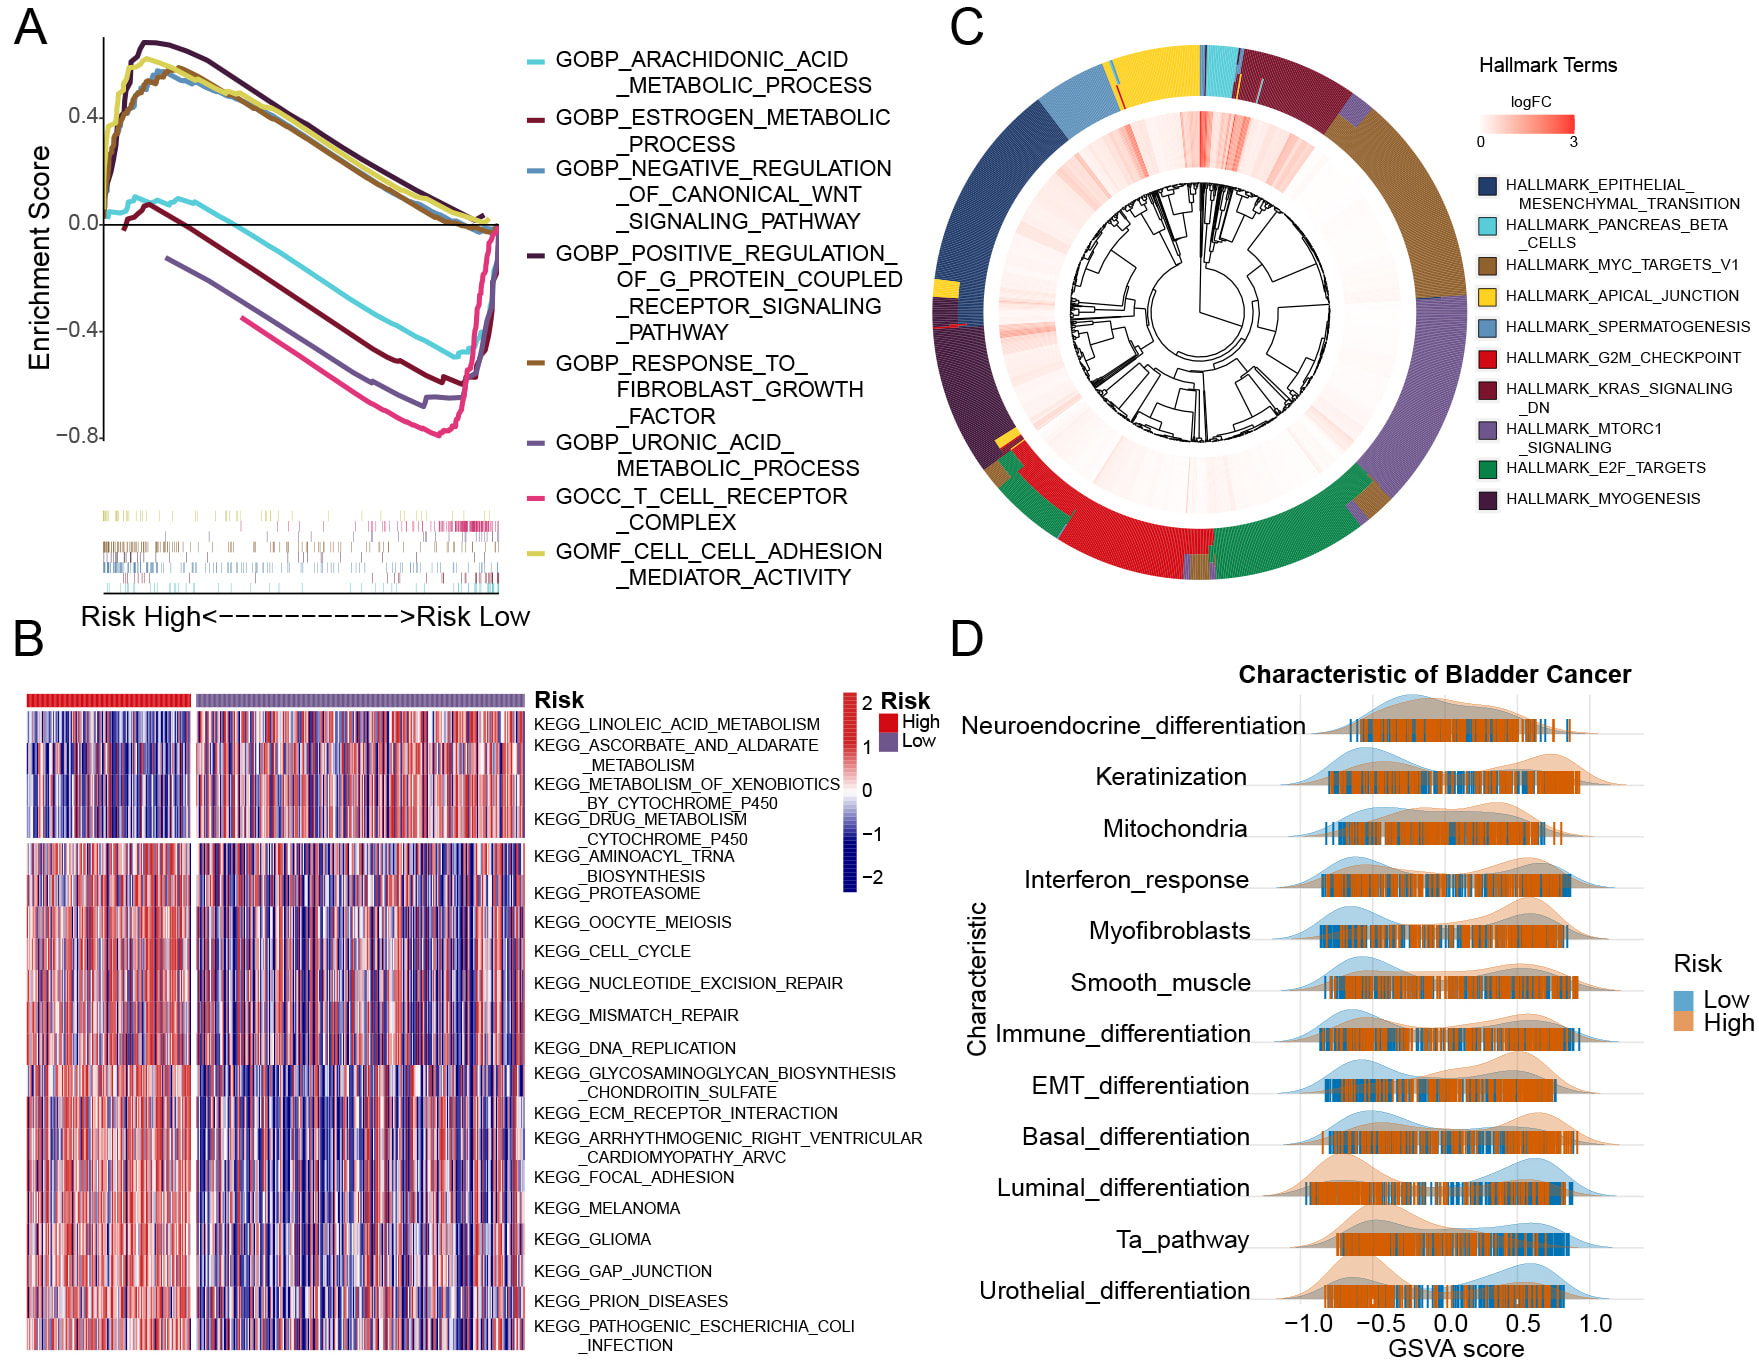 Fig. 3.
Gene enrichment analysis results for two group samples. (A) GO enrichment revealed distinct gene enrichment patterns between the high-risk and low-risk groups. The peak on the upper left represents genes enriched in the high-risk group, while the peak on the lower right indicates gene enrichment in the low-risk group. (B) The heatmap displays the enrichment results of various signaling pathways across individual samples in the high-risk and low-risk groups. (C) The outer circle represents the gene characteristics of each signaling pathway, while the inner circle displays the log-fold change (logFC) values of gene expression in the high-risk group compared to the low-risk group. (D) The ridge plot illustrates the distribution of various signaling pathways of BCa characteristic across the samples. GO, Gene Ontology.
Molecular subtypes and pathological stages were examined to explore the ability of riskScore to distinguish the molecular features of BCa subtypes. There was a greater proportion of patients at stage IV in high-risk group, whereas more individuals at stage II in low-risk group. Moreover, riskScores in stage II cases were markedly lower compared to those in stage IV cases (Fig. 4A,B). In high-risk group, by using the Baylor.subtype classification, we observed a significant prevalence of the Basal subtype (Fig. 4C,D, Supplementary Table 14). In low-risk group, by the analysis via the CIT.subtype approach showed that the MC1 subtype was predominantly present. In high-risk group, the MC7 subtype was mainly observed (Fig. 4E,F, Supplementary Table 14). According to the Lund.subtype system, the Ba/Sq subtype was primarily linked to high-risk group, whereas in low-risk group, the UroA-Prog subtype was more frequently found (Fig. 4G,H, Supplementary Table 14). In high-risk group, MDA.subtype, UNC.subtype, TCGA.subtype, and MIBC.subtype classifications, basal-like subtypes were predominantly, while in low-risk group, luminal-like subtypes were more prevalent (Fig. 4I–P, Supplementary Tables 14,15). These results indicate that riskScore is effective in distinguishing BCa molecular subtypes. Elevated riskScores are more closely connected with basal-like differentiation, while reduced riskScores show a stronger association with luminal-like differentiation. This observation aligns with previous genomic studies on BCa differentiation.
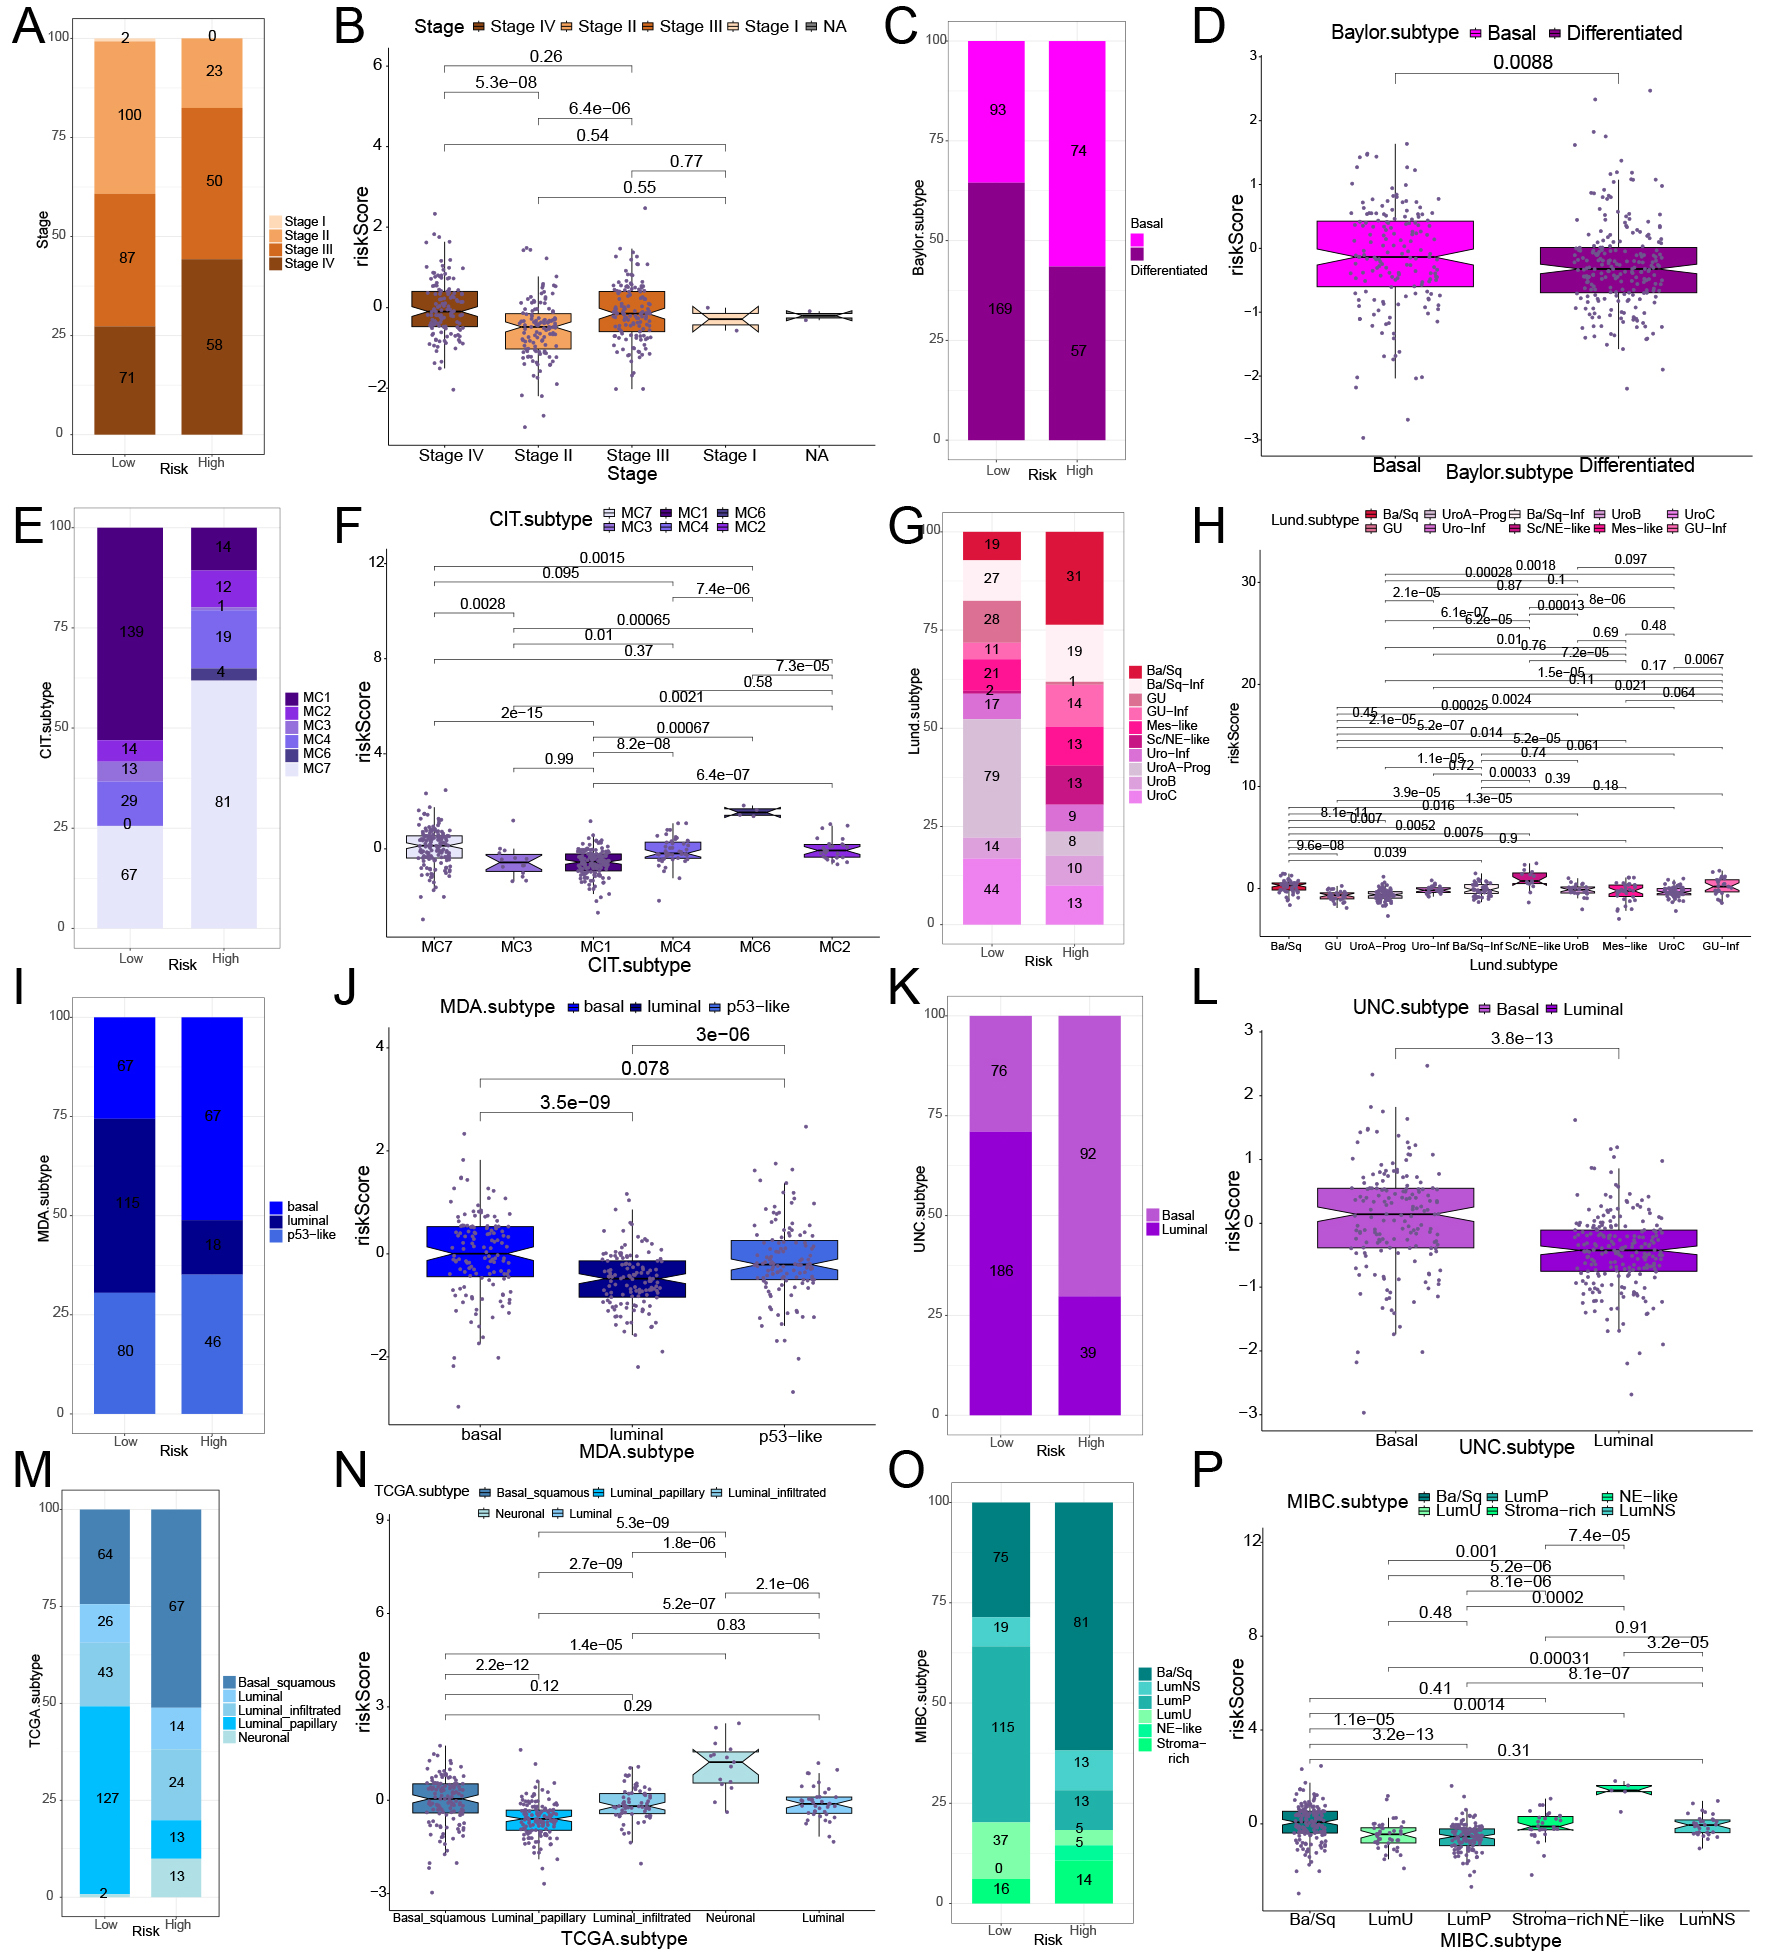 Fig. 4.
Relationship between various molecular subtypes and risk model of BCa in the TCGA BCa cohort. (A,C,E,G,I,K,M,O) The distribution and proportion of molecular subtypes and stages of BCa in two groups, based on various classification methods. (B,D,F,H,J,L,N,P) The correlation analysis between BCa molecular subtypes and stages with riskScore in two groups, based on various classification methods.
Data on immune-related signaling pathways were gathered (Supplementary Table 16). Pathway analysis indicated a significant enrichment of immune-related pathways in high-risk group, such as ‘Cytokine production immune response’, ‘Leukocyte migration’, ‘Regulation of cytokine production’, and ‘T helper 1 immune response up’ (Fig. 5A, Supplementary Table 17). The high-risk group in BCa-associated immune pathways showed enrichment in critical BCa pathways, including ‘Cell cycle’, ‘Mismatch repair’, ‘EMT2’, and ‘FGFR3-related genes’ (Fig. 5B, Supplementary Table 17). In high-risk group, analysis of the seven-step tumor immune development process showed the ‘Release of cancer cell antigens’ pathway was predominant (Fig. 5C, Supplementary Table 17). By utilizing multiple immune cell infiltration estimation techniques, such as Estimate, MCPcounter, Timer, Epic, CIBERSORT, and Quantiseq, the extent of immune cell infiltration within each samples were showed (Supplementary Table 18). The analysis demonstrated a strong relationship between macrophage infiltration levels and riskScore across the CIBERSORT, Timer, Quantiseq, and Epic methods. The MCPcounter, Xcell, and Epic methods demonstrated a positive correlation between riskScore and fibroblast infiltration, reinforcing the previous finding that ‘response to fibroblast growth factor’ in high-risk group. Furthermore, the CIBERSORT and Xcell methods indicated a positive correlation between riskScore and neutrophil infiltration levels. In the Xcell, CIBERSORT, and Quantiseq methods, a negative relationship was observed between CD8+ T cell infiltration levels and riskScore (Fig. 5D).
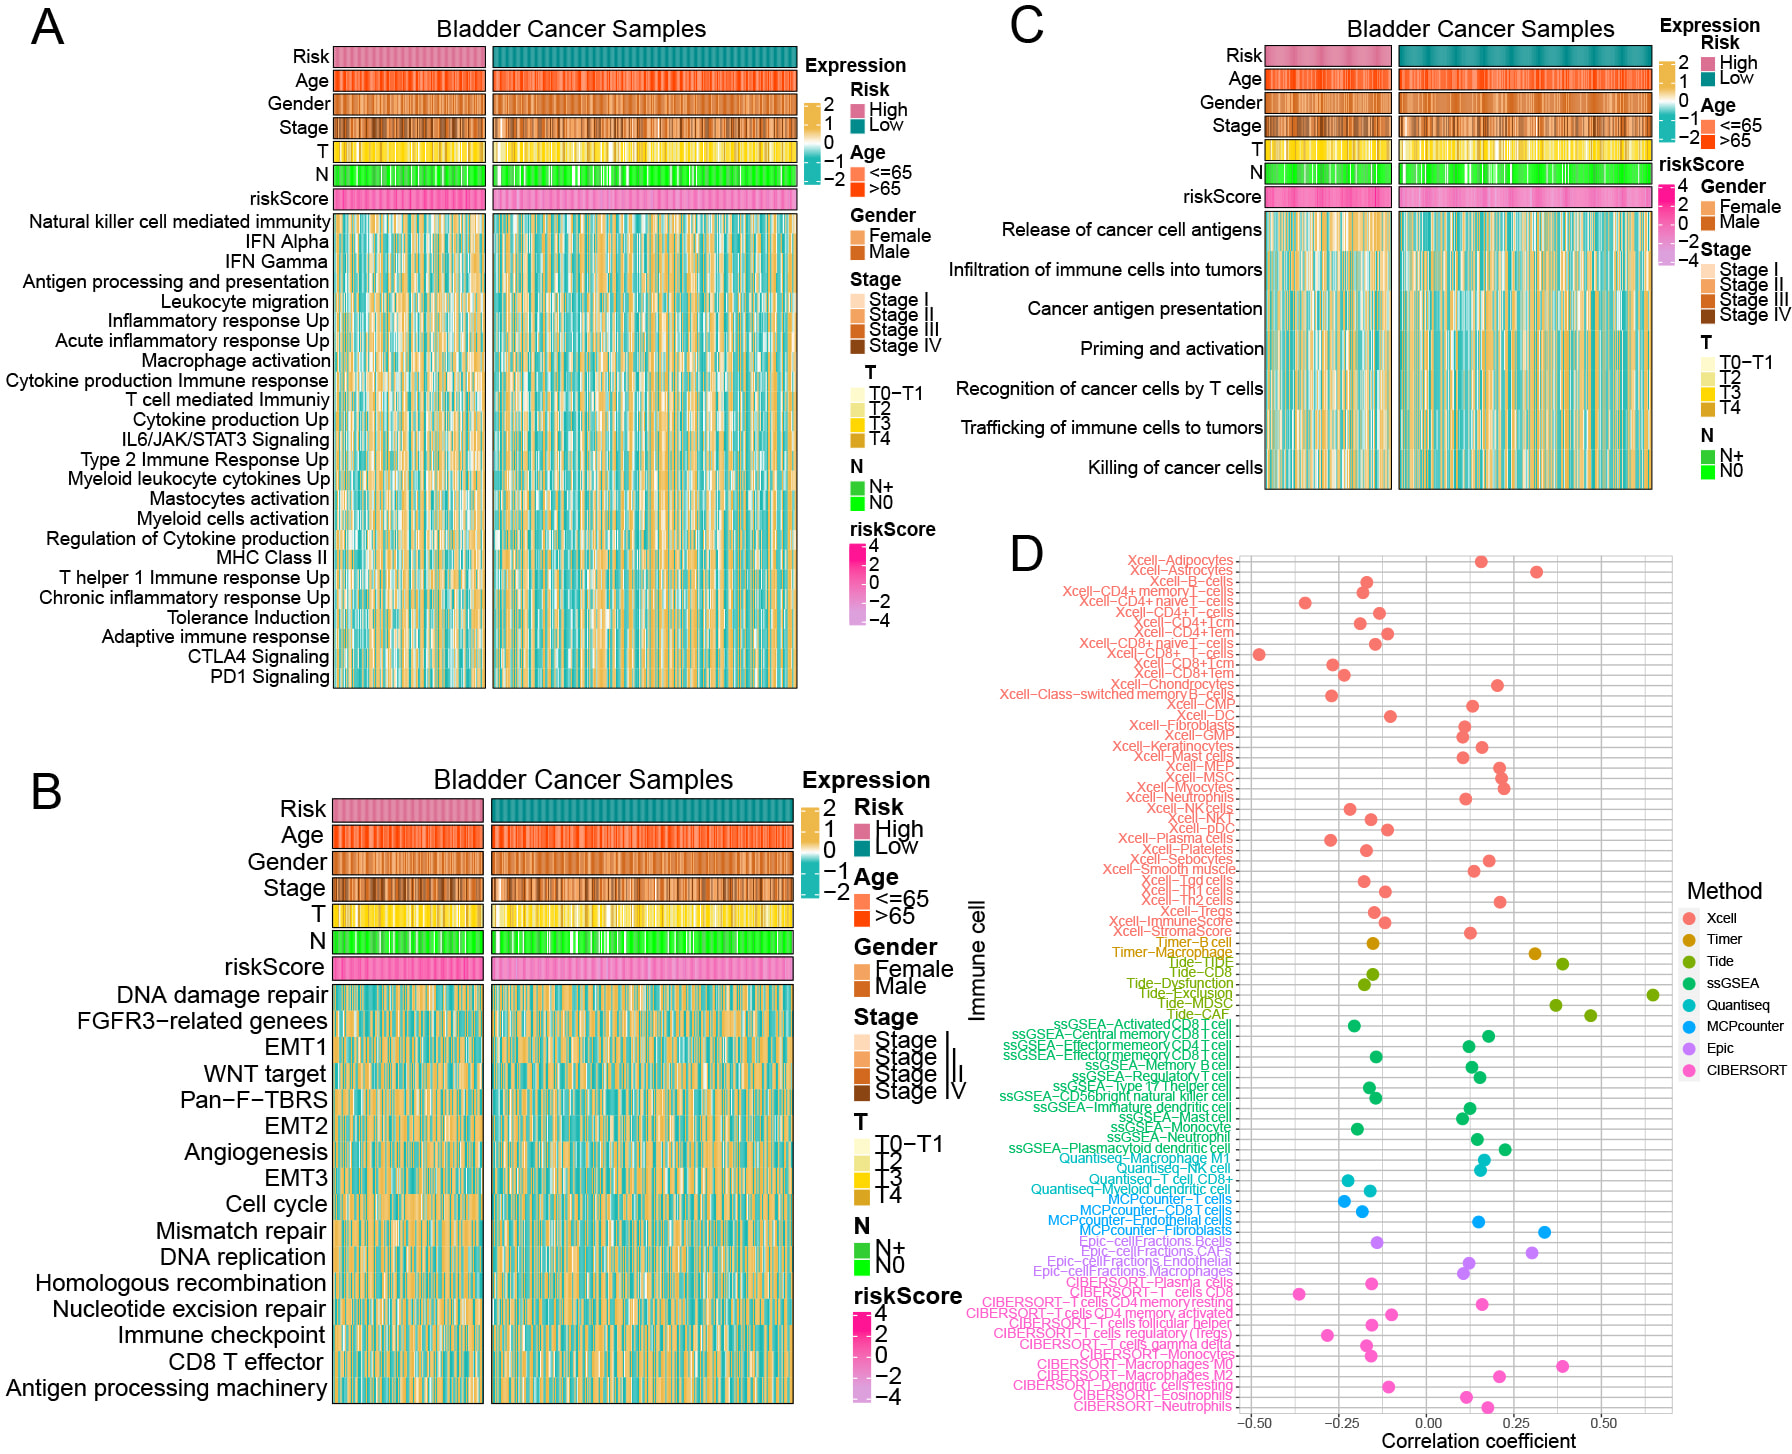 Fig. 5.
The relationship between the risk model and immune pathway enrichment levels, immune cell infiltration levels. (A–C) Immune-related pathway enrichment levels between high-risk and low-risk groups. (D) Correlation between riskScore and immune cell infiltration levels across various immune cell estimation methods.
Estimate package indicated that the StromalScore was lower in low-risk group compared to high-risk group (Fig. 6A,B). Subsequently, we conducted ssGSEA analysis on key genes representing 28 different immune cell types (Supplementary Table 19). The results revealed a negative association between CD4 T cells and CD8 T cells (Fig. 6C, Supplementary Table 20). Analysis using the TIDE website (Supplementary Table 21) indicated a strong connection in riskScore, MDSCs and cancer-associated fibroblasts (CAF) (Fig. 6D). Additionally, a positive correlation between riskScore and both TIDE and Exclusion scores (Fig. 6D) indicates that elevated riskScores are linked to greater immune escape potential, potentially forecasting less favorable outcomes in immune checkpoint inhibitor (ICI) therapies. Further investigation into immune checkpoints suggested potential differences in the effectiveness of immunotherapy. Specifically, Tumor necrosis factor receptor superfamily member 14 (TNFRSF14) showed markedly reduced expression in the high-risk group, while Tumor Necrosis Factor Ligand Superfamily Member 9 (TNFSF9), Tumor necrosis factor receptor superfamily member 18 (TNFRSF18), and CD209 were expressed at lower levels in the low-risk group (Fig. 6E). In contrast, the high-risk group exhibited significantly increased expression of the co-inhibitory immune checkpoints CD276, Signal-regulatory Protein Alpha (SIRPA), and PVR Cell Adhesion Molecule (PVR). Meanwhile, low-risk group demonstrated higher expression levels of Galectin 9 (LGALS9), Carcinoembryonic Antigen Related Cell Adhesion Molecule 1 (CEACAM1), and CD96 (Fig. 6F). The analysis revealed a significant inverse relationship between TMB and the riskScore, as high-risk group displayed considerably lower level of TMB (Fig. 6G,H). Sankey plot indicated that high-risk group had a reduced presence of T cells and cytotoxic T lymphocytes, suggesting a potential decrease in the effectiveness of ICI therapies for these patients (Fig. 6I).
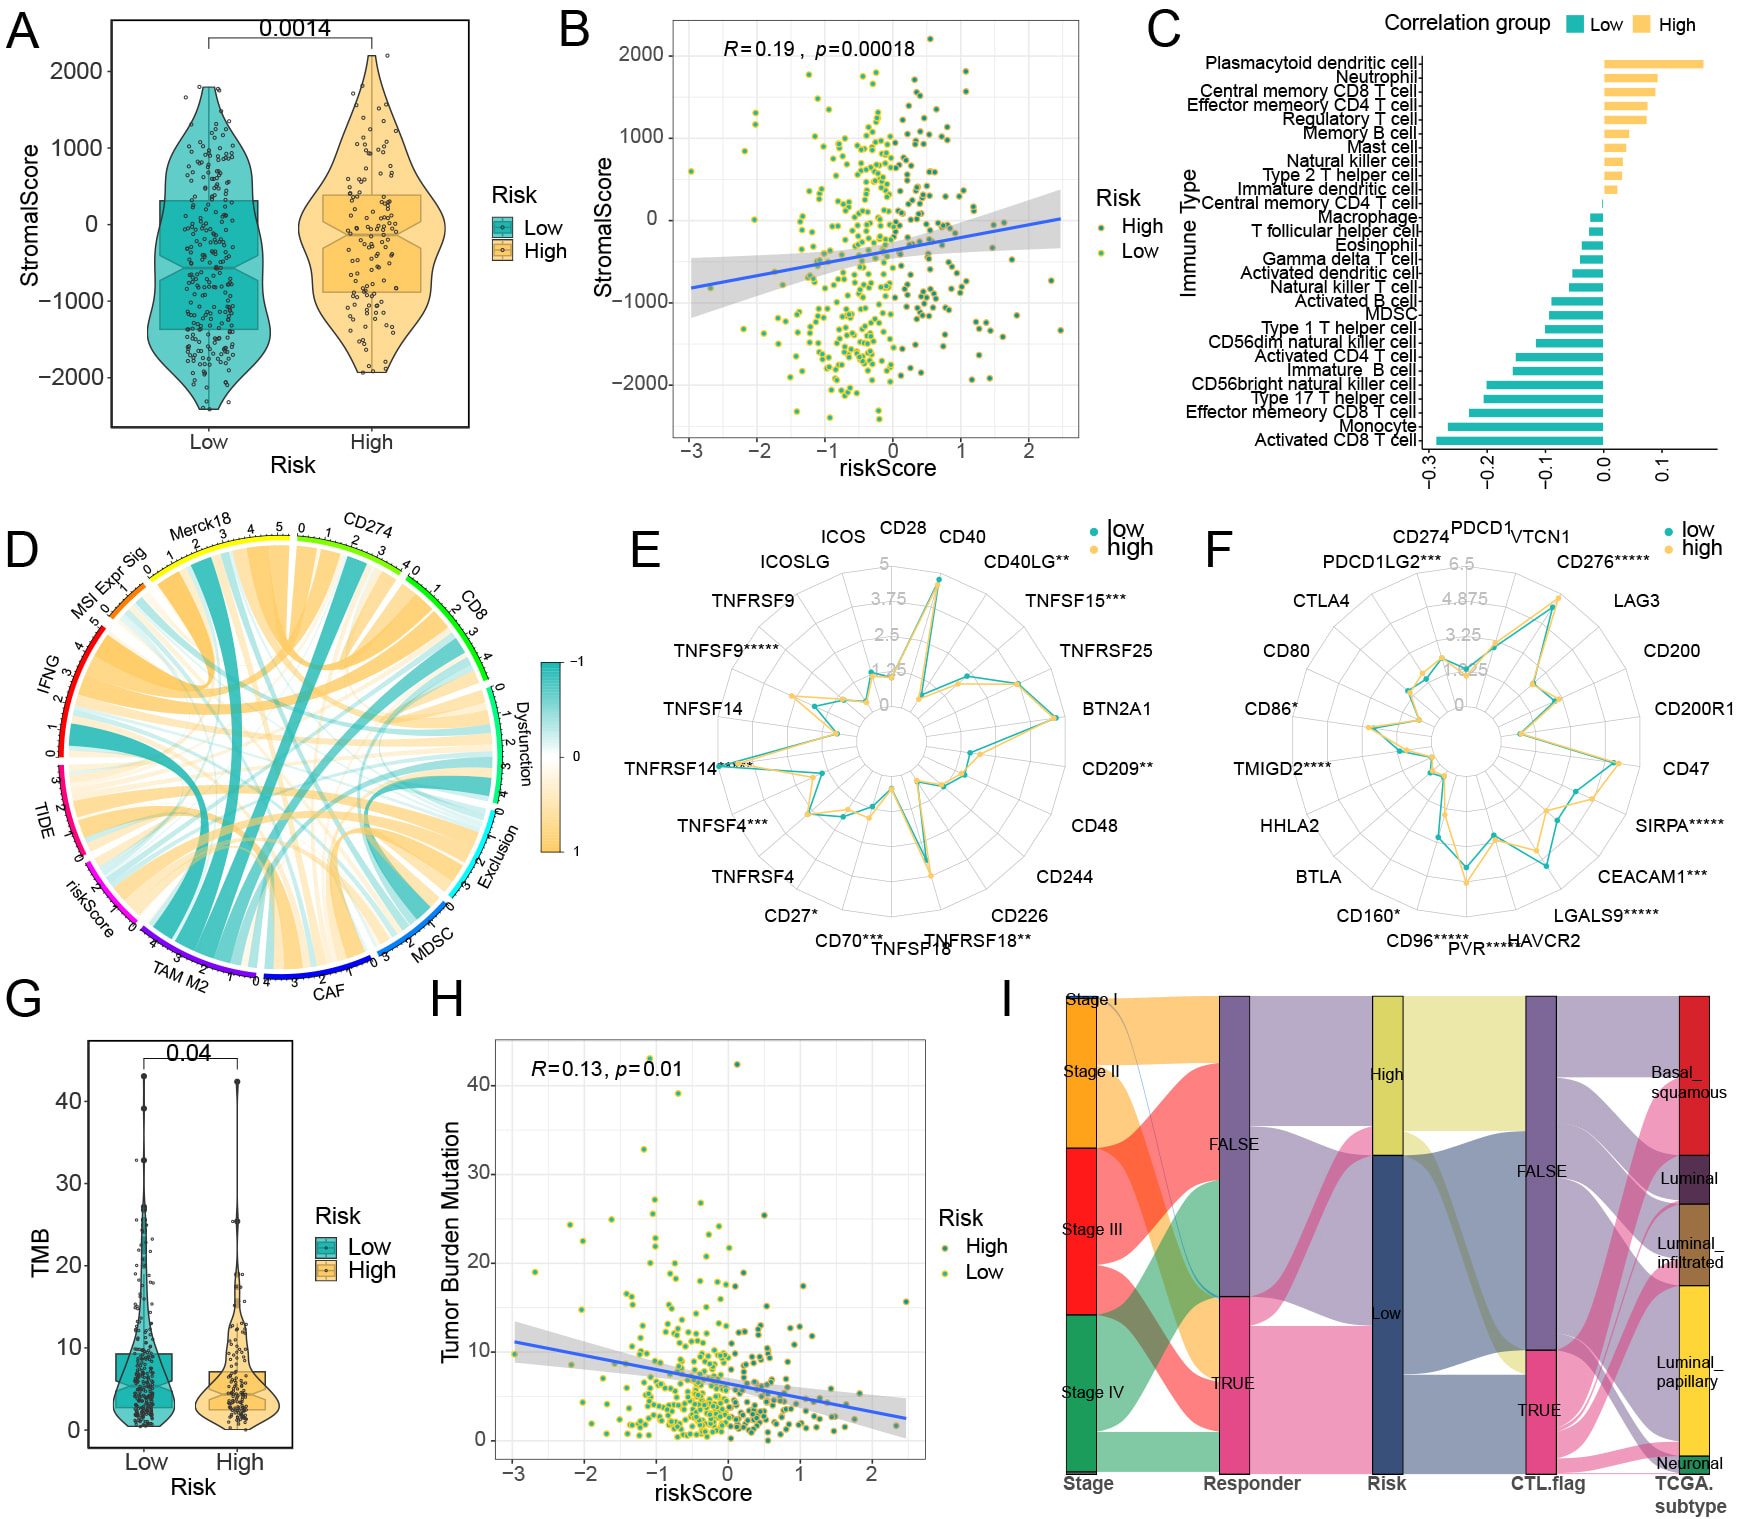 Fig. 6.
Correlation analysis between immune cell infiltration levels and
risk model. Analysis results of the ESTIMATE method in TCGA samples: (A) The
results of stromalScore between high-risk and low-risk groups. (B) The results of
correlation between riskScore and stromalScore. (C) The correlation between
riskScore and the levels of tumor immune cell infiltration, with yellow
representing a positive correlation and blue-green representing a negative
correlation. (D) The correlation between riskScore and various TIDE prediction
indicators, with yellow lines representing positive correlations and blue-green
lines representing negative correlations. (E) Co-stimulatory immune checkpoints,
(F) Co-inhibitory immune checkpoints. The relationship between the risk model and
tumor mutational burden (TMB) in BCa: (G) Variations in TMB levels between two
cohorts; (H) Association analysis between TMB and riskScore. (I) A Sankey diagram
depicting the immune profiles of samples in two groups based on TIDE assessment.
*p
To investigate variations in genetic mutation patterns between high-risk and low-risk groups, we analyzed data from TCGA. Our findings revealed distinct differences in the mutation rates of three key genes—TP53, Titin (TTN), and Phosphatidylinositol-4,5-bisphosphate 3-kinase catalytic subunit alpha (PIK3CA)—across the two groups. In particular, high-risk group was frequently associated with mutations in TP53, while mutations in TTN and PIK3CA were more commonly observed in low-risk group (Fig. 7A,B). Co-mutation analysis further uncovered groups. In high-risk group, TP53 mutations frequently co-occurred with those in TTN and Lysine-specific demethylase 6A (KDM6A), by contrast, TP53 tended to co-mutate with FAT atypical cadherin 4 (FAT4) and spectrin repeat containing, nuclear envelope 1 ̵(SYNE1) in low-risk group (Fig. 7C,D). A key observation was that PIK3CA showed no significant co-mutation or mutual exclusivity with other genes in high-risk group, but in low-risk group, it commonly co-mutated with TTN, KDM6A, ryanodine receptor 2 (RYR2), and AHNAK Nucleoprotein (AHNAK) (Fig. 7C,D). To gain deeper insights into the clonal properties of mutations across the two groups, we performed variant allele frequency (VAF) analysis. High-risk group showed a significantly lower average VAF compared to low-risk group. TTN, TP53, and MUCIN 16, CELL SURFACE ASSOCIATED (MUC16) ranked as the top three genes with the highest average VAF in both groups; however, in low-risk group, their VAF values were substantially higher (Fig. 7E,F). Collectively, these results showed the RiskScore can effectively distinguish the genetic mutation profiles of high-risk and low-risk groups.
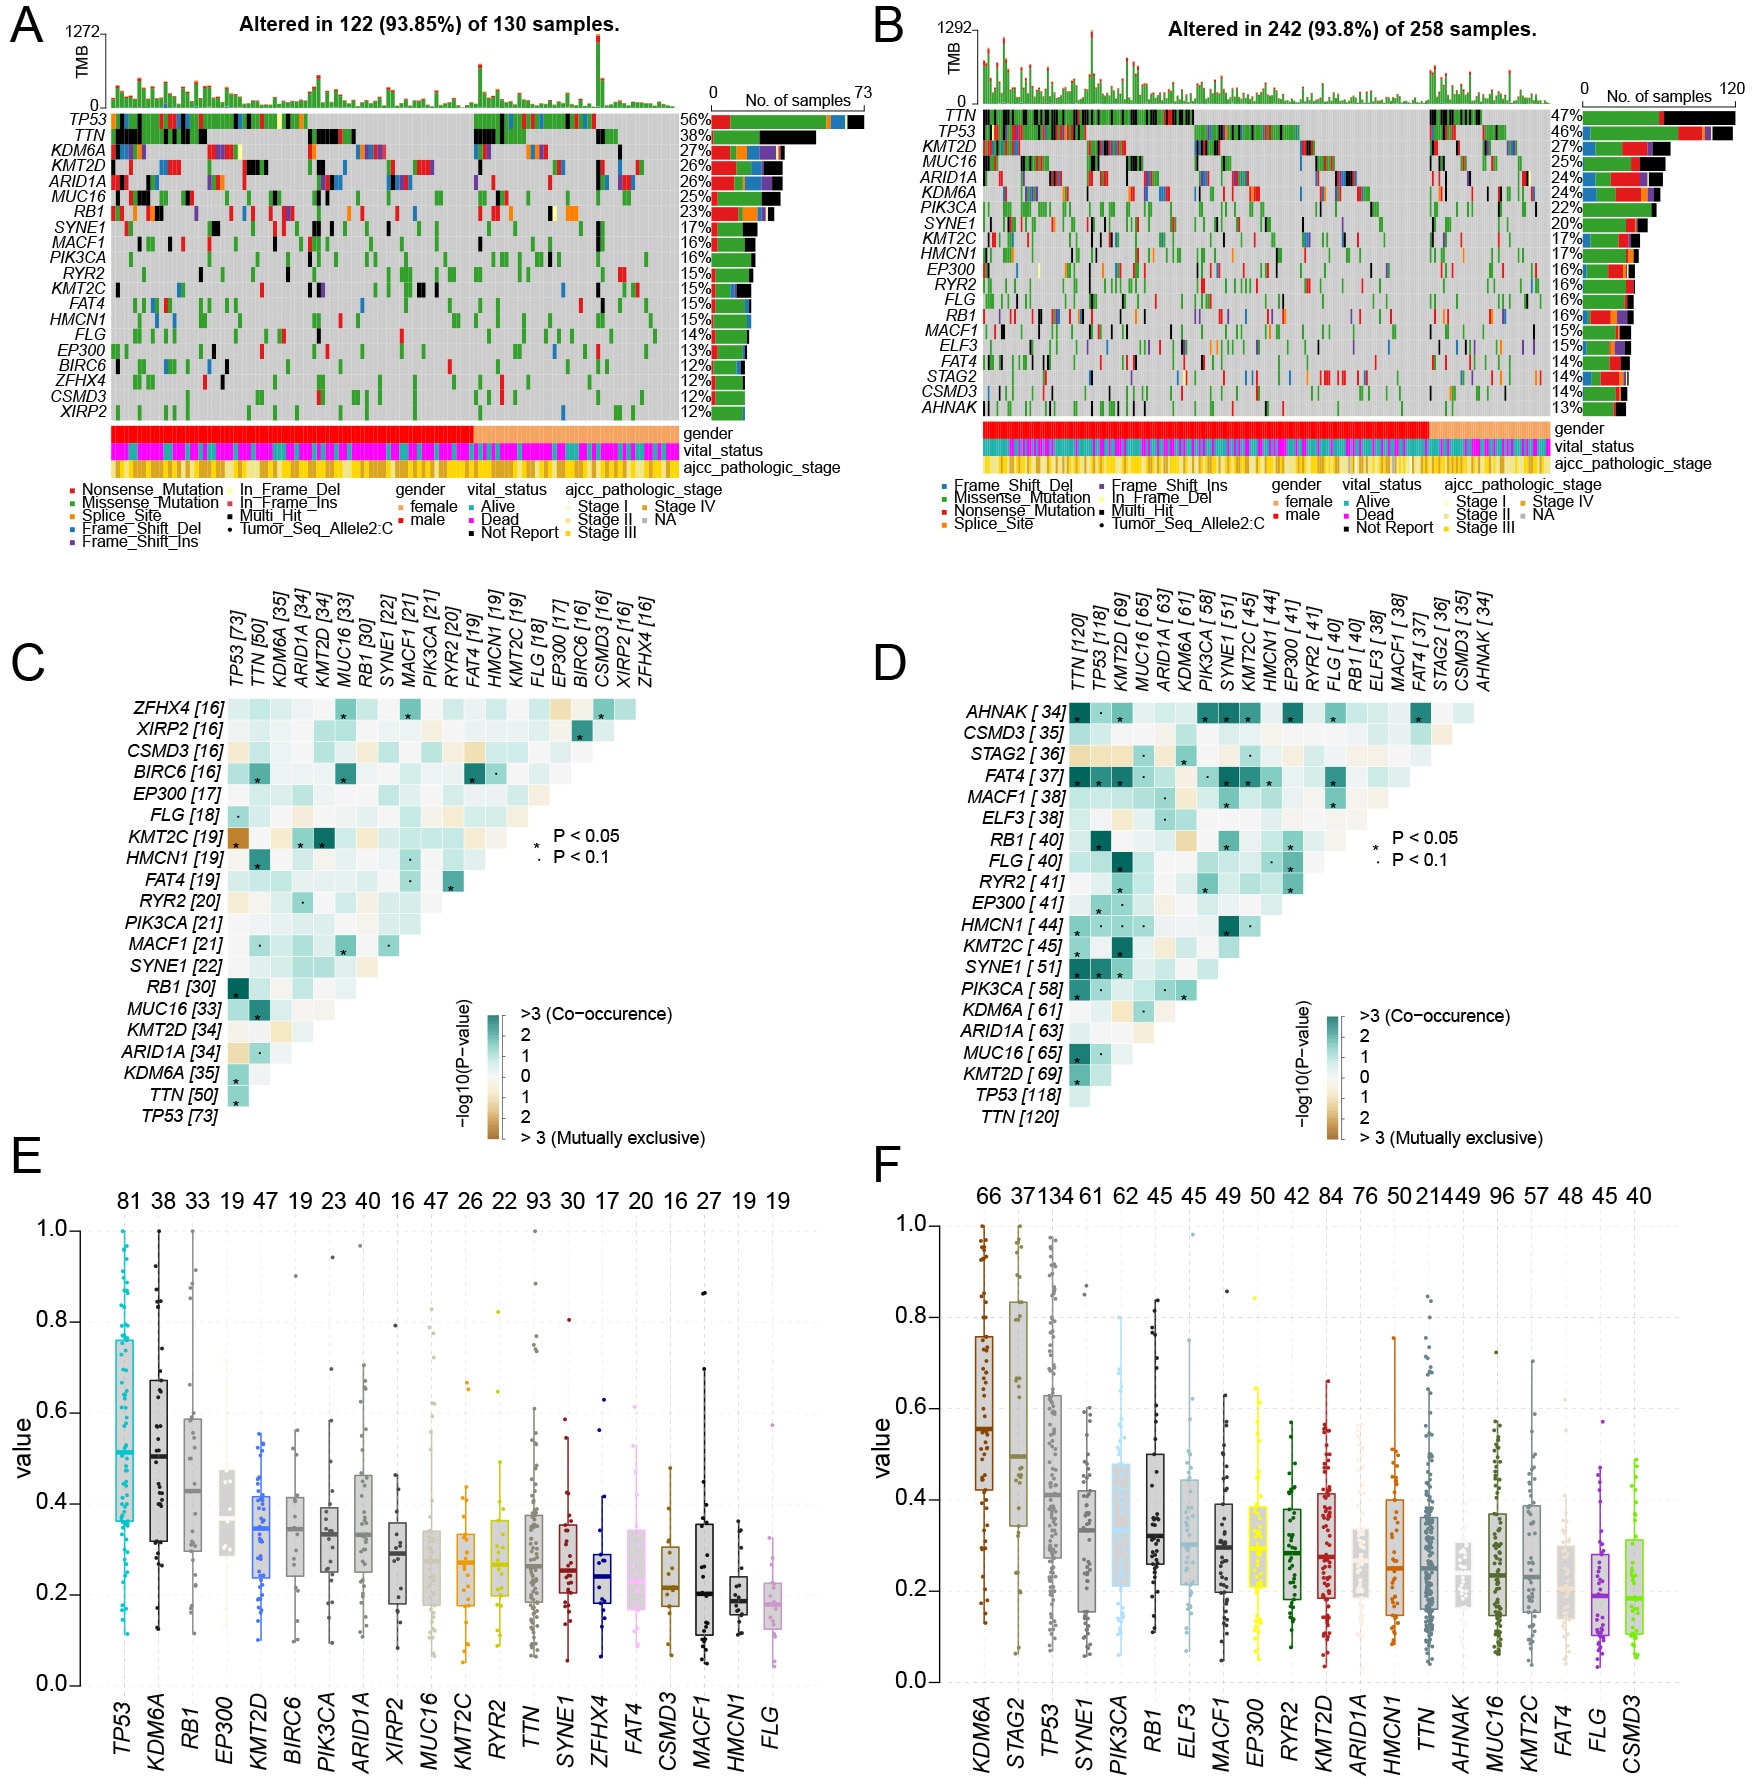 Fig. 7.
Gene mutation characteristics of high and low risk groups. ((A) high risk group, (B) low risk group) The waterfall plot illustrates the top 20 gene mutation characteristics and TMB status in two groups. ((C) High risk group, (D) low risk group) The mutation heatmap displays the co-mutation and co-exclusion patterns of the top 20 genes between the high-risk and low-risk groups. ((E) high risk group, (F) low risk group) The boxplot illustrates the differences in the average VAFs between the high-risk and low-risk groups.
The Hallmark pathway enrichment analysis revealed that oxidative phosphorylation and peroxisome plays a regulatory role in ferroptosis (Fig. 8A). The GO pathway enrichment analysis indicated that “OXIDOREDUCTASE_ACTIVITY_ACTING_ON_A_HEME_GROUP_OF_DONORS” are associated with ferroptosis, exhibiting negative correlations (Fig. 8B). The KEGG pathway enrichment analysis also indicated that the high-expression TRIM59 group was enriched in signaling pathways closely related to ferroptosis, such as Peroxisome, Proteasome, Citrate Cycle TCA Cycle, and Fatty Acid Metabolism (Fig. 8C). Pathway enrichment analysis identified TRIM59 as being associated with multiple ferroptosis-related signaling pathways. Additionally, the correlation between TRIM59 and various metabolic genes was examined. Notably, TRIM59 exhibited strong correlations with key ferroptosis-related genes (SLC7A11, GPX4, ACSL4) and peroxisomal genes (nitric oxide synthase 2 (NOS2), superoxide dismutase 2 (SOD2), Isocitrate Dehydrogenase 1 (IDH1)) (Fig. 8D). In the IMVigor210 dataset, although there was no significant survival difference between the high and low expression groups of TRIM59, the grouping based on the levels of TMB and TRIM59 could clearly distinguish the prognosis of BCa patients undergoing immunotherapy (Supplementary Fig. 3A,B). By analyzing the expression level of TRIM59 and the response effect of immunotherapy, it was found that the proportion of patients with stable disease (SD) in the TRIM59 low-expression group was higher than that in the TRIM59 high-expression group. Although the expression level of TRIM59 cannot completely distinguish between patients with a complete response (CR) and those with SD, since its p-value (p = 0.073) is close to 0.05, it still has some reference value (Supplementary Fig. 3C,D). And the expression level of TRIM59 in the IC2+ group was significantly higher than that in the IC0 group of patients (Supplementary Fig. 3E,F). In the IMVigor210 data analysis, it was demonstrated that TRIM59 has the potential to predict the therapeutic effect of PD-L1 treatment.
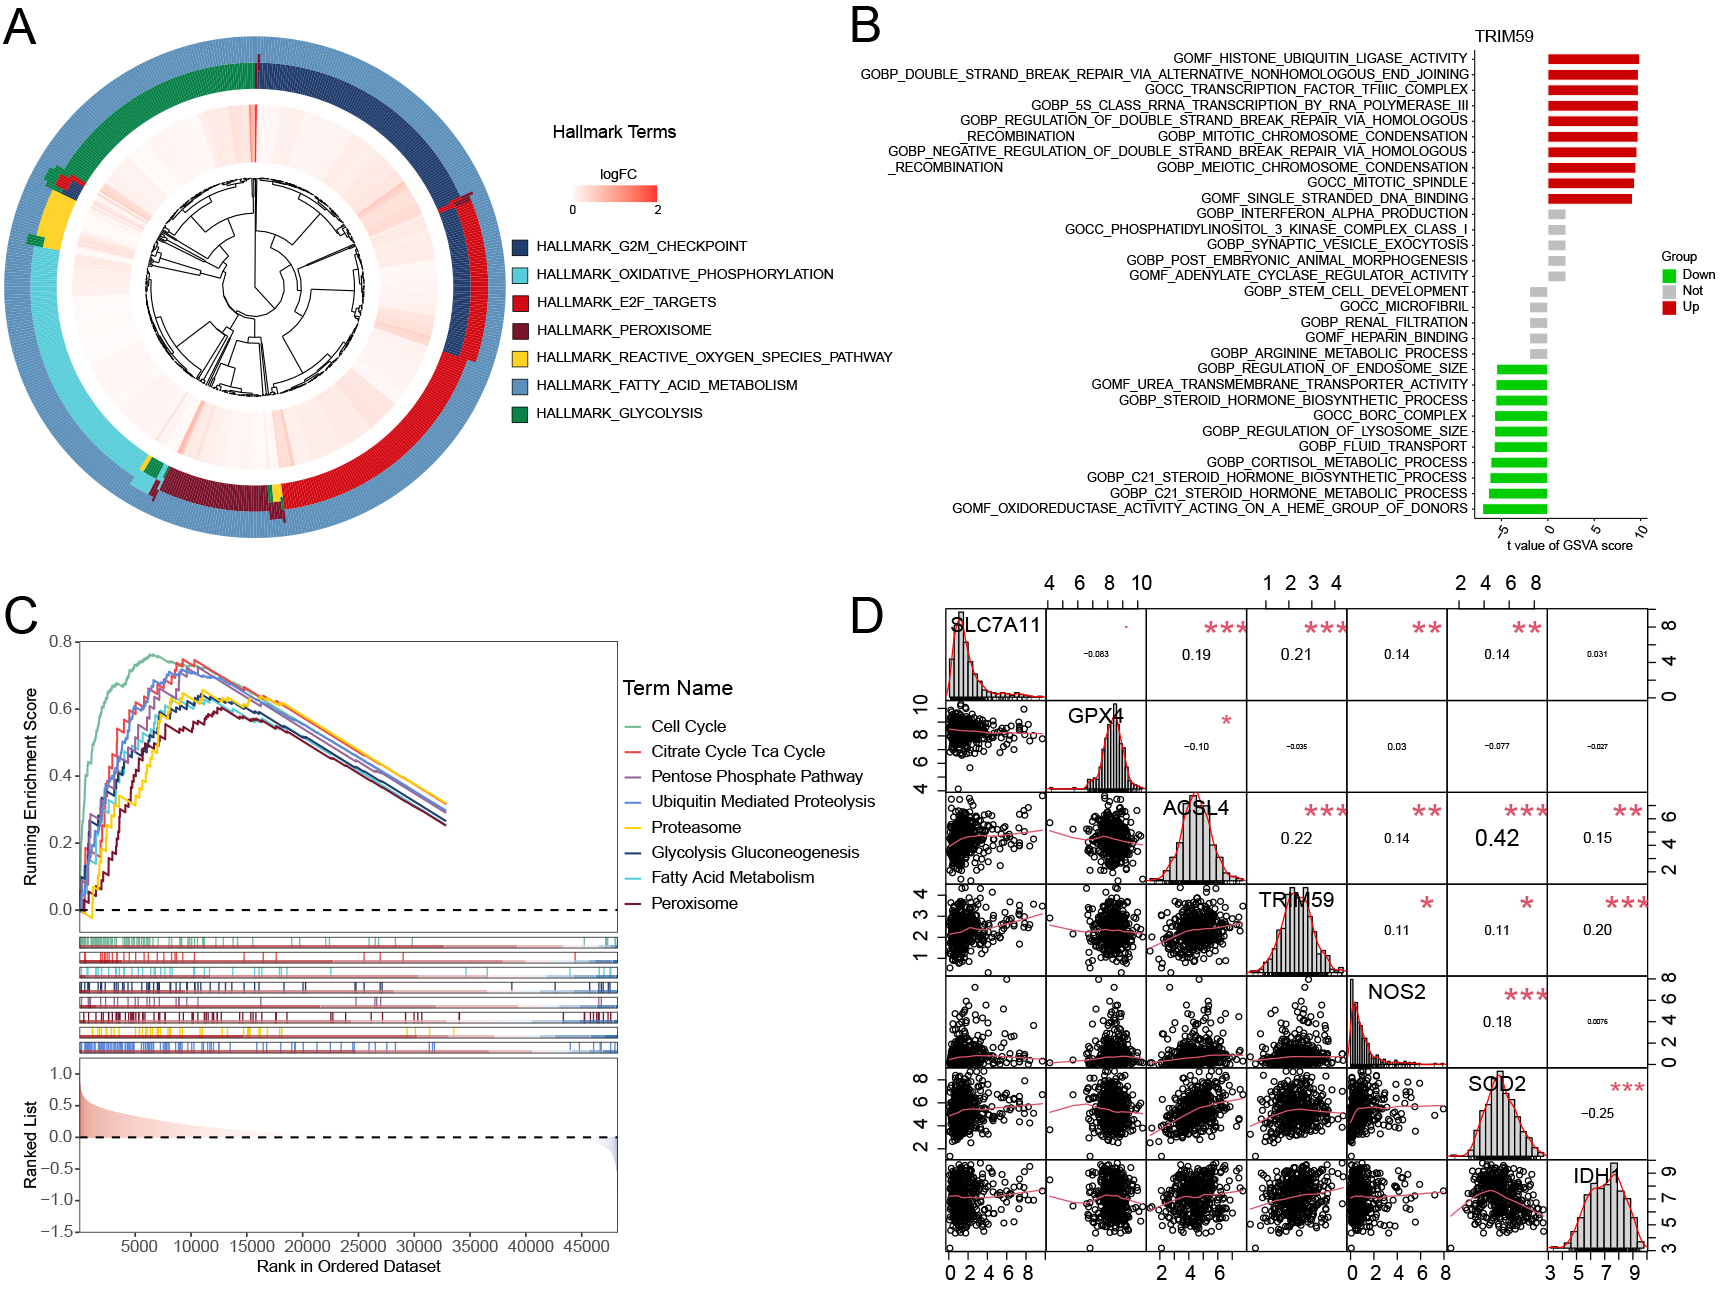 Fig. 8.
Hallmark, GO, and KEGG enrichment pathway analysis of TRIM59 in
distinct BCa groups. (A) Hallmark enrichment pathway analysis of TRIM59. (B) GO
enrichment pathway analysis of TRIM59. (C) KEGG enrichment pathway analysis of
TRIM59. (D) The correlation between TRIM59 and ferroptosis key genes (SLC7A11,
GPX4, ACSL4) and peroxisome genes (NOS2, SOD2, IDH1). KEGG, Kyoto Encyclopedia of
Genes and Genomes. *p
Then, we selected TRIM59 among the 34 genes for further experimental investigation. In Fig. 9A,B, we observed an over-expression of TRIM59 in 8 BCa tissues compared to matched non-tumor tissues. Additionally, to evaluate the clinical significance of TRIM59, we performed immunohistochemistry (IHC) experiments on samples from 16 patients. The results revealed that the average positive region of TRIM59 in normal tissues was 16%, whereas it increased to 50% in tumor tissues (Fig. 9C,D). Knockdown of TRIM59 increased the inhibitory impact of DOX on cell proliferation (Fig. 9E,F), suggesting a positive correlation between TRIM59 expression and the viability of BCa cells treated with DOX.
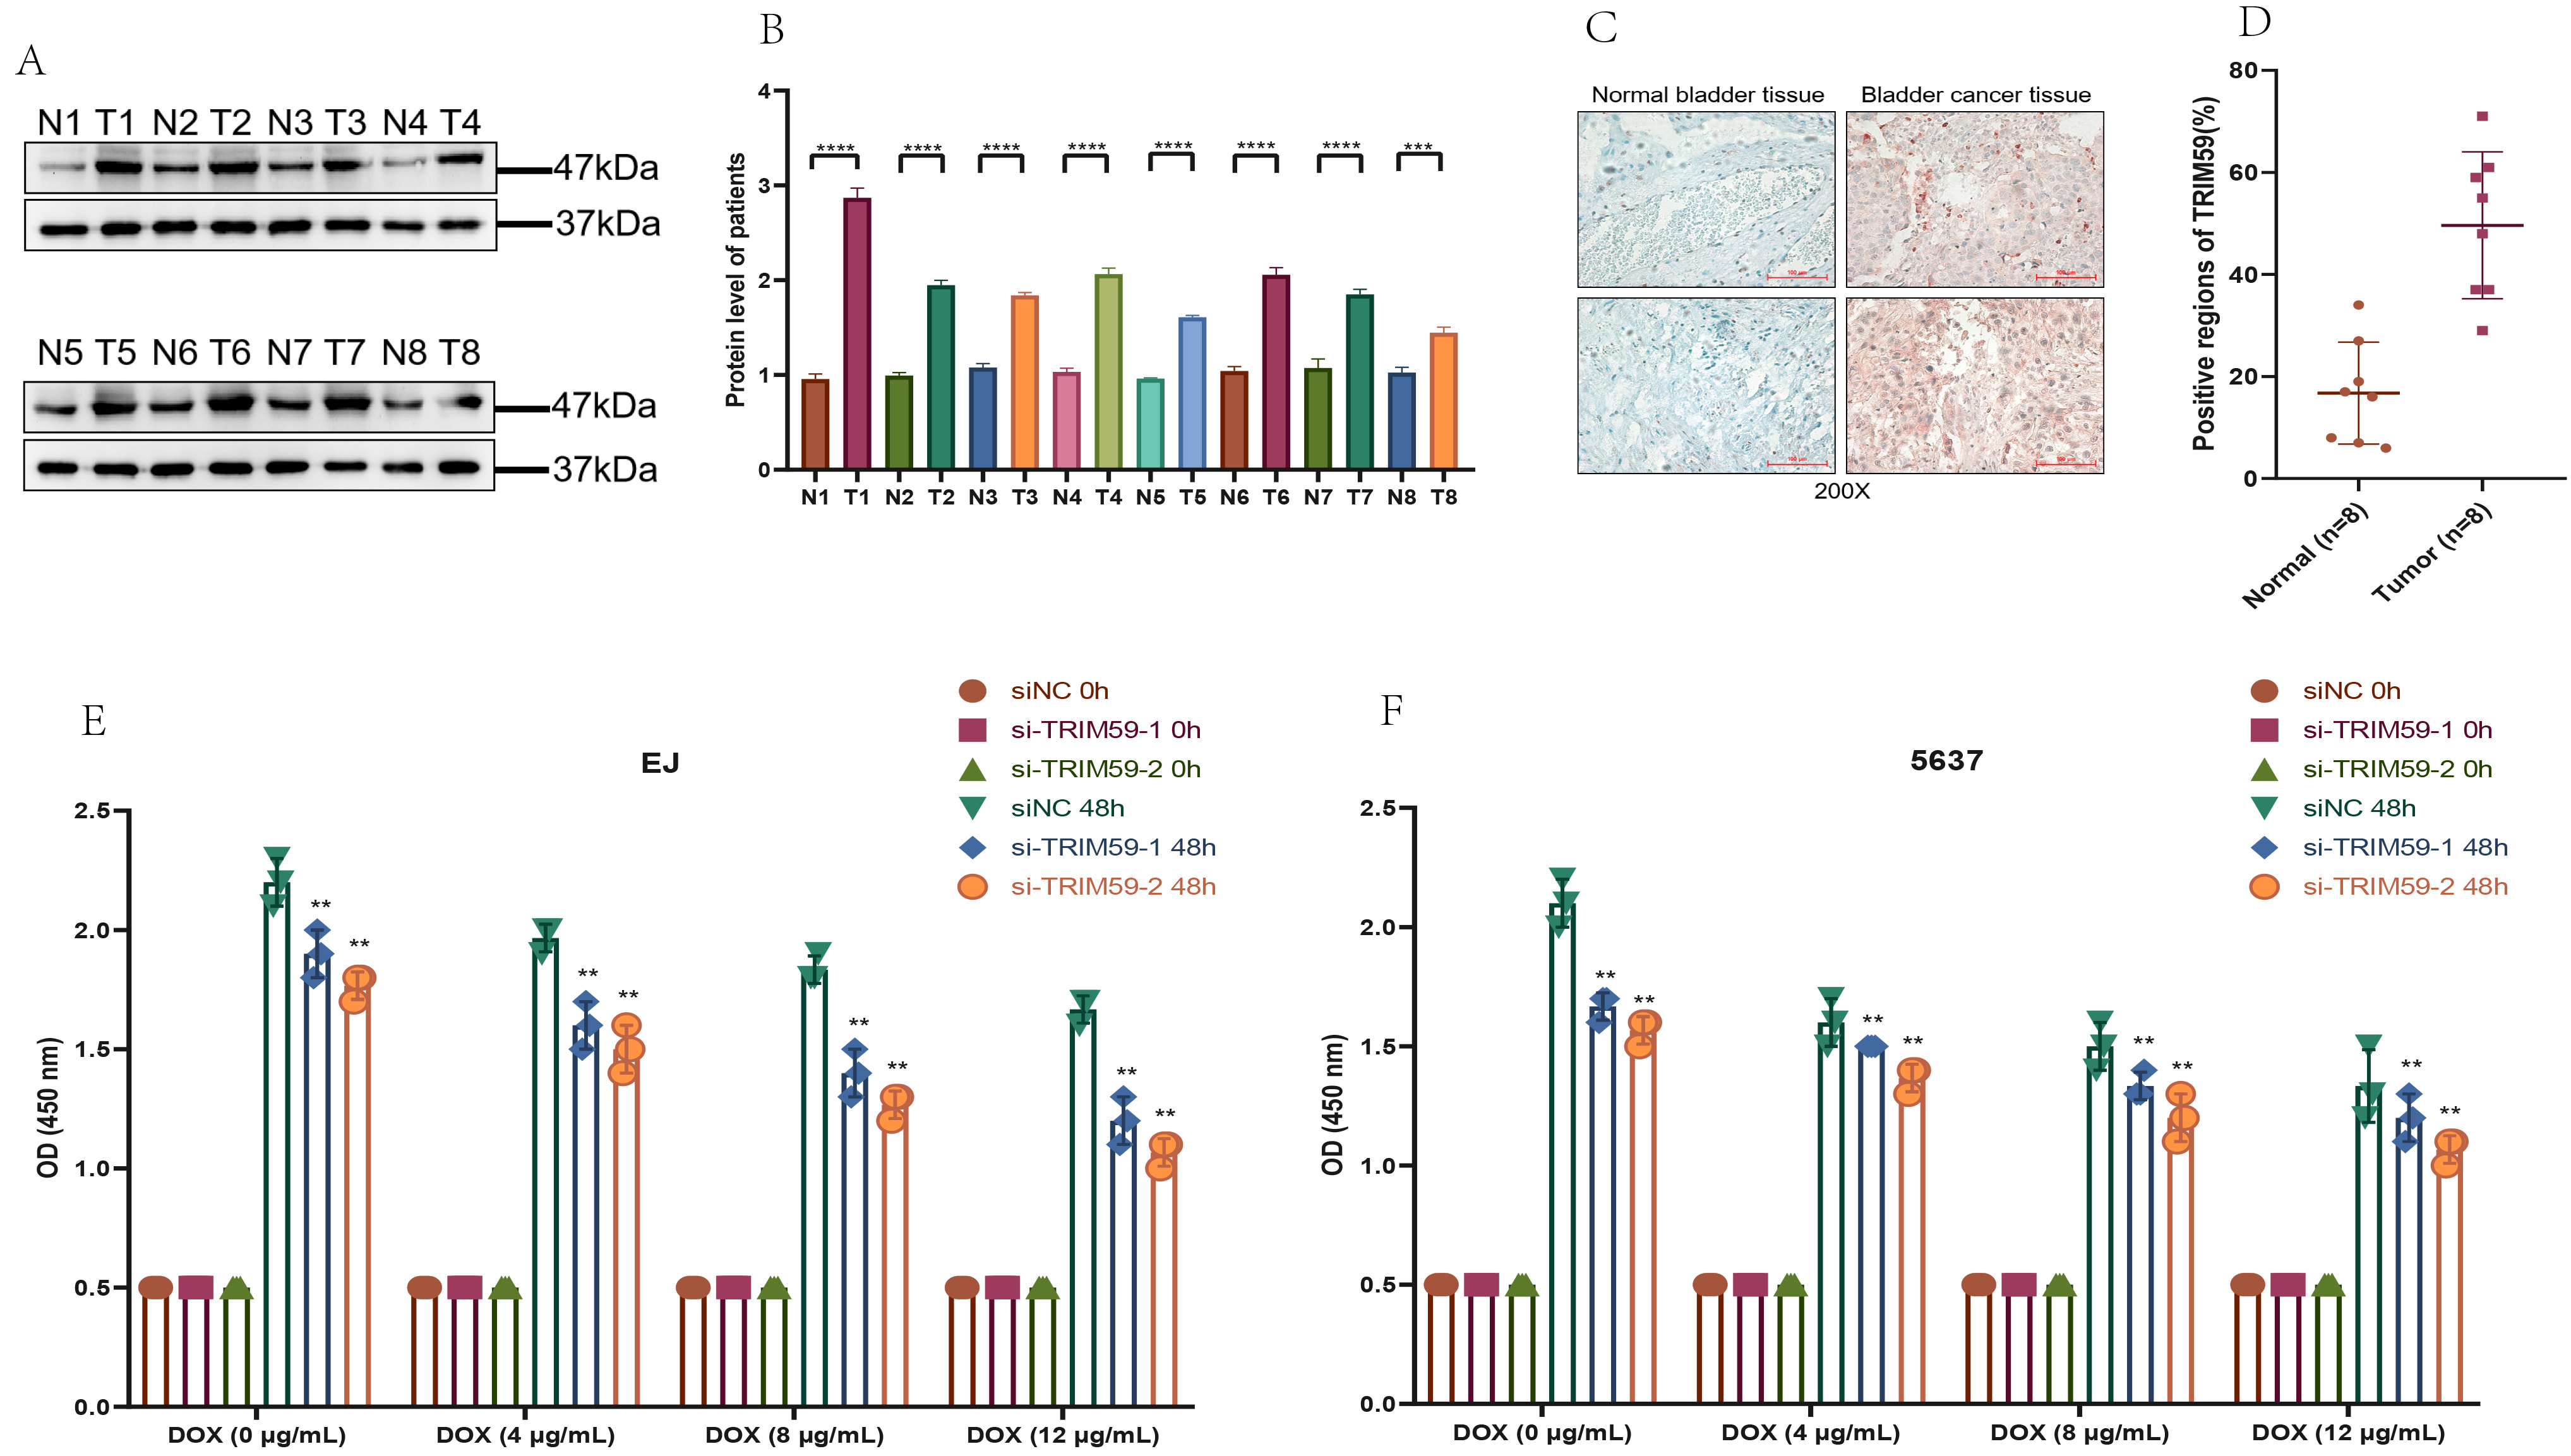 Fig. 9.
TRIM59 expression of BCa patients and impact of TRIM59 on BCa
cell proliferation under DOX exposure. (A) WB assay to examine the TRIM59
protein expression in BCa tissues. (B) Quantification of (A). (C) IHC assay to
examine the TRIM59 protein expression in BCa tissues (Scale bar = 100 μm). (D) Quantification of (C).
TRIM59 knockdown inhibits the proliferation of EJ (E) and 5637 (F) cells exposed
to DOX. **p
We examined the effects of TRIM59 siRNA (si#1 and si#2) on ferroptosis in EJ cells and transfected 5637 cells with a lentivirus to overexpress TRIM59. MTT, invasion, and wound healing assays indicated that TRIM59 knockdown decreased EJ cell proliferation, migration, and invasion (Fig. 10A,C,E). In contrast, TRIM59 overexpression increased the proliferation, migration, and invasion of 5637 cells (Fig. 10B,D,F). Importantly, TRIM59 siRNA downregulated the protein levels of key ferroptosis repressors, including TRIM59, GPX4, and SLC7A11, while inducing ACSL4 expression in EJ cells (Fig. 10G–K). TRIM59 overexpression elevated the protein levels of TRIM59, GPX4, and SLC7A11, while reducing ACSL4 protein levels (Fig. 10L–P). Similar results were observed at the RNA level of ferroptosis-related markers (Fig. 10Q,R). To examine how TRIM59 influences ferroptosis-related genes, we initially explored the potential interaction between TRIM59 and ACSL4, considering that E3 ubiquitin ligases typically exert their function by binding to target substrates. Co-immunoprecipitation (IP) experiments confirmed a direct association between TRIM59 and ACSL4 (Supplementary Fig. 4A).
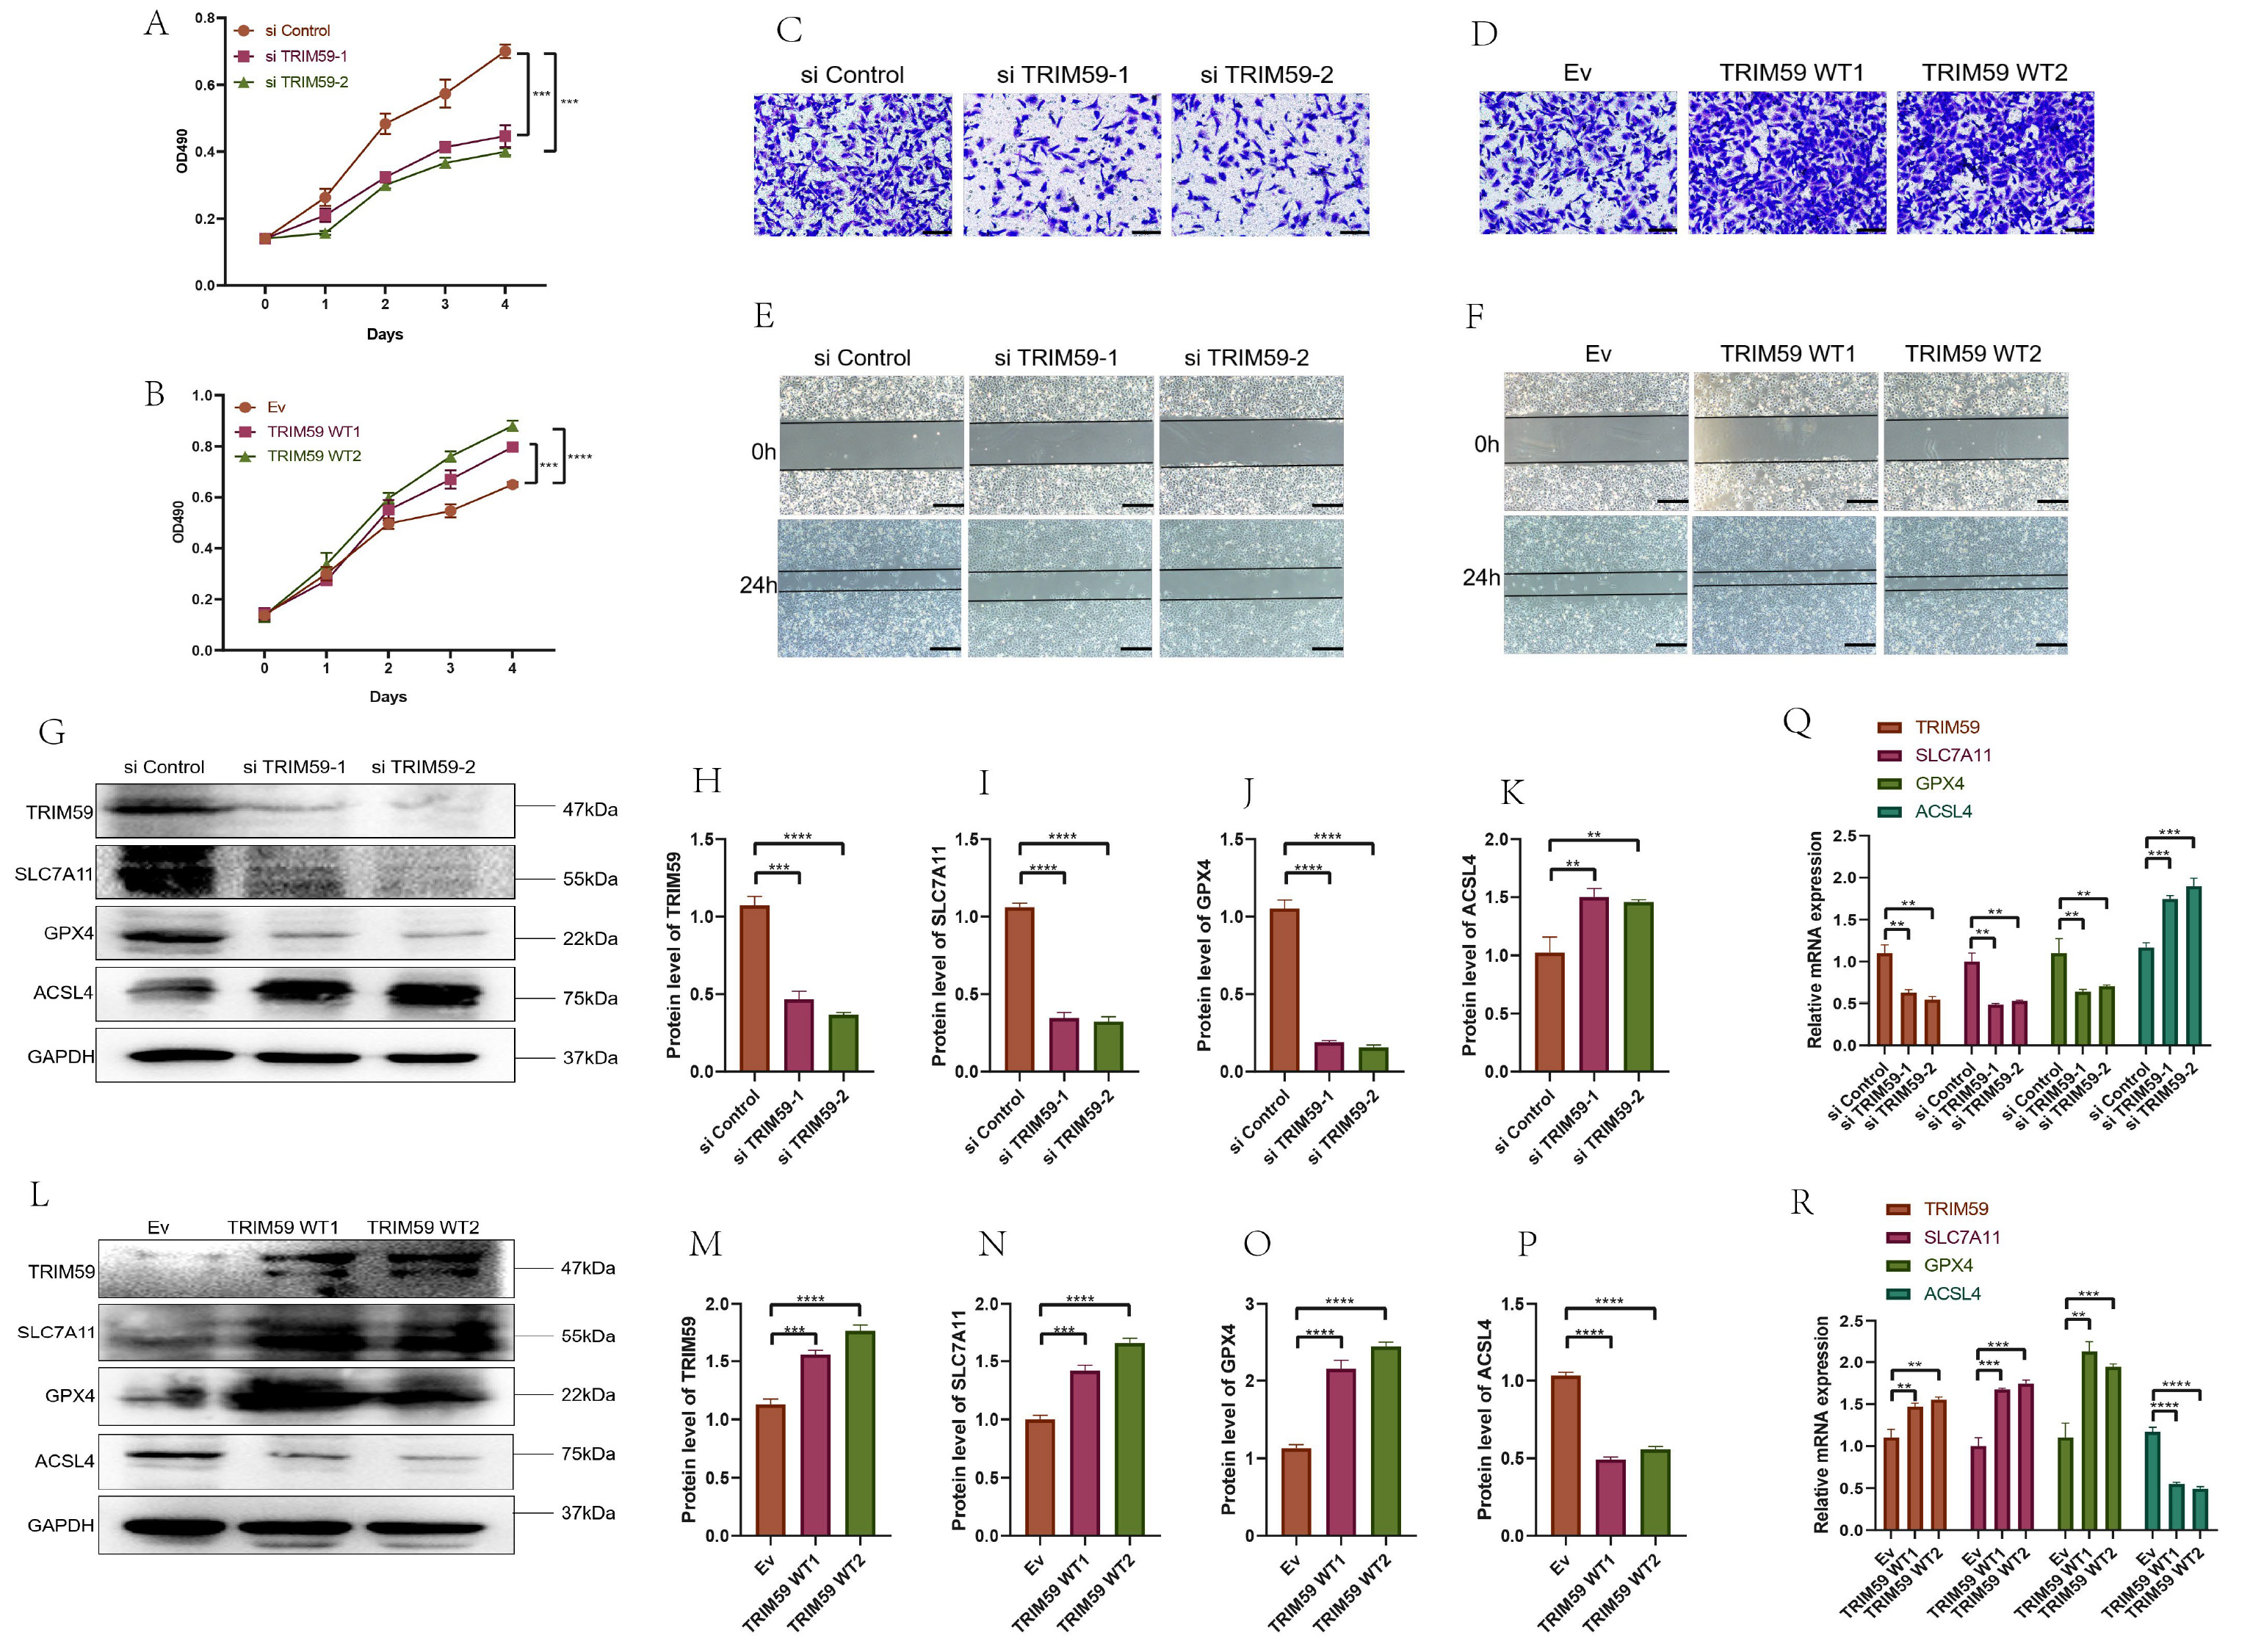 Fig. 10.
TRIM59 affect BCa cell proliferation, migration, and invasion
and enhanced ferroptosis through TRIM59 knockdown in BCa cells and attenuated
ferroptosis via TRIM59 overexpression in BCa. (A) MTT test after TRIM59
knockdown inhibits the proliferation of EJ cells. (B) MTT test after
TRIM59 overexpression promotes the proliferation of 5637 cells. (C)
Invasion assay after TRIM59 knockdown inhibits the proliferation of EJ
cells (Scale bar = 100 µm). (D) Invasion assay after TRIM59 overexpression promotes the
proliferation of 5637 cells (Scale bar = 100 µm). (E) Wound healing test after TRIM59
knockdown inhibits the proliferation of EJ cells (Scale bar = 200 µm). (F) Wound healing test after
TRIM59 overexpression promotes the proliferation of 5637 cells (Scale bar = 200 µm). (G)
TRIM59 knockdown enhances the protein level of ACSL4 and decreases
TRIM59, SLC7A11, and GPX4 levels in EJ cells. (H–K) Quantification of (G). (L)
TRIM59 overexpression decreases the protein level of ACSL4 and enhances
TRIM59, SLC7A11, and GPX4 levels in 5637 cells. (M–P) Quantification of (L). (Q)
TRIM59 knockdown enhances the RNA level of ACSL4 and decreases
TRIM59, SLC7A11, and GPX4 levels in EJ cells. (R)
TRIM59 overexpression decreases the RNA level of ACSL4 and
enhances TRIM59, SLC7A11, and GPX4 levels in 5637
cells. **p
To determine whether ACSL4 is subject to regulation through the ubiquitin-proteasome system, EJ cells were exposed to MG132, a proteasome inhibitor, and ACSL4 protein levels were assessed at various time intervals using WB. The results demonstrated a progressive accumulation of ACSL4 protein over time (Supplementary Fig. 4B), suggesting that ACSL4 is likely regulated via this pathway. To further validate this regulatory mechanism, TRIM59-knockdown EJ cells were transfected with wild-type ubiquitin plasmids and subsequently treated with MG132 for 8 hours. Analysis of ACSL4 ubiquitination levels revealed a marked reduction in ubiquitination when TRIM59 expression was suppressed (Supplementary Fig. 4C). In contrast, 5637 cells were transfected with both TRIM59 overexpression plasmids and wild-type ubiquitin plasmids, followed by MG132 treatment for 8 hours. Western blot results indicated a significant increase in ACSL4 ubiquitination corresponding to elevated TRIM59 expression (Supplementary Fig. 4D). To assess the impact of TRIM59 inhibitors on BCa cells, three compounds (CID123456, CID789012, and CID345678) were tested. MTT assays identified CID123456 as the most effective inhibitor, capable of suppressing the proliferation of both EJ and 5637 cells with half-maximal inhibitory concentrations (IC50) of 12.5 µM and 15.3 µM, respectively (Supplementary Fig. 4E,F). Collectively, these findings indicate that upregulation of TRIM59 mitigates ferroptosis in BCa cells.
To validate the effect of ferroptosis on BCa cells, we treated cells with the ferroptosis activator (1S,3R)-RSL3 (RSL3) and the ferroptosis inhibitors ferrostatin-1 and deferoxamine (iron chelator). Activation of the ferroptosis pathway significantly reduced cell viability in three BCa cell lines, and this effect was reversed by ferroptosis inhibitors (Fig. 11A,E), indicating that activation of the ferroptosis pathway decreases BCa cell viability. In EJ and 5637 cells with TRIM59 knockdown or overexpression, RSL3 treatment at varying concentrations for 24 hours showed that the IC50 of RSL3 decreased with TRIM59 knockdown and increased with overexpression. Cells treated with RSL3 showed reduced viability in si-TRIM59, TRIM59 OE groups compared to controls (Fig. 11B,C,F,G). Lipid peroxidation levels increased in TRIM59 knockdown groups and decreased in overexpression groups following RSL3 treatment, indicating that TRIM59 knockdown promotes ferroptosis in RSL3-treated EJ cells (Fig. 11D,H).
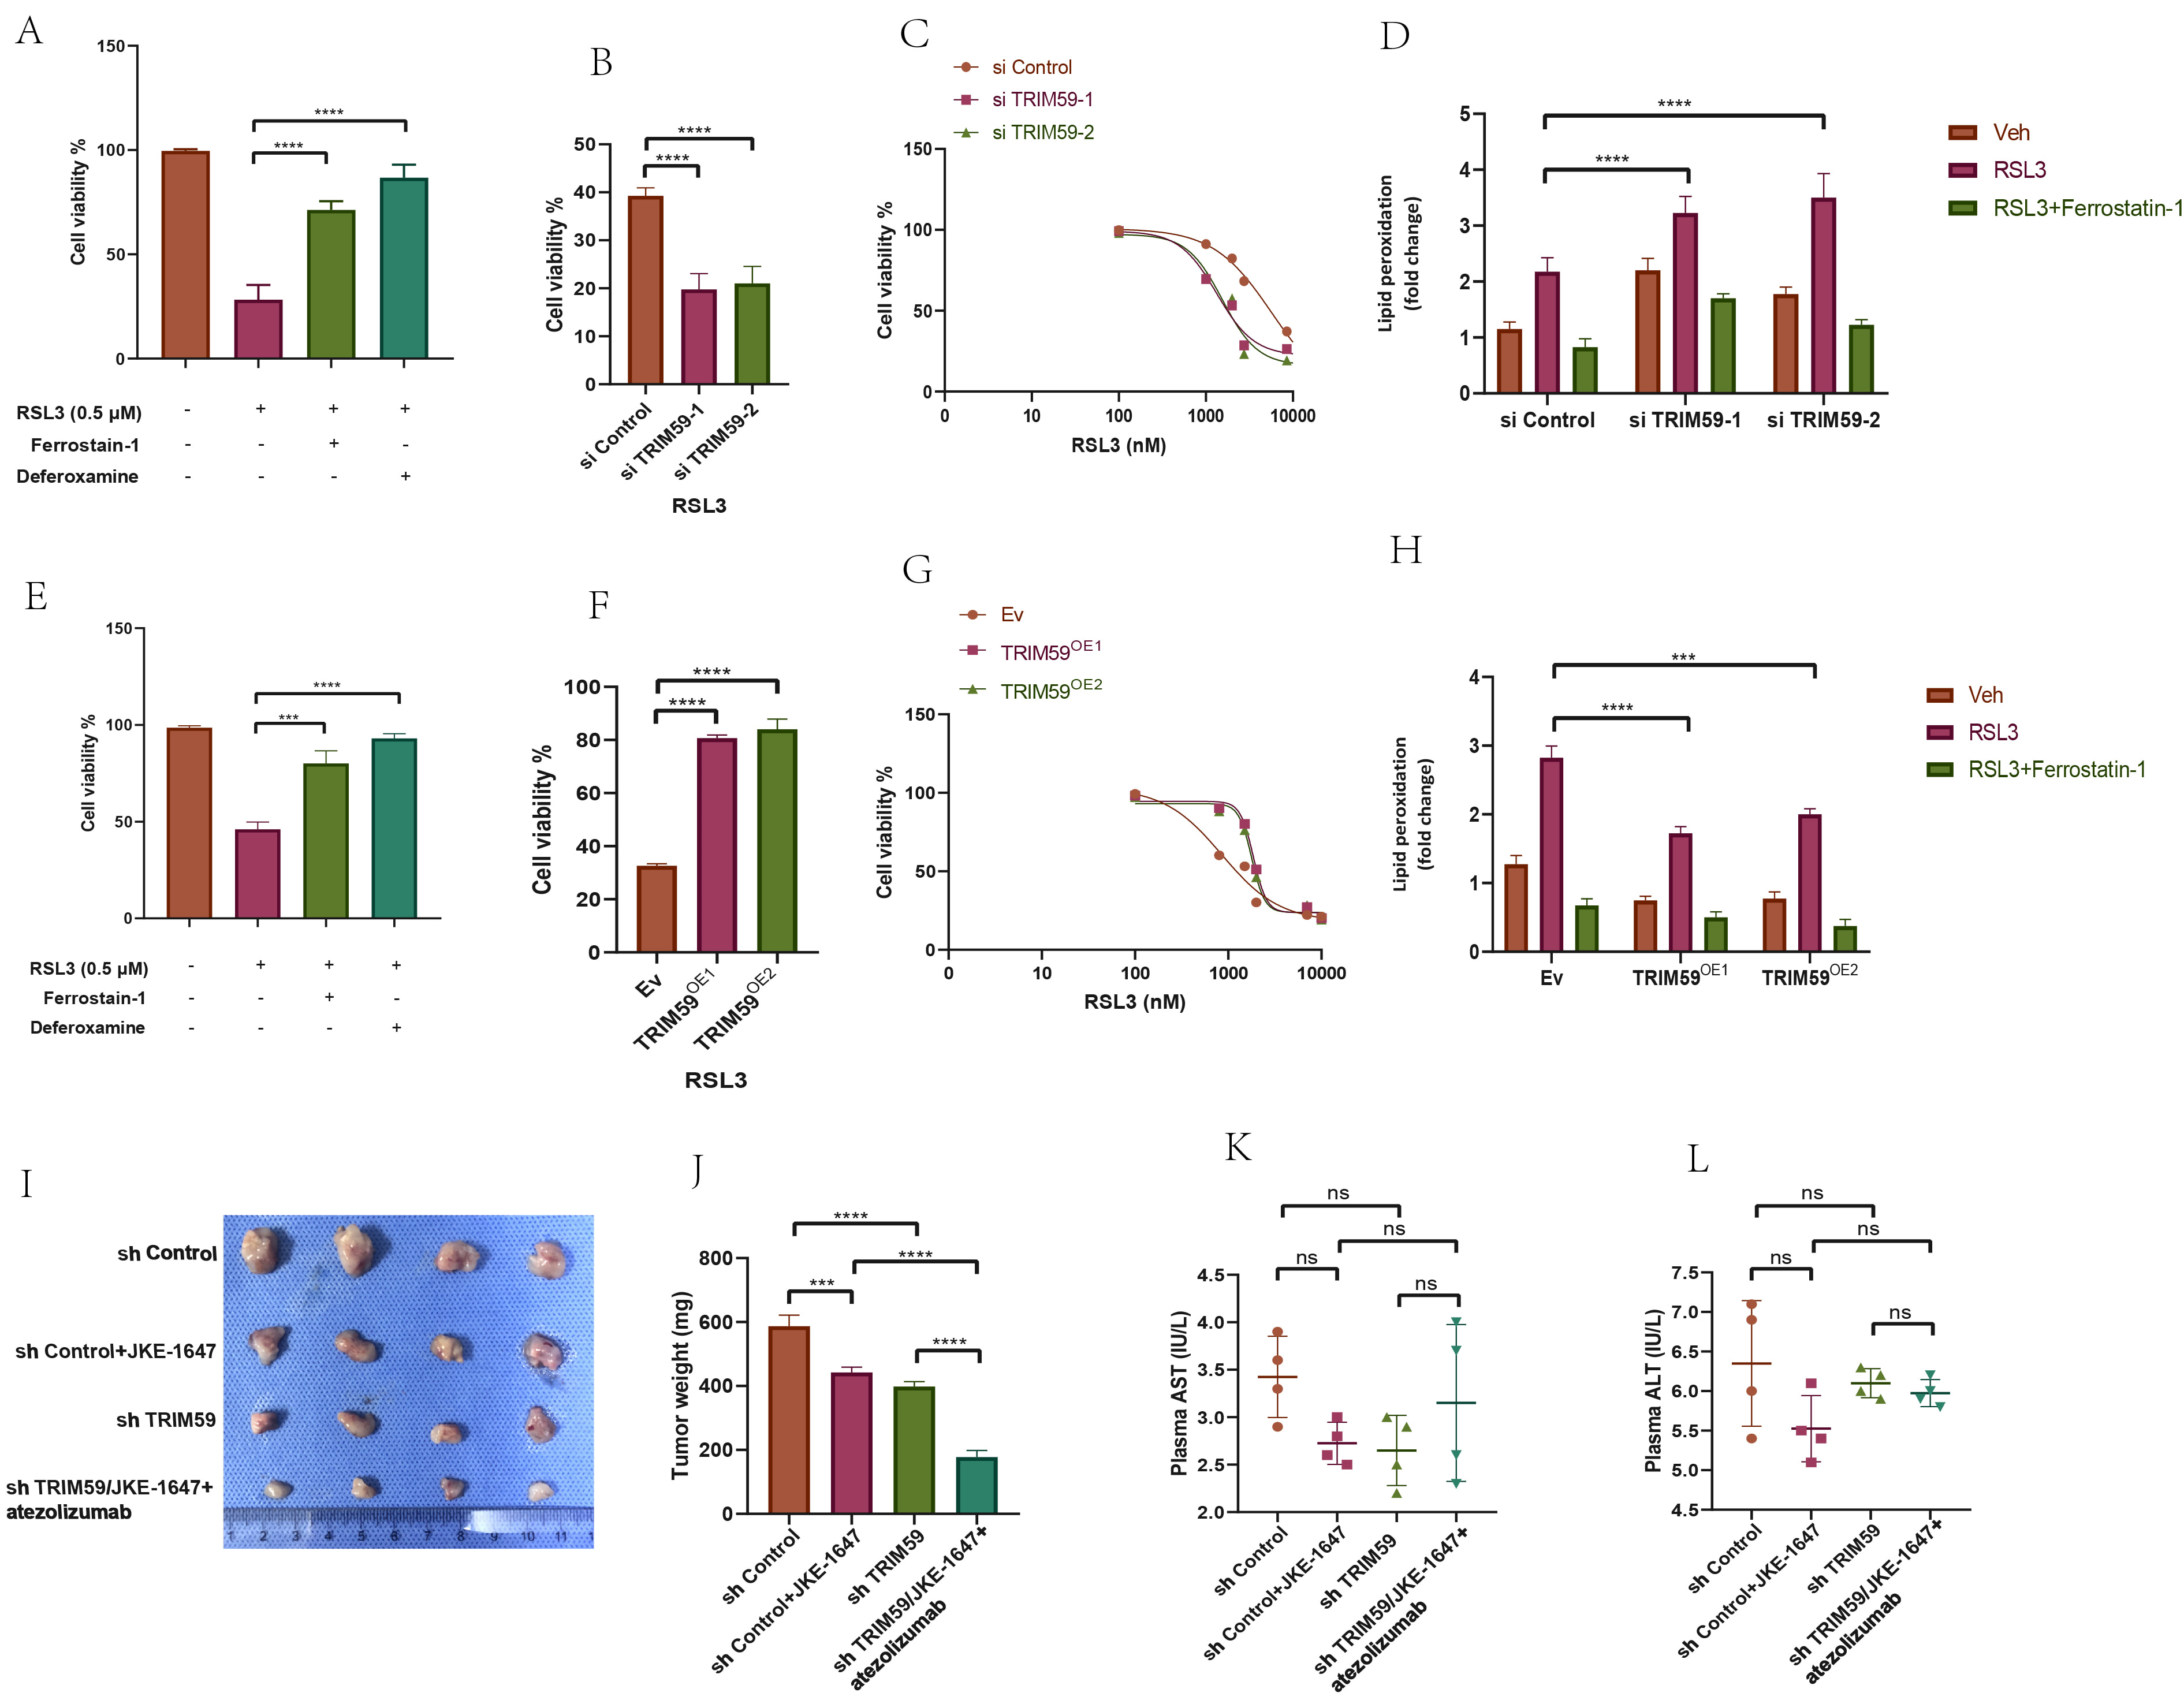 Fig. 11.
Determination of the effect of TRIM59 on the level of
ferroptosis of BCa cells and effect of JKE-1647/atezolizumab on the growth of
subcutaneous transplanted tumors in nude mice. ((A) EJ, (E) 5637) Cell viability
analyses of different groups of two BCa cells treated with ferroptosis activators
or ferroptosis inhibitors. (B,C,F,G) Detection of IC50 values of RSL3 after
knockdown or overexpression of TRIM59 by cell viability analyses. (D,H)
Detection of lipid peroxidation levels after application of RSL3 or Ferrostain-1
in knockdown or overexpression of TRIM59 BCa cells. (I,J) Construction
of CDX models and assessment of tumor weight in various mice groups of EJ cells.
(K,L) Detection of liver function in different groups of nude mice. ***p
Given that JKE-1647 is more easily metabolized in vivo and induces ferroptosis, we chose JKE-1647 as the ferroptosis inducer for in vivo experiments. We developed a subcutaneous tumor model using EJ cells, dividing them into four groups: sh control, sh control with JKE-1647, sh TRIM59, and sh TRIM59 with JKE-1647/atezolizumab. Consistent with in vitro results, ferroptosis activation significantly inhibited subcutaneous tumor growth, and the combination of JKE-1647/atezolizumab and sh TRIM59 had a stronger inhibitory effect than JKE-1647 alone. The combination of TRIM59 knockdown with JKE-1647 and atezolizumab significantly inhibited BCa subcutaneous tumor growth (Fig. 11I,J), suggesting that TRIM59 knockdown enhances ferroptosis activation. The absence of significant differences in plasma ALT and AST levels across the groups indicates that JKE-1647/atezolizumab does not induce hepatotoxicity (Fig. 11K,L).
A multitude of expression variations influenced by cis- or trans-eQTLs can be
explained by differences in genotype frequencies at specific loci. Germline
genetic variants have been found to partially account for mRNA expression
discrepancies across various cancer types, such as BCa, in a population-dependent
manner [23]. The research highlighted 221 m6A-SNPs that exhibited eQTL
associations with BCa, notably the rs3088107 (C
An analysis of distinct signaling pathways between high-risk and low-risk
cohorts revealed significant variations in underlying molecular mechanisms.
Molecules of cell adhesion has the important function on cancer development and
progression by promoting trans-endothelial migration (TEM) of tumor cells, EMT,
and epigenetic modifications, all of which aid in immune escape and metastasis
[30]. Moreover, in many cancers harboring p53 mutations, such as BCa, the repair
of DNA damage largely relies on the G2/M checkpoint. Disruption of this
checkpoint can lead to unresolved DNA damage, forcing cells into mitotic
catastrophe and ultimately triggering apoptosis. On the other hand,
hyperactivation of the G2/M checkpoint enables cancer cells to endure and fosters
tumor advancement [31]. The high-risk group exhibited significant involvement of
pathways associated with “cell-cell adhesion mediator activity”, “cell cycle
regulation”, and “mismatch repair”, indicating a greater likelihood of
malignant evolution in these individuals. Gene Set Enrichment Analysis further
confirmed the overrepresentation of the “EMT” and “G2M checkpoint” pathways,
supporting this observation. The low-risk cohort exhibited heightened activity in
various metabolic pathways, particularly those related to ‘arachidonic acid
metabolism’ and ‘estrogen metabolism’. Arachidonic acid (AA) and its metabolites,
generated through interactions with extracellular molecules via sPLA2, are
essential components of the cellular microenvironment, significantly influencing
immune responses and the development of cancer [32]. In AA metabolism, COX and
LOXs enzymes are critically involved, with their expression levels varying across
tumor tissues. Specifically, COX-2 contributes to tumor advancement by promoting
inflammation, angiogenesis, and cell proliferation [33], while LOXs isoforms,
such as 5-LOX, 12-LOX, and 15-LOX, facilitate the synthesis of LTs and HETEs,
which in turn support tumor cell growth and vascularization, enhancing overall
tumor biological activity [34, 35]. On the other hand, estrogen
receptor-
BCa encompasses several molecular subtypes, including luminal-papillary, luminal-infiltrated, basal-squamous, and neuronal, each displaying distinct molecular and pathological characteristics [37]. The luminal-papillary subtype makes up approximately 35% of all cases and is defined by papillary histology. It is frequently associated with FGFR3 mutations, amplifications, or gene fusions, as well as activation of the Sonic Hedgehog signaling pathway. This subtype is generally linked to a lower likelihood of disease progression and a reduced sensitivity to neoadjuvant chemotherapy (NAC). Given the prevalence of FGFR3 alterations, targeted treatment options such as FGFR3-specific or pan-FGFR inhibitors—Erdafitinib, for instance—may offer therapeutic benefits. The luminal-infiltrated subtype accounts for about 19% of cases and is distinguished by low tumor purity along with substantial infiltration of immune and stromal cells. It also demonstrates elevated expression levels of PD-L1 and cytotoxic T-lymphocyte-associated protein 4 (CTLA4), suggesting that immunotherapeutic approaches, particularly immune checkpoint inhibitors, could be effective, even though this subtype typically responds poorly to standard platinum-based chemotherapy. The basal-squamous subtype, present in roughly 35% of cases, is more frequently observed in women and is marked by squamous differentiation. It also shows high expression of PD-L1 and CTLA4, along with significant immune and stromal cell infiltration, indicating potential responsiveness to both platinum-based chemotherapy and immunotherapy [38]. Through an analysis of BCa molecular subtypes, our findings reveal that the risk model successfully differentiates among these subtypes. The basal-like subtype is primarily represented in the high-risk category, whereas the luminal-like subtype is more common in the low-risk group. A comparative assessment of key gene mutations across the two risk groups highlighted significant variations in the mutation patterns and allele frequencies of TP53, TTN, and PIK3CA. Combining the risk model with molecular subtype classification enhances the accuracy of prognostic predictions, offering valuable insights for the clinical management of BCa.
The immune microenvironment of BCa plays a crucial role in both the onset and
progression of the disease. Within this microenvironment, macrophages exhibit a
range of functional states, broadly classified into two types: M1 macrophages,
which have tumor-suppressive properties, and M2 macrophages, which support tumor
growth [39]. M2 macrophages, often recognized by the presence of markers such as
CD163 and IL-10, are frequently found in high numbers within the tumor area and
are associated with worse clinical outcomes in BCa patients [40]. Studies suggest
that combining PD-L1 blockade with TGF-
Ferroptosis represents a recently characterized form of regulated cell death, primarily distinguished by its reliance on iron and the buildup of lipid reactive oxygen species [45]. In cancer contexts, ferroptosis is modulated by multiple signaling pathways, including but not limited to Nuclear Factor Erythroid 2-Related Factor 2 (Nrf2), p53, heme oxygenase-1, Autophagy-related gene 6 (BECN1), and Fanconi anemia, complementation group D2 (FANCD2) [46]. Our findings reveal that TRIM59 promotes the expression of SLC7A11 and GPX4, two key proteins that act to suppress ferroptosis. SLC7A11 functions as a cystine transporter, facilitating the synthesis of glutathione and enhancing cellular antioxidant defenses [47, 48]. It is widely acknowledged as a negative regulator of ferroptosis and is frequently overexpressed in various malignancies [49]. Elevated levels of SLC7A11 have been associated with tumor development through both ferroptosis-dependent and independent mechanisms. Our experimental data demonstrated that silencing TRIM59 reduced the expression of SLC7A11 and GPX4 in BCa cells, both in cultured cell models and in animal models. Moreover, TRIM59 knockdown increased the sensitivity of BCa cells to DOX treatment by promoting ferroptotic cell death.
By combining genomic, eQTL, and transcriptomic data, we have developed a comprehensive risk model that deepens our understanding of the molecular mechanisms underlying BCa and its tumor immune microenvironment, thus facilitating more precise treatment approaches. This research provides novel perspectives on the molecular characteristics of BCa and establishes a foundation for tailored therapeutic interventions. Through an in-depth analysis of the connections between the BCa risk model, immune microenvironment, response to chemotherapy, and clinical outcomes, we present meaningful tools to support future personalized management and treatment of BCa patients. However, certain limitations of this study must be acknowledged. The findings may have limited applicability across broader populations due to the specific demographic characteristics of the samples used, highlighting the need for further large-scale, multi-center investigations. Additionally, while associations between genetic variations and different risk categories have been identified, more research is necessary to uncover the specific mechanisms at play within BCa subtypes.
This research has established a screening framework aimed at uncovering cellular diversity within the ferroptosis and immune microenvironment influenced by BCa, while also identifying novel biomarker candidates. The findings emphasize the critical role of TRIM59 in the progression of BCa. Increased expression of TRIM59 correlates with tumor development and resistance to chemotherapy in BCa cases. Suppressing TRIM59 could potentially promote ferroptosis in BCa cells, thereby improving their responsiveness to DOX. Combining ferroptosis-triggering agents with immunotherapeutic strategies targeting TRIM59 may offer a viable treatment option for BCa. Furthermore, progress in precision medicine—leveraging combined genomic, transcriptomic, and clinical data—will support the development of tailored therapeutic approaches for individuals with BCa.
The datasets used and analyzed during the current study are available from the corresponding author on reasonable request.
Conceptualization, JL, XW, HL, PW, YQ, XZ, and PZ; material preparation, JL, PW and YQ; writing original draft preparation, JL, XZ and PZ; writing, editing and review, JL and HL. All authors contributed to editorial changes in the manuscript. All authors read and approved the final manuscript. All authors have participated sufficiently in the work and agreed to be accountable for all aspects of the work.
This study was approved by the Animal Ethics Committee of Tianjin Medical University. Our in vivo studies strictly follow the “ARRIVE and PREPARE” guidelines. All experiments were conducted in accordance with relevant guidelines and regulations (IRB2019-KY-086). The TCGA and GEO databases are open access and freely available to all researchers, in compliance with ethical guidelines.
We acknowledge the TCGA and GEO databases and their contributors.
This work was supported by the Research Project of Tianjin Medical University Cancer Institute & Hospital (NO. Y1715, Y1904, Y1905), Tianjin Key Medical Discipline (Specialty) Construction Project (TJYXZDXK-009A).
The authors declare no conflict of interest.
Supplementary material associated with this article can be found, in the online version, at https://doi.org/10.31083/FBL44395.
References
Publisher’s Note: IMR Press stays neutral with regard to jurisdictional claims in published maps and institutional affiliations.