


 , Shengkai Huang 2, Mengyao Yu 2, Lili Wang 2, Hengwen Gong 2, Rui Qiao 3, Jun Ma 4,*
1 Department of Clinical Laboratory, Shanxi Province Cancer Hospital/Cancer Hospital Affiliated to Shanxi Medical University/Shanxi Hospital Affiliated to Cancer Hospital, Chinese Academy of Medical Sciences, 030013 Taiyuan, Shanxi, China
2 Department of Clinical Laboratory, National Cancer Center/National Clinical Research Center for Cancer/Cancer Hospital, Chinese Academy of Medical Sciences and Peking Union Medical College, 100021 Beijing, China
3 Department of Clinical Laboratory, Peking University Third Hospital, 100191 Beijing, China
4 Department of General Surgery, Shanxi Province Cancer Hospital/Cancer Hospital Affiliated to Shanxi Medical University/Shanxi Hospital Affiliated to Cancer Hospital, Chinese Academy of Medical Sciences, 030013 Taiyuan, Shanxi, China
†These authors contributed equally.
Abstract
Pancreatic ductal adenocarcinoma (PDAC) is a lethal malignancy with a high incidence of thrombosis. Coagulation factor 3 (F3) plays a key role in initiating the coagulation pathway. This study identified cell subpopulations that highly express F3 and explored their potential roles in PDAC.
This study evaluated 1837 patients with PDAC from two cancer hospitals between November 1, 2023, and November 30, 2024. The analyses included assessing coagulation and fibrinolysis indicators, and employing single-cell sequencing technology to examine the tumor microenvironment in freshly resected PDAC tissues. Findings were validated using the Gene Expression Omnibus database.
Over half of the patients (54.98%) with PDAC showed abnormal coagulation indicators. F3 mRNA and protein levels were higher in PDAC tissues than in normal tissues. This high F3 expression in PDAC was associated with a poor prognosis (p < 0.01). Analysis of 33,300 cells from freshly resected PDAC tissues showed high F3 expression in cancer-associated fibroblasts (CAFs) and ductal cells. Subsequent subtype analysis indicated that ductal cell 1 (tumor cells) and inflammatory CAFs (iCAFs) exhibited high F3 expression. Pseudotime trajectory analysis showed that iCAFs were prevalent in the earlier part of the pseudotime pathway. Notably, pathways associated with inflammation, phosphoinositide 3-kinase/Akt signaling, and coagulation and complement were significantly enriched in iCAFs. In addition, the interaction between iCAFs and tumor cells was regulated by growth factor receptor–ligand pairings. “GSE212966” and “GSE197177” data confirmed these results.
The high expression of F3 in specific iCAF subtypes suggests a role in PDAC hypercoagulability and tumor progression. Targeting these iCAF subtypes could provide potential strategies for treating PDAC.
Keywords
- coagulation factor 3
- thrombosis
- single-cell analysis
- cancer-associated fibroblasts
- pancreatic ductal adenocarcinoma
Pancreatic ductal adenocarcinoma (PDAC) is a lethal malignant tumor that is often diagnosed at an advanced stage. The 5-year survival rate is only 5% to 10% [1, 2, 3]. Currently, there is no effective treatment, and only 15% to 20% of patients with PDAC diagnosed early are candidates for surgery [4]. Patients with cancer are often at increased risk of thrombosis, which significantly contributes to their mortality [5, 6]. While the incidence of thromboembolism varies across different cancer types, pancreatic tumors are particularly associated with a high incidence [7]. A recent population-based cohort study found that the incidence of venous thromboembolism during the initial 6 months post-diagnosis in the pancreatic cancer cohort was 15.6% [8]. However, the mechanisms of thrombosis in pancreatic tumors are complex and have not been fully elucidated. Tissue factor (TF), also known as coagulation factor 3 (F3), is a primary initiator of the coagulation pathway. Consequently, F3 is also a key factor in inducing a hypercoagulable state and thrombosis [9]. However, according to previous reports, F3 plays a role in tumor progression. Previous studies showed that under pathological conditions, F3 is overexpressed in tumor cells, which can negatively affect patient prognosis through various biological processes such as thrombosis, angiogenesis, proliferation, invasion, and metastasis [10, 11]. Moreover, under pathological conditions, F3 is also involved in the tumor microenvironment (TME) [10]. Emerging evidence suggests that coagulation is closely related to the TME [12].
The TME is composed of multiple cell types [13]. Among them, there are large numbers of non-malignant mesenchymal cells in the PDAC TME, which support tumor cells [14]. Among these mesenchymal cells, cancer-associated fibroblasts (CAFs) play a significant role in the proliferation and migration of tumor cells [15, 16, 17]. In addition, it has been reported that CAFs may play a role in tumor-associated thrombosis [18]. Recent studies have highlighted the diverse nature of CAFs, revealing their heterogeneity in order to enhance therapeutic targeting of the TME [4, 14]. Werba et al. [4] utilized single-cell RNA sequencing to identify two different subtypes of CAFs in the PDAC TME: myofibroblastic CAFs (mCAFs) and inflammatory CAFs (iCAFs). iCAFs primarily secrete cytokines and chemokines, while mCAFs are key players in extracellular matrix (ECM) regulation and collagen deposition [4, 14]. However, the precise role of CAFs in tumor-associated thrombosis remains unclear, and the relationship between CAFs and F3 remains undefined.
In this study, we analyzed different coagulation markers in patients with PDAC and utilized single-cell sequencing to map the PDAC landscape, identifying cell subpopulations with high F3 expression and their potential role in hypercoagulability and tumor progression. In addition, data from a public database were used to confirm our results.
This study evaluated 1837 patients with pancreatic adenocarcinoma from the National Clinical Research Center for Cancer (n = 1567) and Shanxi Province Cancer Hospital (n = 270) between November 1, 2023 and November 30, 2024. The inclusion criteria were patients with a confirmed histopathological diagnosis of PDAC, no current anticoagulant use, and no surgical intervention in the last month. Patients were excluded if they had coagulation dysfunction, were receiving anticoagulant therapy, had incomplete basic information, or were pregnant or lactating.
Blood coagulation and fibrinolysis indicators were detected in these patients. Measurements of activated partial thromboplastin time (APTT), prothrombin time (PT), fibrinogen (FIB), fibrin/fibrinogen degradation products, (FDP) and D-dimer were performed using an automated coagulation analyzer (ACL TOP 750; Werfen, Barcelona, Spain).
Three tissue samples from three patients with pancreatic adenocarcinoma were collected in this study. Each patient underwent surgical resection at Shanxi Cancer Hospital. Subsequent pathological diagnosis revealed PDAC in the three patients. All human samples used in this research received ethical approval from ethics committees.
PDAC tissue samples were washed in cryogenic phosphate-buffered saline (Hyclone, Logan, UT, USA) and dissociated using the SeekMate Tissue Dissociation Reagent Kit A Pro (K01801301, SeekGene, Beijing, China) in accordance with the manufacturer’s instructions. After removing red blood cells, the Fluorescence Cell Analyzer Countstar® Rigel S2 (Ruiyu Biotechnology Co., Ltd., Shanghai, China) was used to estimate the cell count and survival rate. Then those fragments and dead cells were cleared. These fresh cells were washed with RPMI 1640 medium (Gibco, Carlsbad, CA, USA) and resuspended in RPMI 1640 supplemented with 2% fetal bovine serum (Gibco) at a density of 1
A 5′ library preparation kit (No.K00501, SeekGene, Beijing, China) and V(D)J enrichment kit (human T-cell receptor) (No. K00601, SeekGene, Beijing, China) were used to construct the libraries. First, the cells and reverse transcription reagents were mixed and then added to the sample wells on the Chips. Second, the partitioning oil and gel beads were respectively added to these wells. After the formation of emulsion droplets, reverse transcription was performed at 42 °C for 90 min and inactivation was performed at 85 °C for 5 min. Third, the purified cDNA was amplified in this above reaction system. The cDNA product amplified from 5′ cDNA was enriched for V(D)J amplification. Finally, the indexed PCR amplification was carried out on these samples to amplify the 5′ portion of these expressed genes containing unique molecular identifiers (UMIs) and cell barcodes. The indexed sequencing libraries were cleaned and analyzed. Finally, sequencing was performed on the NovaSeq 6000 Sequencing System (Illumina, San Diego, CA, USA) with paired-end read length of 150 base pairs. In this study, all cell lines were validated by STR and tested negative for mycoplasma.
Fastp was used to remove low-quality bases and primer sequences from these original data. Then these sequence data were analyzed using SeekOne®Tools (SeekGene, Beijing, China). Seurat (version 4.0.0) was applied to omit these low-quality cells (gene numbers
The NormalizeData function from Seurat (version 4.0.0) was used to normalize each cell. The FindVariableGenes function was used to calculate the variable genes. The FindIntegrationAnchors and IntegrateData functions were applied to combine all libraries together, and the ScaleData function was applied to regress out UMIs. Principal component analysis and uniform manifold approximation and projection were applied to reduce the dimensions. These cells were clustered by the 20 dims at a resolution of 0.8. Then the FindAllMarkers function was applied to determine cluster-specific genes. These selected marker genes exhibited expression in at least 10% of cells and at a minimum logFC of 0.25.
The level of copy number variation (CNV) was estimated using the inferCNV R package. Ductal epithelial cells (excluding endocrine cells) were considered to be the putative tumor epithelial cell dataset. Immunocytes served as the reference group. Denoised CNV profiles, excluding those from sex chromosomes, were used to estimate and identify malignant cells.
Gene Ontology and Kyoto Encyclopedia of Genes and Genomes (KEGG) were used to perform biological process and pathway enrichment analysis using the clusterProfiler R package. Gene set variation analysis (GSVA) was performed on hallmark pathways obtained in the Molecular Signatures Database (version 7.0, https://www.gsea-msigdb.org/gsea/msigdb), and GSVA scores were obtained by the R package GSVA (version 1.34).
The lineage differentiation was evaluated by Monocle 2 (version 2.3.6, https://bioconductor.org/packages/release/bioc/html/monocle.html). Then the original data were converted into CellDataSet through the import CDS function, and genes for pseudotime ordering were selected using the dispersionTable function.
The transcription factors and their downstream motif target genes were calculated using the single-cell regulatory network inference and clustering (SCENIC) computational method; then the activity levels of these transcription factor regulons were quantified within each cell. The pySCENIC was run with its default parameters. The CellPhoneDB tool was employed to analyze ligand–receptor interactions in different cell types. In one cell type, specific interactions identified by ligand–receptor expression were present in more than 10% of the cells. Paired comparisons were further made among these included cell types. Then we selected for biologically relevant interactions.
Single-cell sequencing data from the GSE212966 and GSE197177 profile were downloaded from the Gene Expression Omnibus (GEO) database (https://www.ncbi.nlm.nih.gov/geo/) for verification purposes. Coagulation factor mRNA expression profiles in pancreatic adenocarcinoma and normal tissues from The Cancer Genome Atlas (TCGA) database (https://www.cancer.gov/ccg/research/genome-sequencing/tcga) and genotype-tissue expression (GTE) database (https://www.gencodegenes.org/) were accessed using the gene expression profiling interactive analysis (GEPIA) database (http://gepia.cancer-pku.cn/). Coagulation factor protein expression profiles in pancreatic adenocarcinoma and normal tissues from the clinical proteomic tumor analysis consortium (CPTAC) database (https://proteomics.cancer.gov/data-portal) were analyzed using the University of ALabama at Birmingham CANcer (UALCAN) data analysis portal (https://ualcan.path.uab.edu).
Paraffin-embedded specimens were sectioned at a thickness of 3 µm. The sections were placed in a constant temperature wax box at 60 °C for 10–15 minutes and then cooled in a refrigerator at 4 °C. The sections were incubated with Tissue Factor/CD142 Recombinant antibody (1:600; 83776-4-RR; Proteintech, Wuhan, China) at 4 °C overnight, then incubated with horseradish peroxidase-labeled goat anti-mouse secondary antibody (1:600; No.760-700; Roche Diagnostics Products, Shanghai, China) at 37 °C for 30 minutes, and then stained with 3,3′-diaminobenzidine (DAB, Roche Diagnostics Products, Shanghai, China) at room temperature for 2 minutes. Staining was performed using an automatic immunohistochemical platform (BenchMark ULTRA, Roche Diagnostics Products, Shanghai, China). Then, gradient alcohol dehydration, xylene clearing, and neutral gum mounting were performed. Finally, the results were observed under an optical microscope (OLYMPUS BX41, Olympus Corporation, Shinjuku City, Japan). Negative (–): no color reaction; Positive (+): the cells were stained tan or brown.
Data were checked for normality. For normally distributed continuous data, the results are presented as the mean and standard deviation (SD); otherwise, the median (M) and interquartile range are reported. The t-test was used for statistical comparisons of normally distributed data, whereas the Mann-Whitney U test was applied to data with asymmetrical distributions. The survival rates were estimated using the Kaplan-Meier method and compared using the log-rank test. The hazard ratio (HR) and its 95% confidence intervals (CIs) were calculated using Cox proportional hazards regression models. All statistical analyses were conducted using SPSS software (version 23.0; IBS SPSS Statistics, Armonk, NY, USA). p
A total of 1837 patients with pancreatic adenocarcinoma were included in this study, of whom more than half (54.98%) showed abnormal coagulation indicators (Table 1). Among the 1567 patients with pancreatic adenocarcinoma from the National Clinical Research Center for Cancer, 54.05% showed abnormal coagulation indicators. Among the 270 patients with pancreatic adenocarcinoma from Shanxi Province Cancer Hospital, 60.37% showed abnormal coagulation indicators. There was no significant difference in the number of patients with abnormal coagulation indicators (p = 0.053), or in age and sex (p = 0.268 and p = 0.836, respectively) between the two groups of patients (Table 1).
| Group 1 (n = 1567) | Group 2 (n = 270) | p-value | ||
| Coagulation indicators | ||||
| Normal (n%) | 720 (45.95%) | 107 (39.63%) | 0.053 | |
| Abnormal (n%) | 847 (54.05%) | 163 (60.37%) | ||
| Gender | ||||
| Male (n%) | 904 (57.69%) | 157 (58.15%) | 0.836 | |
| Female (n%) | 663 (42.31%) | 113 (41.85%) | ||
| Age (year) | 62 (54, 69) | 62.5 (57, 68) | 0.268 | |
Group 1: Patients with pancreatic adenocarcinoma from National Clinical Research Center for Cancer. Group 2: Patients with pancreatic adenocarcinoma from Shanxi Province Cancer Hospital. The chi-square test was used to compare the coagulation indicators and gender between the two groups. Median (M) and quartile ranges from the lower quartile Q1 to the upper quartile Q3 (Q1–Q3) were used in age. Statistical comparisons were tested with Mann-Whitney U test. p
The coagulation factors in the mRNA expression profiles between 179 pancreatic adenocarcinoma tissues and 171 normal pancreatic tissues from TCGA database and GTE database were analyzed (Supplementary Fig. 2). The results showed that the mRNA expression levels of F3, F5, F10, and F12 were higher in pancreatic adenocarcinoma tissues than in normal pancreatic tissues (p
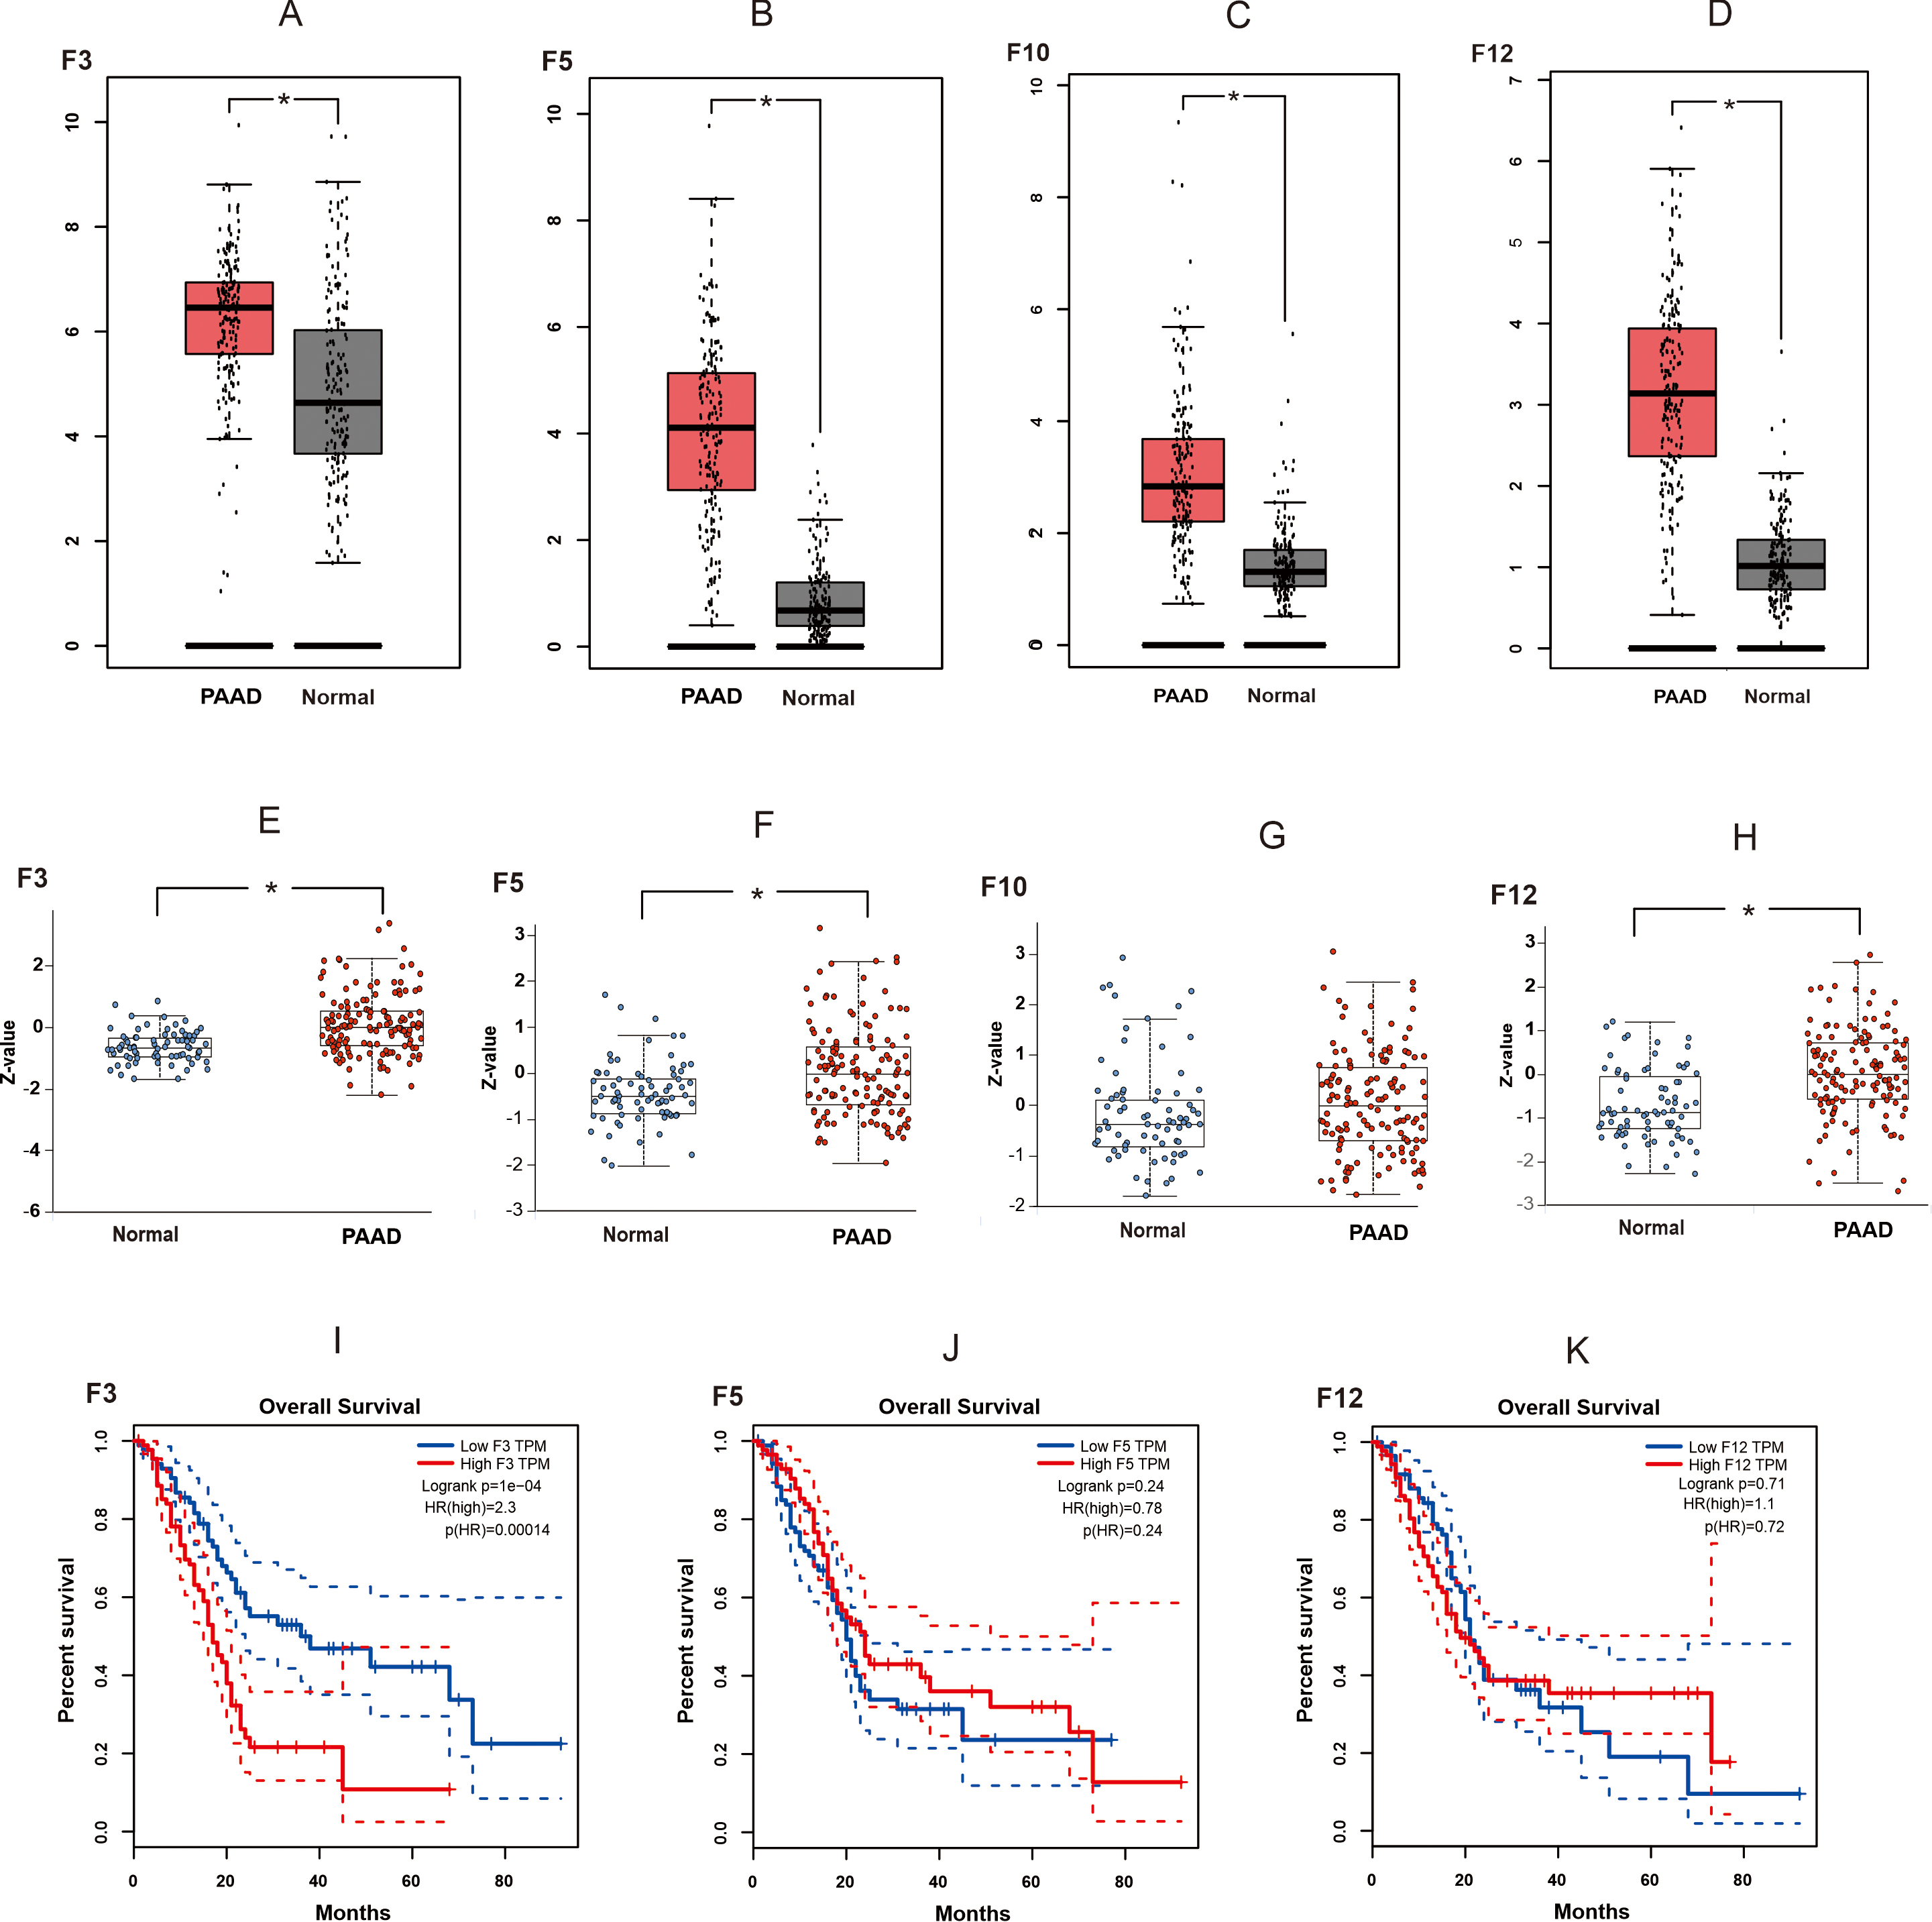 Fig. 1.
 The expression and the survival analysis of coagulation factors in pancreatic adenocarcinoma tissues. (A–D) The mRNA expression levels of F3, F5, F10, and F12 between PAAD tissues and normal pancreatic tissues. The expression data are first log2 (TPM + 1) transformed for differential analysis on the Y-axis. (E–H) Protein expression levels of F3, F5, F10, and F12 between PAAD tissues and normal pancreatic tissues. Z-values represent standard deviations from the median across samples for the given cancer type. Log2 Spectral count ratio values from CPTAC data were first normalized within each sample profile, then normalized across samples. (I–K) The relationship between the expression of F3, F5, F12 and survival outcomes of patients with PAAD. Statistical significance was defined as * p
Information on the three patients is shown in Supplementary Table 2. These tissues were processed and dissociated into single-cell suspensions, which then were used for single-cell sequencing. After the strict quality control and standardized analysis, we obtained transcriptome profile data. A total of 33,300 cells were analyzed, and 13 distinct cell clusters annotated by gene expression profiles were displayed (Fig. 2A). These clusters included fibroblasts (collagen, type I, alpha 1 [COL1A1] and lumican [LUM]), T cells (cluster of differentiation 3 epsilon [CD3E] and CD2), ductal cells (keratin 19 [KRT19] and trefoil factor 1 [TFF1]), macrophages (CD68 and CD14), B cells (membrane spanning 4-domains A1 [MS4A1] and B cell scaffold protein with ankyrin repeats 1[BANK1]), neutrophils (S100A8 and G0/G1 switch 2 [G0S2]), stellate cells (adipogenesis regulatory factor [ADIRF] and chromosome 11 open reading frame 96 [C11orf96]), endothelial cells (platelet endothelial cell adhesion molecule [PECAM1] and Von Willebrand factor [VWF]), plasma cells (joining chain of multimeric IgA and IgM [JCHAIN]) and immunoglobulin kappa constant [IGKC]), mast cells (tryptase alpha-1 and tryptase beta-1 [TPSAB1] and tryptase beta-2 [TPSB2]), acinar cells (protease serine 1 [PRSS1] and regenerating gene 1 alpha [REG1A]), Schwann cell (cadherin-19 [CDH19] and neurexin [NRXN1]), and beta cells (proprotein convertase subtilisin/kexin type 1 inhibitor [PCSK1N] and chromogranin B [CHGB]) (Fig. 2B). Fig. 2C shows that ductal cells (34.64%), fibroblasts (23.34%), macrophages (14.56%), and T cells (11.81%) were the dominant cell populations. The proportion of each cell type differed across patients (Fig. 2D), likely reflecting interpatient heterogeneity. To further verify the distribution of tumor cells in the entire ductal cell population, gene copy numbers were analyzed using InferCNV software. When using macrophages as a reference, the tumor cells within ductal cells exhibited substantial CNVs (Fig. 3A–C). Fibroblasts express well-known fibroblast-related markers such as LUM, COL1A1, DCN (decorin), and SFRP2 (secreted frizzled-related protein 2) (Fig. 2B). We named these fibroblasts CAFs. Fig. 2G shows that F3 expression was elevated in both CAFs (n = 7417 cells) and ductal cells (n = 11,008 cells).
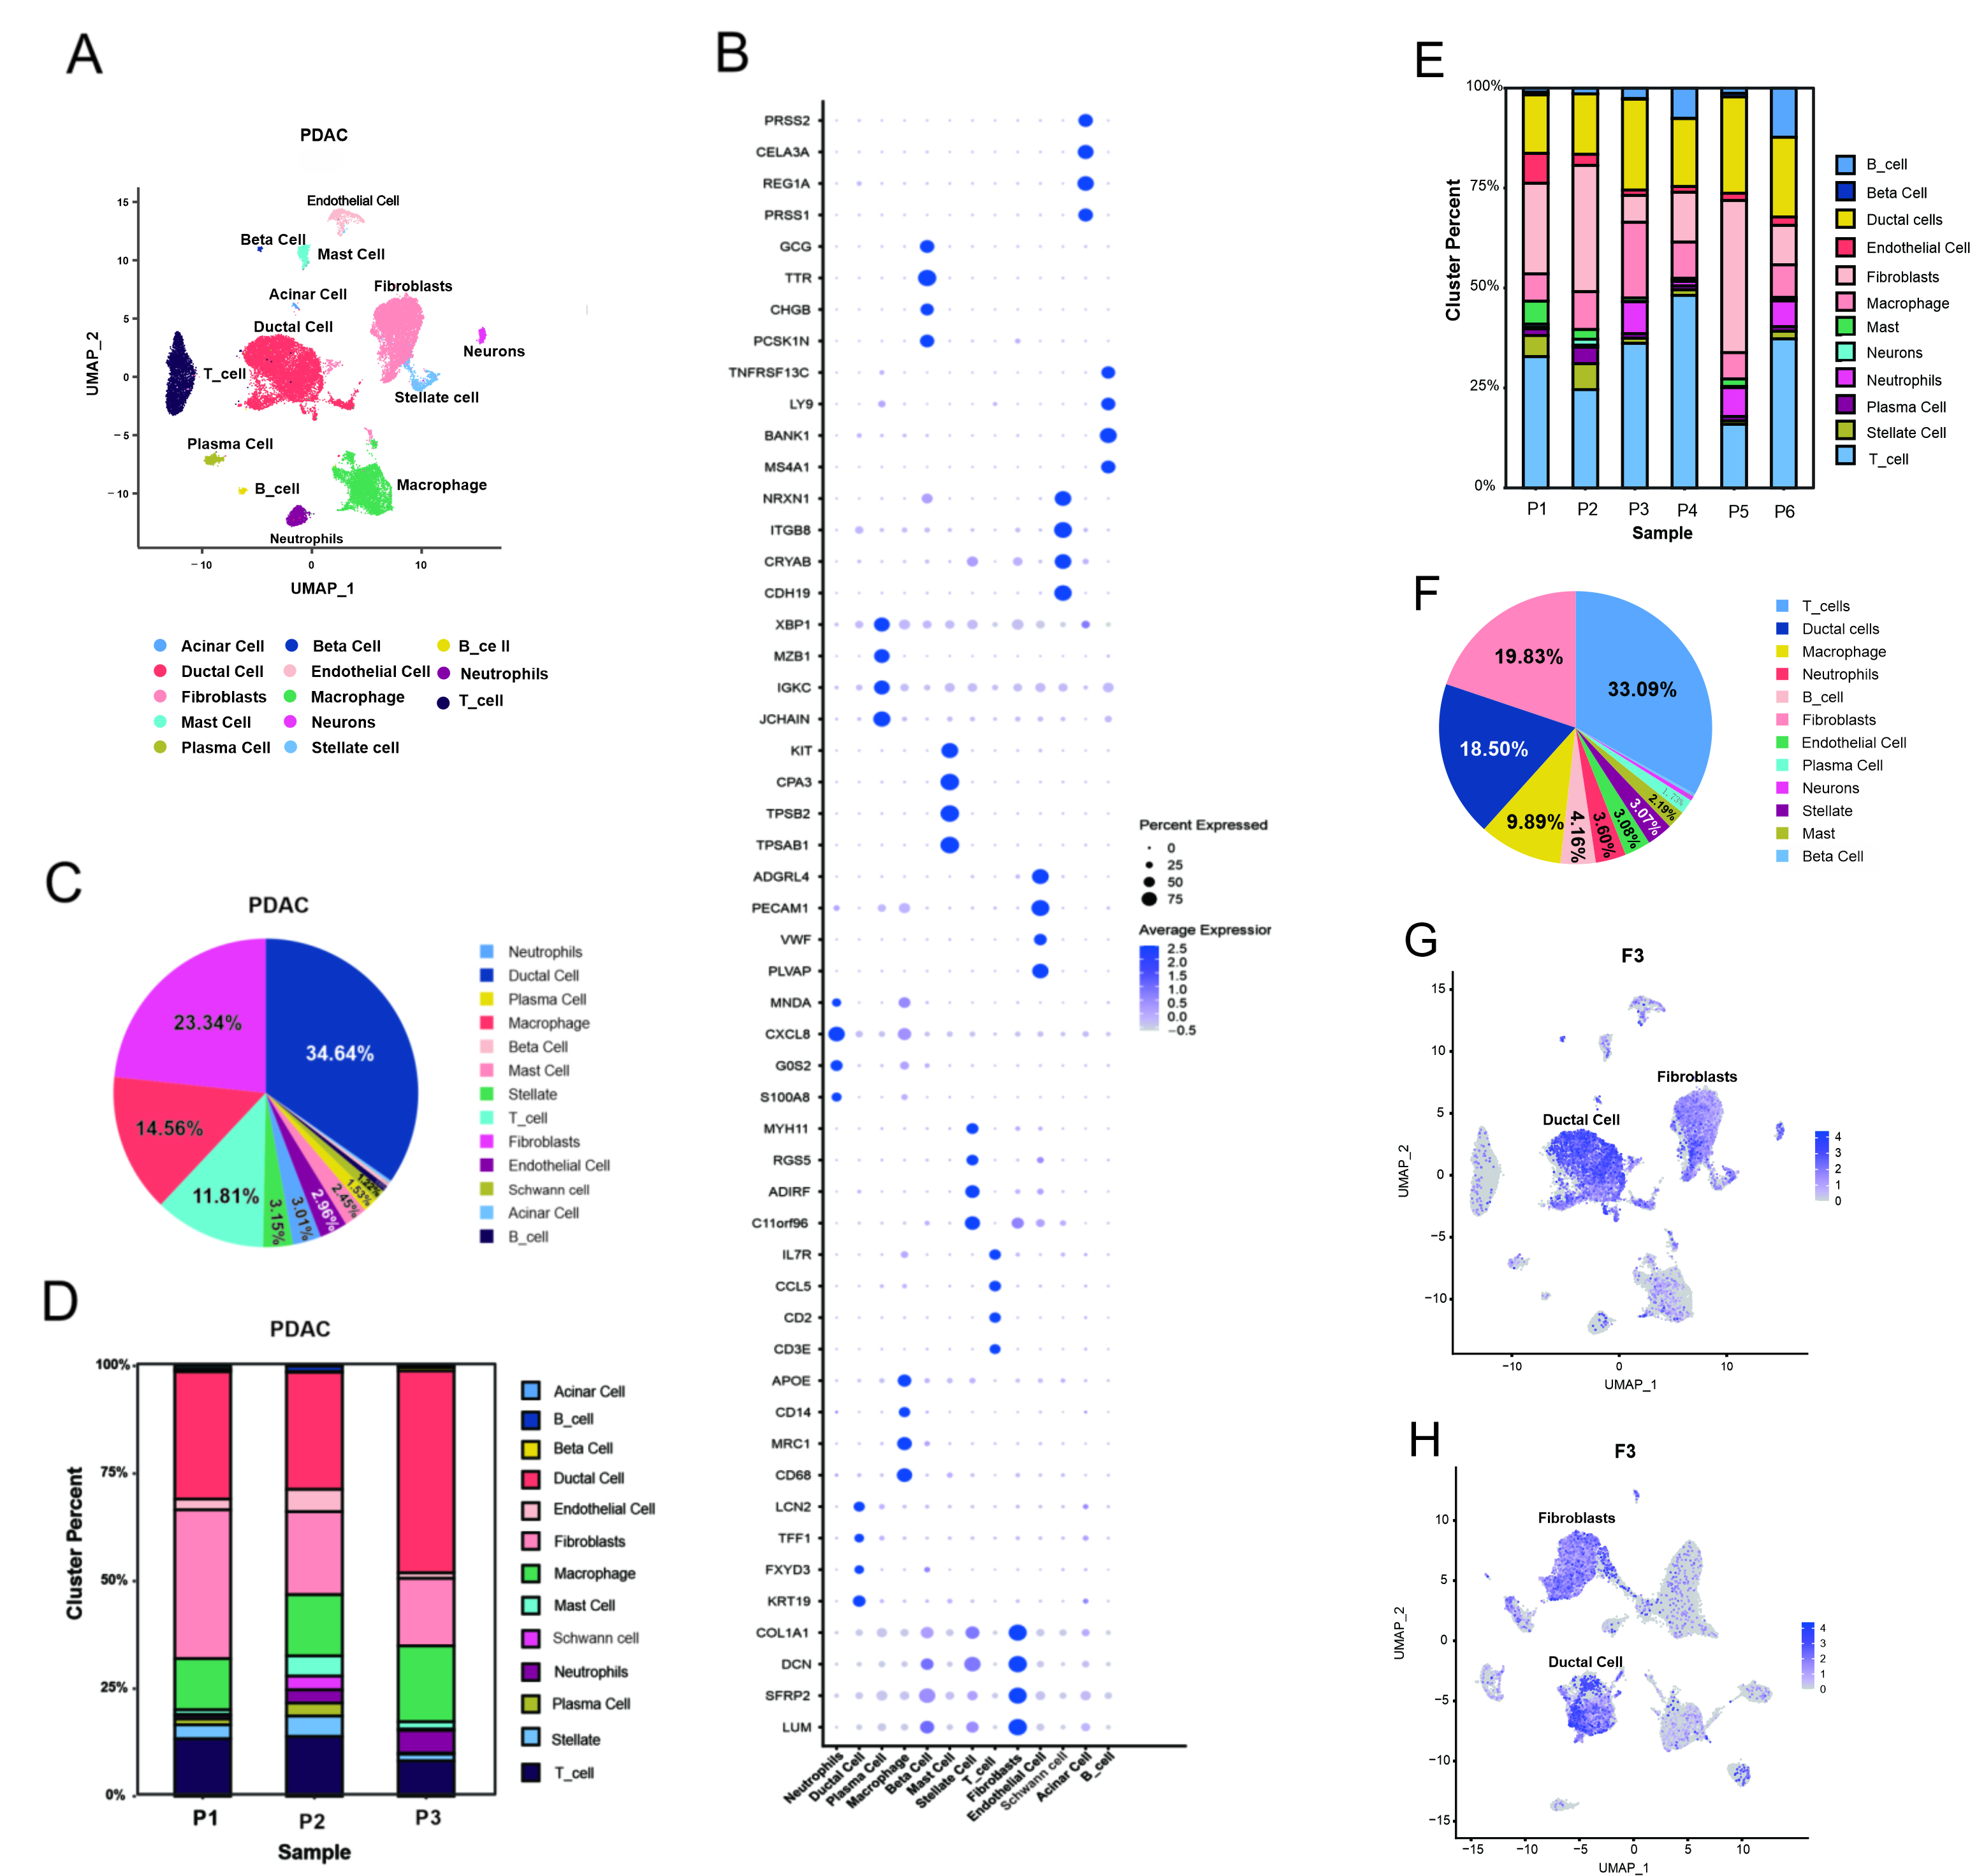 Fig. 2.
 Single-cell analysis reveals the complex landscape of PDAC. (A) UMAP showed 13 distinct cell clusters. (B) Bubble plot showing selected cell type-specific markers across all clusters. Size of dots indicated the fraction of cells expressing selected markers, and intensity of color indicated the mean expression level. (C) The proportion of each cell type in all three PDAC patients. (D) The proportion of each cell type in each PDAC patients. (E) The proportion of each cell type in each PDAC patients from “GSE212966”. (F) The proportion of each cell type in all 6 PDAC patients from “GSE212966”. (G) The enriched expression of F3 in UMAP. (H) The F3 expression in UMAP from “GSE212966”. UMAP, Uniform Manifold Approximation and Projection; PDAC, pancreatic ductal adenocarcinoma; F3, coagulation factor 3.
In addition, we conducted independent validation from the GEO data. Patients with PDAC from the GSE212966 dataset showed ductal cells (18.50%), fibroblasts (19.83%), macrophages (9.89%), and T cells (33.09%) (Fig. 2F). Patients with PDAC from the GSE197177 dataset showed ductal cells (26.06%), fibroblasts (11.53%), macrophages (9.54%), and T cells (38.52%) (Supplementary Fig. 3A). These four cell types accounted for a relatively high percentage of all cell types. Meanwhile, within a single patient, the proportion of each cell type exhibited heterogeneity (Fig. 2E, Supplementary Fig. 3B). CAFs and ductal cells also showed enriched expression of F3 in these patients with PDAC from the GSE212966 dataset and GSE197177 dataset (Fig. 2H, Supplementary Fig. 3C).
Ductal cells from these three patients with PDAC were isolated and subjected to cluster analysis to detect some fine differences. The t-distributed stochastic neighbor embedding (t-SNE) plots revealed three distinct subclusters of ductal cells (Fig. 3D,G). As shown in Fig. 3F, the subpopulation of ductal cell 1 constituted a higher percentage than the other ductal cell subpopulations and exhibited substantial copy number variations (CNVs) (Fig. 3E). Fig. 3K suggested that F3 expression was primarily found in the ductal 1 subpopulation. KEGG pathway enrichment analysis revealed that the subpopulation of ductal cell 1 was mainly enriched in phosphoinositide 3-kinase (PI3K)/Akt signaling, focal adhesion, human papillomavirus infection, and ECM–receptor interaction (Fig. 3M and Supplementary Table 3).
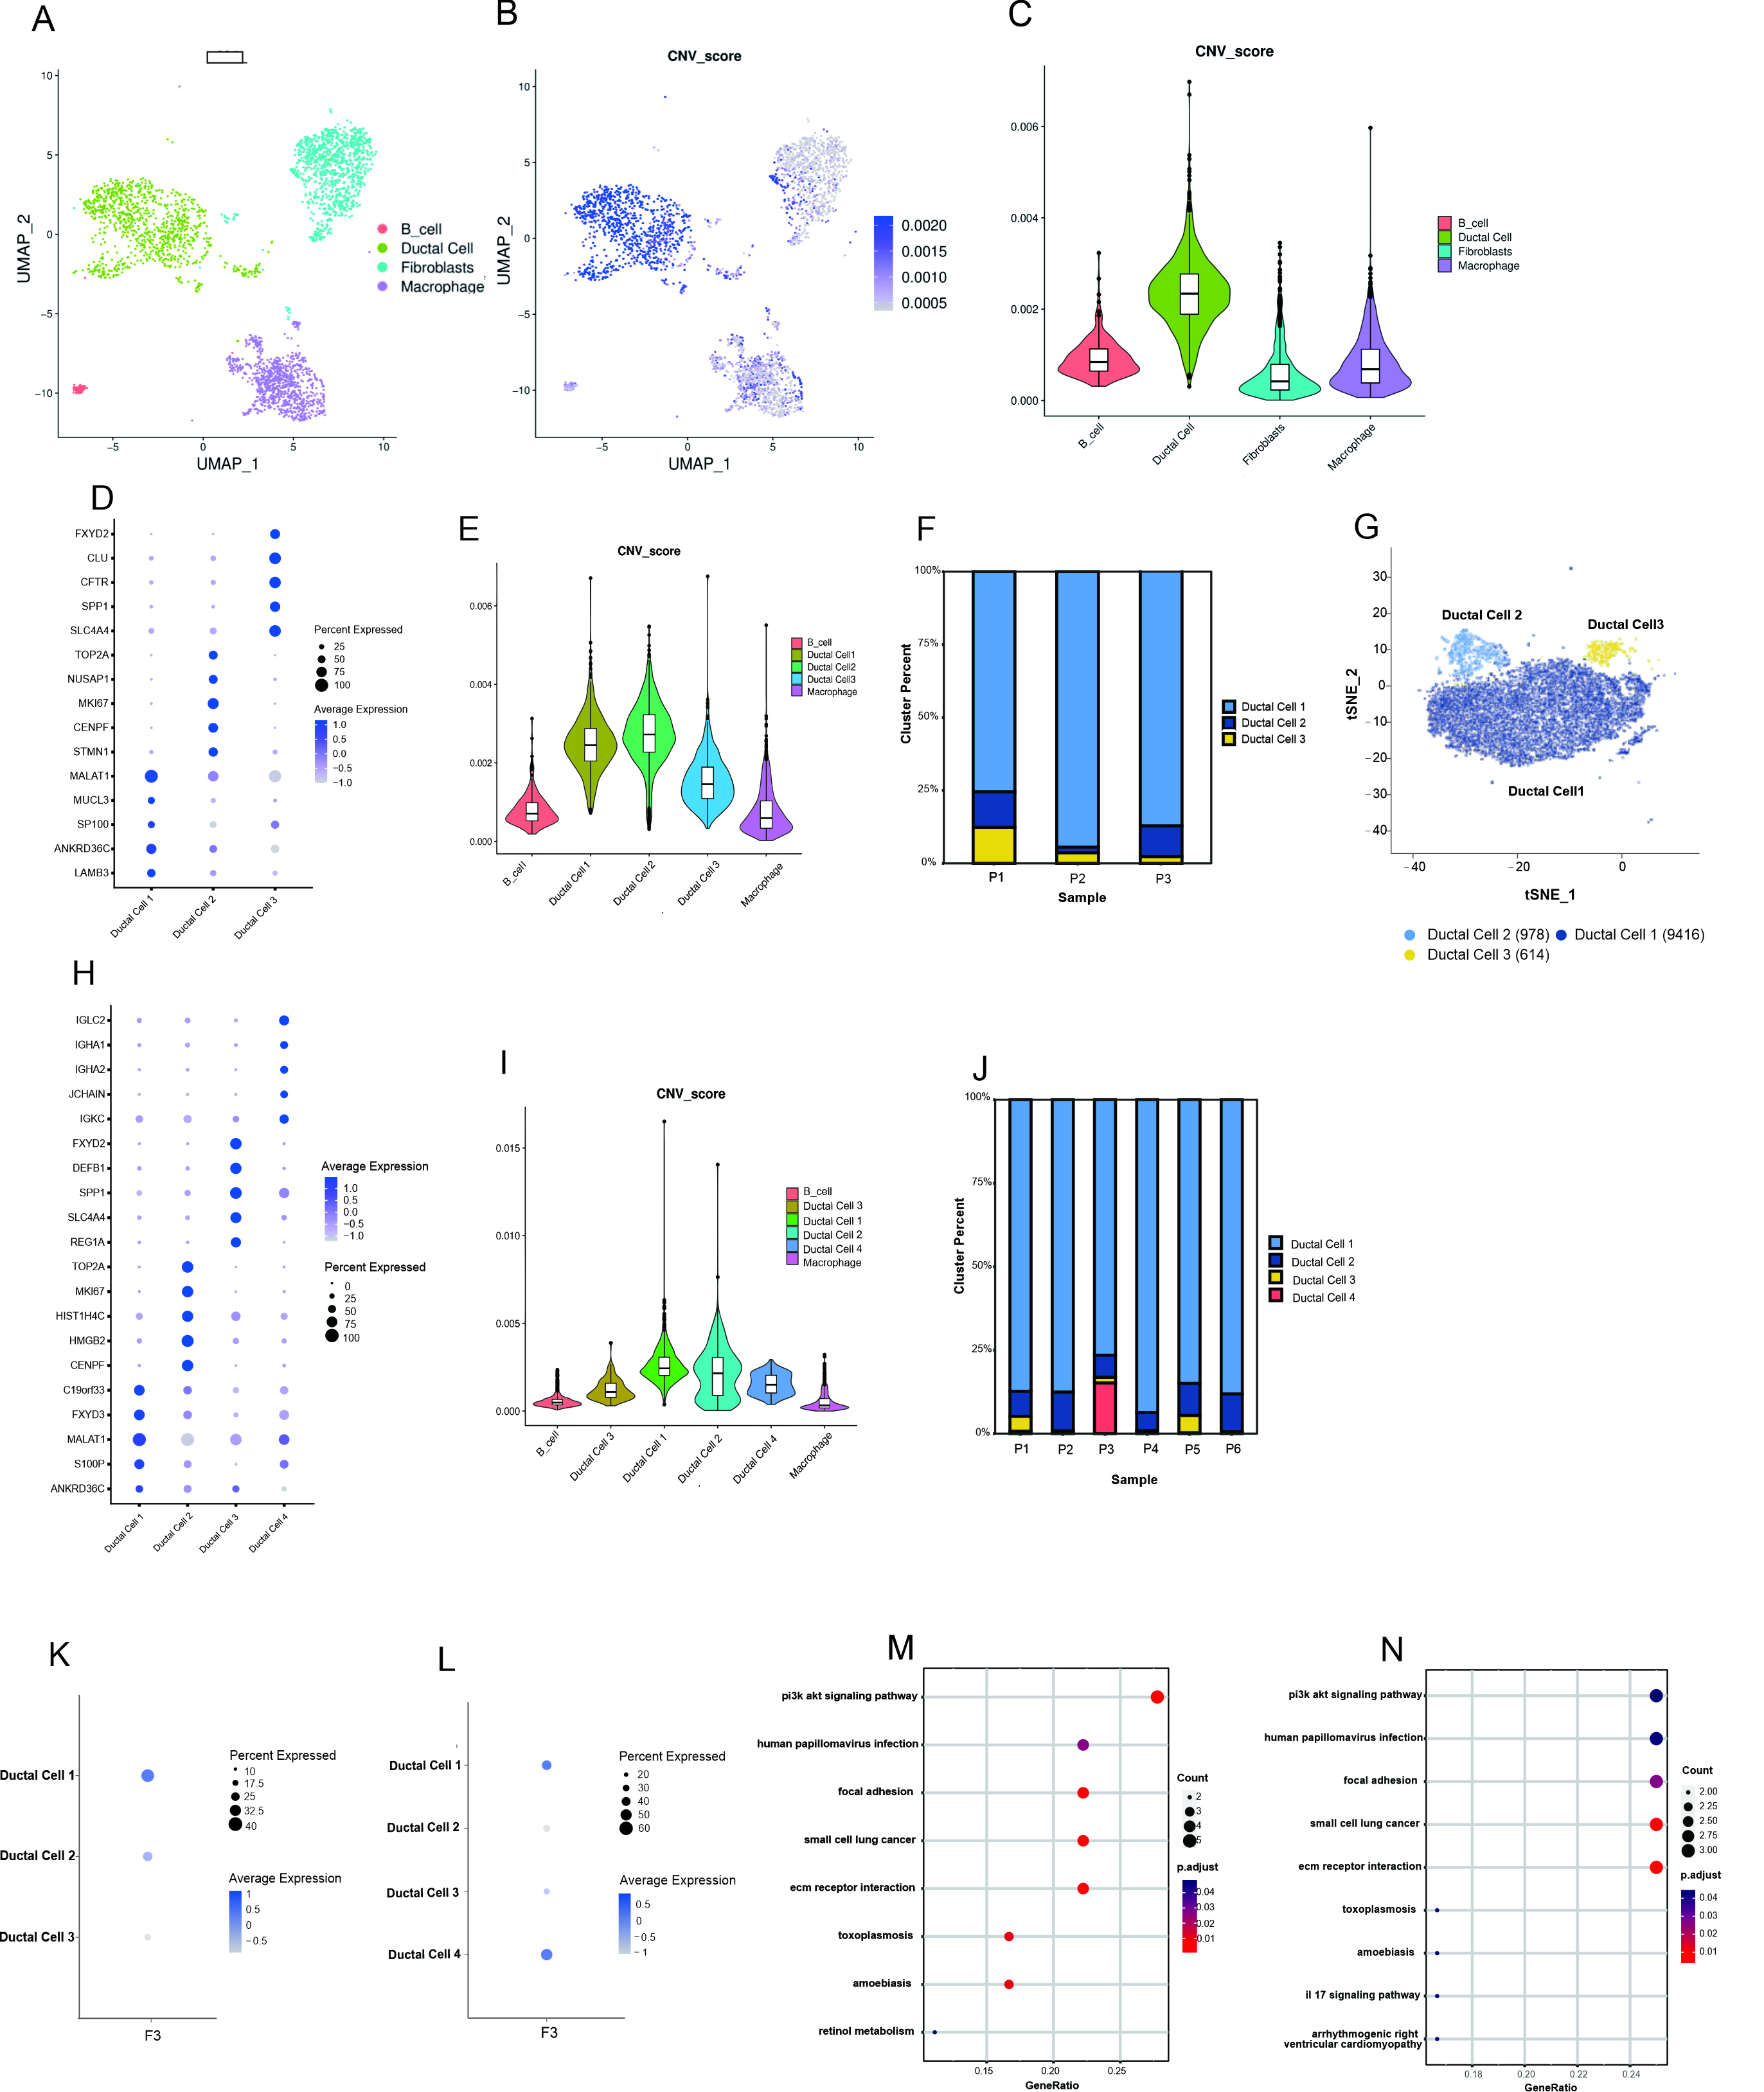 Fig. 3.
 Single-cell analysis uncovers the ductal cell landscape and the F3 expression in ductal cell subpopulations of PDAC. (A–C) CNVs analysis of the distribution of tumor cells in the total ductal cells. (D) Bubble plot showing selected cell type-specific markers across three distinct subclusters of ductal cells in this study. (E) Using macrophages and B_cells as the reference, the subpopulations of ductal cells were further conducted by CNV analysis. (F) Proportional distribution of each ductal cell subpopulation by individual sample in this study. (G) The t-SNE plots displayed the distribution of three distinct subclusters of ductal cells. (H) Bubble plot showing selected cell type-specific markers across three distinct subclusters of ductal cells in the data of “GSE212966”. (I) Using macrophages and B cells as the reference, the subpopulations of ductal cells were further conducted by CNV analysis in the data of “GSE212966”. (J) Proportional distribution of each ductal cell subpopulation by individual sample in the data of “GSE212966”. (K) Expression of F3 in ductal cell subpopulations of the three PDAC patients in this study. (L) Expression of F3 in ductal cell subpopulations of the six PDAC patients from “GSE212966”. (M) KEGG pathway enrichment analysis of ductal cell 1 in this study. (N) KEGG pathway enrichment analysis of ductal cell 1 in the data of “GSE212966”. CNVs, copy number variations.
Ductal cells from the GSE212966 dataset clustered into four distinct subpopulations (Fig. 3H), of which the ductal cell 1 subpopulation was present in a significantly higher percentage than the other ductal cell subpopulations (Fig. 3J) and demonstrated substantial CNVs (Fig. 3I). F3 was mainly expressed in the ductal cell 1 and ductal cell 4 subpopulations (Fig. 3L). Ductal cell 1 was the main subpopulation expressing F3, due to the low abundance of ductal cells 4. These findings align with the data obtained from three patients with PDAC in this study. In addition, KEGG pathway enrichment analysis results were consistent with those observed in the three patients with PDAC in this study (Fig. 3N).
Next, we assessed the expression of F3 in CAF subpopulations; specifically, CAFs from the three patients with PDAC were analyzed. Results revealed two distinct subpopulations (Fig. 4A,B, Supplementary Fig. 3D). Subpopulation 1 showed enriched expression of inflammatory factors and chemokines, leading to its designation as iCAFs. Subpopulation 2 was named mCAFs because of its high expression of
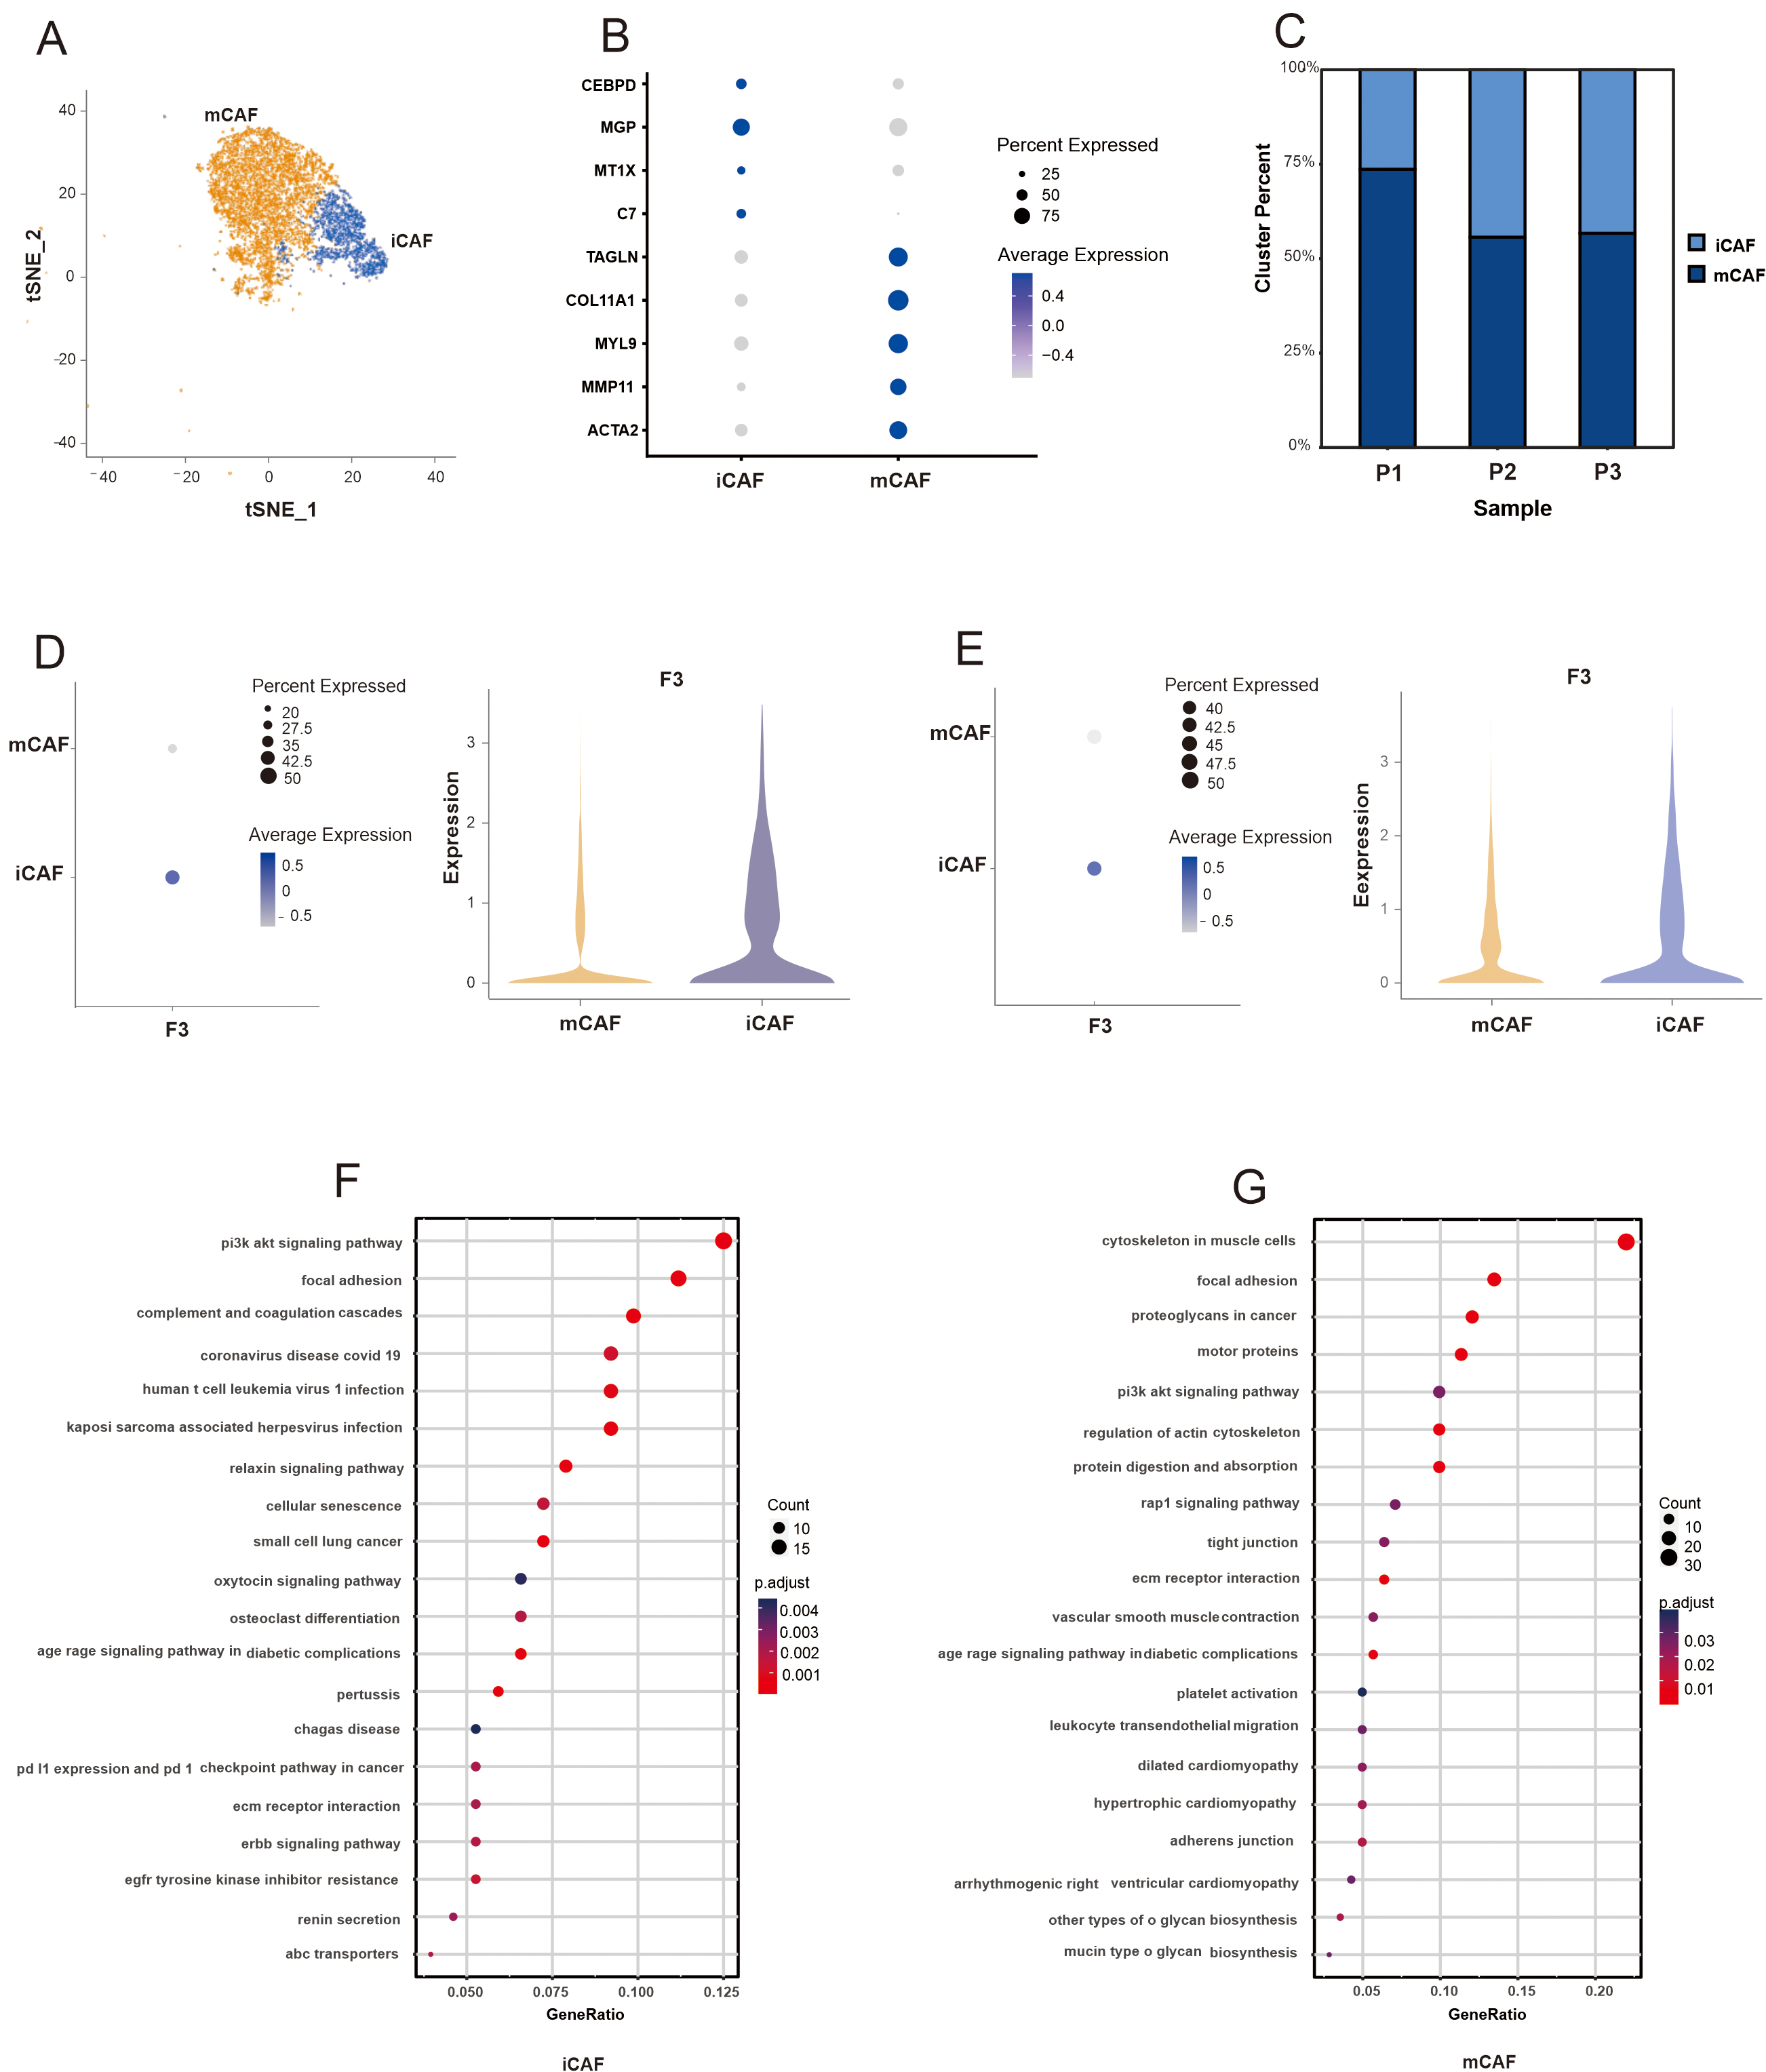 Fig. 4.
 Single-cell analysis uncovers the CAFs landscape and the F3 expression in CAF subpopulations of PDAC. (A) The t-SNE plots displayed the distribution of two distinct subclusters of CAFs (iCAFs and mCAFs). (B) Bubble plot showing selected cell type-specific markers across two distinct subclusters of CAFs in this study. (C) Proportional distribution of each CAF subpopulation by individual sample in this study. (D) Expression of F3 in CAF subpopulations of the three PDAC patients in this study. (E) Expression of F3 in CAF subpopulations of the six PDAC patients from “GSE212966”. (F) KEGG pathway enrichment analysis of iCAFs in this study. (G) KEGG pathway enrichment analysis of mCAFs in the data of “GSE212966”.
The above mentioned results showed that F3 is mainly expressed in iCAFs; therefore, iCAFs were further analyzed. Pseudotime trajectory analysis positioned iCAFs primarily at the beginning of the trajectory and mCAFs at the end (Fig. 5A,C). This result was also confirmed by patients with PDAC from the GSE212966 dataset and GSE197177 dataset (Fig. 5B,D; Supplementary Fig. 3G). Hallmark pathway enrichment analysis is presented in Fig. 5E,F. Analysis of cells in state 1 at the terminal point of trajectory branch 1 confirmed that the iCAF subpopulation primarily emerges at an earlier stage of the pseudotime trajectory. The key regulons of iCAFs were also analyzed in this study. Fig. 5G shows the top five regulons of iCAFs from the three patients with PDAC in this study, Fig. 5H shows the top five regulons of iCAFs from patients with PDAC from the GSE212966 dataset, and Supplementary Fig. 3H shows the top five regulons of iCAFs from patients with PDAC from the GSE197177 dataset. The results revealed that nuclear factor IA (NFIA) is a key transcription factor for driving the iCAF process in both groups of patients with PDAC. The t-SNE plots in Fig. 5I shows the distribution of NFIA expression in iCAFs.
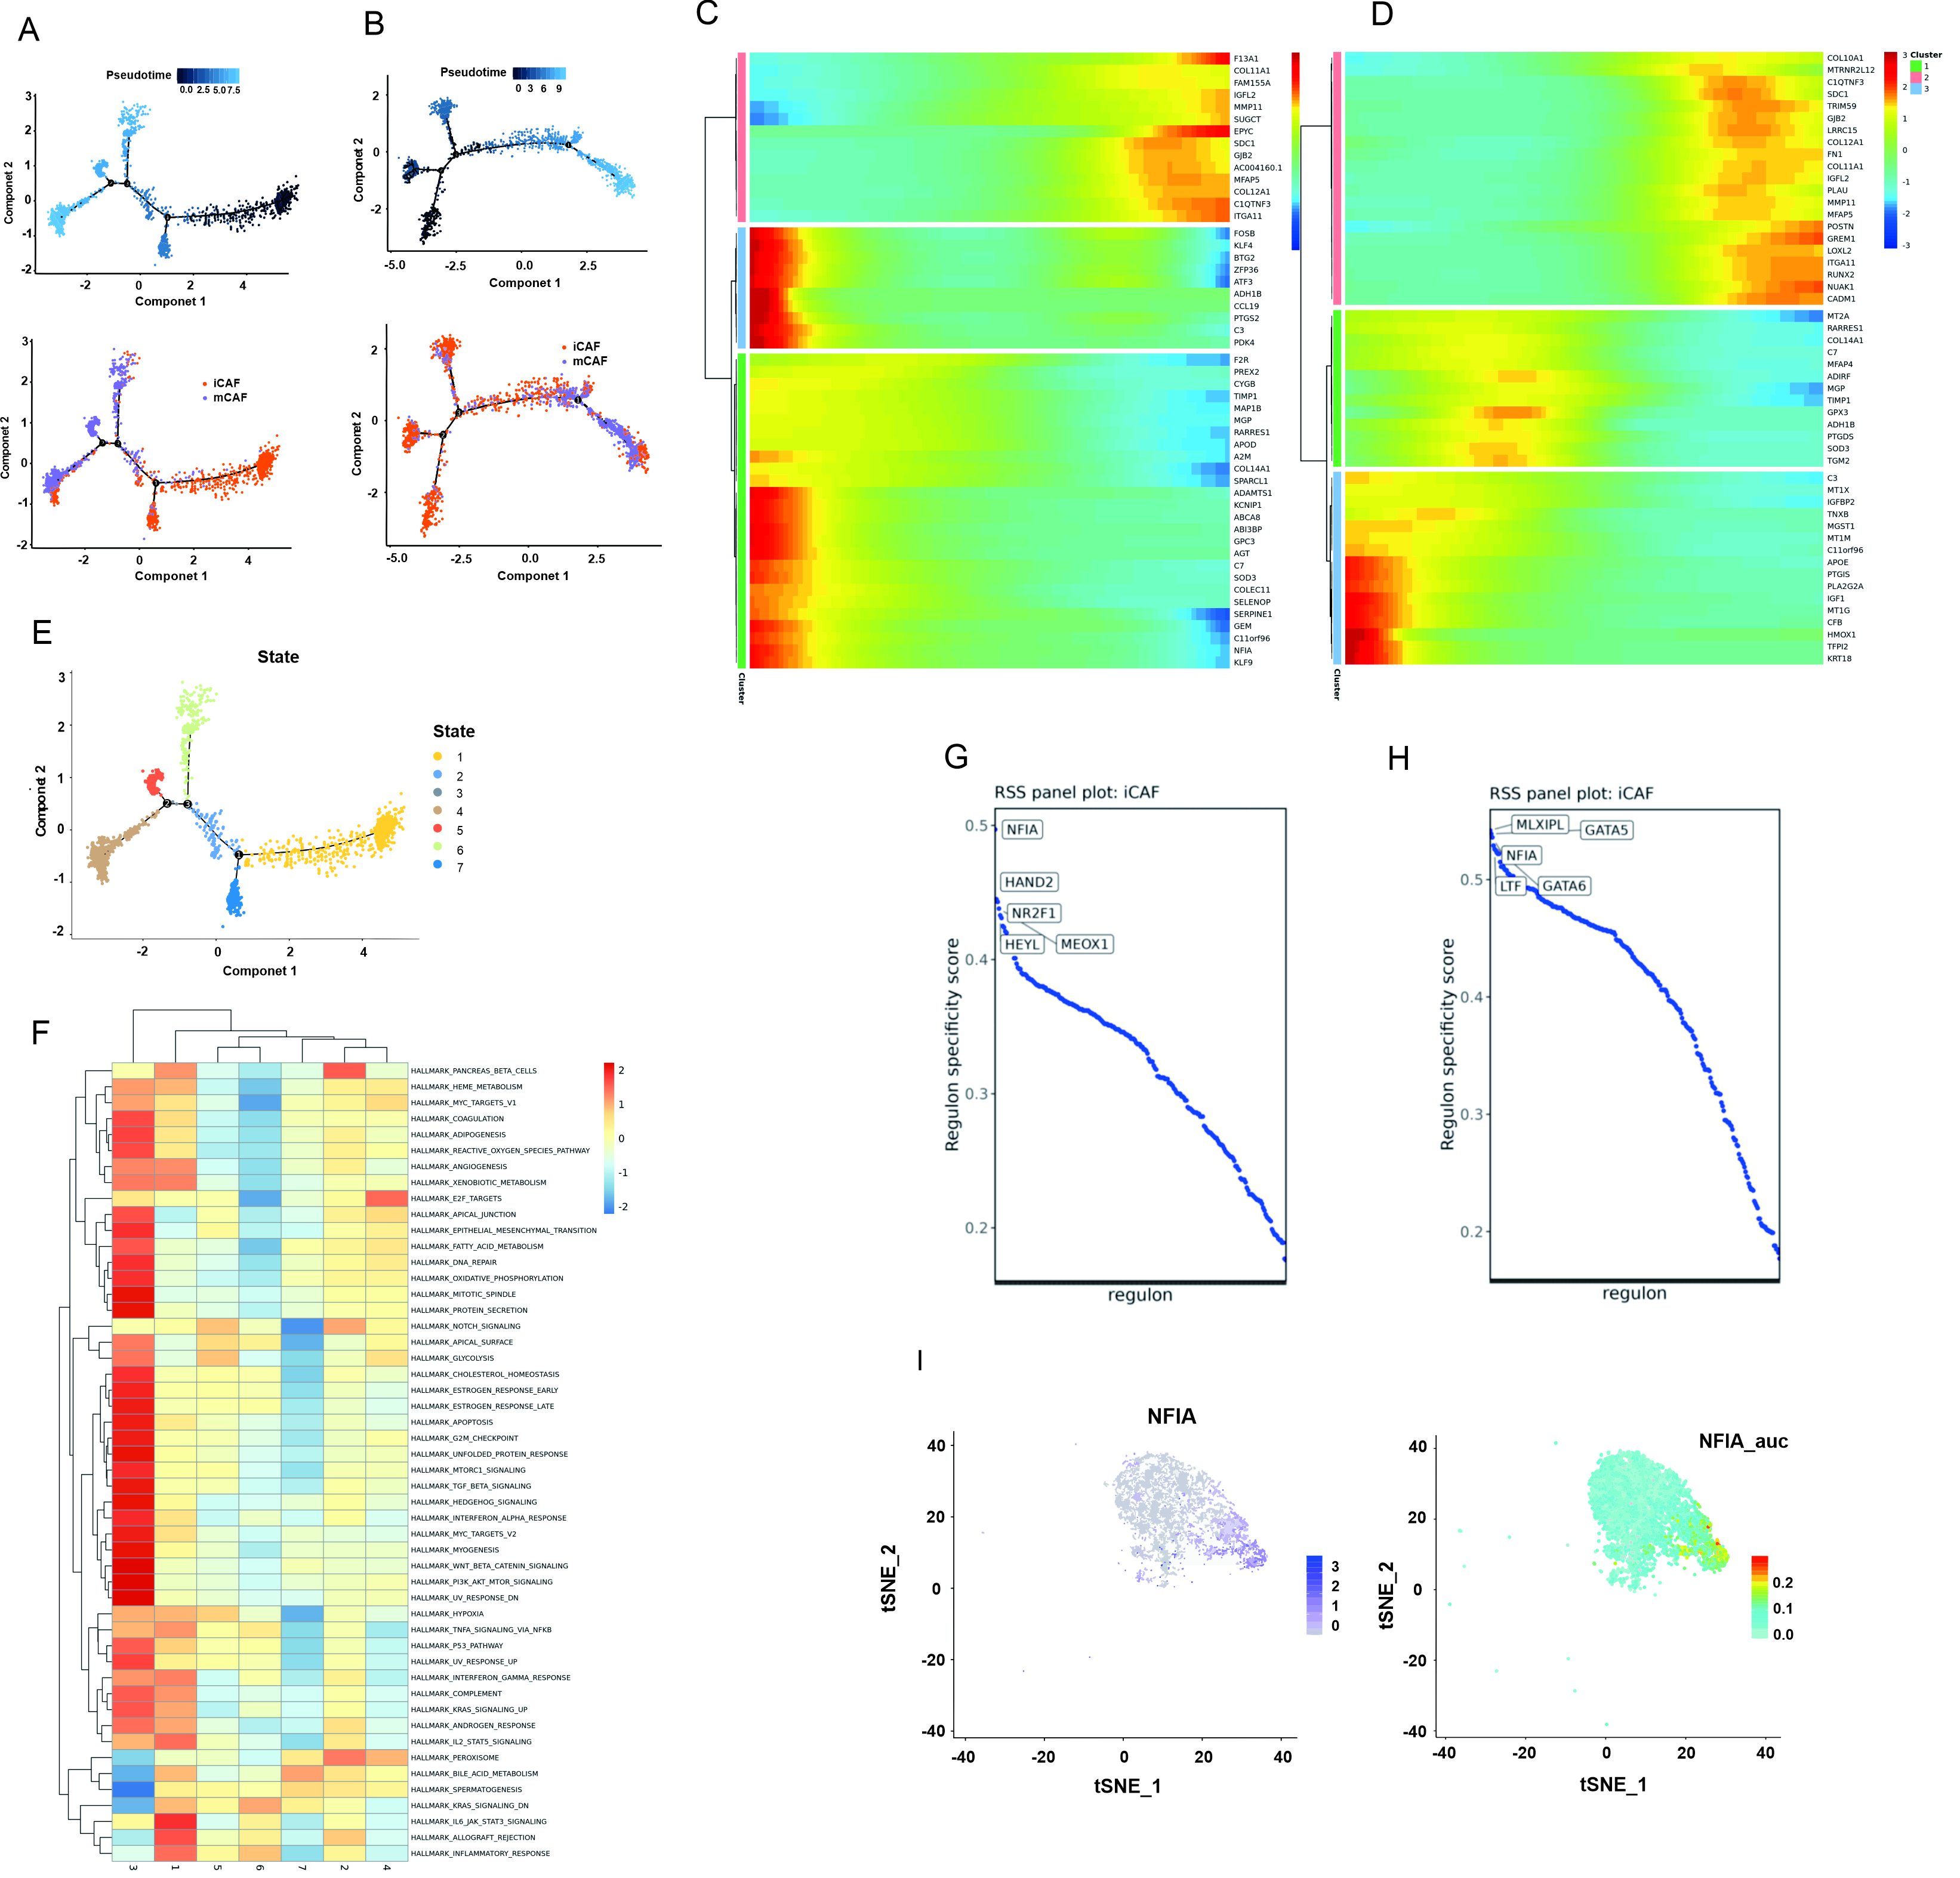 Fig. 5.
 The pseudotime trajectory analysis and transcriptional regulatory network analysis of CAFs. (A) The differentiation trajectory of CAFs in this study. (B) The differentiation trajectory of CAFs in the data of “GSE212966”. (C) The top 50 DEGs with the most significant expression level change over the pseudotime trajectory were classified into 3 clusters in this study. (D) The top 50 DEGs with the most significant expression level change over the pseudotime trajectory were classified into 3 clusters in the data of “GSE212966”. (E) Distribution of branch states in the pseudotime trajectory. (F) GSVA (Gene set variation analysis) of each state in pseudotime trajectory using hallmark 50 gene sets. (G) The regulon specificity score was used to rate various regulators of iCAFs in this study. (H) The regulon specificity score was used to rate various regulators of iCAFs in the data of “GSE212966”. (I) NFIA gene expression and regulon AUC (area under curve) scores were visualized in the t-SNE map.
Intercellular network analysis revealed a close relationship between iCAFs and other cell types, particularly mCAFs, macrophages, and ductal cells (Fig. 6A,B). We further analyzed the interaction among growth factors, ECM, chemokines (Fig. 6C–E). Intercellular network analysis showed that iCAFs interacted closely with mCAFs, macrophages, and ductal cells through growth factor receptor–ligand pairs (Fig. 6C, Supplementary Fig. 4). In particular, iCAFs interact closely with tumor cells (ductal cells), mediated by the receptor–ligand pairs of various ligands, such as vascular endothelial growth factor (VEGF), transforming growth factor (TGF), platelet-derived growth factor (PDGF), insulin-like growth factor (IGF), and fibroblast growth factor (Supplementary Fig. 4). Then, iCAFs interacted closely with mCAFs, and ductal cells through ECMs (Fig. 6D, Supplementary Fig. 5). In addition, iCAFs interacted closely with neutrophils through chemokine receptor–ligand pairs (Fig. 6E, Supplementary Fig. 6).
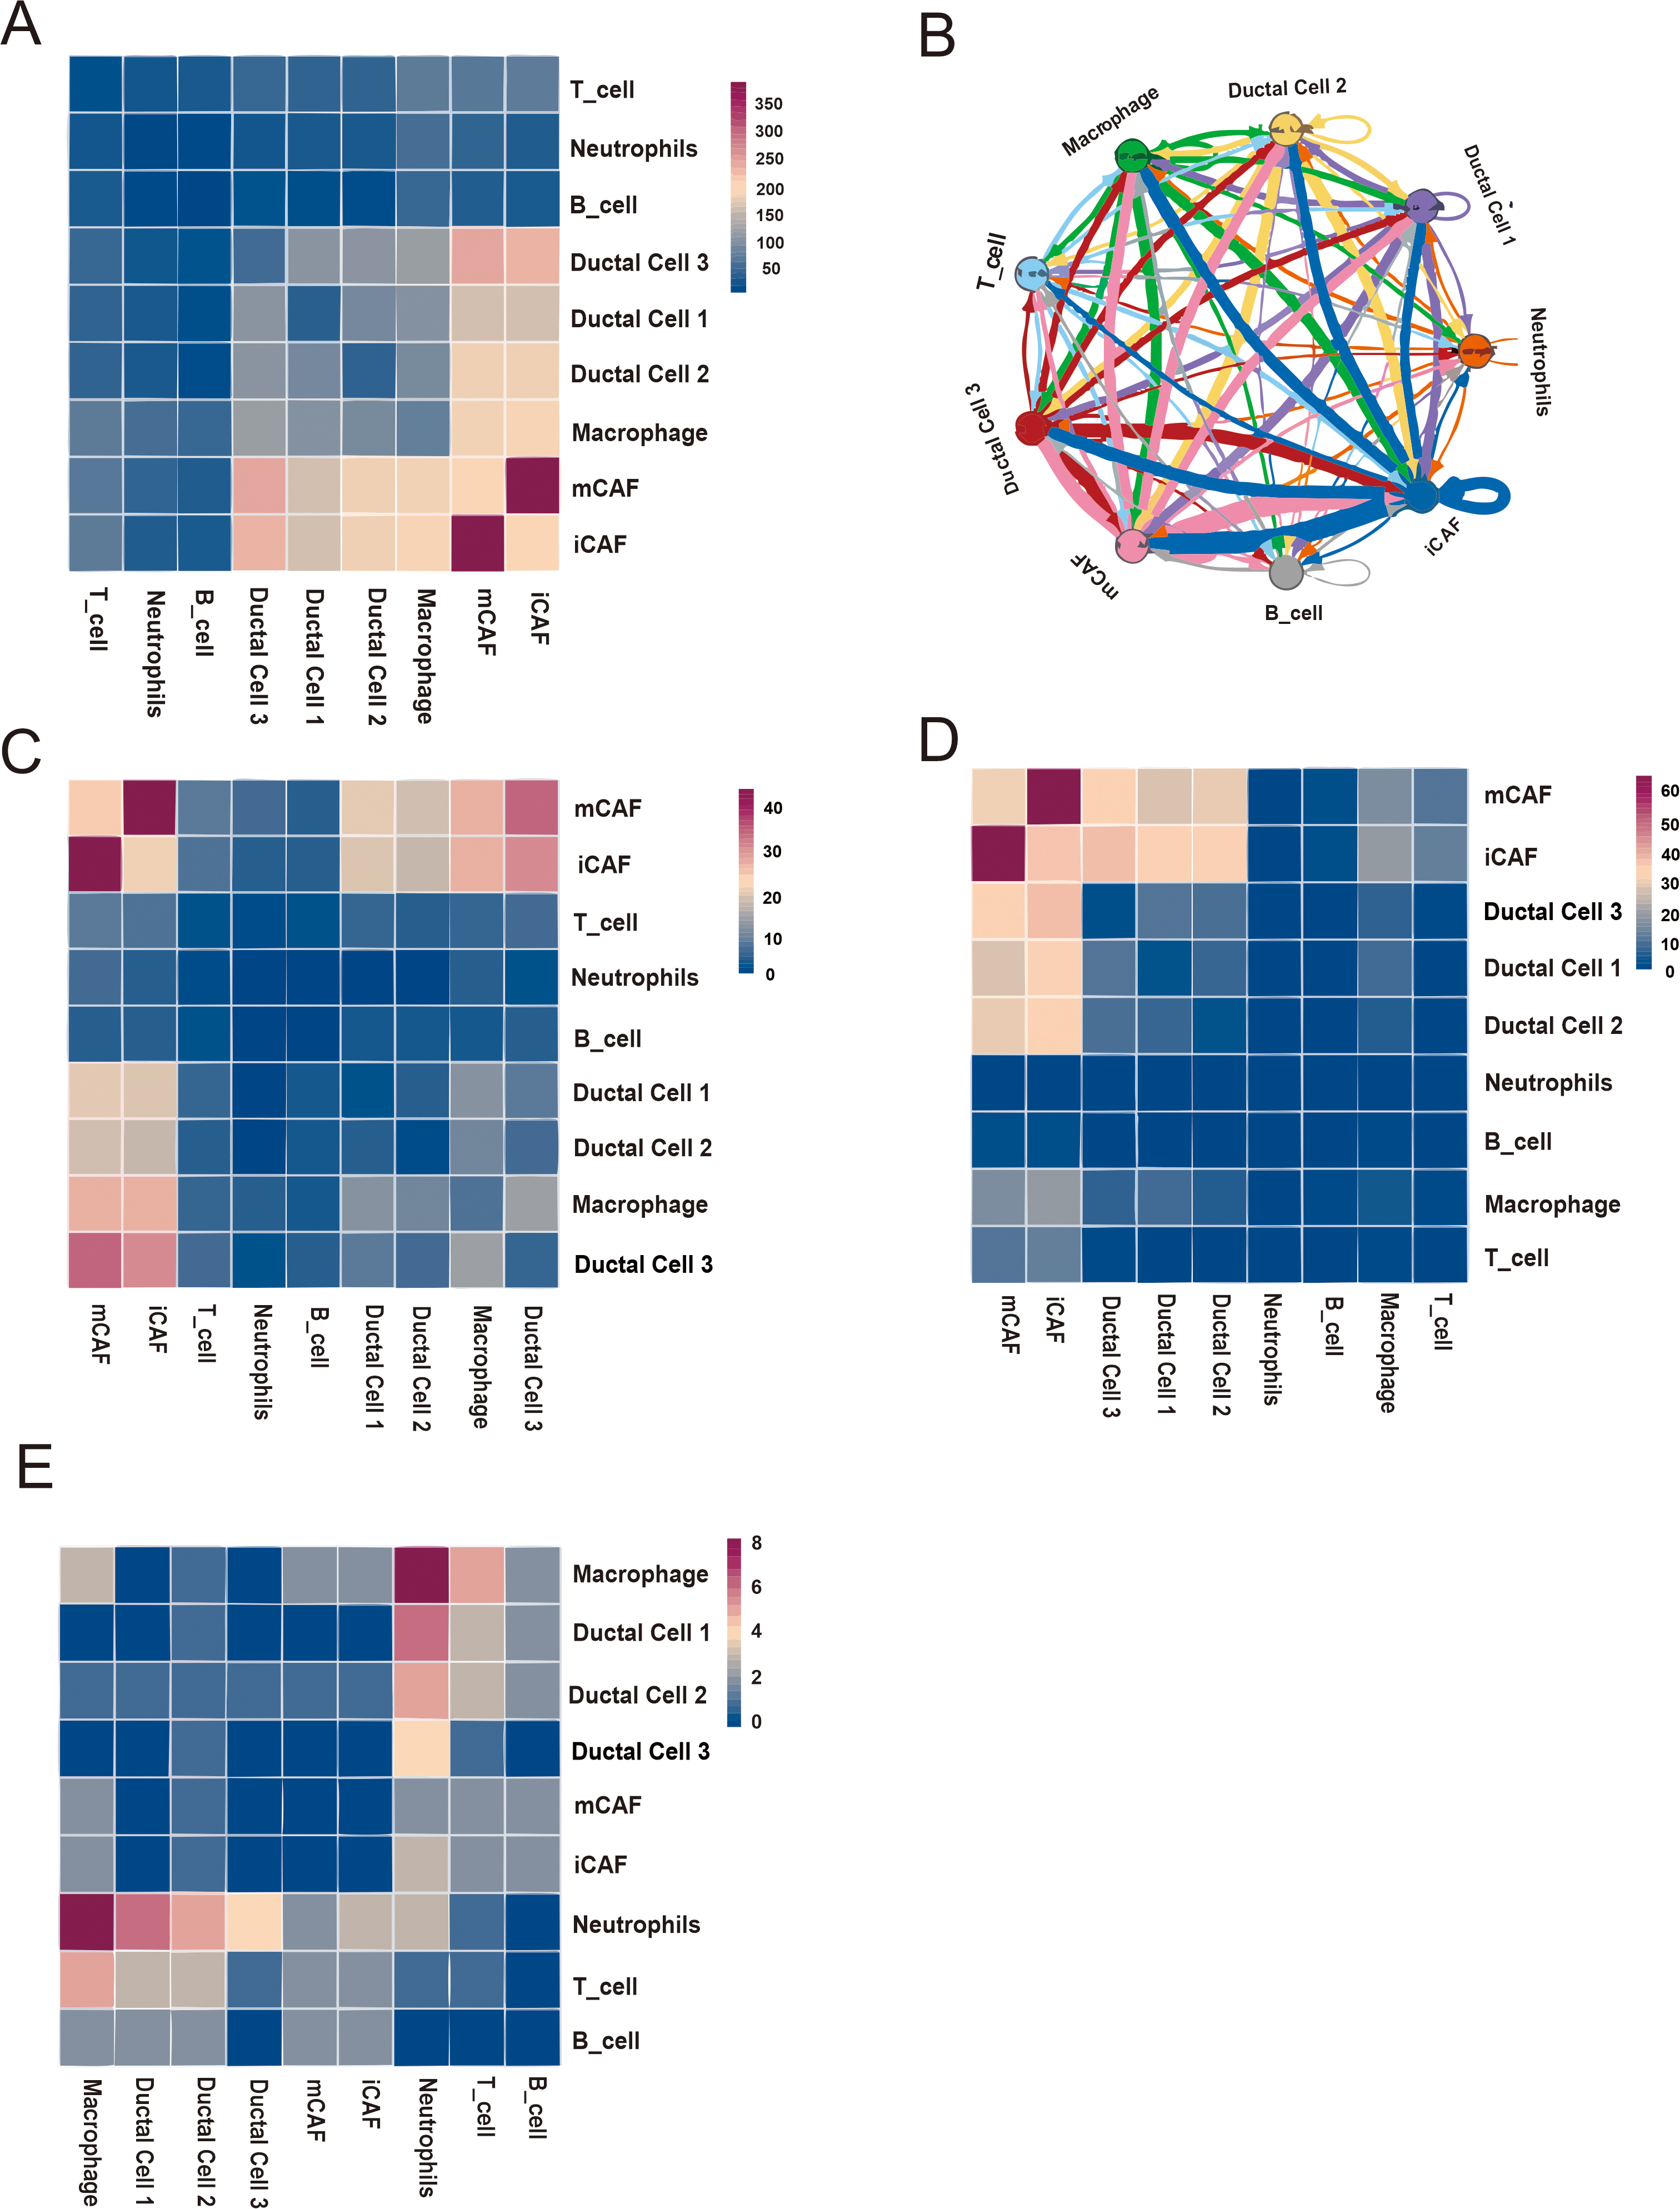 Fig. 6.
 Base on iCAF cell-cell interaction network. (A) Heatmap displaying number of potential ligand-receptor pairs between cell groups. (B) Chord diagram showing potential receptor-ligand pairs between cell groups. (C–E) Heatmap displaying ligand-receptor pairs of growth factors (C), extracellular matrixes (D) and chemokines (E) between iCAFs and other cell groups.
We further performed the difference in F3 expression between PDAC tissues and adjacent non-cancerous tissues using immunohistochemical staining. The results showed that the expression of F3 in PDAC tissues was significantly higher than that in adjacent non-cancerous tissues (Fig. 7).
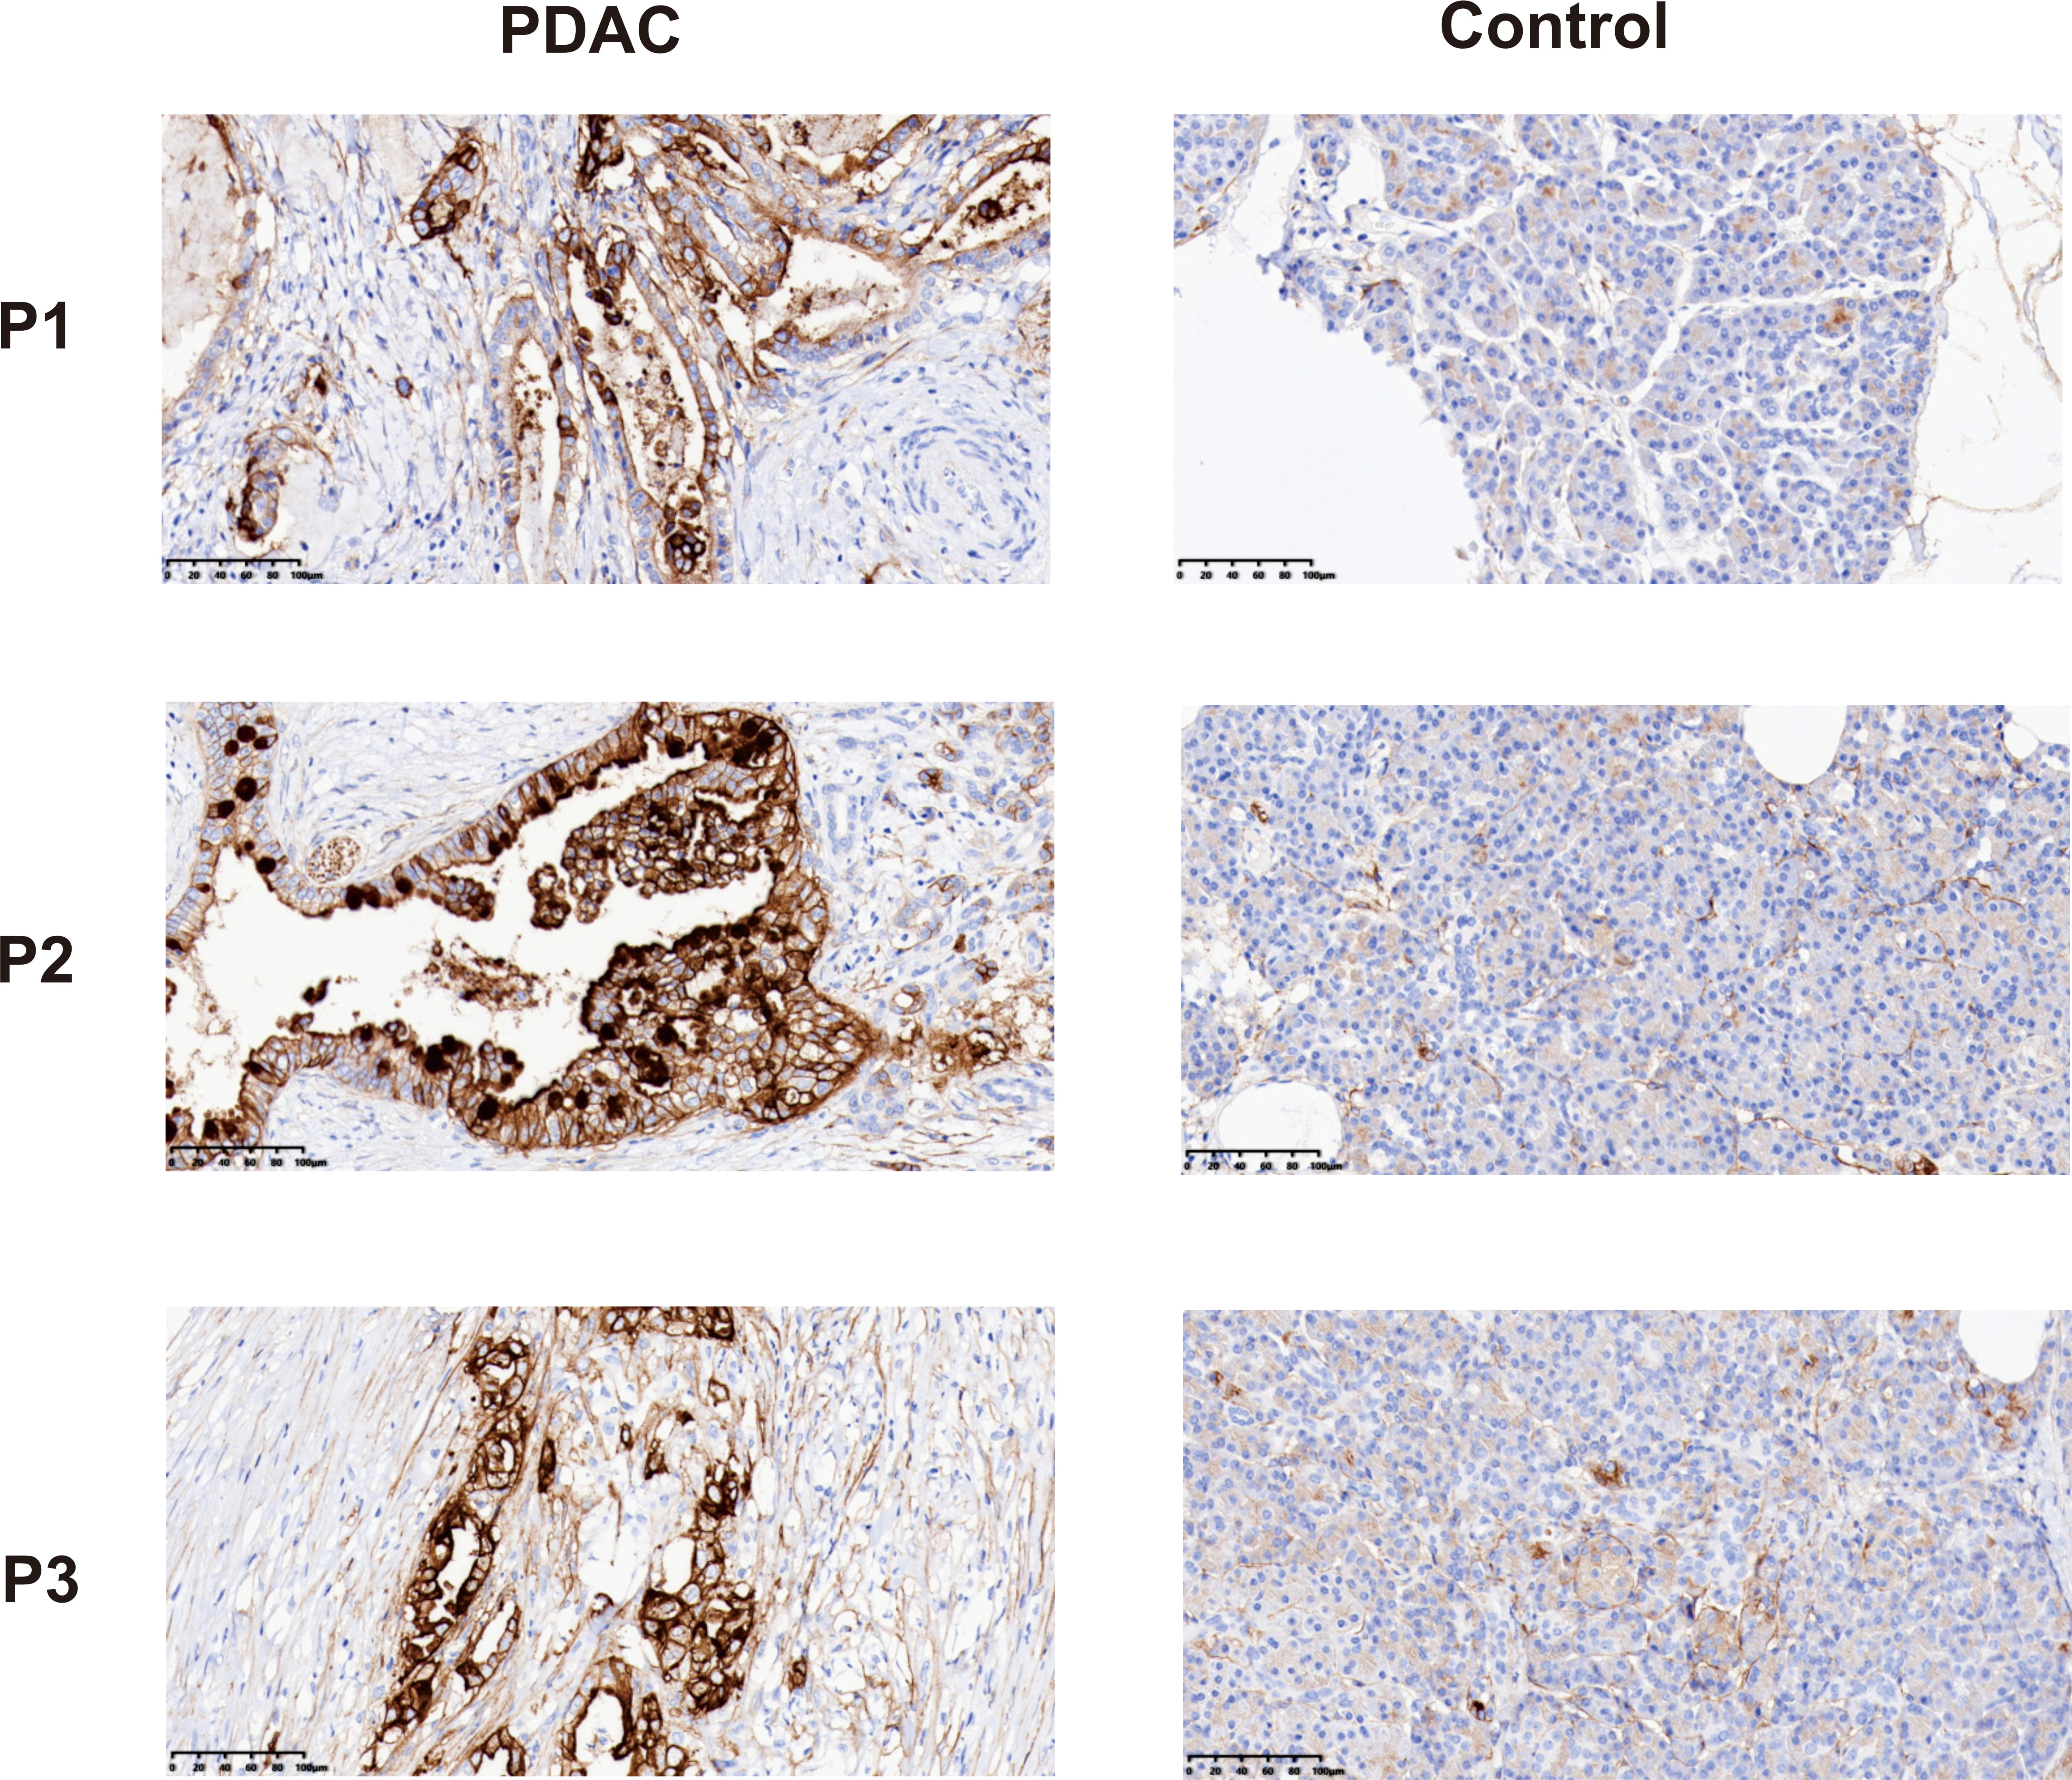 Fig. 7.
 Immunohistochemical staining showed the expression of F3 in PDAC tissues and adjacent control tissues. Negative: no color reaction; Positive: the cells were stained tan or brown. Scale bar = 100 µm.
It is well known that patients with pancreatic adenocarcinoma have a high incidence of thrombosis and a poor prognosis [2, 7]. This study showed that among 1837 patients with pancreatic adenocarcinoma from National Clinical Research Center for Cancer and Shanxi Province Cancer Hospital, more than half (54.98%) showed abnormal coagulation indicators. Coagulation factors were further analyzed in this study. The results showed that among coagulation factors F2–F12, the mRNA and protein expression levels of F3, F5 and F12 were higher in patients with pancreatic adenocarcinoma relative to normal tissues. Survival analysis suggested that only F3 was related to a poor prognosis. These results are consistent with previous reports showing that high F3 expression in PDAC cells contributes to increased coagulant activity and may play a role in tumorigenesis by promoting angiogenesis [19, 20]. A study by Khorana et al. [21] found a increased incidence of vascular thrombosis in pancreatic tumors overexpressing TF. Therefore, further research into the correlation between F3 and PDAC is needed.
Single-cell analysis revealed high F3 expression in both ductal cells and CAFs. To determine the specific ductal cell subpopulations expressing high F3, these cells were isolated from patients with PDAC, followed by cluster analysis to detect subtle differences. The results showed that F3 was mainly expressed in the ductal cell 1 subpopulation. Ductal cells 1, which comprised a large proportion of total ductal cells, exhibited CNVs, indicating they were tumor cells. These ductal cells 1 have high expression of metastasis associated lung adenocarcinoma transcript 1, a highly conserved nucleus-restricted long noncoding RNA linked to increased proliferation, tumorigenicity, and metastasis in colorectal and lung cancers [22, 23]. Although previous studies suggested that pancreatic tumor cells can highly express F3, our study complements previous studies and provides new and detailed information on the subpopulations of ductal cells expressing F3 [19, 24].
The heterogeneity of CAFs has been reported in some tumor types [4, 25, 26]. This study identified distinct mCAF and iCAF subpopulations, and confirmed the subpopulation expressing F3. Our data suggest that mCAFs contain an abundance of genes associated with alpha smooth muscle contraction, including those related to the cytoskeleton in muscle cells and motor proteins. By contrast, the PI3K/Akt and complement and coagulation pathways were the primary pathways enriched in iCAFs, consistent with results reported by Werba et al. [4]. These results indicate that the functional heterogeneity of CAFs may be a common characteristic of tumors. A previous study has shown that under pathological conditions, F3 is involved in formation of the TME [10]. CAFs are an important component of the tumor TME. In this study, we found that F3 was predominantly found within the iCAF subpopulation of PDAC, and that these iCAFs, through their enrichment of F3, were involved in the coagulation pathway.
A study by Öhlund et al. [27] demonstrated that iCAF and mCAF populations can interconvert. In the current study, pseudotime trajectory analysis showed that iCAFs were primarily found early in the trajectory, whereas mCAFs mainly appeared at the end. Furthermore, pathway enrichment analysis showed that the inflammation, and complement and coagulation pathways were prominent in state 1 iCAFs during the initial stages of pseudotime, where iCAFs mainly appeared. These results indicate that iCAFs might play a role in hypercoagulability and inflammation in the early stage of pancreatic adenocarcinoma. Previous research has shown that iCAFs demonstrated robust performance under hypoxic conditions and tumours characterised by increased inflammatory cell infiltration displayed a higher presence of iCAFs, a subpopulation known to respond favourably to immunotherapy. However, iCAFs in advanced-stage tumours gradually diminish, corresponding with a reduced immune response. The shift towards mCAF in later stages suggests a potential link between these subtypes and resistance to therapy in advanced tumours [28, 29]. In this study, the master regulators of iCAF formation in PDAC were identified by SCENIC. The results revealed that NFIA was highly expressed in iCAFs. A previous study demonstrated that NFIA can convert embryonic and postnatal mouse fibroblasts into astrocytes (iAstrocytes) [30]. This study suggests that NFIA is critical for timely initiation of the iCAF process in PDAC.
The complexity of PDAC depend not only on the heterogeneity of cancer cells but also on the complex interaction network in the PDAC. This study revealed abundant ligand–receptor interactions (e.g., growth factors, ECM, chemokines) between iCAFs and other cell types. CXC motif chemokine ligand 12 (CXCL12) secretion by CAFs promotes immune evasion in PDAC, and the CXCL12–C-X-C chemokine receptor type 4 (CXCR4) interaction between CAFs and tumor-associated macrophages promotes the metastasis of breast cancer [31, 32]. The study demonstrated that iCAFs secrete high levels of CXCL12, which can bind to CXCR4. CXCR4 is often highly expressed by B cells, T cells, neutrophils, and macrophages. In addition, iCAFs interact closely with tumor cells (ductal cells), mediated by the receptor–ligand pairs of various ligands, such as VEGF, TGF, PDGF, IGF, and fibroblast growth factor, which can promote tumor proliferation and angiogenesis [33, 34, 35, 36, 37].
Our research revealed that F3 is highly expressed in the iCAFs of PDAC and may play a role in PDAC hypercoagulability and tumor progression (Fig. 8). F3 is a primary initiator of the extrinsic coagulation pathway and plays a critical role in promoting a hypercoagulable state and thrombosis. This could be a significant contributor to the hypercoagulation observed in PDAC. As indicated above, a novel approach to limiting F3 expression and activity could represent a useful strategy for anticoagulant therapy. In a study of macaque monkeys, the pyrimidinones PHA-796 and PHA-927 potently reduced the activity of F3 to inhibit thrombosis [38]. In a study in rabbits, an anti TF:FVIIa antibody (AP-1) inhibited thrombus formation and showed reduced bleeding tendency compared with heparin and a direct thrombin inhibitor [38]. Thus, F3 may serve as a therapeutic target and have a synergistic effect with existing anticoagulant therapy regimens. In addition, elevated F3 could also affect the prognosis of patients through biological processes such as thrombosis, angiogenesis, proliferation, invasion, and metastasis [10, 11]. Therefore, targeting the upstream extrinsic coagulation pathway may have beneficial effects on both cancer-associated thrombosis and tumor-promoting activities. These give new perspectives on challenges and opportunities in treating patients with cancer with anticoagulants. Consequently, targeting F3 signaling in iCAFs using antibodies or other F3 modulators may represent a novel strategy for treating PDAC, potentially offering both anticoagulant and antitumor effects.
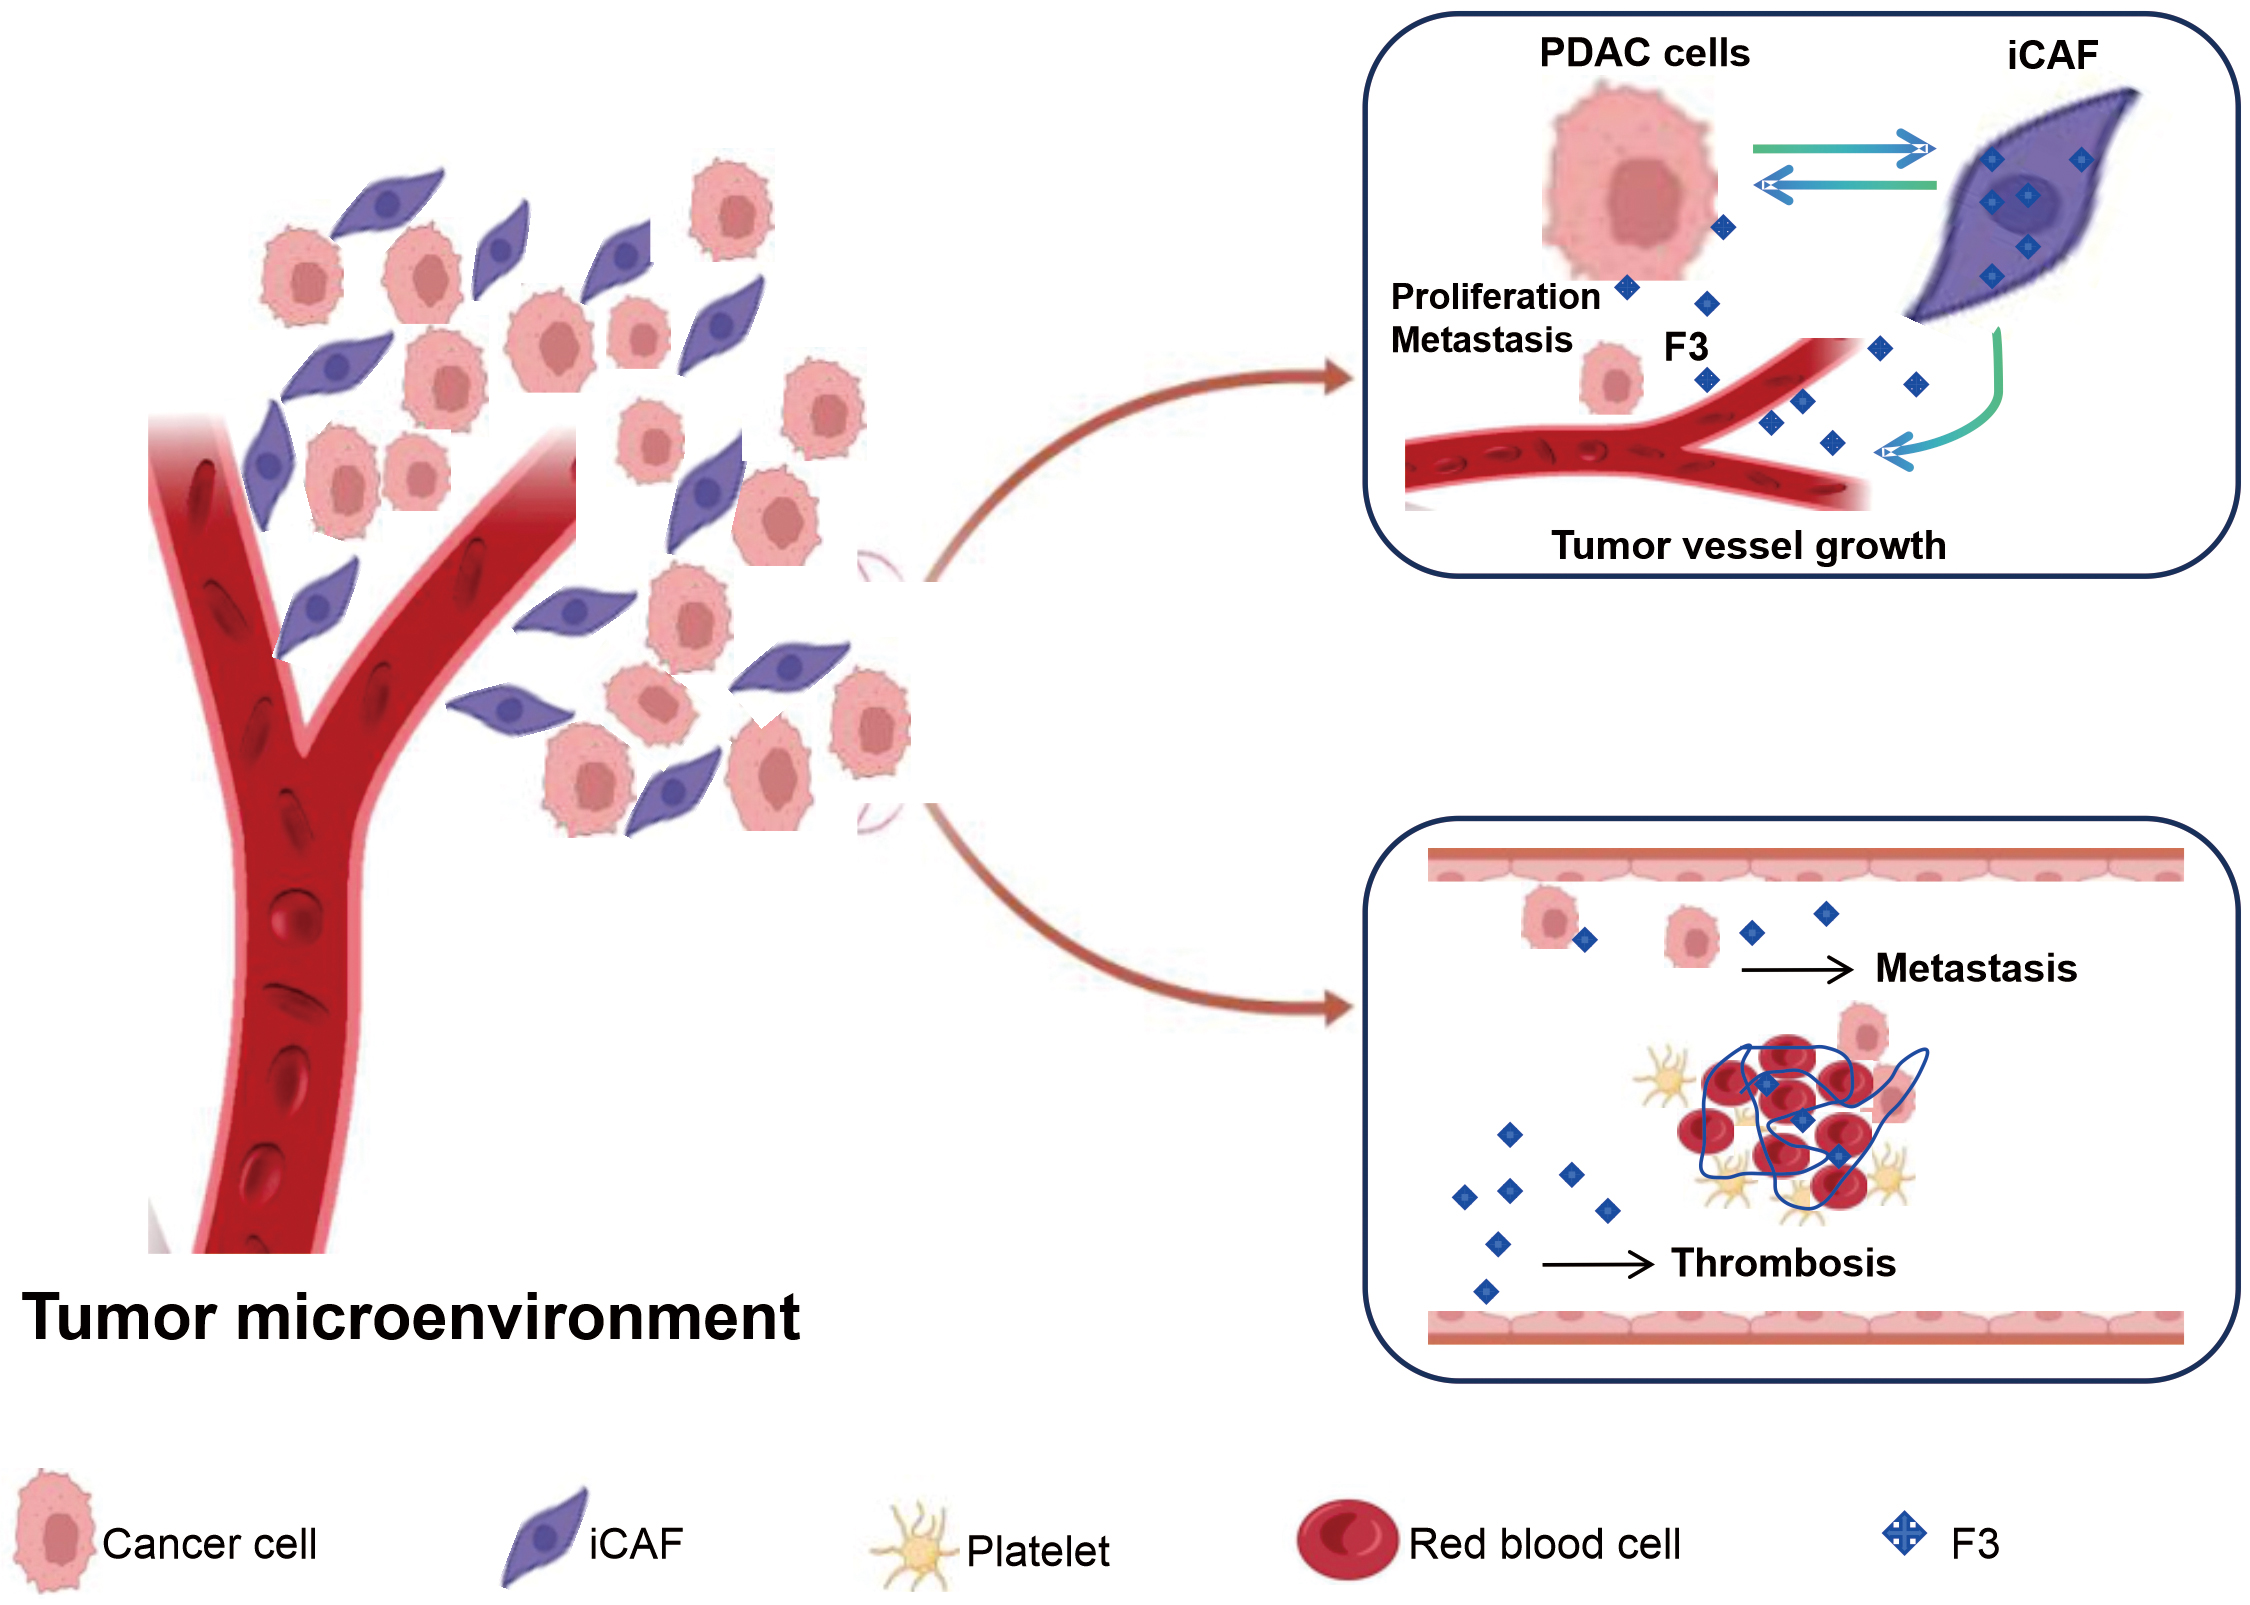 Fig. 8.
 PDAC hypercoagulability and tumor progression based on iCAFs highly express F3 mediated process.
Due to the limited sample size of our study, more studies to confirm the findings.
Overall, this study revealed that cell subtypes of iCAFs highly express F3 by single-cell sequencing analysis, and may play a role in PDAC hypercoagulability and tumor progression. Therefore, targeting F3 in these iCAFs may offer a novel approach for developing both anticoagulant and antitumor therapies for PDAC.
The datasets used and analyzed during the current study are available from the corresponding author on reasonable request.
CW and CC: writing-original draft; data curation. SH and RQ: formal analysis; methodology. MY, LW and HG: investigation; collected data. JM: designed the study; conceptualization; writing-review and editing. All authors contributed to editorial changes in the manuscript. All authors read and approved the final manuscript. All authors have participated sufficiently in the work and agreed to be accountable for all aspects of the work.
The present study was carried out in accordance with the guidelines of the Declaration of Helsinki. The study protocols were approved by the Institutional Ethics Review Committee of the Shanxi Cancer Hospital and Institute (No. 202122) and National Cancer Center/National Clinical Research Center for Cancer/Cancer Hospital, Chinese Academy of Medical Sciences, and Peking Union Medical College (No. 17112/1368). Every patients or their families or legal guardians provided informed consent before any procedures were undertaken.
Not applicable.
This work was supported by National Key Research and Development Program of China: (grant number 2022YFC3602301 and grant number 2023YFC2413200/2023YFC2413204), the National Natural Science Foundation of China (grant number 82302602), and Fund Program for the Scientific Activities of Selected Returned Overseas Professionals in Shanxi Province (20200042).
The authors declare no conflict of interest.
Supplementary material associated with this article can be found, in the online version, at https://doi.org/10.31083/FBL44029.
References
Publisher’s Note: IMR Press stays neutral with regard to jurisdictional claims in published maps and institutional affiliations.