


 , Ying Wang 1,2, Meng Yang 2, Taoran Zhao 1, Zhiwei Feng 1, Yujie Zhou 2, Xuewei Li 1, Yuanhao Yang 3, Zhizhen Liu 1, Guoping Zheng 4, Jun Xie 1,*
1 Department of Biochemistry and Molecular Biology, Shanxi Key Laboratory of Birth Defect and Cell Regeneration, MOE Key Laboratory of Coal Environmental Pathogenicity and Prevention, Shanxi Medical University, 030001 Taiyuan, Shanxi, China
2 Clinical Laboratory, Shanxi Academy of Traditional Chinese Medicine, Shanxi Traditional Chinese Medicine Hospital, 030012 Taiyuan, Shanxi, China
3 Mater Research, Translational Research Institute, Brisbane, QLD 4102, Australia
4 Centre for Transplant and Renal Research, The Westmead Institute for Medical Research, The University of Sydney, Sydney, NSW 2050, Australia
Abstract
Upon activation, hepatic stellate cells (HSCs) can convert into fibroblasts and increase the production of extracellular matrix, a major cause of liver fibrosis (LF) and a growing health issue worldwide. Other mechanisms by which HSCs may induce fibrosis remain to be explored, and the role of cell dynamic gene expression in liver fibrogenesis is not well understood. In this study, analysis by single-cell transcriptome sequencing (scRNA-seq) was used to explore the potential effects of HSCs in a bile duct ligation (BDL)-induced mouse model of LF, followed by the identification of novel targets for clinical diagnosis. Methods: Liver tissue collected from BDL and sham-operated C57BL/6J mice was used for scRNA-seq. To systematically dissect the molecular and cellular events following fibrosis, the scRNA-seq data was analyzed for differential gene expression, KEGG, pseudotime trajectory, and cellular communication. Morphological changes in the BDL and sham livers were examined by hematoxylin and eosin (H&E) staining, Masson’s trichrome staining, fiber staining, and Sirius red staining. Results: The scRNA-seq analysis performed on the BDL and sham groups revealed the gene expression of 20,764 cells across 27 cell types. Antioxidant levels declined markedly in HSCs from BDL mice, leading to a more pronounced occurrence of ferroptosis. We also found evidence suggesting that elevated apelin signaling and platelet activation in HSCs contributed to the increased synthesis of extracellular matrix and collagen fibers. The large accumulation of immune cells in the liver of BDL mice induces different outcomes for HSCs. Conclusion: The results of this study provide further insight into the cellular and molecular alterations that occur within a specific subset of HSCs during LF, offering valuable information on potential targets for therapeutic intervention.
Keywords
- scRNA-seq
- liver fibrosis
- HSCs
- immune cells
- ferroptosis
- platelet activation
Reversal of the early, pathological stage of liver fibrosis (LF) offers the greatest potential for restoring liver function and overall hepatic health [1]. Currently, there are no established markers for the diagnosis and prevention of LF. Given the increasing number of patients affected by this disease, there is an urgent need for new diagnostic and therapeutic targets to prevent and treat fibrosis [2, 3].
The activation of hepatic stellate cells (HSCs) results in excessive deposition
of extracellular matrix (ECM), which represents the classical mechanism
underlying LF. There is increasing evidence that, in addition to HSCs, other cell
types within the liver are also crucial in the pathogenesis and progression of
this disease [4, 5, 6, 7]. These cell types promote LF by modulating HSCs through
intercellular signaling [8]. Currently, research on liver macrophages and
myeloid-derived suppressor cells (MDSCs) focuses on two aspects. Firstly,
cytokines or chemokines secreted by these cells affect the proliferation or
differentiation of HSCs. Secondly, following liver injury, the aggregation and
infiltration of cells promotes injury repair and fibrosis, thus aggravating the
progression of LF. Bioinformatics analysis combined with in vivo mouse
experiments have shown that liver macrophages secrete Tumor Necrosis
Factor-
A better understanding of liver structure and of the function of each liver cell type is essential for elucidating the pathogenesis of liver-related diseases and identifying valuable therapeutic targets. Sequencing technology has garnered increasing attention in genomic and transcriptomic studies due to its advantages of high throughput, short cycle, low cost, and efficient cell capture [13, 14]. The application of this technology can lead to a better understanding of genetic development and of the molecular mechanisms underlying the heterogeneity between healthy individuals and those with LF.
This study utilized single-cell transcriptome sequencing (scRNA-seq) to investigate the specific cell types and cell type-specific differential gene expression patterns associated with LF in a bile duct ligation (BDL)-induced mouse model of LF. The BDL mice showed increased antioxidant levels that were associated with a significant reduction in HSC-specific ferroptosis. Furthermore, increased levels of apelin signaling and platelet activation were observed in HSCs, potentially contributing to increased synthesis of ECM and collagen fiber. These findings provide valuable insights into potential targets for the treatment of LF.
Male C57BL/6J mice (8 to 10 weeks of age) were housed in specific pathogen free (SPF) cages in approved facilities under a 12 h light/dark cycle and controlled temperature (22 °C) and humidity (40% to 60%). The mice were randomly divided into sham and BDL groups. BDL and sham operation in mice were performed, under anesthesia with isoflurane. Inhale oxygen containing 2% isoflurane (at a flow rate of 1 L/min) to maintain the anesthesia of mice. For sham operations, all steps were the same, except for common bile duct ligation. Mice were euthanized with 2% pentobarbital sodium (150 mg/kg) intraperitoneal injection at day 21 after BDL for collecting tissue samples, including blood and livers. All experimental procedures were approved by the Medical Ethics Committee of the Shanxi Institute of Traditional Chinese Medicine.
Ocular blood from mice was collected into prepared tubes and an automatic biochemical analyzer (AU480, BECKMAN COULTER, Brea, CA, USA) was employed to examine liver function markers, including the levels of alanine aminotransferase (ALT) and aspartate aminotransferase (AST).
Mouse livers collected 4 weeks after BDL were fixed in cold 4% formalin, dehydrated, embedded in paraffin, and then cut into 4 µm-thick sections. The sections were rehydrated and stained with hematoxylin and eosin (H&E), Sirius red, reticular fiber staining, or Masson trichrome. The degree of fibrosis was assessed histologically using light microscopy by an observer who was blinded to the sample identity.
Liver cells were extracted using a two-step perfusion approach. First, the liver
was sequentially perfused with Pronase E (0.4 mg/mL; Merck Millipore, Burlington,
MA, USA) and Collagenase IV (0.48 mg/mL; Sigma-Aldrich, St. Louis, MO, USA) for 5
minutes and 7 minutes, respectively. Next, the livers were dissected, placed into
50 mL falcon tubes, and digested in a 37 °C water bath with moderate
agitation for 25 minutes using a buffer containing 0.5 mg/mL Pronase E, 0.5 mg/mL
Collagenase IV, and 0.02 mg/mL DNase I (Roche, Basel, Switzerland). The livers
were then passed through a cell strainer with a pore size of 70 µm
and centrifuged at 580 g for 10 minutes. Liver cells were resuspended in 32 mL of
Gey’s balanced salt solution (GBSS)/B buffer after being washed twice with GBSS/B
buffer. To enrich liver nonparenchymal cells, the liver cells were subjected to
density gradient separation using 9.69% Nycodenz (Histodenz) solution
(Sigma-Aldrich) and centrifuged at 1380 g for 17 minutes at 4 °C. The
viability of cells (
The above procedure was performed to obtain as many cell types as possible from
the mouse livers. To analyze cell characteristics during the process of
cholestatic LF, nuclear suspensions were prepared from mouse liver tissues and
the nuclei labeled on the machine. Specific surface markers were used to screen
for certain types of cells within the liver. Additionally, single-cell
transcriptomics was performed on the 10
scRNA-seq was performed at the Stanford Functional Genomics Facility (SFGF)
after Fluorescence-activated cell sorting (FACS) sorting and using the
10
UMI sequences were corrected for sequencing
mistakes prior to quantification, while valid barcodes were recognized using the
EmptyDrops approach. UMI counting and cell barcode calling were used to generate
the cell by gene matrices. Each sample’s cell by gene matrices were independently
imported using the R package Seurat (version 3.1.1, https://satijalab.org/seurat/) for downstream analysis.
Cells with an extremely high number of UMIs
(30,000) or mitochondrial gene content (10%)
were excluded. Cells with
To reduce the impacts of batch effect and behavioral circumstances on clustering, samples were aggregated by employing canonical correlation analysis and mutual nearest neighbor analysis. A variance stabilizing transformation was applied to identify 2000 highly variable genes in each sample. Anchors were established between data points, and correction vectors were generated to create an integrated expression matrix that was subsequently used for clustering. The matrix was scaled and dimensionally reduced using principal component analysis (PCA). Following the jackstraw process, a resampling test was conducted by permuting a portion of the data (1% by default) and rerunning PCA. This process created a ‘null distribution’ of gene score. Significant principal components (PCs) were defined as those genes exhibiting a high enrichment with low p-value for downstream clustering and dimensional reduction. The Harmony method was employed for batch correction of single-cell transcriptome clustering.
The R package Seurat was used to perform Uniform Manifold Approximation and Projection (UMAP). Seurat employs a graph-based clustering strategy, where cell distances are determined using previously identified PCs. Cells are embedded in a graph of shared k-nearest neighbors (SKNN), where edges are formed between cells with similar gene expression patterns. To partition this graph into strongly connected quasi-cliques or communities, the SKNN graph was first built in PCA space using Euclidean distance. Edge weights between any two cells were then refined based on the shared overlap with their immediate neighbors, as measured by the Jaccard distance. We then applied modularity optimization techniques (Smart Local Moving algorithm) to iteratively combine cells, thereby optimizing the conventional modularity function.
Log-normalized matrices were processed using the SingleR R package to annotate cell types [15]. This was achieved by comparing the gene expression profiles of reference cell types to those of single cells. First, a Spearman coefficient was computed for the expression of each individual cell in the reference dataset. Subsequently, multiple correlation coefficients were aggregated per cell type to yield a single value representing each cell type for each individual cell. Following this, the correlation analysis was performed once more with SingeR, focusing solely on the top cell types identified in the previous step. The investigation specifically targeted highly variable genes. Finally, each single cell was assigned the cell type corresponding to the highest value calculated in the preceding analysis.
The Wilcoxon rank sum test was utilized to compare the expression levels of each
gene within a specific cluster against those of the remaining cells. A list of
criteria was employed to identify significant genes, while minimizing false
positive rates. Firstly, genes within the target cluster needed to show at least
a 1.28-fold increase or decrease in expression. Secondly, genes had to be
expressed in at least 25% of the cells in the target cluster, with a
p-value of
For the gene set generated from the above differential gene expression analysis,
clusterProfiler R tools were utilized to conduct pathway enrichment analyses
based on the Kyoto Encyclopedia of Genes and Genomes (KEGG) database
(https://www.genome.jp/kegg/). Statistical analysis was performed using Fisher’s
exact test, followed by the Benjamini-Hochberg correction, with an adjusted
p-value of
A BDL-induced LF model of C57BL/6J mice was used to comprehensively investigate
the cellular and genetic changes associated with LF by comparison with
sham-operated mice. In the BDL group, the proximal bile duct was thickened, the
gallbladder gradually expanded, and the liver became smaller, with a harder
texture and increased surface granularity (Fig. 1A). The levels of ALT and AST
were significantly higher in the BDL group compared to the sham-operated group,
peaking 2 weeks after surgery. They subsequently began decreasing 3–4 weeks
after surgery, but remained significantly higher in BDL mice (p
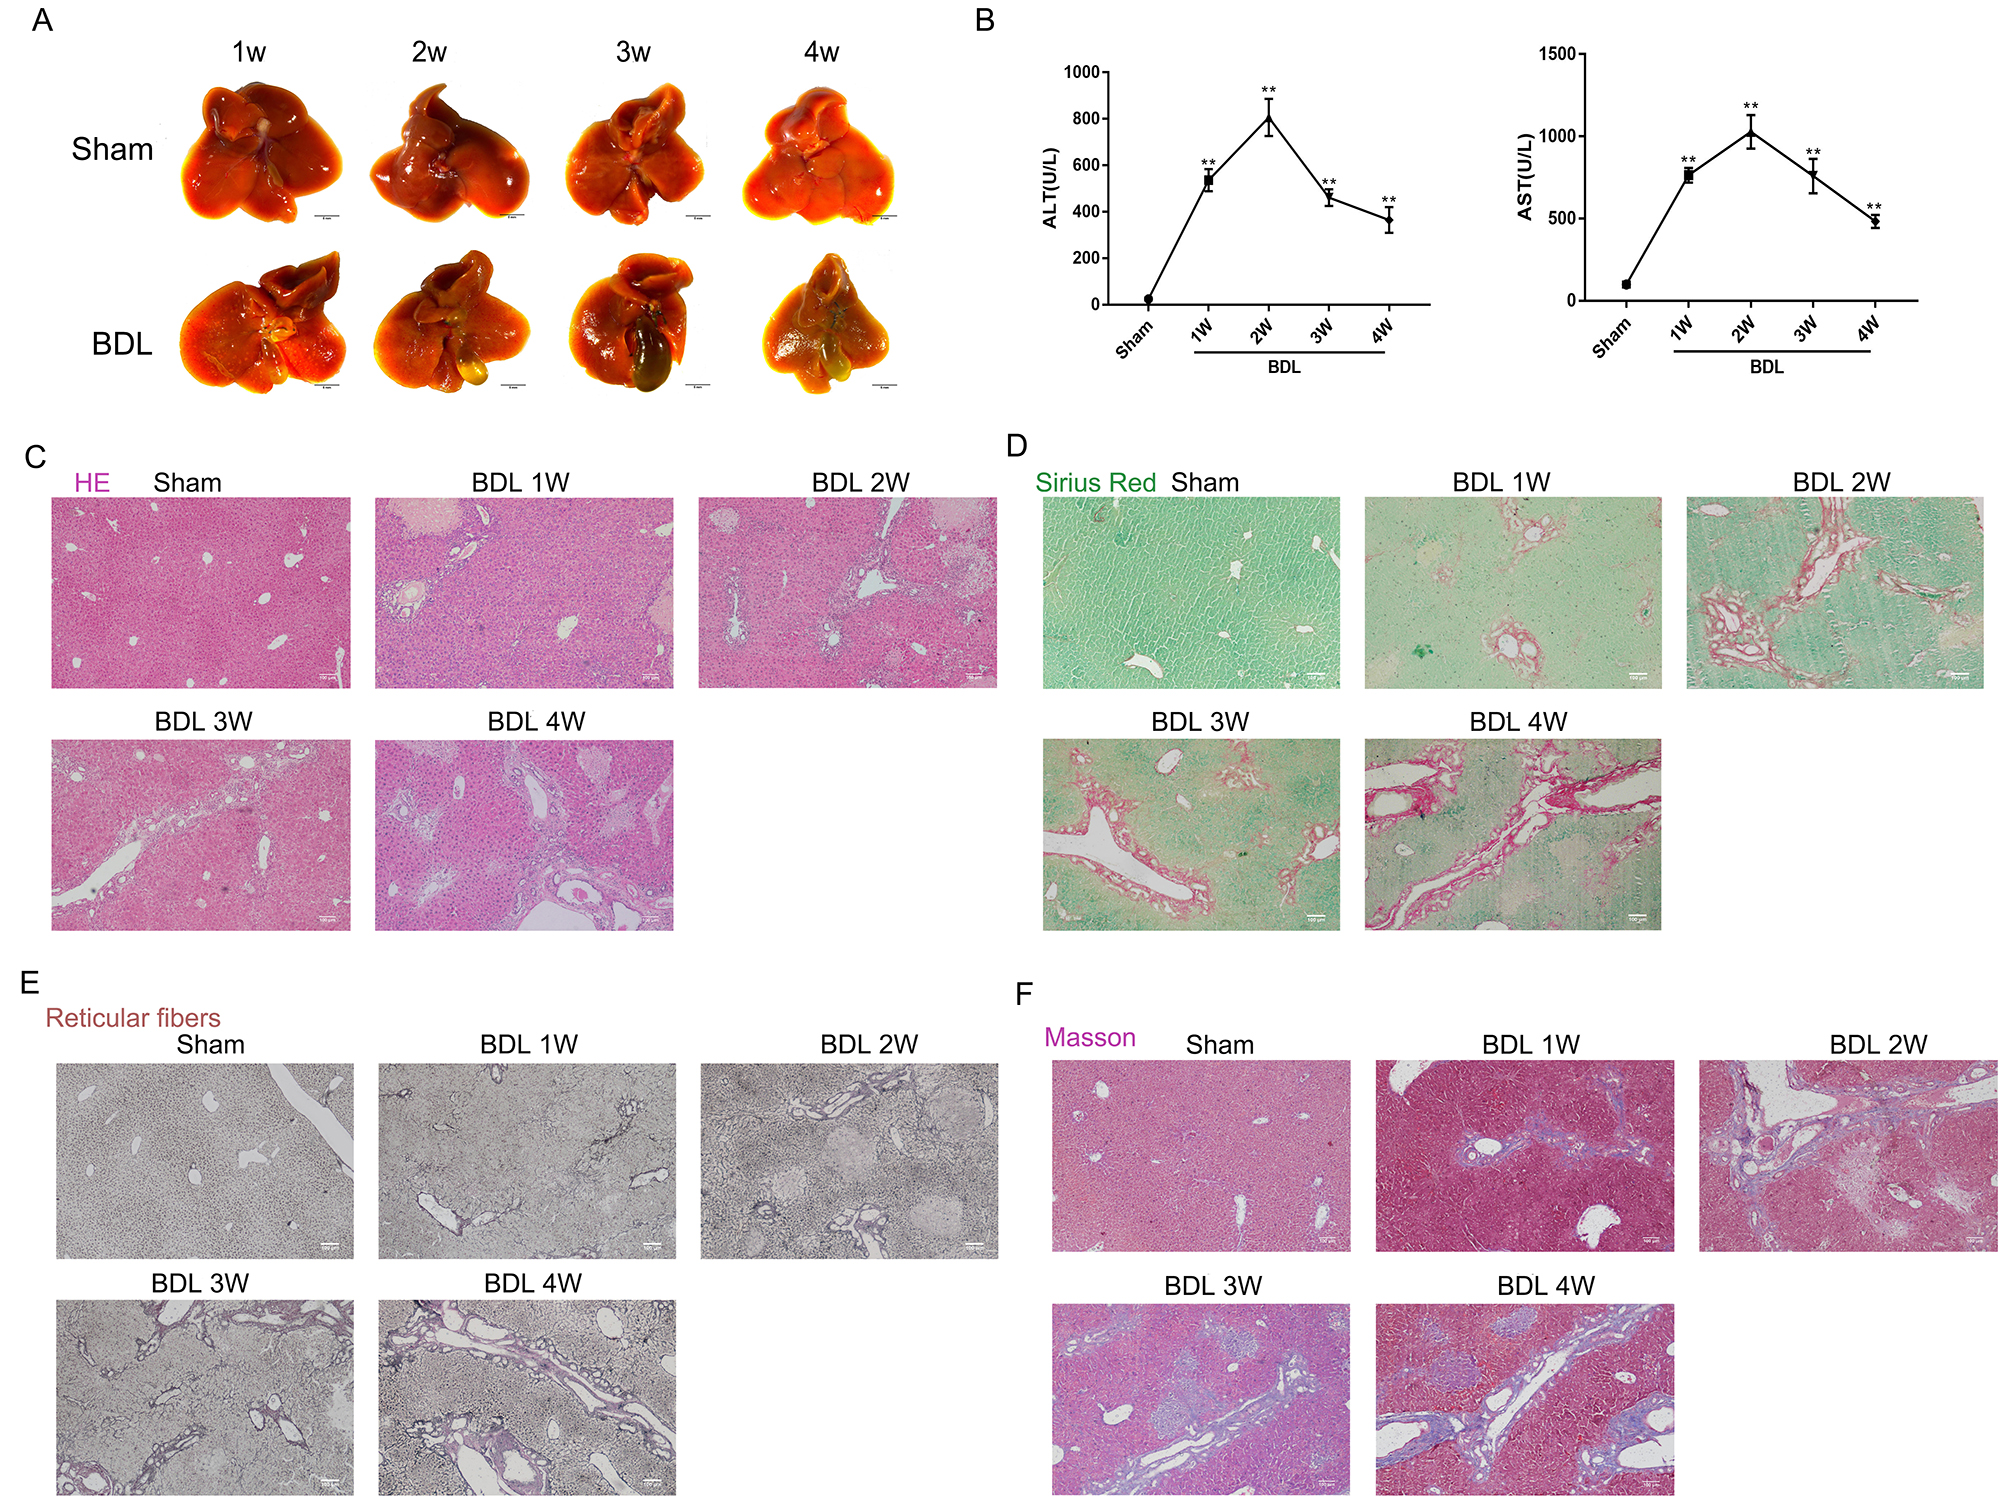 Fig. 1.
Macroscopic appearance and histological staining of the
livers from BDL and sham-operated mice. (A) Liver morphology of BDL-induced
fibrosis mice and sham mice at 1, 2, 3, and 4 weeks after surgery. (B) Liver
function analysis showing ALT and AST levels in BDL and sham mice. (C–F) Results
of H&E, Sirius red, reticular fiber, and Masson staining of liver tissues from
BDL and sham mice. BDL, bile duct ligation; ALT, alanine aminotransferase; AST,
aspartate aminotransferase; H&E, hematoxylin and eosin. **p
Histological analysis of liver tissue from BDL mice revealed severe focal necrosis, vacuolated hepatocytes, increased and enlarged reticular fibers, and elevated levels of collagen fibers (Fig. 1C–F). In contrast, the liver tissue morphology, lobular structure, central venules, and bile duct structure of sham mice appeared normal, with no evidence of fibrosis, cellular degeneration or inflammatory changes.
Single-cell transcriptomic analysis (10
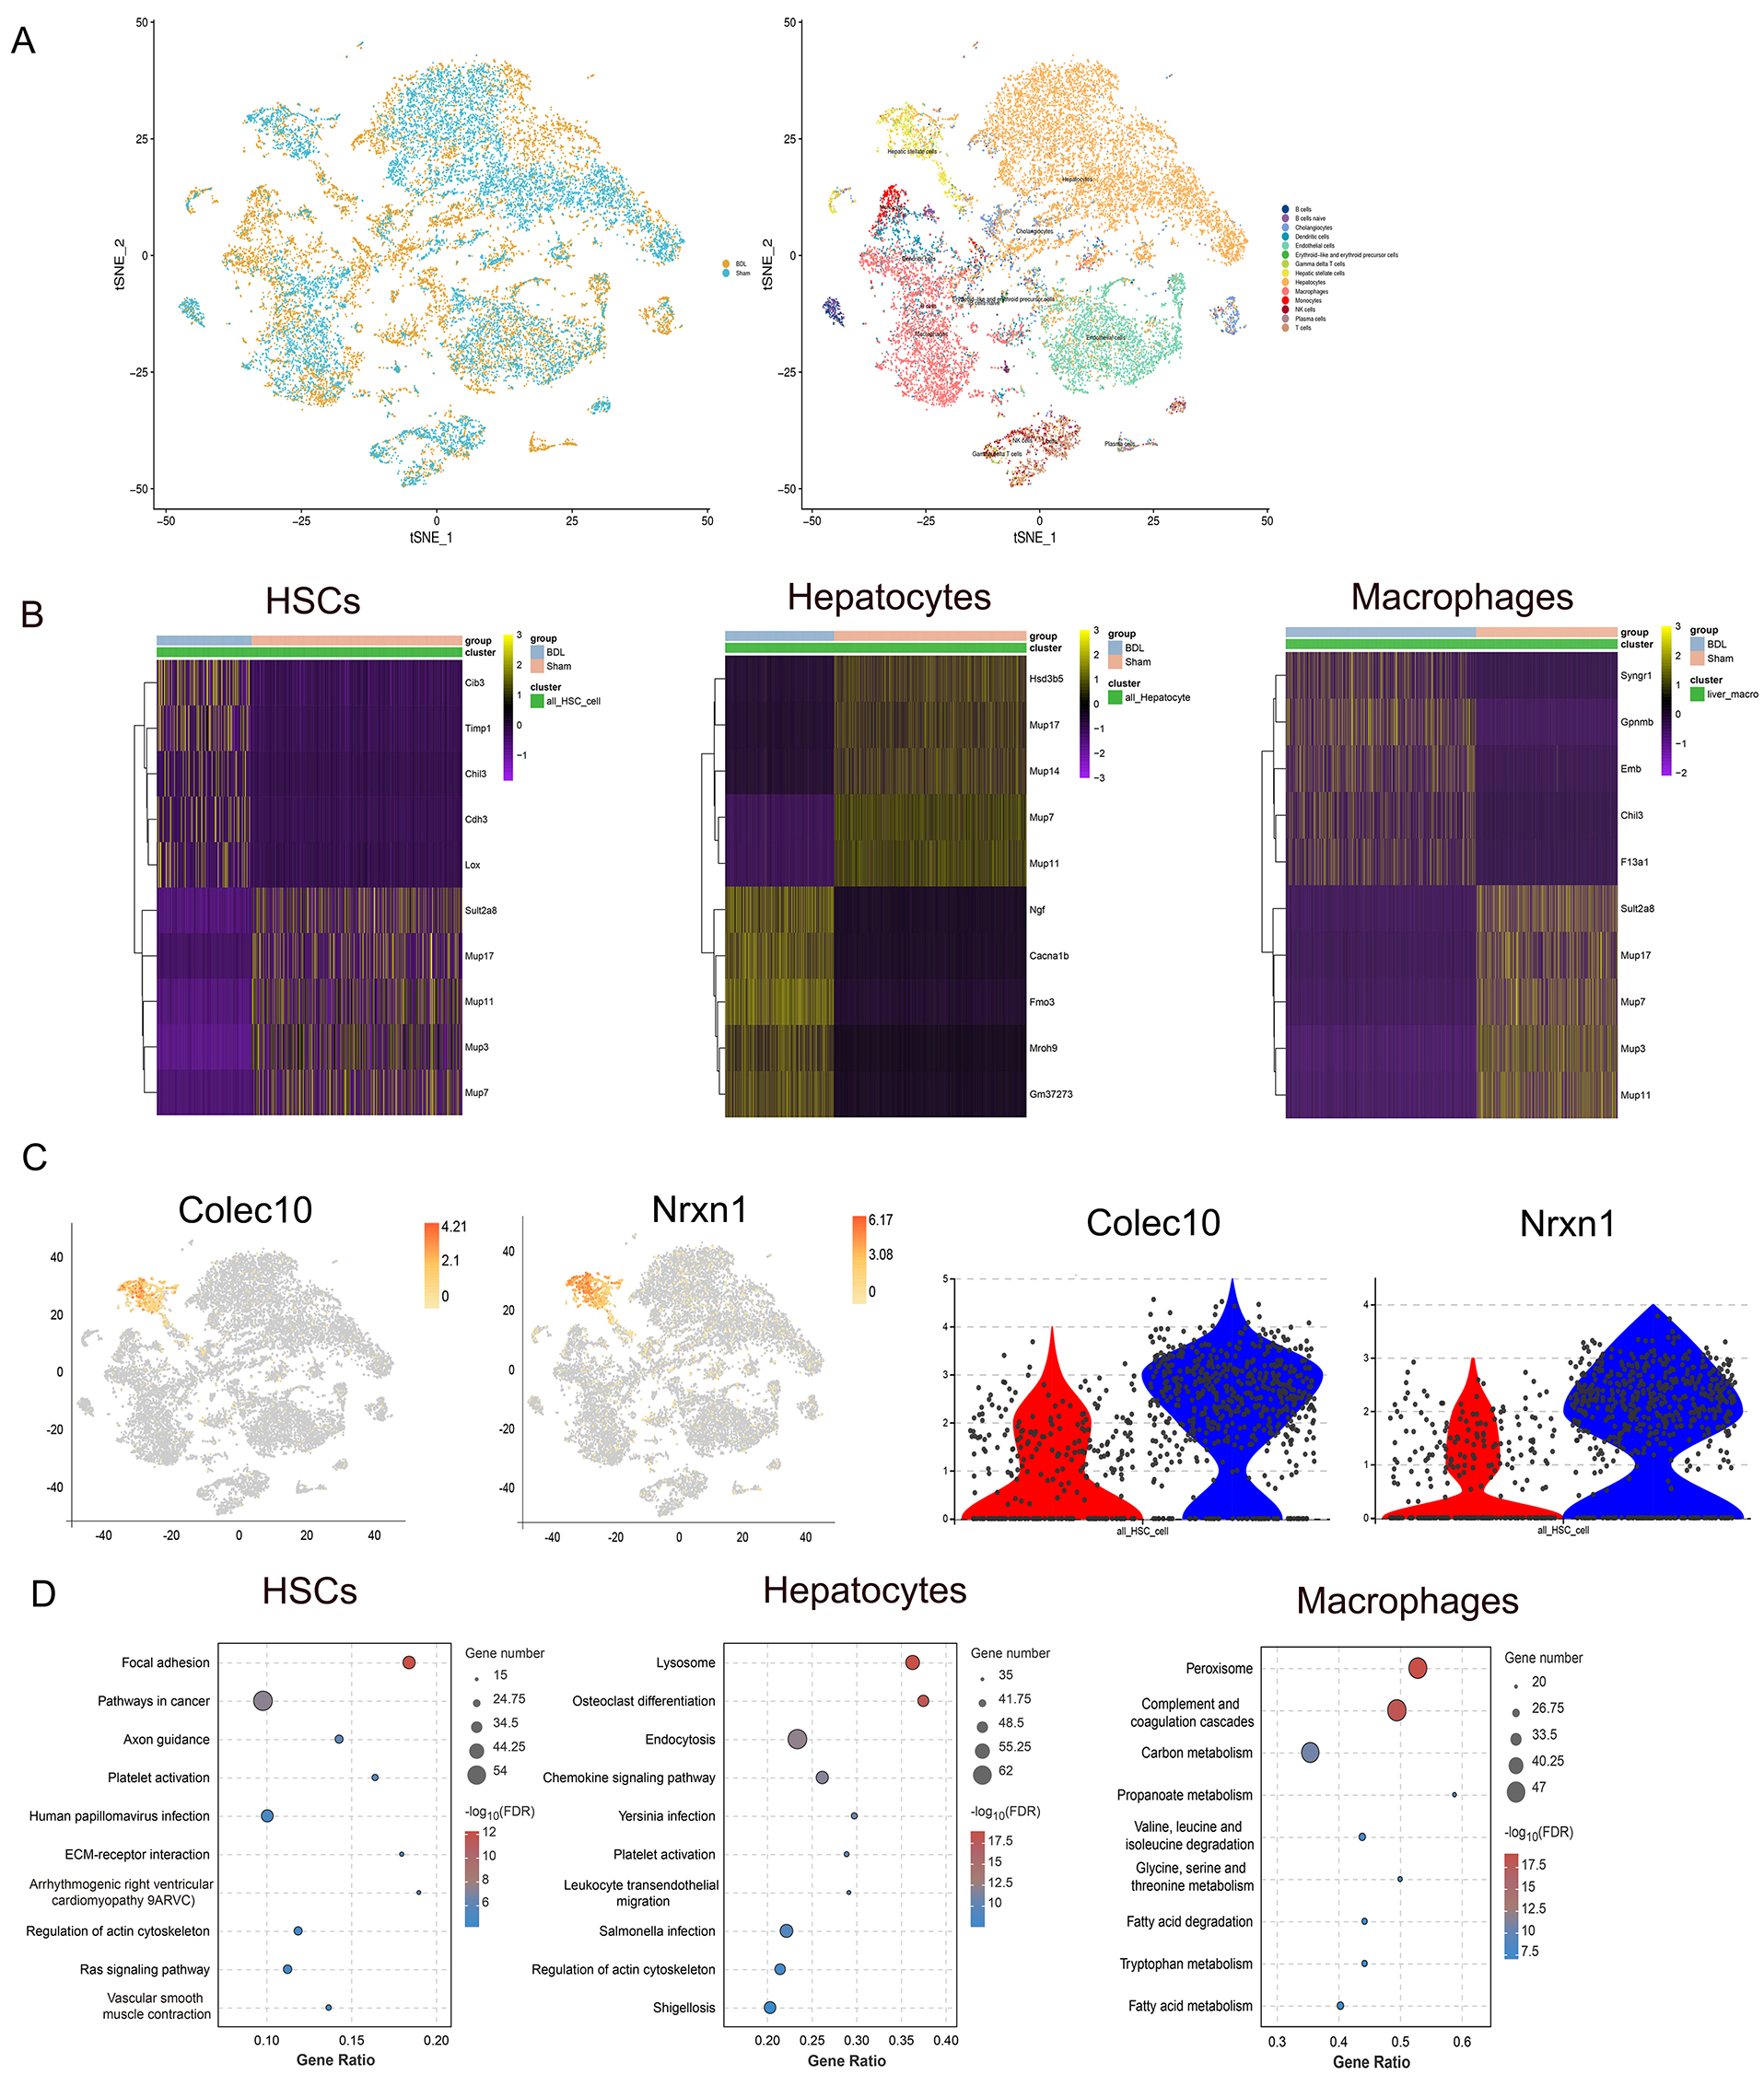 Fig. 2.
Overview of single-cell RNA sequencing in liver tissues, and the
distribution of HSC-specific marker gene expression. (A) Unsupervised clustering
of scRNA-seq of liver tissue from BDL and sham-operated mice identified various
cell types, including hepatocytes, macrophages, liver endothelial cells, HSCs, T
cells, NK cells, B cells, etc. (B) The top 10 differentially expressed genes in
HSCs, hepatocytes, and macrophages between BDL and sham mice. (C) Gene expression
in HSCs was higher than in other cell types. Violin plot of gene expression in
the sham (red) and BDL (blue) groups. (D) Results of KEGG enrichment analysis
showing the top 10 pathways according to the number of input genes in HSCs,
hepatocytes and macrophages (p
We next investigated genes that were positively regulated and showed increased expression in the BDL group compared to the sham-operated group. The functional implications of up-regulated genes in different cell types was explored, followed by KEGG enrichment analysis of up-regulated genes that were specific to HSCs, hepatocytes, and macrophages (Fig. 2D). Genes associated with focal adhesion, platelet activation, ECM-receptor interaction, and regulation of the actin cytoskeleton were up-regulated in HSCs. Genes related to lysosomes, endocytosis, platelet activation and regulation of the actin cytoskeleton showed higher expression levels in hepatocytes, while genes enriched in pathways related to peroxisome, complement and coagulation pathways, as well as carbon metabolism, were up-regulated in macrophages. Overall, both HSCs and hepatocytes demonstrated significant activation of platelet-related processes and synthesis of the actin cytoskeleton in BDL mice, with HSCs in particular showing pronounced accumulation of ECM.
HSCs from the BDL and sham mice were divided into 10 distinct subgroups based on their gene expression patterns and distribution (Fig. 3A,B). The distribution of HSCs in sham-operated and BDL mice was significantly clustered, with the majority located in the cluster 2 subgroup (Fig. 3C,D). All HSC subgroups expressed cell type-specific genes (e.g., Ecm1, Colec11, Hgf, Vipr1) (Fig. 3E–R). Interestingly, genes related to high levels of fibrosis, including Col1a1, Col1a2 and Acta2, were specifically identified in clusters 0, 5, and 8 (Supplementary Fig. 1s1–s3). The HSCs were then divided into different sample subgroups that were either unique to the sham group, or shared by both groups (Fig. 3S). Differential analysis identified molecular markers that were shared (Lyz2, Cd74, Scube1, C1qb, Krt8), or sham-specific (Ttc39c, Dpyd, Ppara, Hao1, Egfr) (Fig. 3T). According to KEGG analysis, highly expressed genes in the shared subgroup were related to ribosomes, oxidative phosphorylation, PPAR signaling, and ferroptosis (Fig. 3U), while those in the sham-specific subgroup were related to bile secretion and the peroxisome (Fig. 3V).
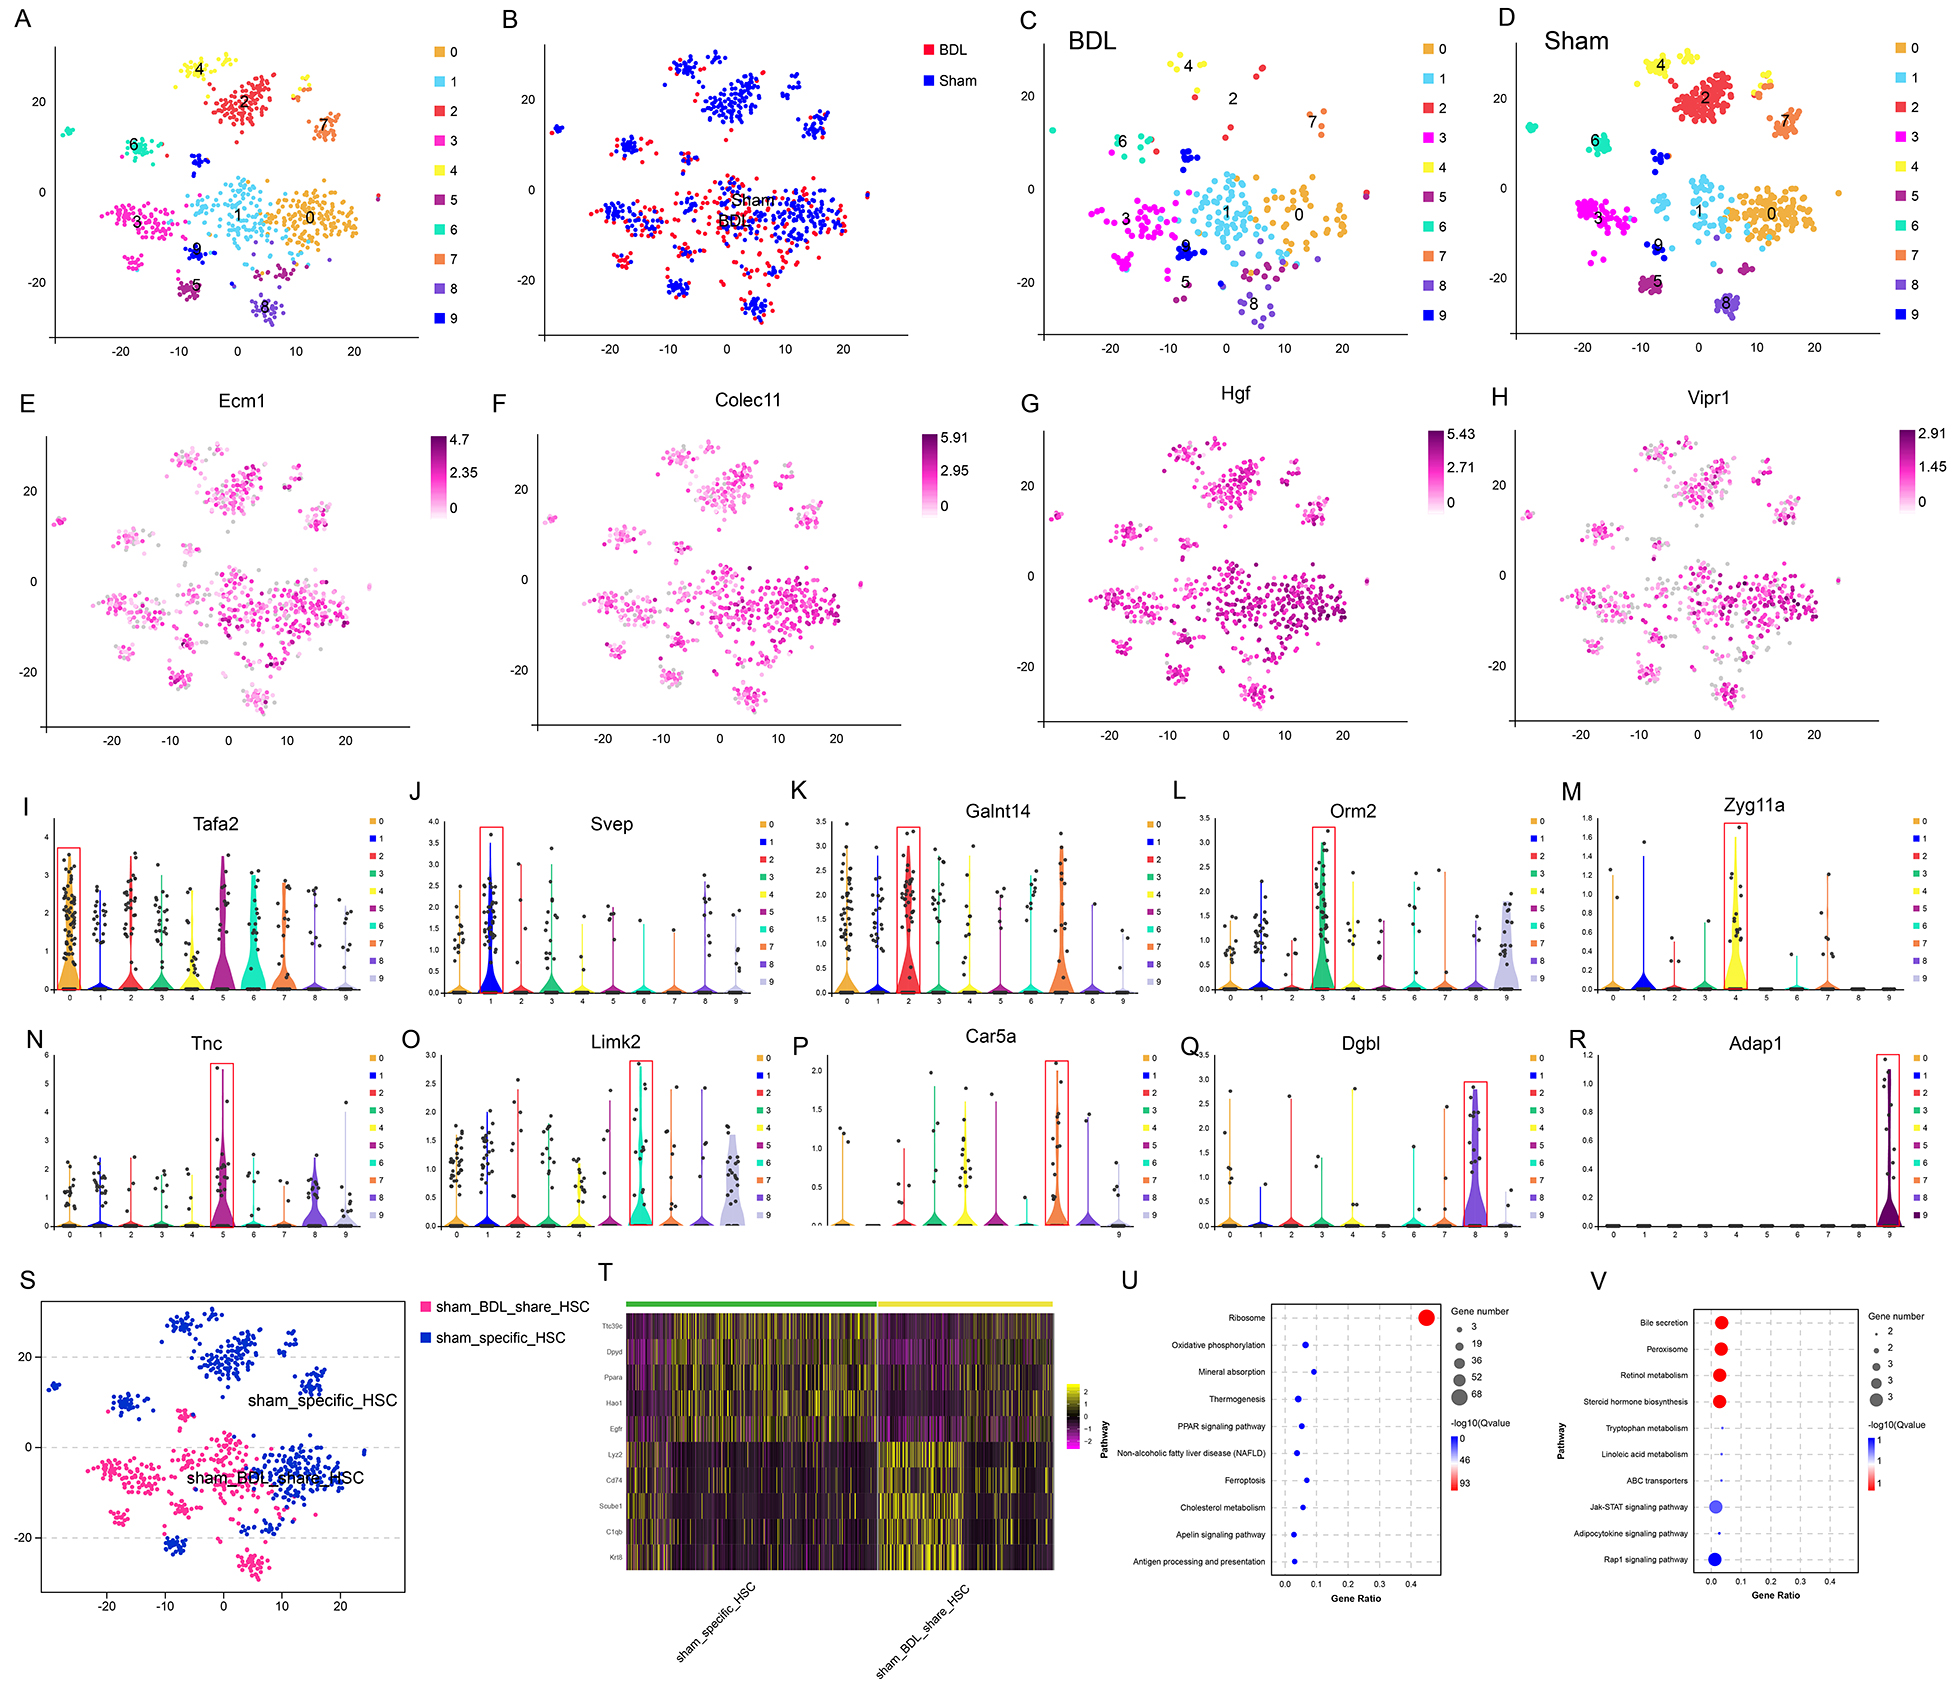 Fig. 3.
Typing and molecular marker identification of each HSC subtype. (A) HSC subsets were analyzed in sham and BDL mice. (B) Diagram of the HSC sample distribution. (C,D) BDL- and sham-specific HSCs, respectively. (E–H) Expression of HSC-specific markers in BDL and sham mice. (I–R) Marker gene expression in the 10 HSC subgroups. (S) HSC subgroups shared by BDL and sham mice, and HSC subgroups specific to the sham mice. (T) Heatmap of the top 5 differentially expressed genes in HSCs shared by the BDL and sham mice, and those specific to sham mice. (U,V) KEGG enrichment analysis of genes up-regulated in HSC subsets shared by BDL and sham mice, and those unique to sham mice.
A trajectory study of HSCs in both the BDL and sham groups showed distinct expression patterns between resting and activated HSCs (Supplementary Fig. 1s4–s9). In the sham group, HSCs were predominately in a resting state, whereas HSCs in the BDL group mainly showed higher expression levels of pro-fibrosis genes. ScRNA-seq analysis consistently demonstrated that HSCs from BDL mice expressed high levels of migration- and ECM-related genes, including Col1a1 and Acta2. ScRNA-seq and temporal trajectory analysis revealed that resting HSCs, which did not express key pro-fibrosis genes, were only present in sham mice. In BDL mice, HSCs were activated and there was an increased level of ECM1 expression. As the liver damage progressed, these cells transformed into terminal HSCs with high Acta2 and Col1a1 expression.
Among the co-enrichment results for HSCs and hepatocytes, the ferroptosis signaling pathway stood out in both (Fig. 4A). A role for ferroptosis in LF has been supported by several studies [16, 17, 18]. To identify genes associated with the ferroptosis pathway in BDL mice, the expression levels of key ferroptosis marker genes in hepatocytes and HSCs were comprehensively analyzed. Ferroptosis pathway-related inhibitory genes, such as Ascl1, Glutathione peroxidase 4 (Gpx4), Cp, Fth1, Ftl1, Gclm, Trf, were all up-regulated in the HSCs of BDL mice, while the Ascl1 ferroptosis-specific regulatory gene was down-regulated (Fig. 4B,C). The expression patterns of these genes were identical in both HSCs and hepatocytes (Fig. 4B,C). Gpx4 and Gclm may affect HSC and hepatocyte ferroptosis via synthesis of glutathione (GSH), while Cp and Trf could reduce free Fe by binding Fe ions, thereby inhibiting Fe-dependent cell death. The distribution of Fth1 and Acsl1 expression in BDL and sham mice indicated that Ascl1 was differentially expressed mainly in hepatocytes and HSCs, while the expression of Fth1 varied across multiple cell types (Fig. 4D).
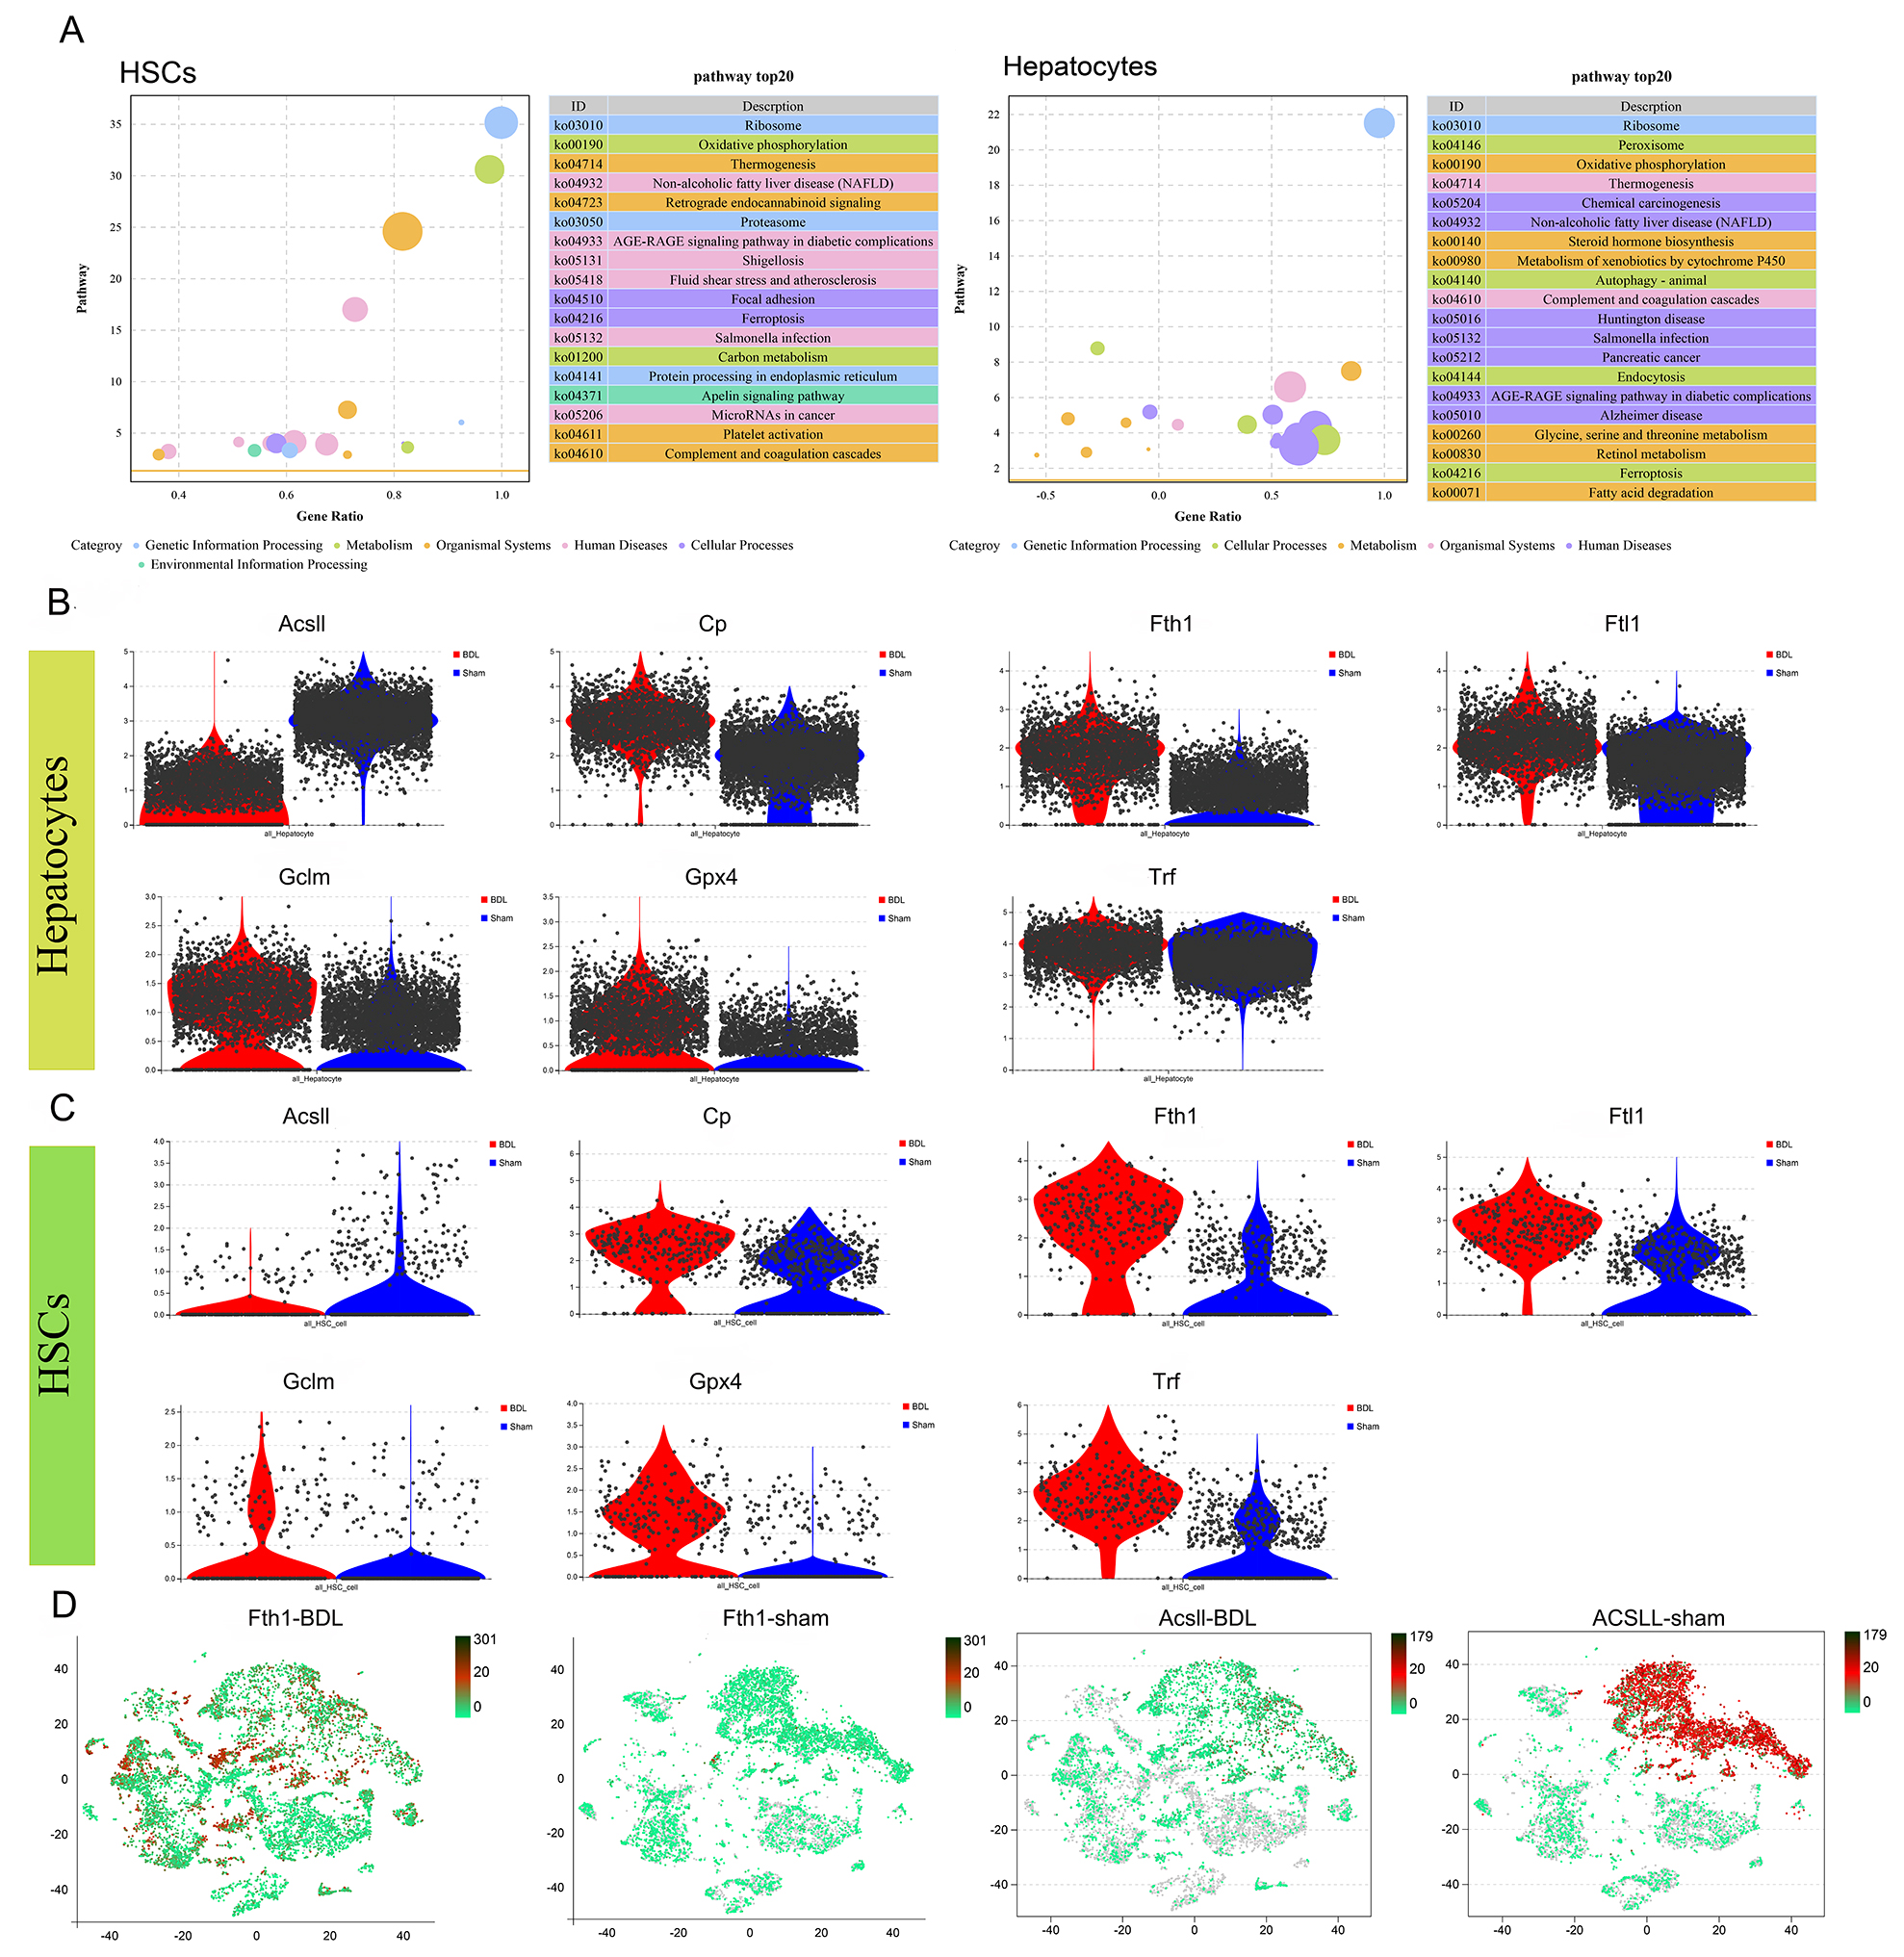 Fig. 4.
The interaction between HSCs and hepatocytes modulates the
expression of ferroptosis-related genes, thereby facilitating liver fibrosis.
(A) HSCs and hepatocytes were enriched for ferroptosis-related genes. (B)
Differences in ferroptosis gene expression in sham and BDL hepatocytes. (C)
Differences in ferroptosis gene expression in sham and BDL HSCs. (D) Distribution
of Fth1 and Acsl1 expression in BDL and sham mice. All gene
comparisons in the figure represent differentially expressed genes (DEGs)
identified using differential gene analysis (p
Apelin signaling-related genes were significantly upregulated in HSCs and hepatocytes from BDL mice (Fig. 5A,B). Superoxide dismutase (SOD1/SOD2) and Gpx1 also showed elevated expression levels in BDL HSCs (Fig. 5C), indicating these cells have elevated antioxidant capacity that can potentially render them less susceptible to ferroptosis. Conversely, SOD1/SOD2 were down-regulated in BDL hepatocytes, while NOX4/MAPK3 were up-regulated (Fig. 5C). Apelin has been implicated in the proliferation of bile duct cells through Nox4/ROS/ERK-dependent signaling, potentially inducing HSC activation through intracellular ROS pathways. Apelin expression might increase antioxidant capacity by up-regulating the expression of SOD1/SOD2 and consequently reducing ferroptosis in HSCs, while concurrently promoting NOX4/ROS/ERK signaling in hepatocytes. To investigate the association between Apelin signaling and the cell cycle, the cell cycle status of both BDL and sham groups was evaluated. A considerable reduction in the number of non-cycling cells was observed in BDL mice, accompanied by an increase in cells within the G2 and M phases (Fig. 5D). Further examination of cell cycle stage-specific genes revealed significant up-regulation in the expression of G2- and M-phase-related genes in BDL mice, suggesting potential acceleration of the cell cycle by Apelin (Fig. 5E).
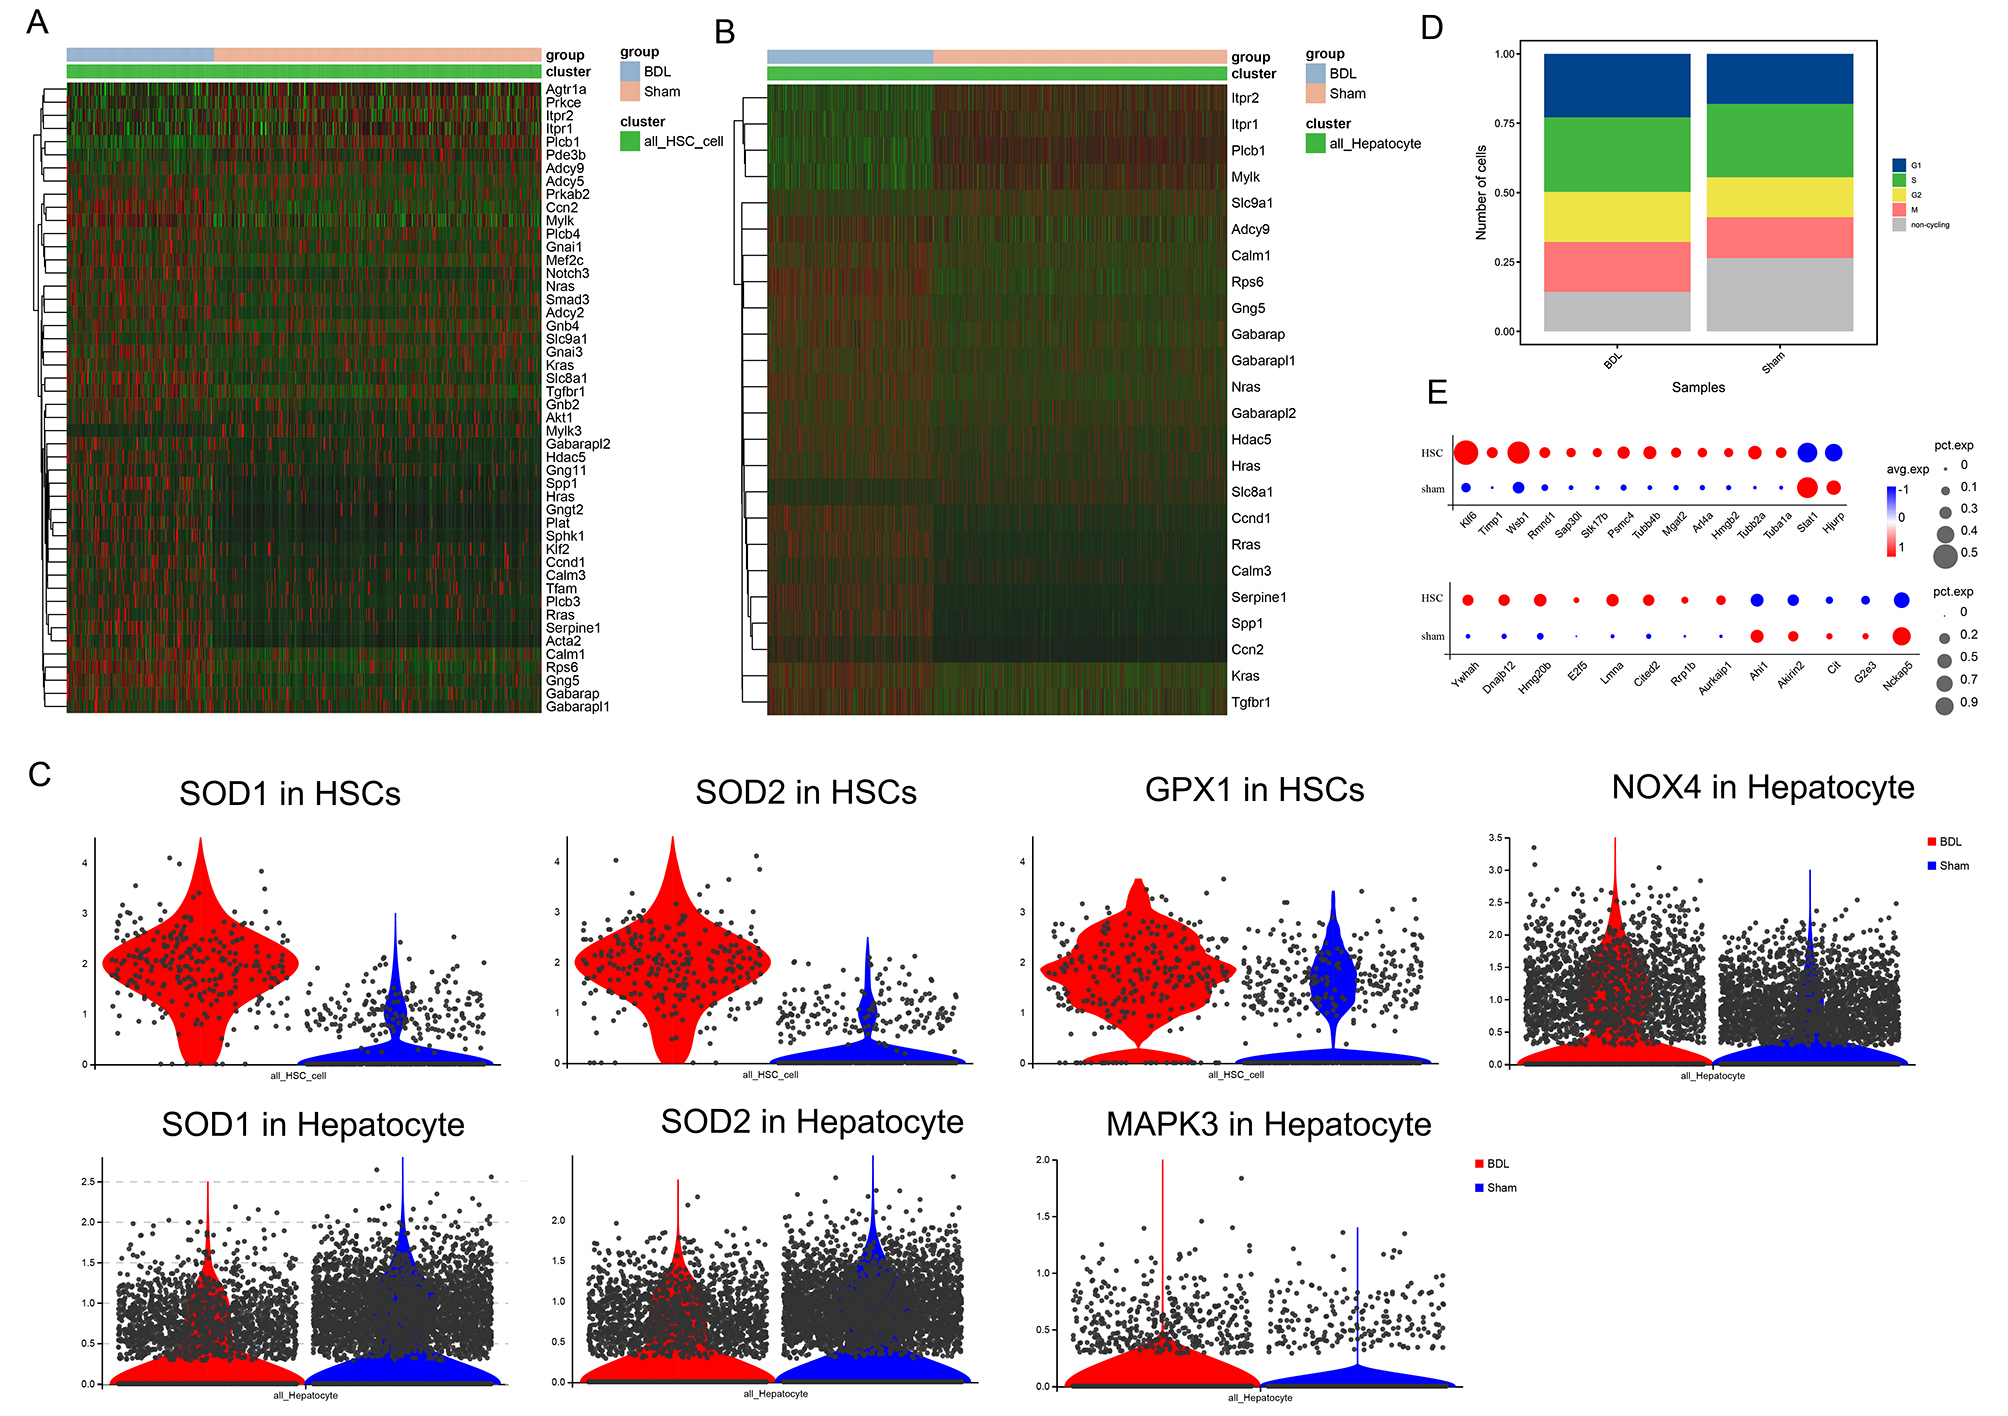 Fig. 5.
The interaction between HSCs and hepatocytes regulates the
expression of Aplin pathway and cell cycle genes in HSCs, thereby promoting liver
fibrosis. (A,B) Heat maps of the differential expression of Apelin
signaling-related genes in HSCs and hepatocytes. (C) Differential expression of
SOD1/SOD2, GPX1, NOX4, MAPK3 in HSCs and
hepatocytes. (D) Cell cycle changes in liver tissue from BDL and sham mice. (E)
Changes in the expression of genes related to the G2 and M phases of the cell
cycle in HSCs. All gene comparisons in the figure represent DEGs identified using
differential gene analysis (p
Up-regulation of the receptor for platelet-derived growth factor (PDGF) is an
important metabolic manifestation observed in HSCs during LF [19]. Notably, genes
in HSCs and hepatocytes that show significant differential expression between the
BDL and sham mice were enriched in pathways related to platelet activation (Fig. 2D), suggesting dysregulation of platelet-related gene expression in BDL-induced
LF. The expression profile in HSCs and hepatocytes of genes related to platelet
activation was compared between BDL and sham mice. The majority of these genes
were up-regulated in the HSCs and hepatocytes of BDL mice (Fig. 6A).
Concurrently, PDGF expression was elevated in both HSCs and hepatocytes
(Fig. 6B), with significant up-regulation of the PDGF receptor observed
specifically in the HSCs of BDL mice (Fig. 6C). Additional investigation into
platelet-specific downstream factors revealed significant up-regulation of
TGF-
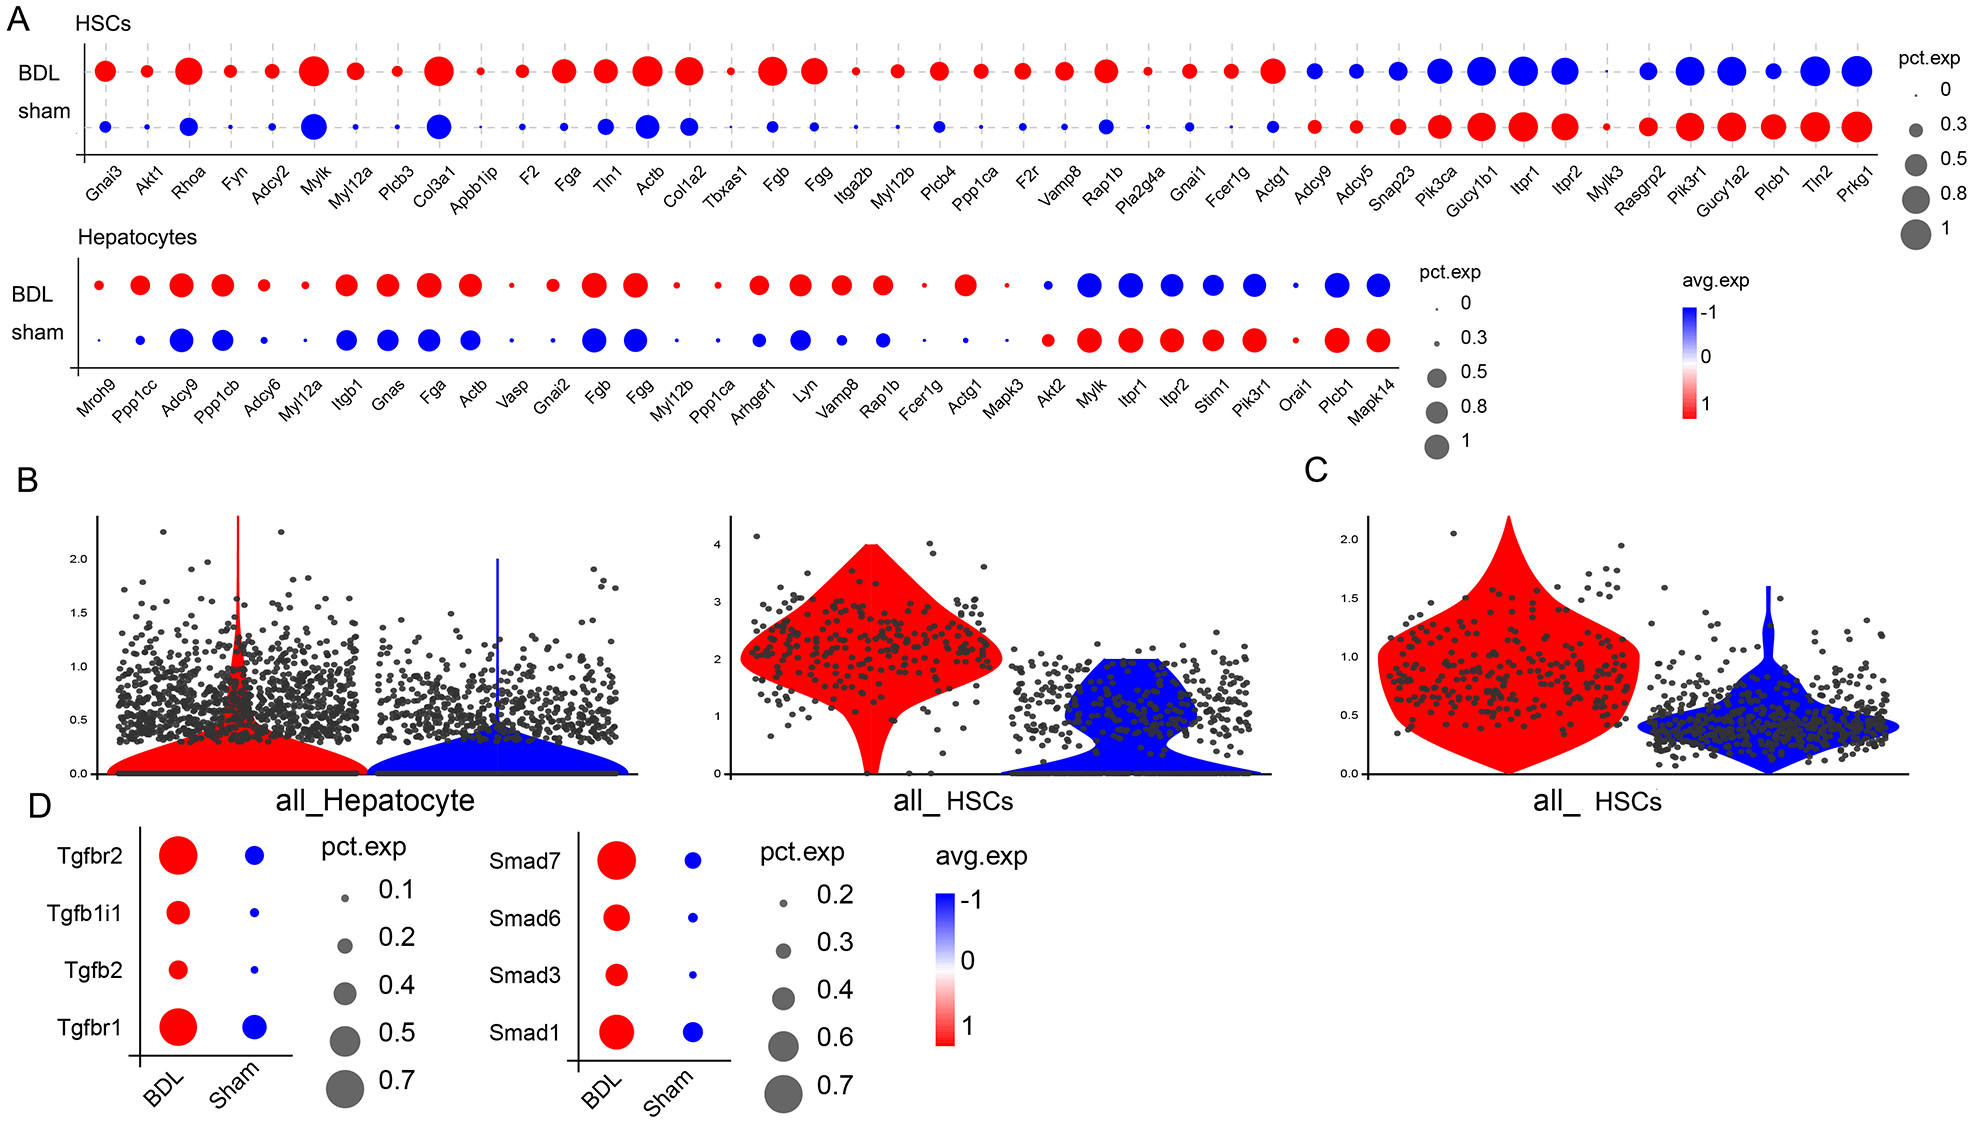 Fig. 6.
Expression of platelet activation-related genes and
downstream factors in HSCs. (A) Changes in the expression of genes related to
platelet activation in HSCs and hepatocytes. (B) Changes in PDGF expression in
HSCs and hepatocytes. (C) Changes in PDGF receptor expression in HSCs. (D)
Changes in TGF-
To assess the level of immune cell infiltration in BDL, common immune cell
markers were used to annotate the immune cell types in 27 cell clusters (Fig. 7A). Eosinophils, red pulp macrophages, and T memory cells were found to be the
most important immune cells in the sham group (Fig. 7A), and T memory cells, red
pulp macrophages, neutrophils and MDSC in BDL mice (Fig. 7A). Red pulp
macrophages are mainly involved in immune surveillance, iron metabolism and cell
clearance [20]. The interaction between macrophages and HSCs plays a crucial
role in regulating the formation and excessive deposition of ECM in the liver [4, 21]. Specifically, macrophages secrete prostaglandins that bind to receptors on
the surface of HSCs, leading to the activation of autophagic signaling in these
cells [22]. Various studies have demonstrated that macrophages play a crucial
role in promoting the proliferation and differentiation of HSCs into fibroblasts
through the release of TGF-
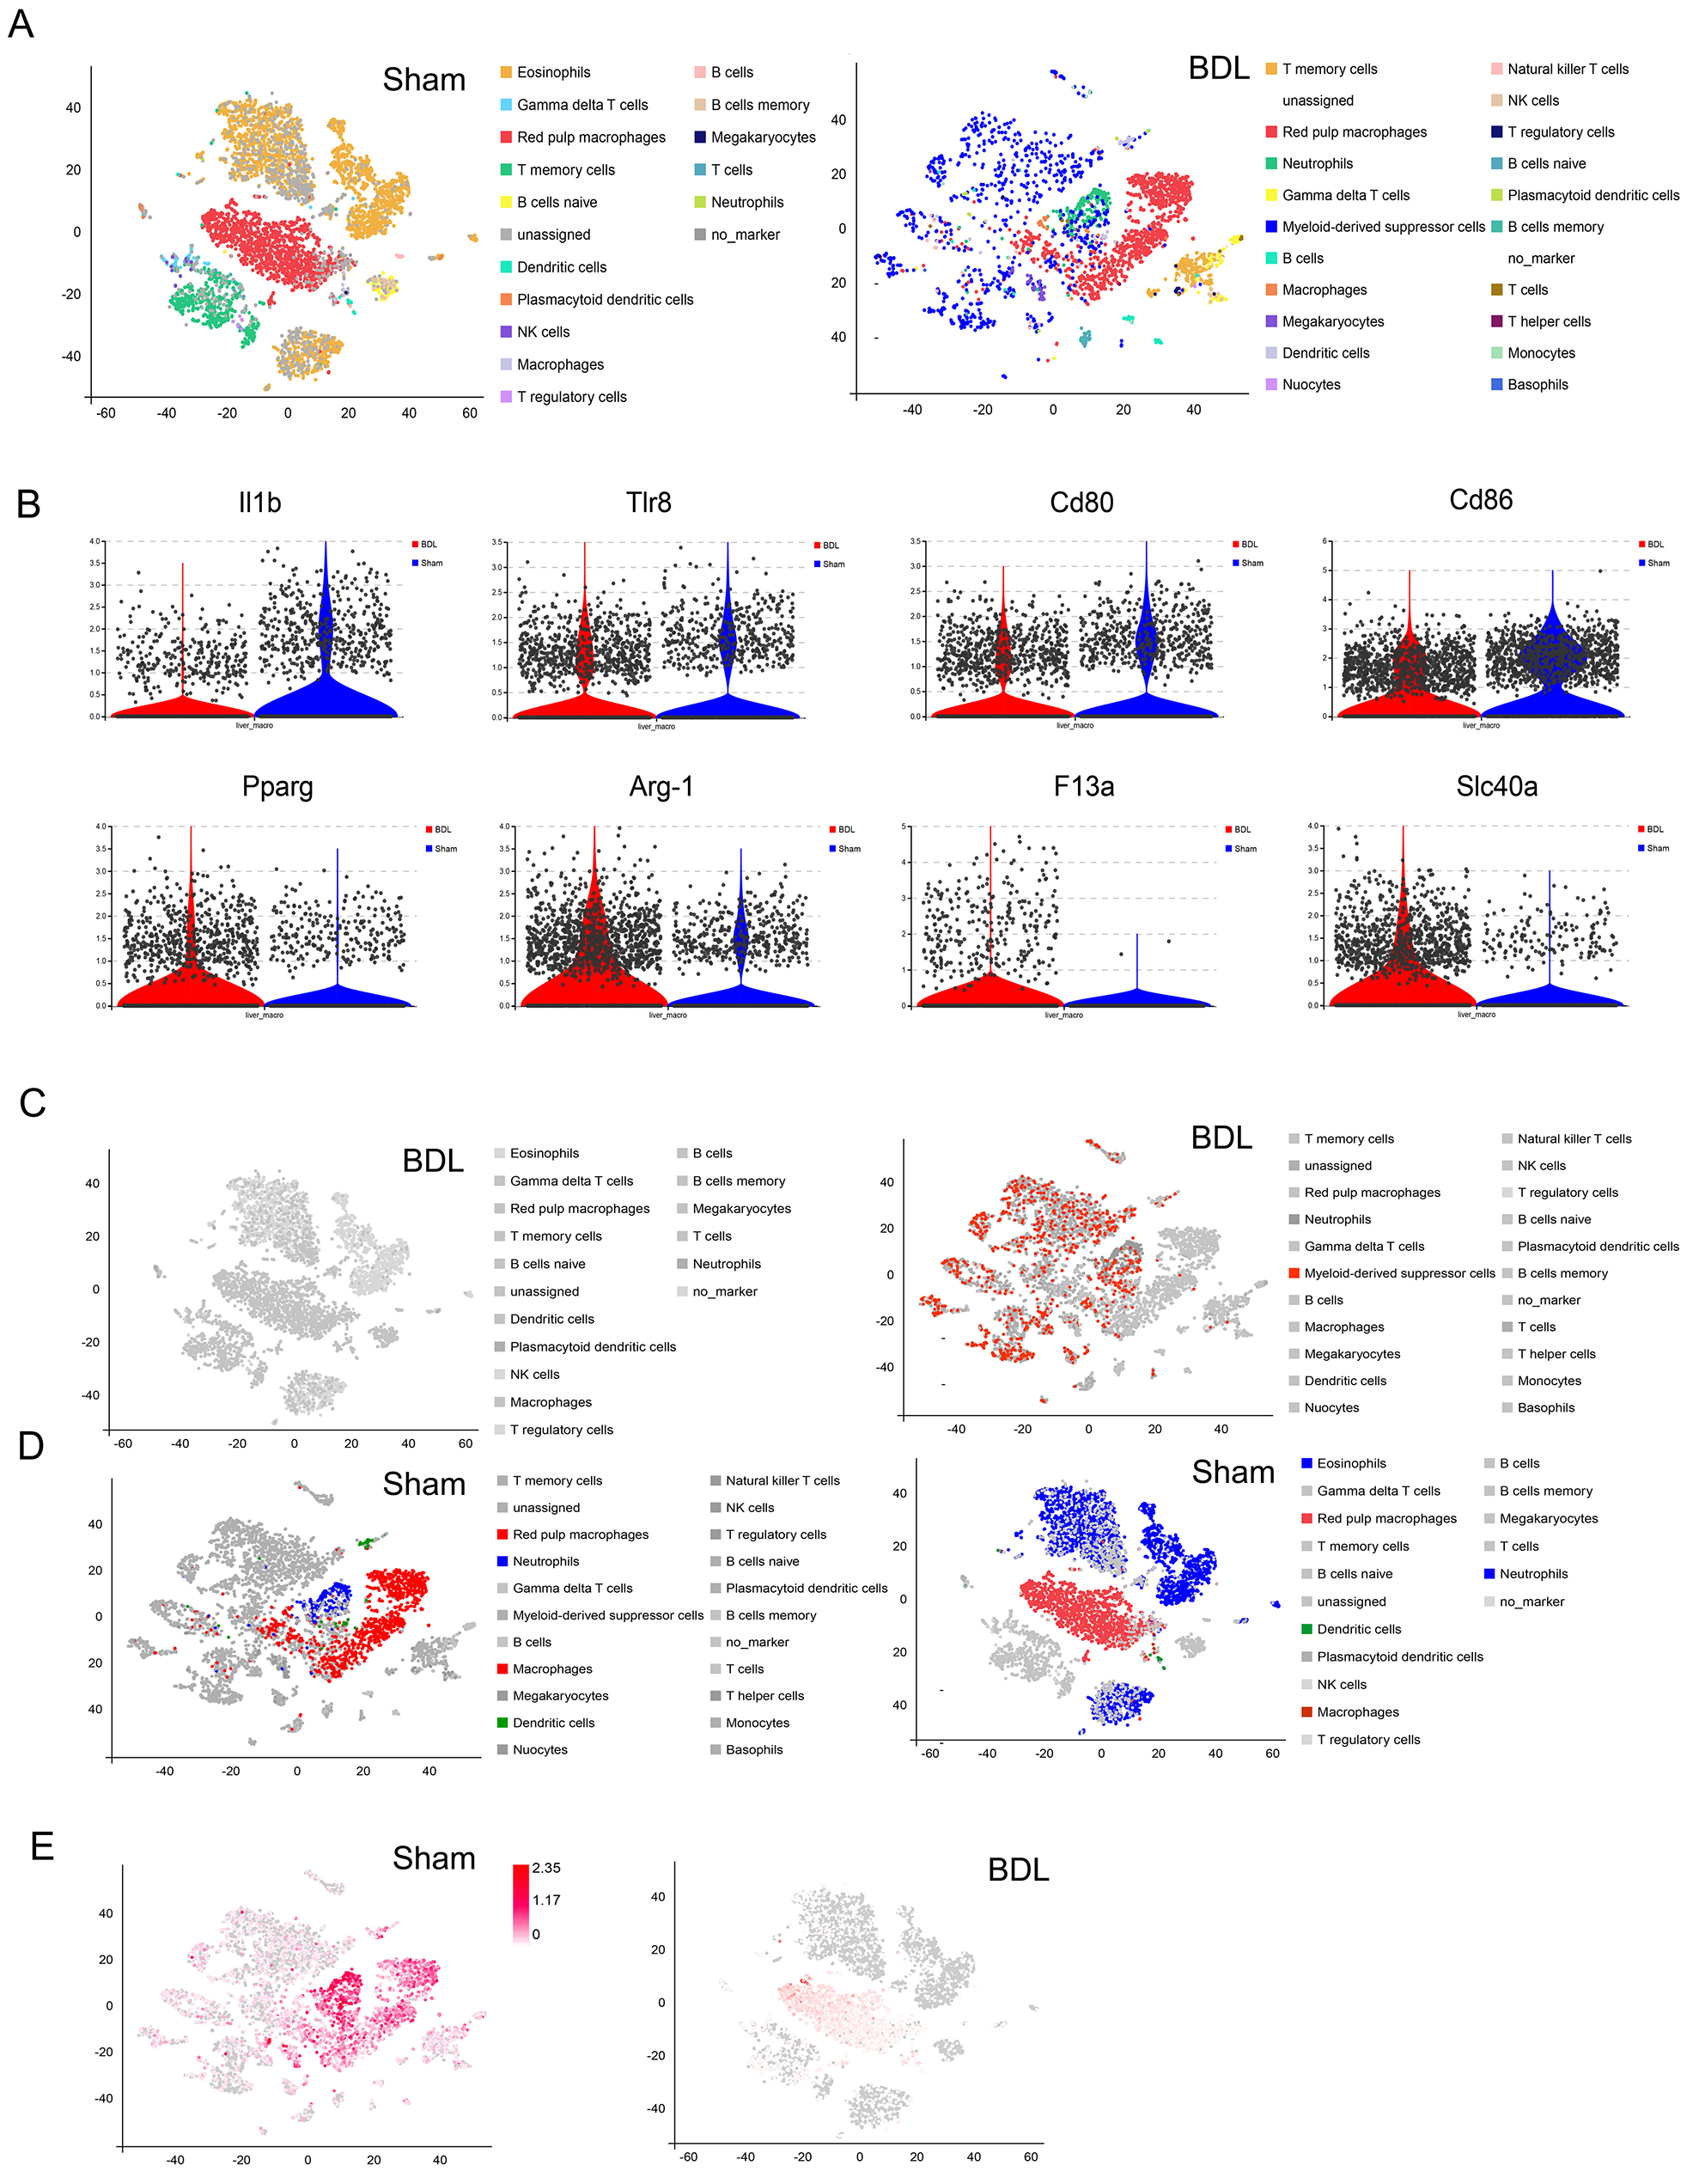 Fig. 7.
Interactions between immune cells and HSCs lead to different outcomes for liver fibrosis. (A) Immune cell type annotation in liver tissue from sham and BDL mice. (B) Expression of M1 and M2 marker genes in macrophages from BDL and sham mice. (C) Expression and distribution of eosinophils, macrophages, dendritic cells and MDSCs in the liver tissue of BDL mice. (D) Expression and distribution of eosinophils, macrophages, dendritic cells and MDSCs in the liver tissue of sham mice. (E) Distribution of MDSC marker gene expression in the liver tissue of BDL and sham mice. MDSCs, myeloid-derived suppressor cells; Il1b, Interleukin 1 beta; Tlr8, Toll like receptors 8; Cd80, Cluster of Differentiation 80; Pparg, peroxisome proliferative activated receptor, gamma; Arg-1, Arginase-1; F13a1, Coagulation Factor XIII A Chain; Slc40a1, Solute Carrier Family 40 Member 1; NK, natural killer cell.
Other annotated immune cells such as MDSCs were also notable (Fig. 2A). These cells promote normal immune responses in various organs and tissues. During liver injury, MDSCs accumulate in the liver and induce the proliferation of HSCs and promote fibrosis. This has become a new hotspot area for research into LF. In the present study, a significant increase in MDSCs was observed in BDL mice, in parallel with a decrease in eosinophils (Fig. 7C). In contrast, sham mice had very few MDSCs and a high level of eosinophils (Fig. 7D). MDSC marker genes (e.g., Ly6g, Itgam, Fut4, Cd33, Ccr2) were also expressed at much higher levels in BDL mice compared to sham mice, with the expression mainly concentrated in MDSCs and neutrophils (Fig. 7E).
Stearoyl-CoA desaturase 1 (SCD1) is a pivotal enzyme in hepatic lipid anabolism,
catalyzing the crucial step of converting saturated fatty acids into
monounsaturated fatty acids. The overexpression of SCD1 in activated
HSCs is associated with diet-induced steatohepatitis and fibrosis through the
regulation of Wnt signaling. The present study found that SCD1 was
significantly upregulated in the majority of HSCs in BDL mice, whereas only a
small fraction of HSCs in the sham group expressed SCD1 (Fig. 8A,B).
Furthermore, BDL-induced HSCs and hepatocytes showed increased expression of many
of the Wnt signaling-related genes (Fig. 8C). Additionally,
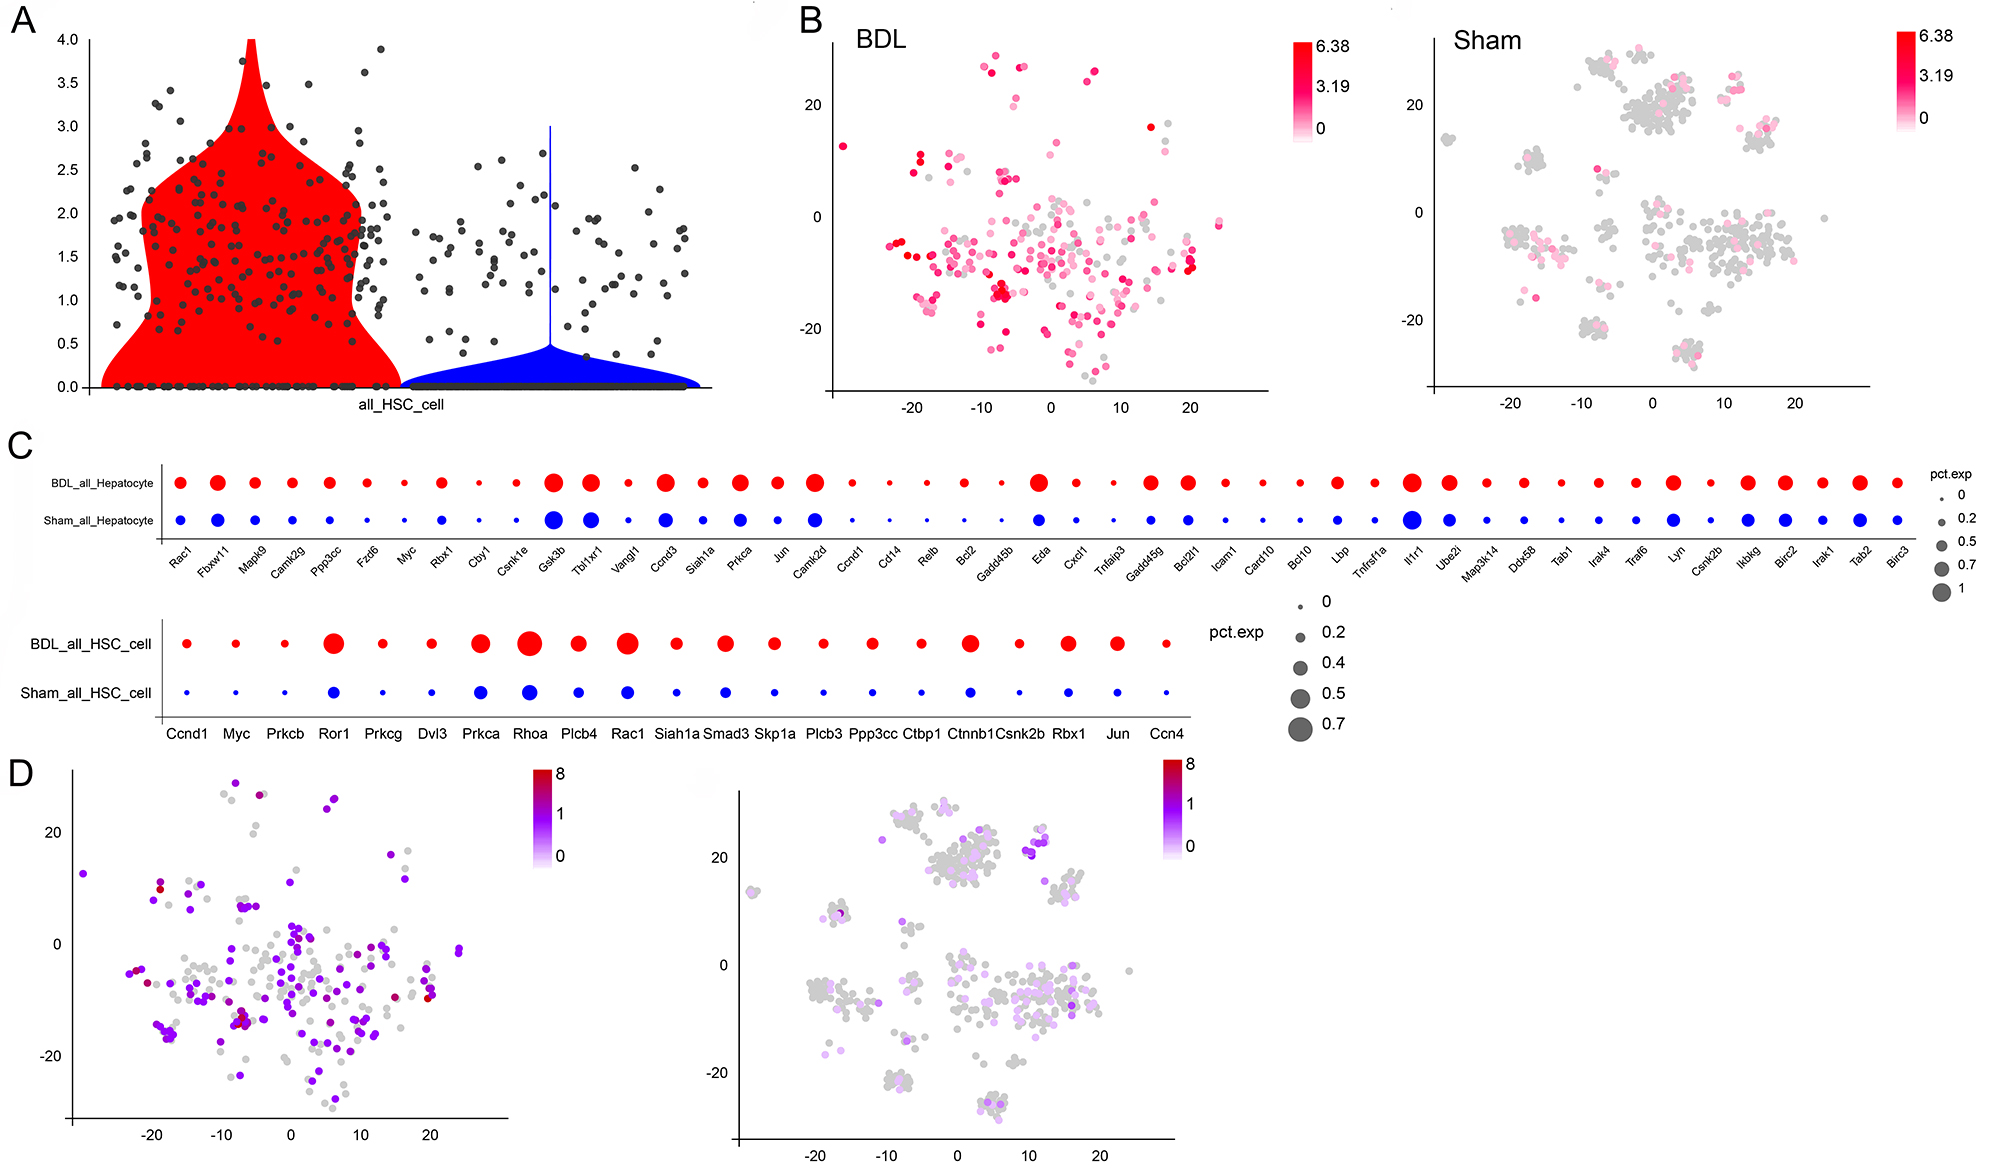 Fig. 8.
Differences in SCD1 gene expression and changes in downstream signaling. (A) Differences in the expression of SCD1 between HSCs from BDL and sham mice. (B) Distribution of SCD1 expression in HSCs from BDL and sham mice. (C) Changes in the expression of Wnt signaling-related genes in HSCs and hepatocytes from BDL and sham mice. (D) Expression and distribution of Cnntb1, a marker of Wnt signaling, in HSCs from BDL and sham mice. SCD1, Stearoyl-CoA desaturase 1; Cnntb1, Catenin Beta 1.
This study characterized the transcriptomic profile of hepatocytes in the livers of sham-operated and BDL mice, identifying important genes and associated mechanisms that underlie liver fibrogenesis across various cell populations. A total of 27 distinct cell lineages were identified, of which HSCs emerged as one of the predominant cell populations undergoing modulation during LF. Subsequent subgroup and trajectory assessments of HSCs from the BDL mouse model and sham-operated mice revealed distinct gene expression patterns in resting and activated cells. While predominantly quiescent HSCs were observed in the sham group, HSCs derived from BDL mice showed increased expression of profibrotic genes such as Col1a1 and Acta2. Colec10 was specifically expressed in BDL HSCs, consistent with findings from other studies [26]. Furthermore, Nrxn1, a member of the neuroin family associated with the upregulation of vascular smooth muscle contraction [27, 28], showed specific expression patterns in BDL-derived HSCs. KEGG analysis of HSCs revealed the enrichment of pathways related to platelet activation signaling, Ras signaling, and vascular smooth muscle contraction.
Ten subsets of HSCs were identified through the analysis of scRNA-seq
clustering. These were present in both the sham and BDL groups, as well as in
exclusive subsets unique to the sham group. Previous study has classified HSCs
into two subsets, namely central venous-associated HSCs (CaHSC) and portal
venous-associated HSCs (PaHSC), considered to be the primary source of
differentiation into collagen-producing myofibroblasts [29]. The subset of HSCs
in the portal vein region referred to as the 1-HSC region appears not to be
associated with LF [30]. In the current study, high expression of HSC subset 2
was observed in the sham group, leading us to hypothesize this subset may
represent PaHSC. Unfortunately, this result was not verified by subsequent
experiments. Notably, Krt8 (keratin 8) was universally expressed in HSC
subsets, albeit at lower levels in healthy mice from the sham group. Remarkably,
these findings are consistent with a previous study indicating that Krt8
deficiency confers protection against pulmonary fibrosis and suppresses
pro-fibrotic cell activation by modulating oxidative phosphorylation [31]. This
was also supported by our analysis of differential gene expression and by the
KEGG analysis. In addition, Cd74 is a marker of microglial activation,
while TGF-
Macrophages play a critical role in the reversal of mild LF. The differential regulation of M1 macrophages, which are associated with pro-inflammatory activity, and M2 macrophages, which are associated with anti-inflammatory effects, can lead to the progression or reversal of LF [33, 34]. During active hepatitis, M2 macrophages can also induce fibrosis by promoting fibrinolysis after the inflammation resolves, with the anti-inflammatory effect becoming predominant [35]. Therefore, mice with LF may remain in the stage of inflammation progression, during which time the dominant factors for reversal of LF have not yet emerged.
The KEGG analysis of annotated genes in HSCs and hepatocytes revealed involvement of the ferroptosis, Apelin, and SCD1-related signaling pathways in LF. Abnormal iron metabolism leads to the accumulation of reactive oxygen species (ROS), ultimately inducing unprogrammed cell apoptosis. Lipid peroxide (LPO) plays an important role in hepatitis C virus (HCV) replication, inducing high levels of ferritin that lead to excessive iron deposition, a direct manifestation of ferroptosis [36]. Gpx4 regulates ferroptosis by converting toxic LPO into non-toxic lipoalcohols [37]. Inhibition of HSC ferroptosis improves LF in a ccl4-induced mouse model of LF, highlighting the close relationship between ferroptosis and LF [38]. The research have suggested that Apelin promotes cell proliferation of the HSC line LX2 through activation of ERK signaling during the induction of LF [39]. Moreover, MAPK can regulate Apelin signaling to attenuate LF injury in BDL mice [40]. AMPK-SCD1 inhibits ferroptosis during liver cancer, and the down-regulation of SCD1 expression significantly increases ferroptosis [41]. Hence, it is evident that various factors such as ferroptosis, oxidative stress, Apelin signaling, and SCD1-related signaling are interconnected within the liver, providing novel insights into the pathogenesis of LF.
In this study, we identified some specific genes related to liver fibrosis, such
as Colec10 and Nrxn1, which might serve as non-invasive serum or imaging-based
biomarkers for the early detection of fibrosis. At the same time, single-cell RNA
sequencing of patient liver biopsy samples can further identify subtype-specific
characteristics to stratify the severity of the disease. Furthermore, in future
research, we will continue to conduct in-depth analysis of the results from
single-cell sequencing, mainly focusing on the communication analysis between
immune cells and hepatic stellate cells. We will also validate the observed
interactions between immune cells and hepatic stellate cells through in
vitro co-culture experiments. For instance, sorting macrophages or bone
marrow-derived suppressive cells from mice with bile duct ligation and
co-culturing them with primary hepatic stellate cells will enable direct
assessment of paracrine signals (such as the secretion of transforming growth
factor-
Targeted therapies for LF should address the underlying causes, as well as inhibiting the deposition of ECM. However, current treatments are still unable to reduce the high mortality rates associated with liver disease. scRNA-seq can identify individual cells, accurately analyze the cell composition of a sample, and reveal the gene expression patterns of individual cells during LF. This method can also categorize cells and help to identify new cell types. The present study has revealed changes in BDL-induced fibrotic cells in the liver, cell type-specific gene expression, the immune landscape, and the regulation of signaling pathways including ferroptosis, thus providing novel insight into the pathogenesis of LF (Fig. 9).
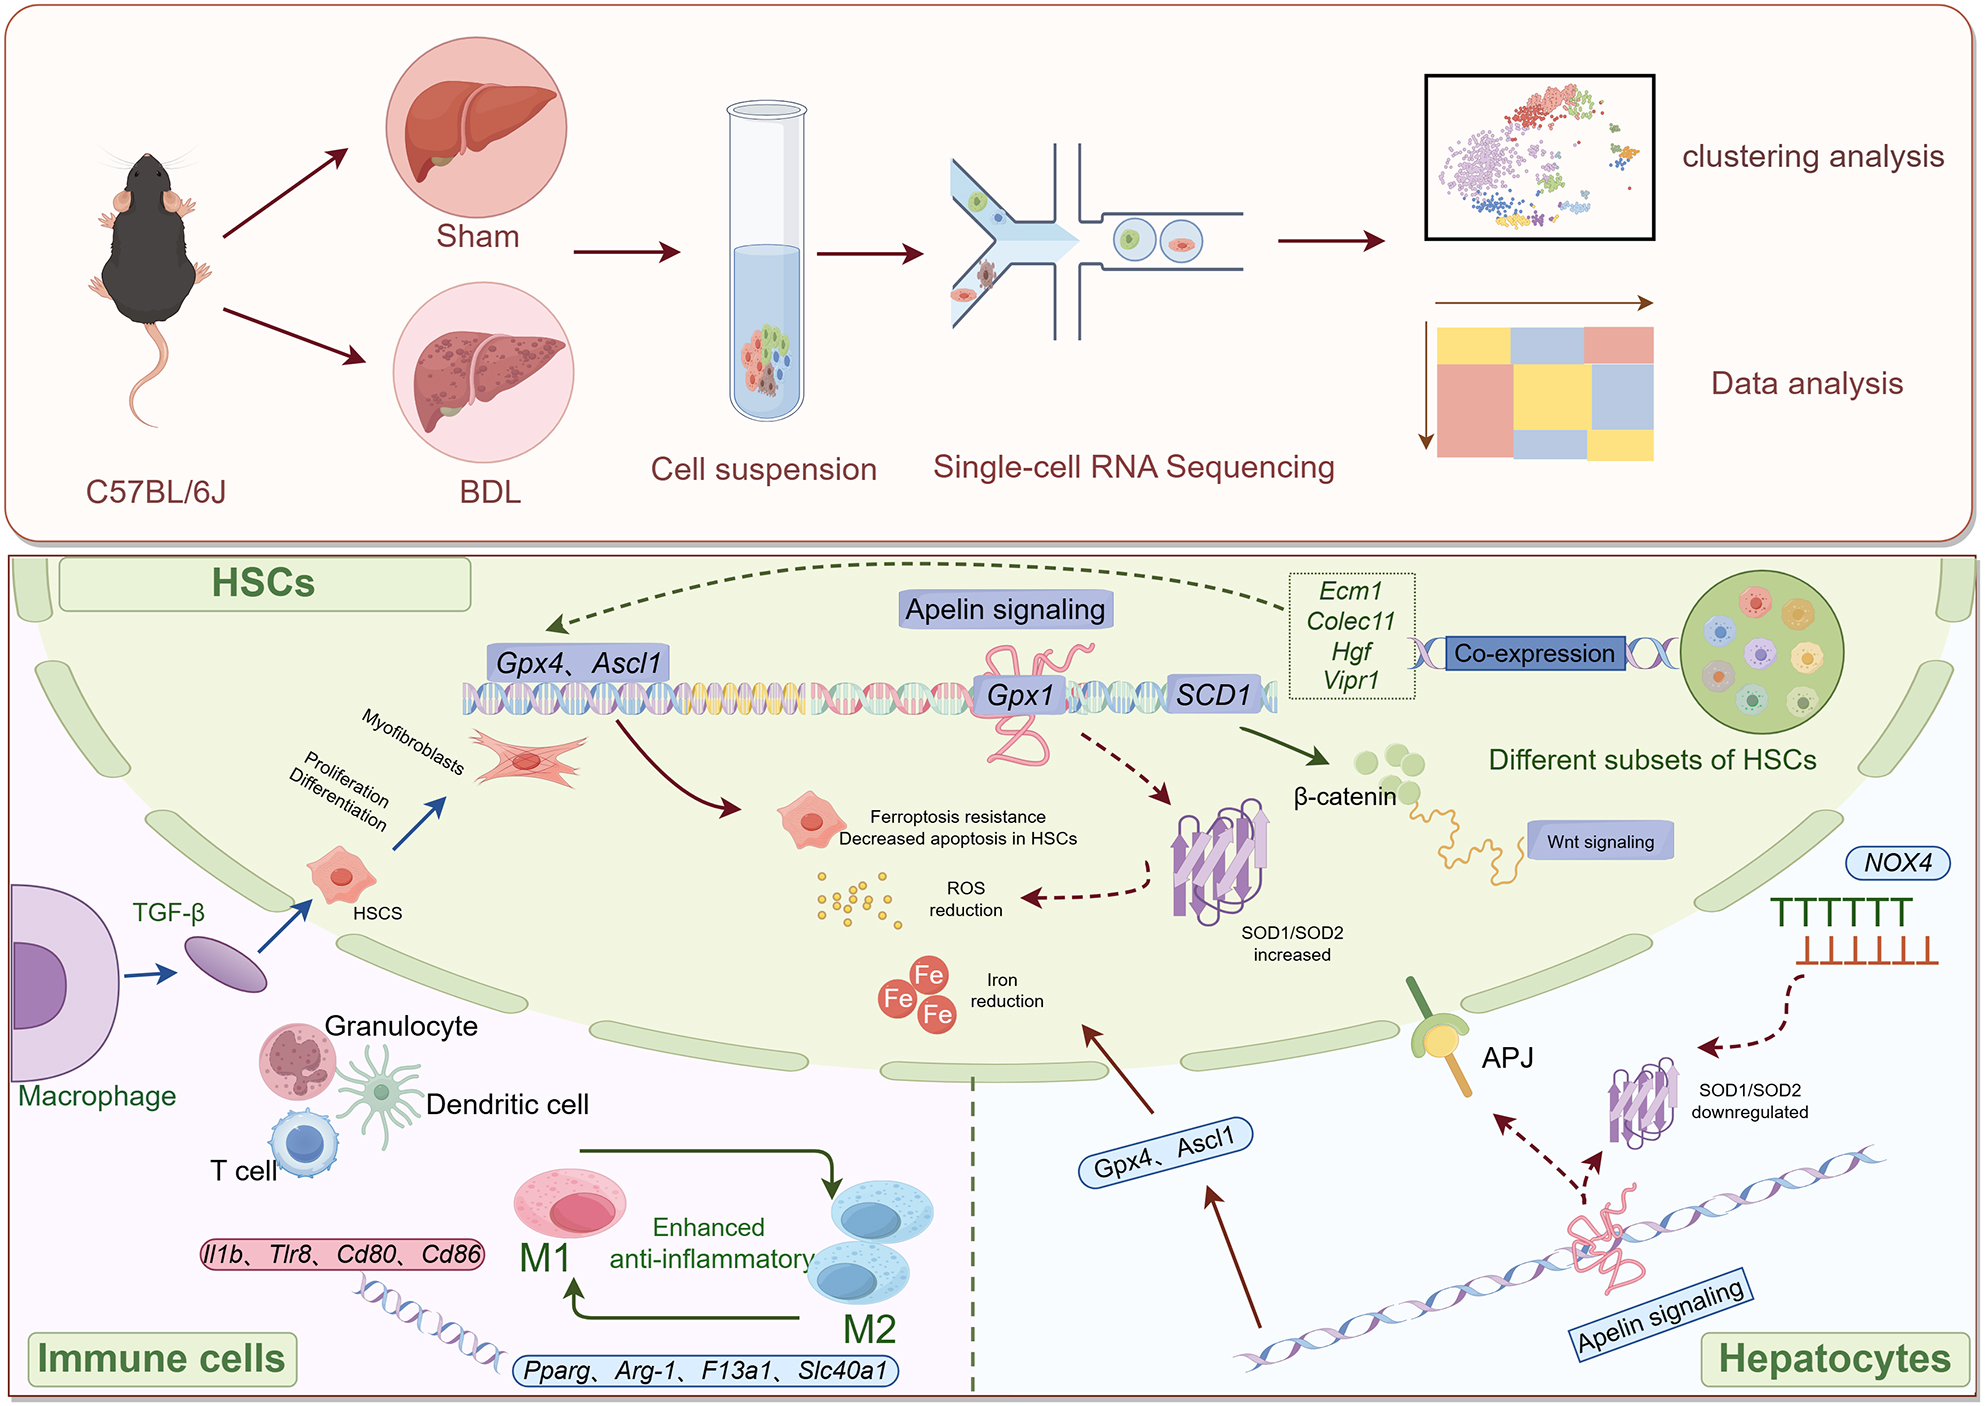 Fig. 9.
Overview of the potential mechanisms involving hepatic stellate cells in liver fibrosis, as revealed by single-cell transcriptome analysis. This figure was drawn by Figdraw and has been authorized by the platform. (The arrow in the upper part of Picture 9 indicates the entire process of the experimental study. The arrows in the figure below indicate the molecular mechanisms involved in this study).
The data of the present study are available from the first or corresponding author upon reasonable request and with prior permission.
XW (Data collection; Investigation; Experimental procedures; Methodology; Writing: original draft); YW (Data collection; Writing: original draft); MY (Experimental procedures); TZ (Data collection; Investigation; Writing); ZF (Data curation; Writing — review & editing); XL (Data collection; Investigation; Writing — review); YY (Formal analysis; Investigation); ZL (Conceptualization; Supervision; Writing — review); GZ (Conceptualization; Writing — review & editing); YZ (Conceptualization; Writing — review & editing); JX (Conceptualization; Funding acquisition; Supervision; Writing — review & editing). All authors contributed to editorial changes in the manuscript. All authors read and approved the final manuscript. All authors have participated sufficiently in the work and agreed to be accountable for all aspects of the work.
All animal experiments were approved by the Medical Ethics Committee of Shanxi Institute of Traditional Chinese Medicine (2025KY-08009). The experiments were performed in accordance with the National Standards for the Welfare and Ethics of Laboratory Animals of the People’s Republic of China and the international 3R principles.
Not applicable.
This work was supported by Traditional Chinese Medicine Administration of Shanxi Province (2023ZYYDA2001), Health Commission of Shanxi Province (2021081), Youth Project of Science and Technology Department of Shanxi Province (202303021222369) and Shanxi Academy of Traditional Chinese Medicine (202404).
Given Guoping Zheng as the Editorial Board member, Guoping Zheng had no involvement in the peer-review of this article and has no access to information regarding its peer review. Full responsibility for the editorial process for this article was delegated to Vesna Jacevic. The authors declare no conflict of interest.
Supplementary material associated with this article can be found, in the online version, at https://doi.org/10.31083/FBL42394.
References
Publisher’s Note: IMR Press stays neutral with regard to jurisdictional claims in published maps and institutional affiliations.