


 , Chunhui Wang 2,†, Ke Jin 1, Yan Dai 1, Yaqin Zhang 1, Tingting Zhou 2, Zhan Yang 2, Tao Yang 1,3, Yuan Liu 1, Nannan Hu 1, Yinghua Mao 2, Chuanlong Zhu 1, Ping Shi 1, Xuewei Sun 2, Jin Zhu 2,*
 , Jun Li 1,*
1 Department of Infectious Diseases, The First Affiliated Hospital with Nanjing Medical University, Jiangsu Province Hospital, 210029 Nanjing, Jiangsu, China
2 Epidemiological Department, Huadong Medical Institute of Biotechniques, 210002 Nanjing, Jiangsu, China
3 Department of Respiratory and Critical Care Medicine, The Zhenjiang Clinical Medical College of Nanjing Medical University, The Affiliated People’s Hospital of Jiangsu University, 212002 Zhenjiang, Jiangsu, China
†These authors contributed equally.
Abstract
Severe fever with thrombocytopenia syndrome (SFTS), caused by Dabie bandavirus (DBV) infection, is characterized by early cytokine storm as a primary pathological feature, although the precise mechanisms remain unclear. Low-density neutrophils (LDNs) are elevated in the peripheral blood of patients with autoimmune or infectious diseases and are closely associated with inflammatory damage and disease severity. However, the pathogenic contribution of LDNs to the progression of SFTS is largely unexplored. This study employed single-cell RNA sequencing (scRNA-seq) to profile the transcriptomic characteristics of LDNs during the acute phase of SFTS, aiming to reveal their compositional and functional heterogeneity following DBV infection, explore their role in the cytokine storm, and further understand their impact on disease progression.
Cells were isolated from 13 acute-phase SFTS patients with varying disease severity and 3 healthy controls using density gradient centrifugation, followed by preparation of single-cell suspensions for 3′-end scRNA-seq. Sequencing data were processed using the Seurat pipeline, including dimensionality reduction, clustering, cell-type annotation, and visualization with Uniform Manifold Approximation and Projection (UMAP). Low-density granulocytes (LDGs) and their subclusters were identified using canonical gene markers. Functional enrichment of differentially expressed genes (DEGs) was analyzed by high-dimensional Weighted Gene Co-expression Network Analysis (hdWGCNA), Gene Ontology (GO), AddModuleScore, single-sample Gene Set Enrichment Analysis (ssGSEA), and immune-related Gene Set Enrichment Analysis (irGSEA), while cellular interactions were explored using CellCall.
1. Compositional heterogeneity: The proportion of LDNs in peripheral blood increased in SFTS patients with greater disease severity during the acute phase. 2. Functional heterogeneity: (1) LDN subclusters showed functional diversity but consistently displayed pro-inflammatory or anti-infective properties. (2) With intensification of the systemic inflammatory response, the expression of multiple cytokine genes (e.g., IL6, IL8, TNFA) and gene sets of the inflammatory pathway (e.g., TNFA-SIGNALING-VIA-NFKB, INFLAMMATORY-RESPONSE) were significantly upregulated in LDNs. Concurrently, the expression of gene sets of type I interferon response pathway (e.g., INTERFERON-ALPHA-RESPONSE, INTERFERON-GAMMA-RESPONSE) and genes of interferon-induced antiviral proteins (e.g., EIF2AK2, OAS1, MX1) were also elevated. (3) In severe cases, glucocorticoid therapy downregulated expression of these inflammatory genes, demonstrating anti-inflammatory effects but potentially increasing infection risk.
This study revealed an increased proportion and heightened pro-inflammatory activity of LDNs during the acute phase of SFTS, closely correlating with disease severity. These findings suggest that LDNs may serve as potential early-warning biomarkers for predicting severe progression in patients with SFTS.
Keywords
- severe fever with thrombocytopenia syndrome (SFTS)
- neutrophils
- low-density neutrophils (LDNs)
- single-cell gene expression analysis
- single-cell RNA sequencing (scRNA-seq)
- cytokine release syndrome
- cytokine storm
Severe fever with thrombocytopenia syndrome (SFTS), an acute zoonotic disease caused by Dabie bandavirus (DBV) infection, is characterized by an early-onset cytokine storm during the acute phase (peak symptomatic period) [1, 2, 3]. This hyperinflammatory response drives disease progression, leading to severe clinical manifestations and a case fatality rate (CFR) reaching 44.7% in severe cases reported in China [4, 5]. Current evidence indicates that cytokine storm represents the primary pathophysiological mechanism underlying SFTS [3, 6, 7, 8]. However, the exact mechanisms governing this excessive inflammatory cascade remain incompletely understood.
Low-density neutrophils (LDNs) are identified within the low-density fraction, together with peripheral blood mononuclear cells (PBMCs), after separation from high-density granulocytes via Ficoll-Paque density gradient centrifugation [9]. LDNs comprise heterogeneous subpopulations involved in the modulation of inflammatory and immune responses. While LDNs are rarely detected in the peripheral blood of healthy individuals [10, 11], emerging evidence associates their presence with disease progression and prognosis in various infectious conditions, such as COVID-19 [11], HIV infection [12], and Plasmodium vivax malaria [13].
Given that the pathogenic contribution of LDNs to SFTS progression remains unclear, this study employed single-cell RNA sequencing (scRNA-seq) to characterize their transcriptomic profiles during acute DBV infection. Our study aimed to define the heterogeneity of LDNs induced by DBV infection and elucidate its association with cytokine storm pathogenesis and clinical deterioration.
The experimental protocol for peripheral blood collection and clinical data acquisition has been approved by the Ethics Committee of the First Affiliated Hospital with Nanjing Medical University of waiver of informed consent (Ethics Approval No. 2022-SR-366). Peripheral blood samples were obtained from 13 SFTS patients admitted to the Department of Infectious Diseases at the First Affiliated Hospital with Nanjing Medical University from July 1, 2022, to October 31, 2022. All patients were definitively diagnosed by RT-qPCR using the Bunyavirus Nucleic Acid Test Kit for SFTS (2022005, DAAN GENE Co., Ltd., Guangzhou, Guangdong, China). Based on expert consensus criteria previously established by our team, five patients presenting only fever, fatigue, and gastrointestinal symptoms without involvement of other organ systems (e.g., neurological symptoms or internal bleeding) were classified as the ordinary (OR) group (2 males and 3 females, mean age 66.2
Cells, including LDGs, were isolated using Ficoll-Paque Plus (17-1440-02, GE Healthcare, Chicago, IL, USA) density gradient centrifugation, washed with Ca/Mg-free phosphate-buffered saline (PBS) (SH30256.01, HyClone, Logan, UT, USA), and then treated with 2 mL GEXSCOPE® lysis buffer (Singleron Biotechnologies, Nanjing, Jiangsu, China) at 25 °C for 10 min to remove red blood cells. After centrifugation (500
Single-cell suspensions (2
Raw sequencing reads in FASTQ format were processed with Cell Ranger (v7.2, 10x Genomics, Pleasanton, CA, USA) to generate gene expression matrices. The scRNA-seq data processing and analysis were then entirely performed using R (v4.5.0, R Foundation for Statistical Computing, Vienna, Austria). Low-quality reads were removed using Cutadapt (v1.17, Marcel Martin, Germany) [15]. Cell barcodes and unique molecular identifiers (UMIs) were extracted, and reads were aligned to the GRCh38 human reference genome (Ensembl v92, European Molecular Biology Laboratory’s European Bioinformatics Institute, Hinxton, Cambridgeshire, UK) using STAR (v2.6.1, Alexander Dobin, Cold Spring Harbor Laboratory, NY, USA) [16]. Gene and UMI counts were quantified using featureCounts (v2.0.1, Wei Shi, The University of Melbourne, Parkville, Victoria, Australia) [17].
Ambient RNA contamination was identified using FeaturePlot in Seurat (v3.1.2, Satija Lab, New York Genome Center, NY, USA) [18] and subsequently removed with the decontX algorithm in the celda package (v1.3.8, Campbell Lab, Cedars-Sinai Medical Center, Los Angeles, CA, USA) [19].
Cells were further filtered to exclude those with fewer than 200 genes detected, those in the top 2% for gene/UMI counts, or those containing greater than 20% mitochondrial gene content.
Subsequently, low-density neutrophils (LDNs) and basophils were identified in scRNA-seq analysis. 214,726 cells (including 54,342 granulocytes) and 33,406 genes were included in downstream analysis. Data normalization, scaling, and selection of the top 2000 highly variable genes were performed using Seurat (v3.1.2, Satija Lab, New York Genome Center, NY, USA). Principal component analysis (top 20 PCs) and clustering (FindClusters) were conducted with batch-effect correction using Harmony (v0.1, Soumya Raychaudhuri, Harvard University, Boston, MA, USA) [20]. UMAP (v0.5.3, Leland McInnes, Canada) was employed for data visualization. Cell types were annotated using canonical markers in the SynEcoSys database (Singleron Biotechnologies, Nanjing, Jiangsu, China), and marker gene expression was visualized using DotPlot and VlnPlot in Seurat (v3.1.2, Satija Lab, New York Genome Center, NY, USA).
Differentially expressed genes (DEGs) were identified using the FindMarkers function in Seurat (Wilcoxon rank-sum test,
hdWGCNA (Vivek Swarup, University of California, Irvine, CA, USA) [21] was applied to the scRNA-seq data. Genes expressed in at least 5% of cells were selected to create the hdWGCNA object, and a metacell matrix was generated (MetacellsByGroups). A scale-free network (soft power = 7) was constructed (ConstructNetwork), identifying seven gene modules (dendrogram). Module connectivity (kME) and hub genes were analyzed (ModuleConnectivity, PlotKMEs). Module distribution and correlations were visualized (ModuleFeaturePlot, DotPlot, Seurat), and hub gene functions were investigated through gene ontology (GO) enrichment and AddModuleScore analyses.
GO and KEGG pathway enrichment analyses by clusterProfiler (v3.16.1, Qingyu He, Key Laboratory of Functional Protein Research of Guangdong Higher Education Institutes, Guangzhou, Guangdong, China) [22] identified immune-relevant functions of DEGs (p
Cell-Cell interactions were analyzed with CellCall (Dong Wang, Southern Medical University, Guangzhou, Guangdong, China) [24], based on receptor-ligand pairs and inferred signaling pathways. Ligand-receptor interactions were evaluated using L2 normalization and transcription factor activity. Statistically significant interactions (hypergeometric test, p
The concentrations of IL-1
Data are presented as the mean
We isolated 54,342 high-quality granulocytes with canonical gene-marker expression patterns from peripheral blood samples. And a schematic overview of the experimental design is provided in Fig. 1A. The isolated granulocytes included LDNs (CSF3R+, FCGR3B+, CXCR2+, HLA-DRA–, HLA-DRB1–) and basophils (GATA2+, CLC+, MS4A2+, CXCR4+). Leveraging the high resolution of scRNA-seq, we mapped LDNs into six subclusters (Fig. 1B) based on cell-type-specific gene signatures: neu1 (G0S2++, CXCR4+/-, ITGAX+); neu2 (ITGAX+, G0S2++, TLR1+, ADM+, CMTM2+); neu3 (G0S2++, CXCR4+, ITGAX+, VNN1+, PTGS2+, HIST2H2BE+, CEACAM1+); neu4 (G0S2+++, CXCR4+, ITGAX+, CCL4+, CCL5+++, TNFRSF1B+, TNFAIP3+, GZMB++); neu5 (G0S2+, CXCR2+/-, CXCR4+, ITGAX–, CEACAM1++, CLC+, MKI67+, IL6R+, CLEC5A+); and neu6 (G0S2+++, CXCR4+, ITGAX+, HIST1H2BC+, HIST1H3H+) (Fig. 1C).
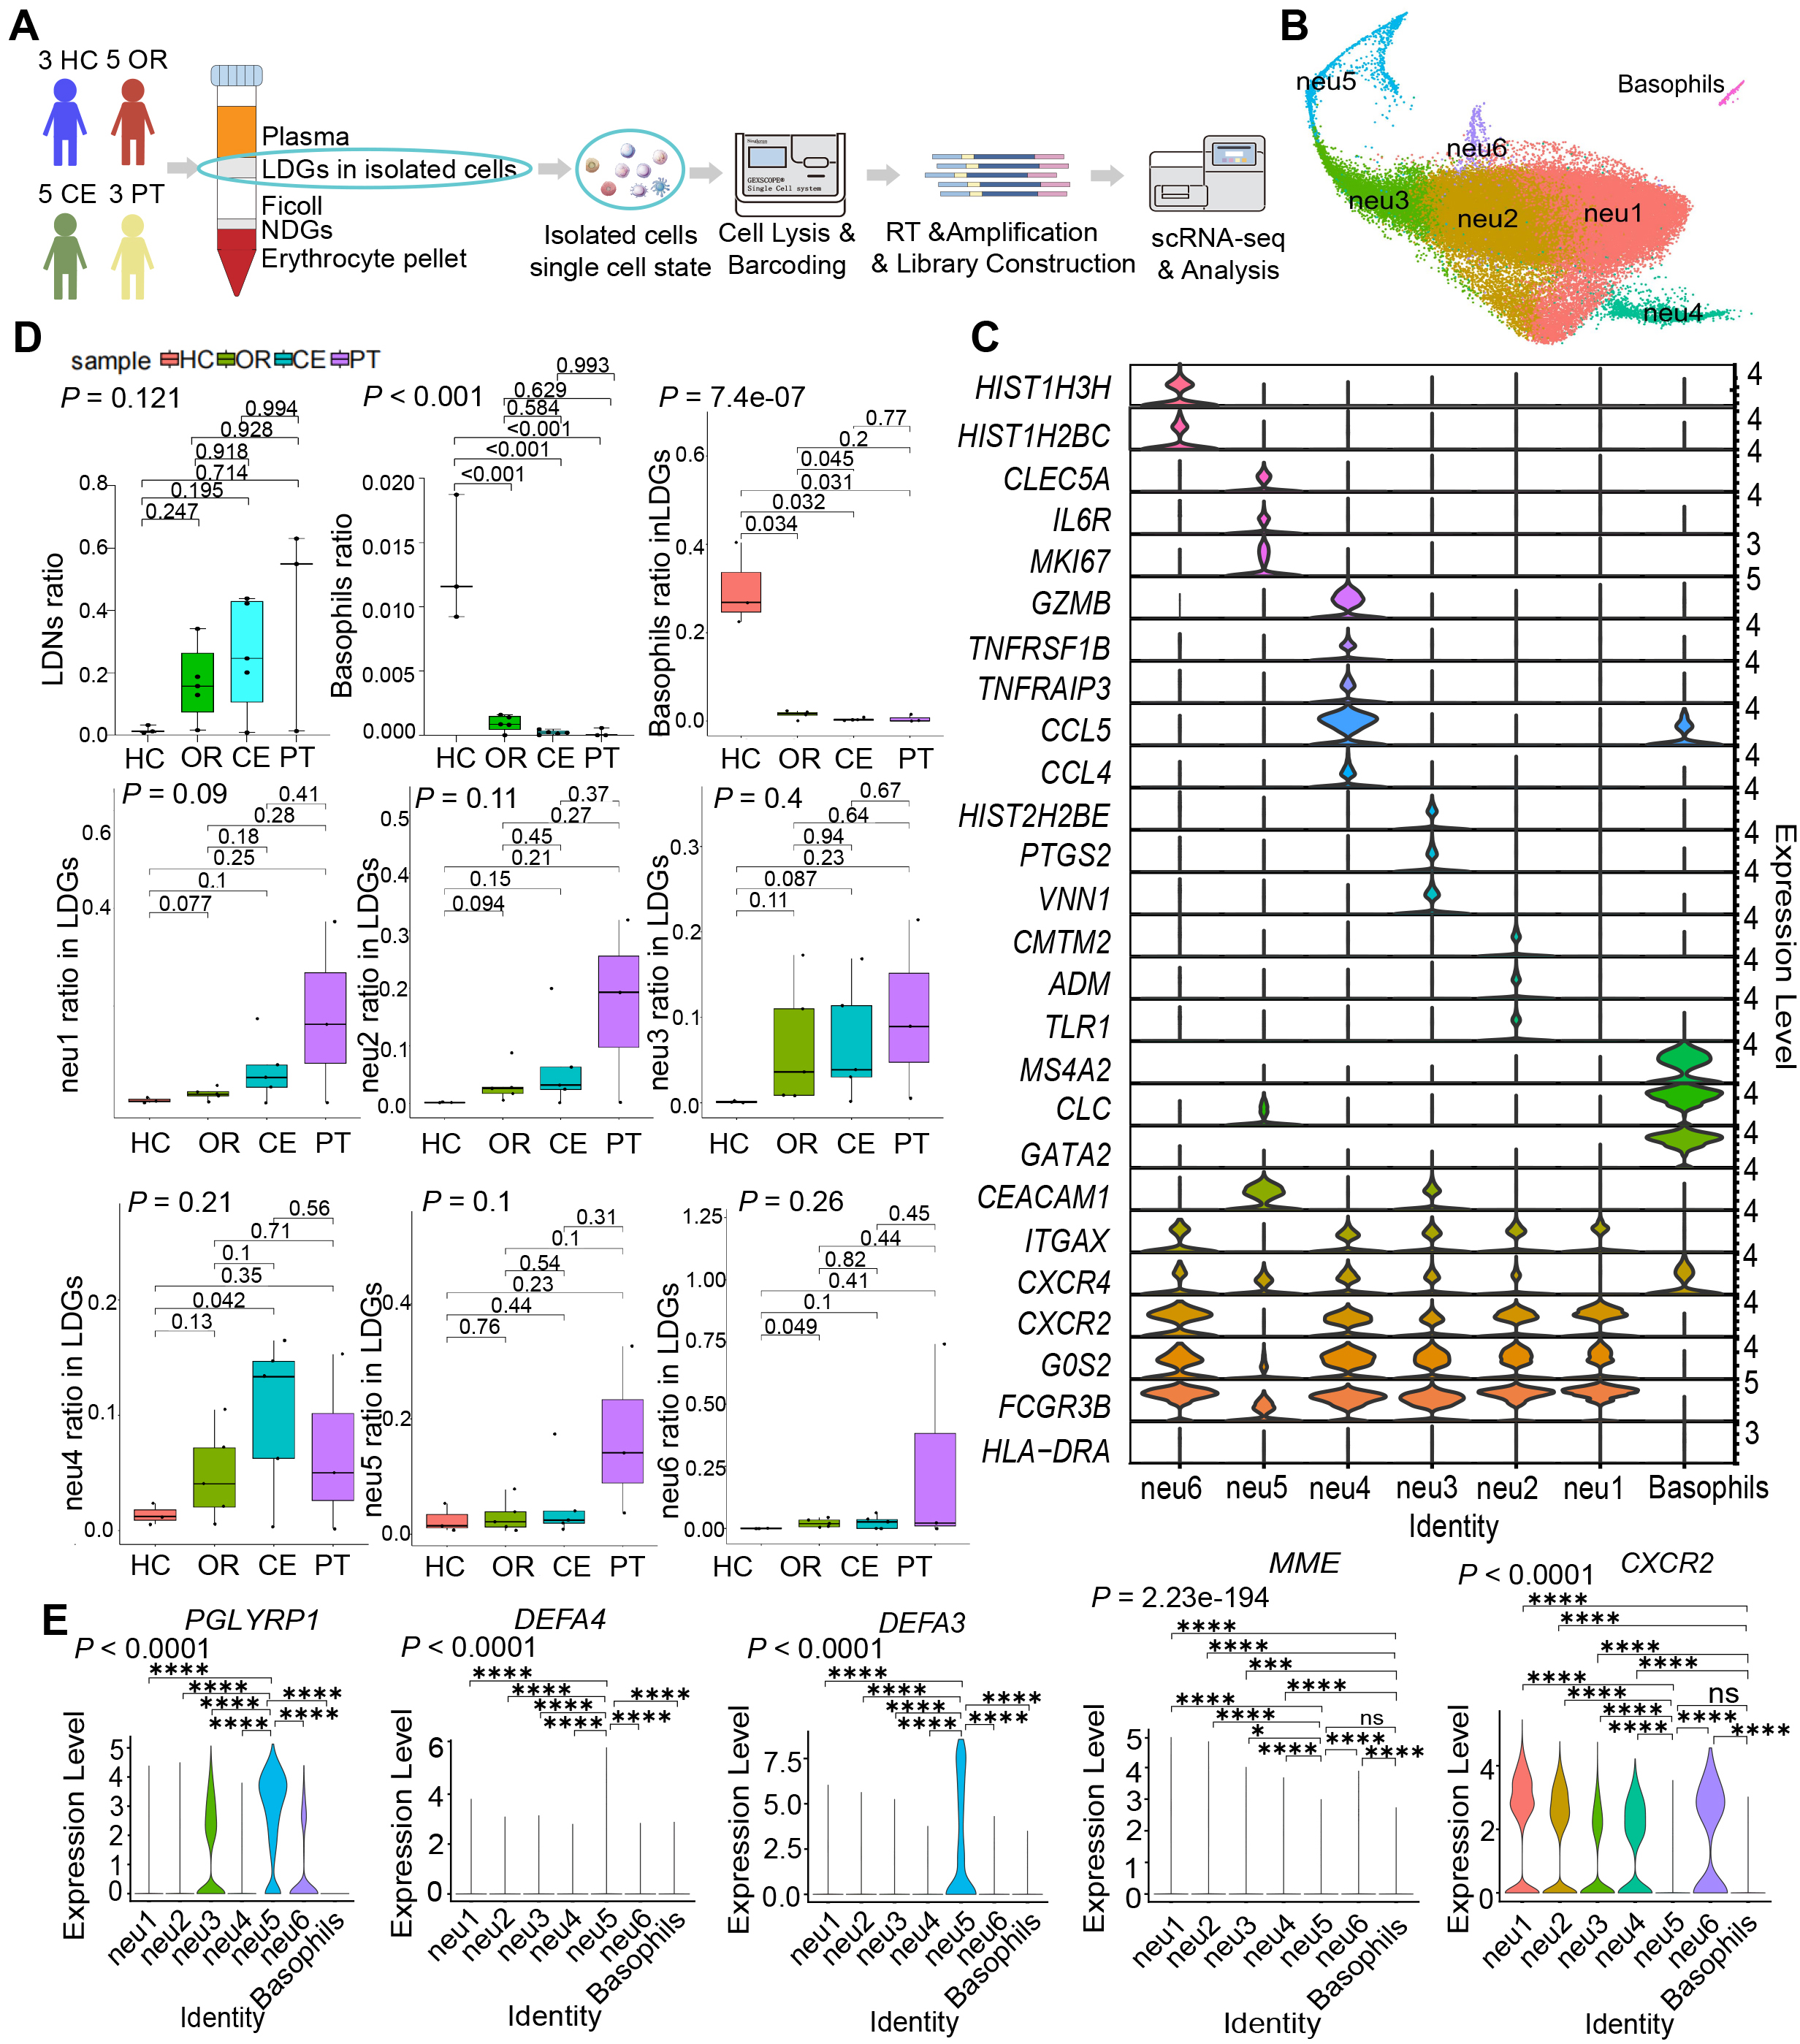 Fig. 1.
 Increased proportion of LDNs revealed by single-cell mapping of LDGs from acute-phase SFTS patients. (A) Schematic workflow of the experimental strategy. The figure was created by Adobe Illustrator 2023. (B) UMAP visualization displaying six LDN subclusters and one basophil subcluster. (C) Violin plots depicting DEGs characterizing each subcluster. (D) Statistical comparison of proportions of LDNs, basophils among isolated cells, and subcluster proportions among LDGs across 4 clinical groups. (E) Violin plots illustrating expression levels of genes related to granulocyte maturation (CXCR2, MME) and immaturity (PGLYRP1, DEFA3, DEFA4). Data in (D) are presented as median (interquartile range, IQR) and analyzed using one-way analysis of variance (ANOVA) with Bonferroni-corrected Student’s t-tests. Data in (E) were analyzed by the Kruskal–Wallis test followed by Dunn’s post hoc tests. ns, not significant; *: 0.01
Statistical analysis revealed a progressive increase in the proportion of total LDNs in peripheral blood corresponding to increasing disease severity. Specifically, as illustrated in Fig. 1D, a stepwise elevation in overall LDN abundance was observed, with individual LDN subclusters following a similar pattern of proportional increase.
LDN subclusters exhibited heterogeneous maturity levels, indicating potential functional diversity. The expression levels of granulocyte immaturity-related genes (PGLYRP1, DEFA4, and DEFA3) [25], were significantly higher in neu5 compared to other subclusters (Fig. 1E). Conversely, granulocyte maturity-associated genes (CXCR2 [26] and MME [25]) exhibited significantly lower expression in the basophil subcluster relative to other granulocytic subclusters (Fig. 1E). These findings suggest that neu5 and basophils predominantly display an immature phenotype, maintaining proliferative and differentiation potential.
To further elucidate the functional heterogeneity among LDN and basophil subclusters, we performed hdWGCNA [21], grouping granulocyte-expressed genes into functionally discrete co-expression modules. By integrating module expression patterns with GSEA and AddModuleScore analyses, we systematically characterized the functional variations across subclusters.
A total of seven statistically significant co-expressed gene modules (neu-m1 to neu-m7) were identified (Fig. 2A), with the top 10 hub genes from each module presented in Fig. 2B. Correlation analysis revealed that the neu-m1 module had the highest correlation coefficients with all other modules (Fig. 2C). Network analysis further demonstrated that neu-m1 genes exhibited the highest connectivity (Fig. 2D), suggesting that neu-m1 is associated with fundamental or core functions of LDNs. Each LDN subcluster exhibited distinct modular gene expression (Fig. 2E), suggesting unique functional characteristics.
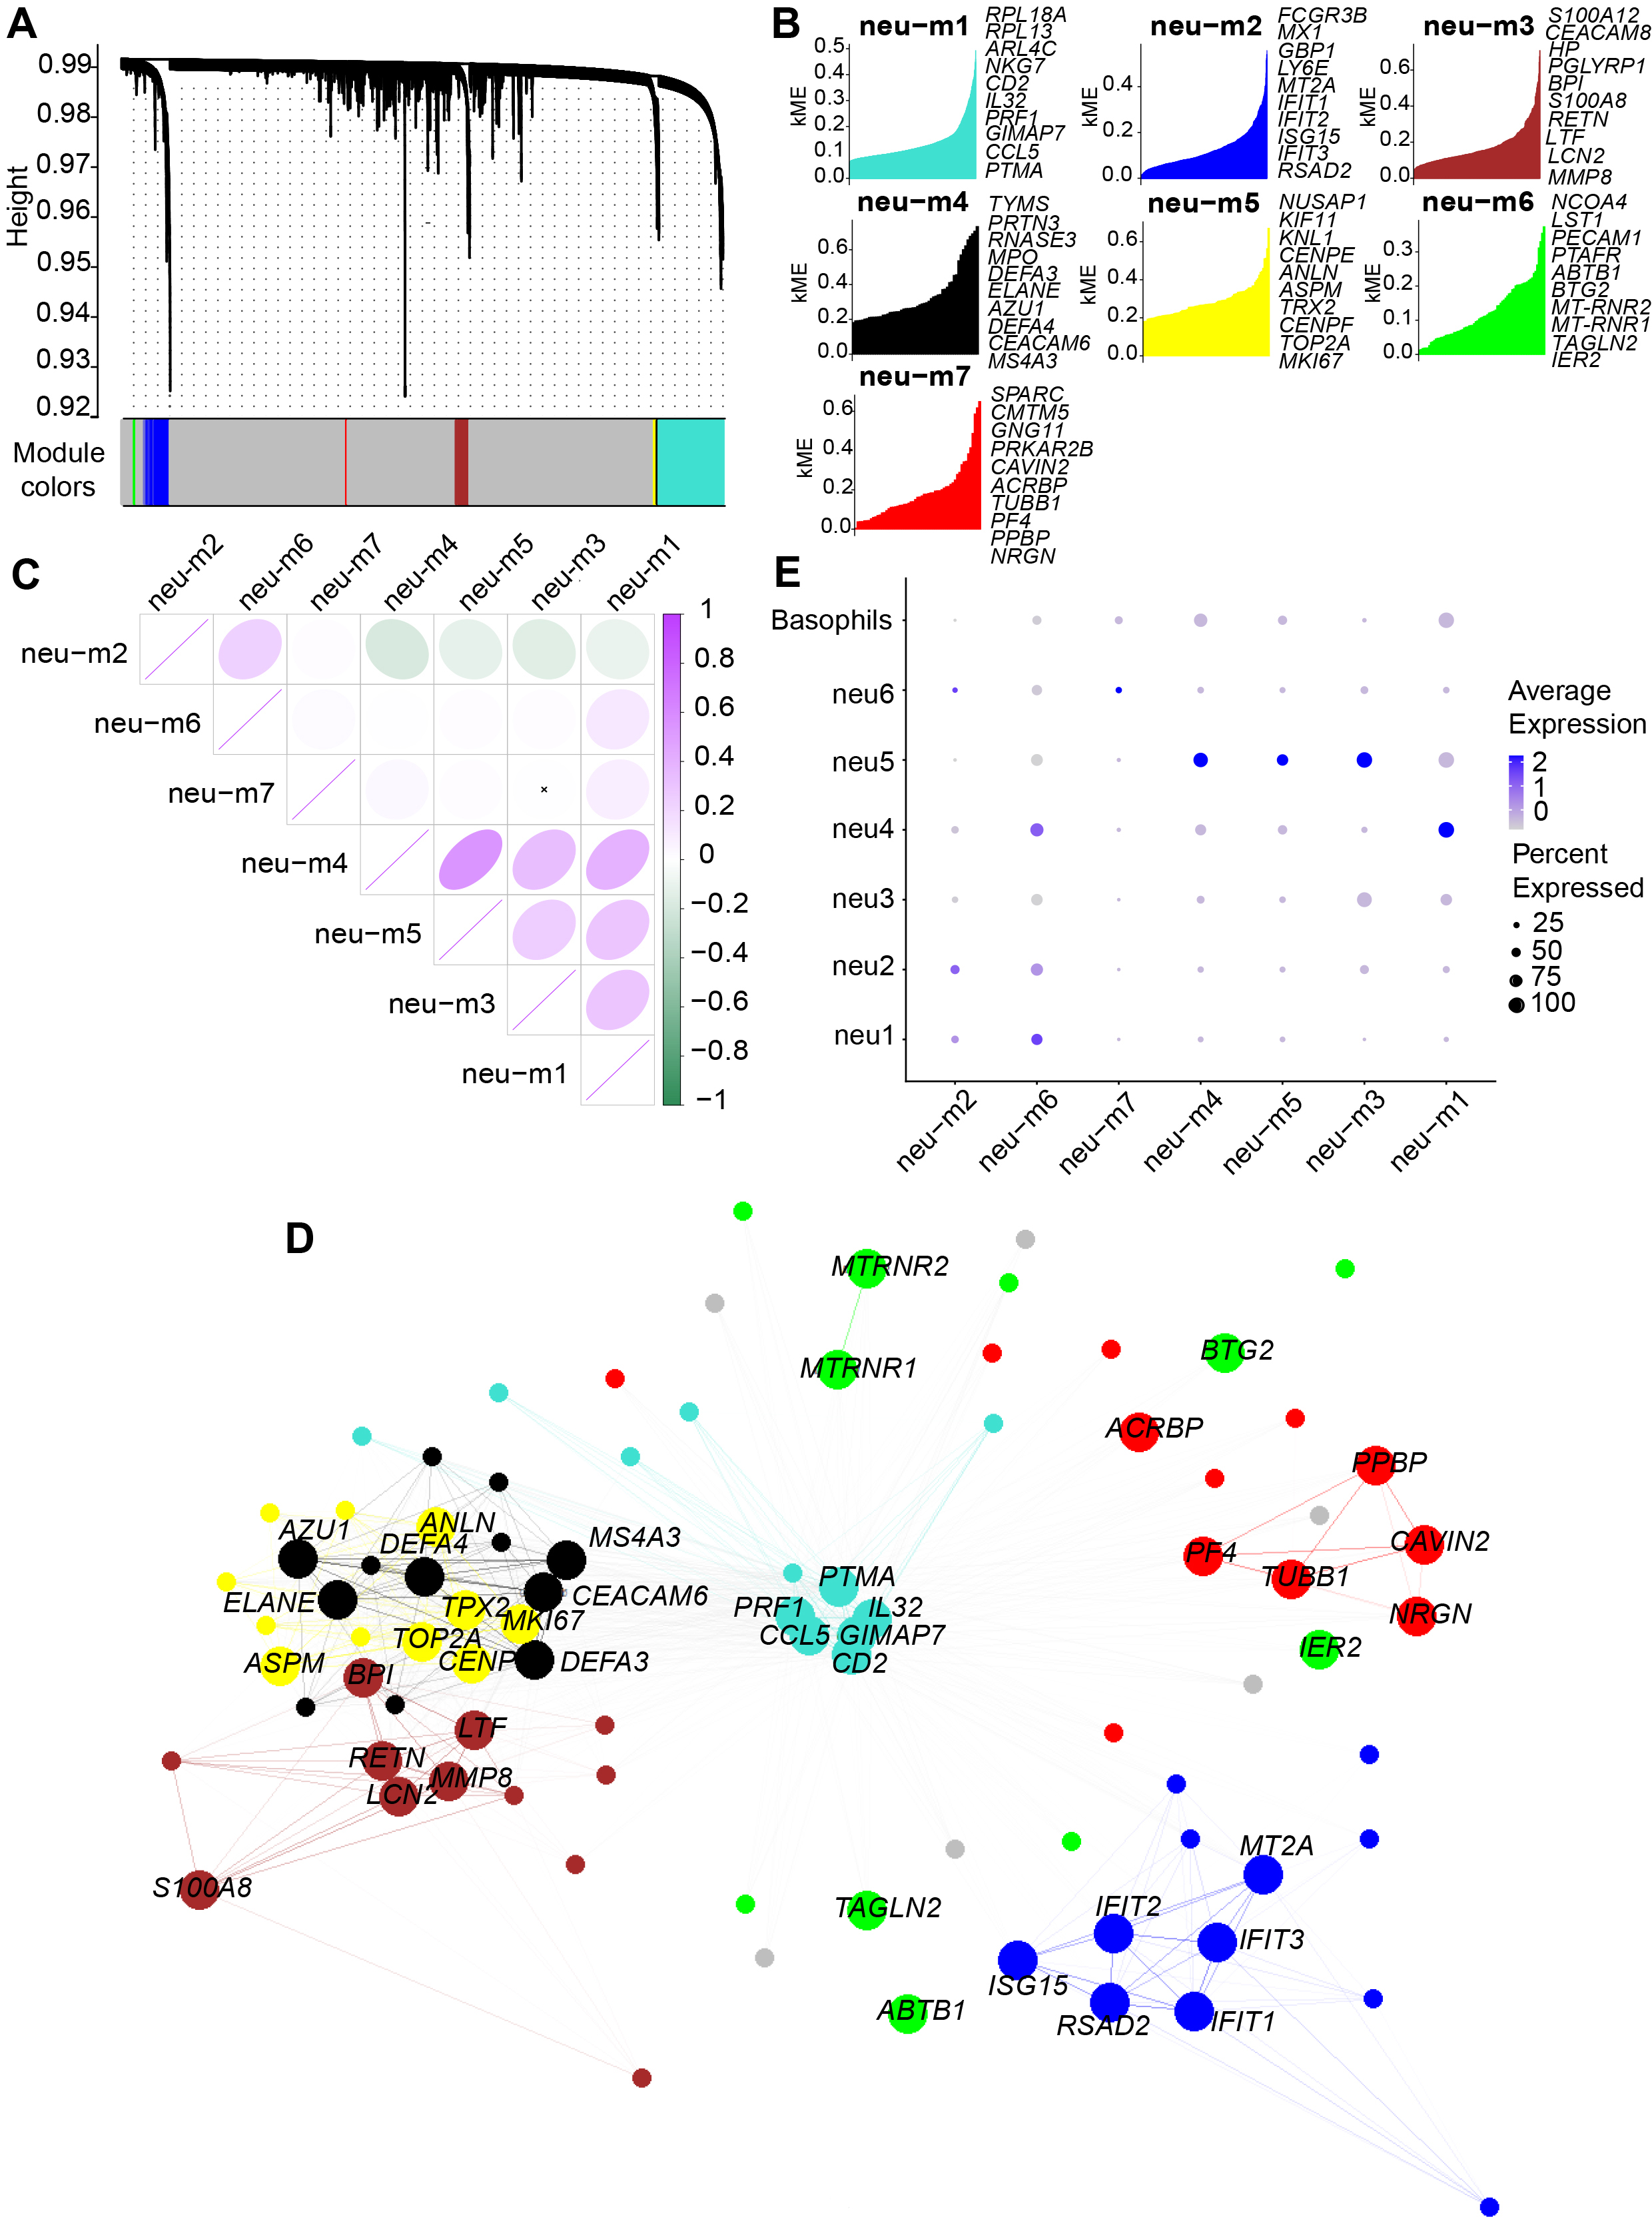 Fig. 2.
 Seven co-expressed gene modules identified by hdWGCNA analysis of LDG subclusters. (A) Dendrogram visualization of seven co-expressed gene modules identified in the scale-free network, represented by distinct colors. (B) Hub genes in each module ranked by kME values. (C) Correlation analysis of gene modules, indicating neu-m1 had strong correlations with all modules. Pearson correlation analysis was used in the figure, where purple/green color intensity (see bar, right) indicates the magnitude of the correlation coefficient for positive/negative correlations, and an “
GO enrichment analysis performed on the top 20 expressed genes in each module revealed that neu-m1 included genes such as RPL13, PRF1, NKG7, and GZMB, primarily involved in cytoplasmic translation and leukocyte-mediated cytotoxicity (e.g., cytolysis), processes fundamental to granulocytic function (Fig. 3A). The neu-m2 contained genes including IFIT1, RSAD2, MX1, and ISG15, predominantly associated with antiviral defense responses (Fig. 3B). The neu-m3 comprised antibacterial and antifungal genes such as S100A8, S100A12, LTF, and BPI (Fig. 3C). The neu-m4 contained genes, DEFA3, ELANE, RANSE3, and AZU1, primarily involved in defense against gram-negative bacteria (Fig. 3D). The neu-m5 showed high expression of proliferation-associated genes, MKI67, TOP2A, ANLN, and KIF11, involved in nuclear division and sister chromatid separation during mitosis (Fig. 3E). High expression of genes (NCO4, SQSTM1, and HBA2) in neu-m6 correlated with autolysosome formation and hemoglobin complex uptake, suggesting phagocytic degradation activity (Fig. 3F). The neu-m7 included genes (PF4, ITGB3, MPIG6B, and ALOX12) associated with coagulation and injury repair (Fig. 3G).
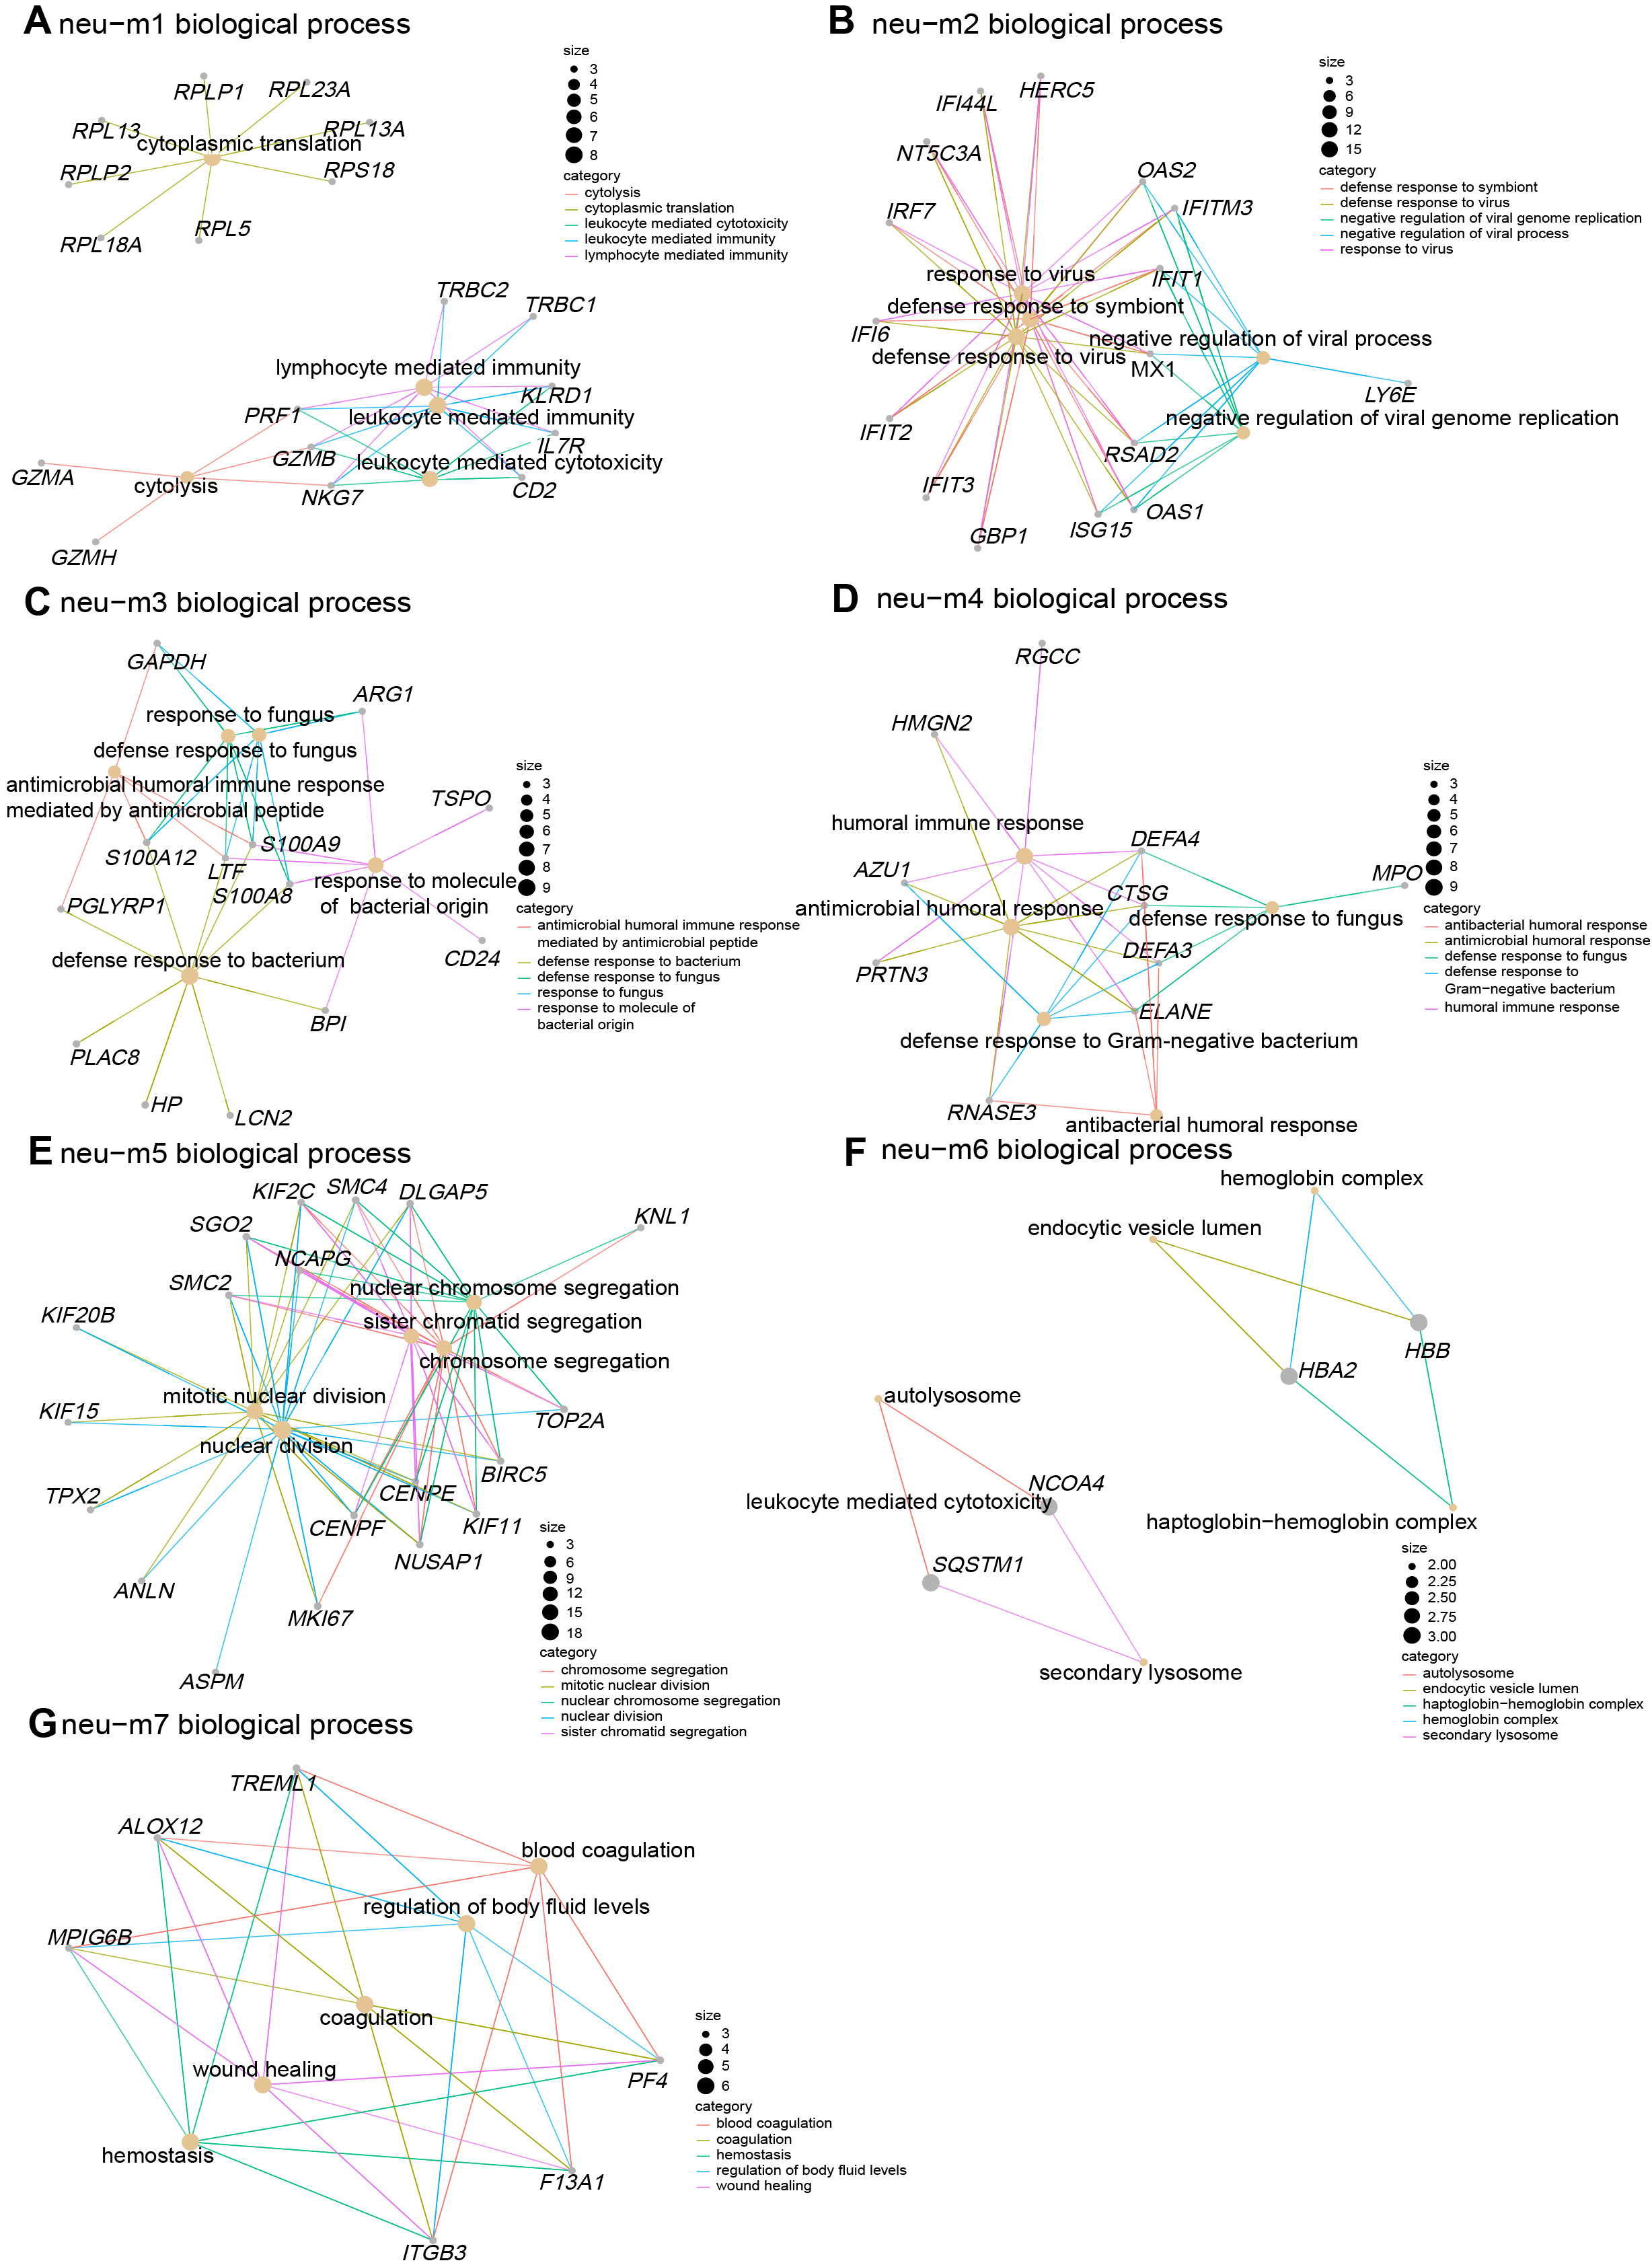 Fig. 3.
 GO enrichment analysis of co-expressed gene modules revealing pro-inflammatory and anti-infective functions of LDN subclusters. (A–G) Gene co-expression networks for the seven identified modules. Gray nodes represent genes, yellow nodes represent biological processes, and colored lines represent gene associations with biological processes. Node size indicates degree value; larger nodes reflect greater connectivity. GO, Gene Ontology.
We further performed AddModuleScore analysis to assess the expression of gene sets associated with key neutrophil physiological functions, including phagocytosis (Fig. 4A), degranulation (Fig. 4B), extracellular trap formation (Fig. 4C), cytotoxicity (Fig. 4D), antiviral innate immune response (Fig. 4E), antibacterial activity (Fig. 4F), and the regulation of coagulation (Fig. 4G,H), across different LDN subclusters and clinical groups. Combined AddModuleScore and GO analyses comprehensively revealed pro-inflammatory and anti-infective properties across LDN subclusters.
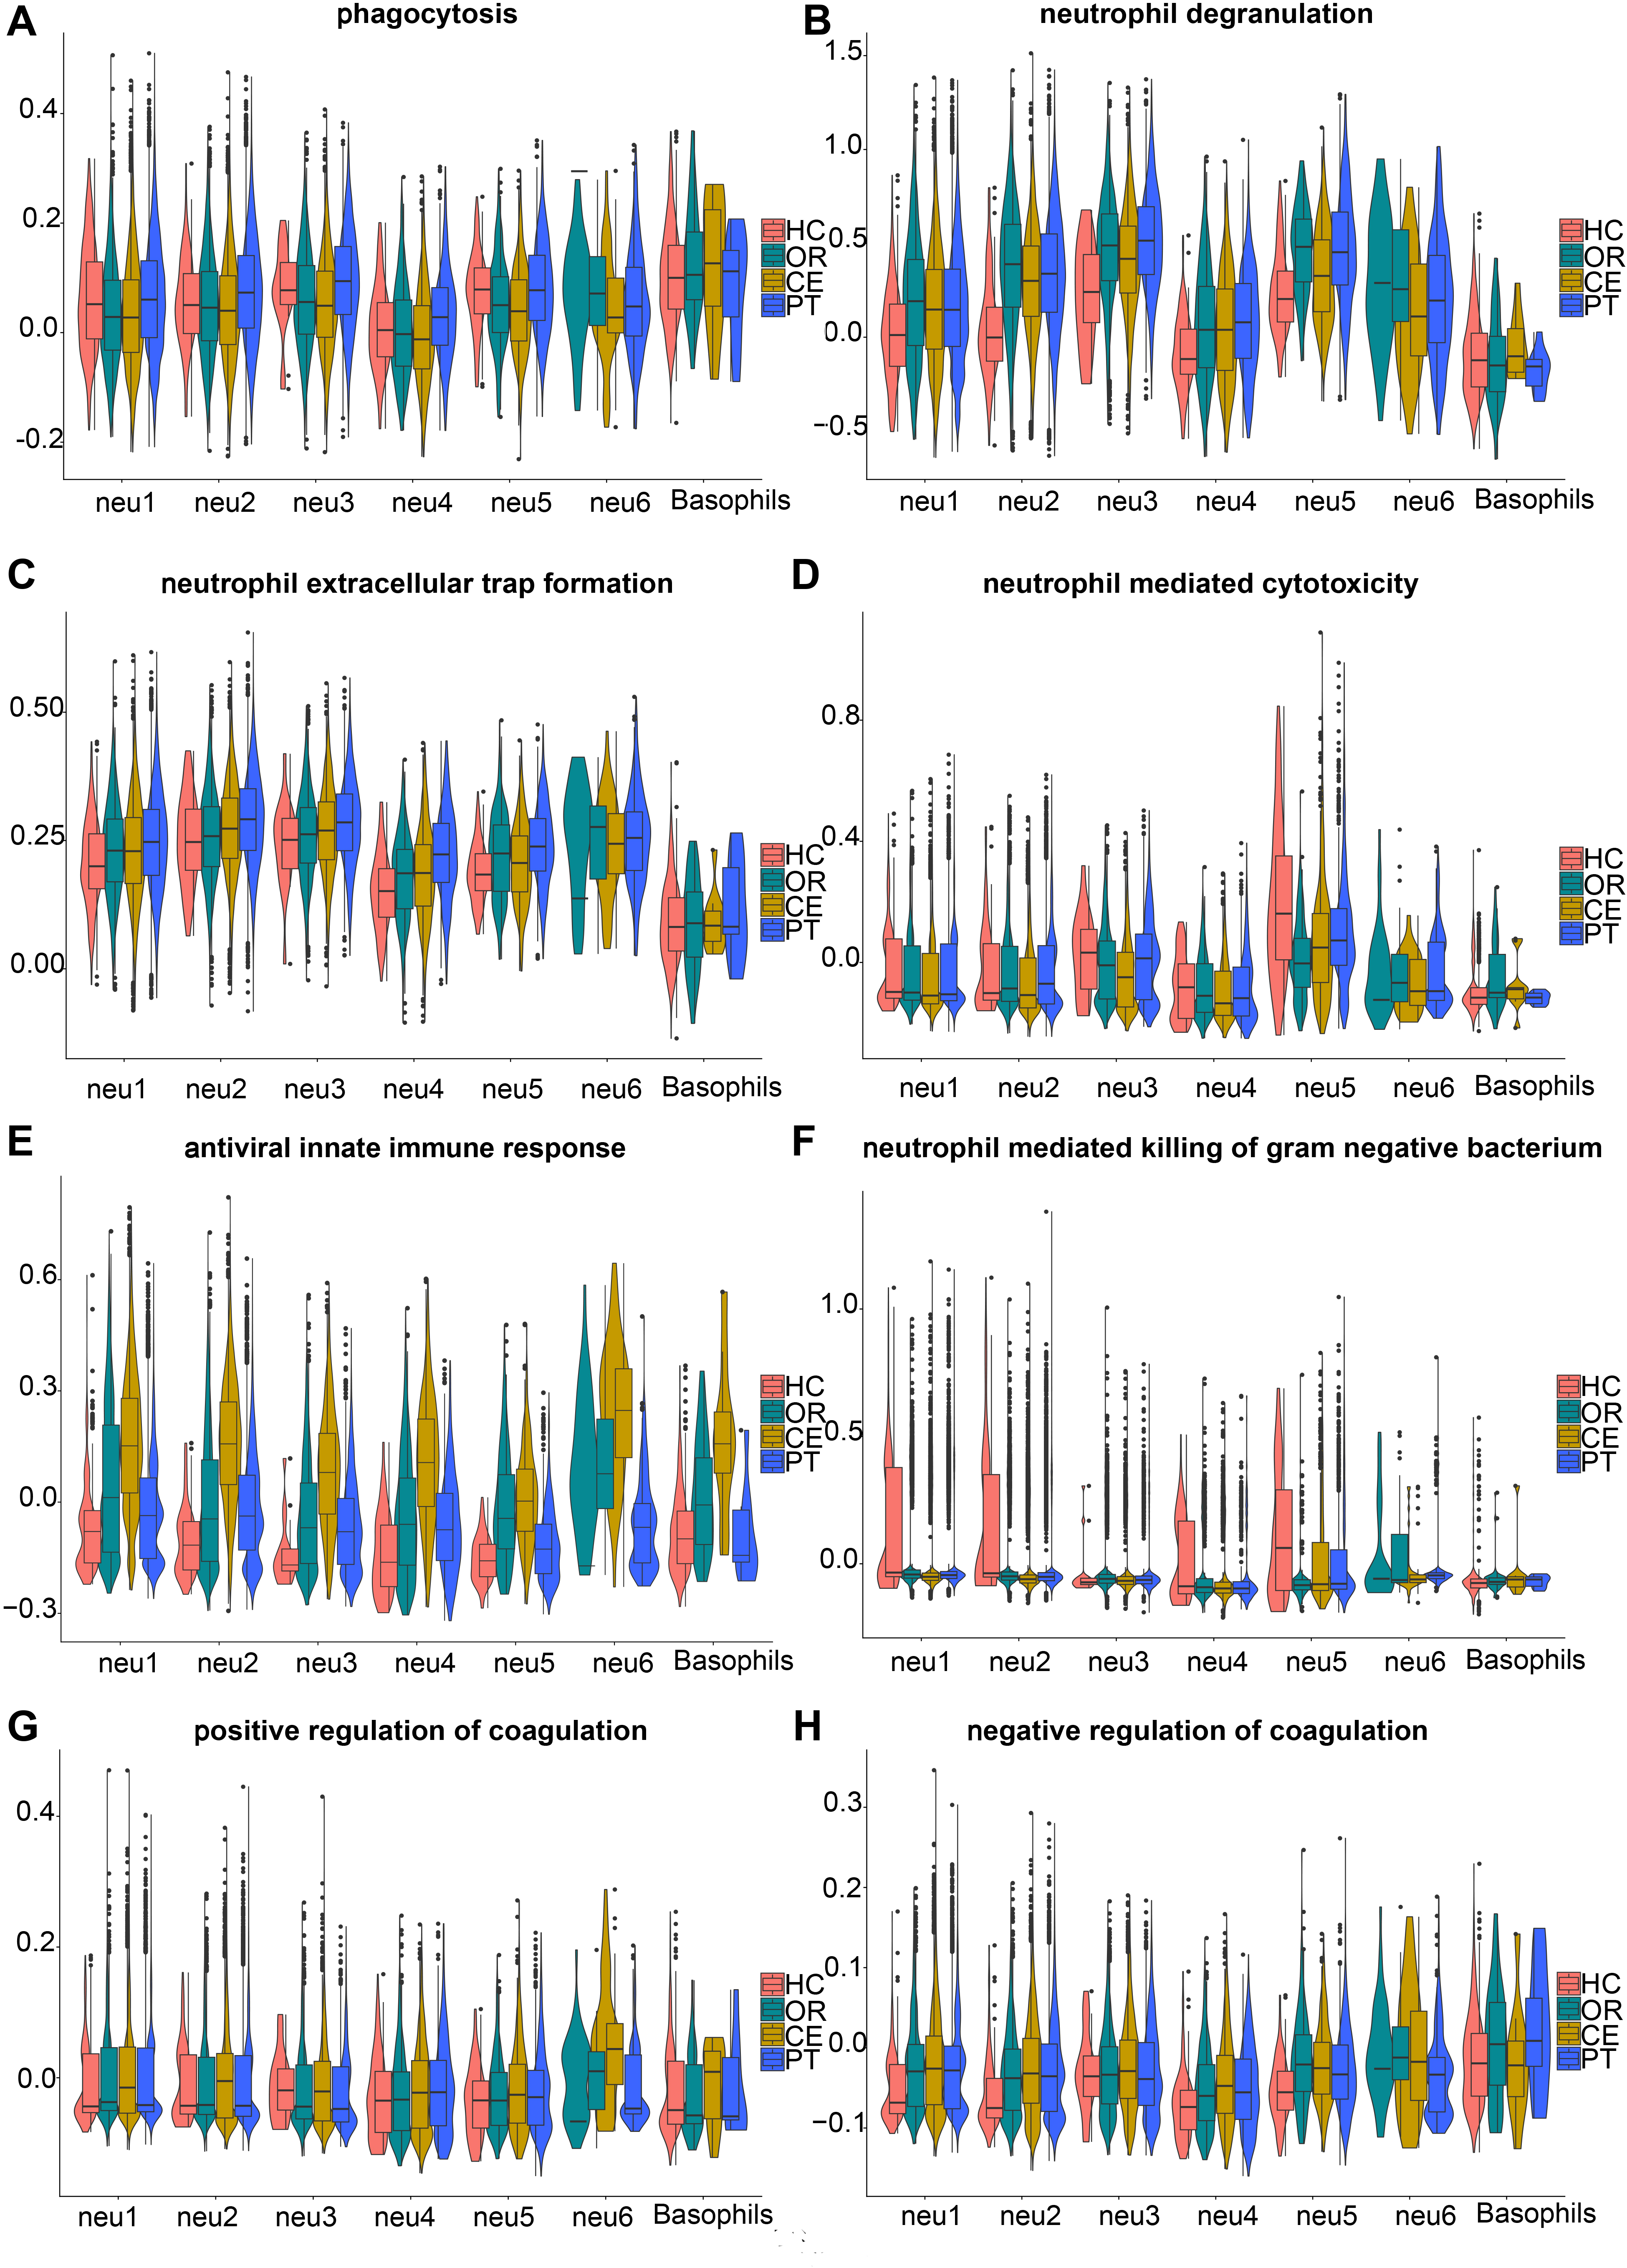 Fig. 4.
 AddModuleScore analysis combined with GSEA and KEGG, revealing functions of LDN subclusters. The gene sets in (A,B) and (D–H) were retrieved from GSEA. (A) Gene set systematic name = “M16307”. (B) Gene set systematic name = “M27620”. (C) The genes in the gene set were from KEGG (https://www.kegg.jp/entry/map04613). (D) Gene set systematic name = “M24430”. (E) Gene set systematic name = “M40535”. (F) Gene set systematic name = “M24432”. (G) Gene set systematic name = “M11143”. (H) Gene set systematic name = “M12042”. HC, healthy control group; OR, ordinary group; CE, severe group without primary glucocorticoid treatment; PT, severe group with primary glucocorticoid treatment; GSEA, Gene Set Enrichment Analysis; KEGG, Kyoto Encyclopedia of Genes and Genomes.
Compared with average expression levels, neu1 and neu2 showed high expression of neu-m2 and neu-m6 (Fig. 2E). The neu1 predominantly expressed neu-m6 (Fig. 2E) and highly expressed chemokine receptor genes (CXCR2 and ITGAX) (Fig. 1C), suggesting a primary role in phagocytic degradation post-DBV infection. The neu2 exhibited high expression of neu-m2 (Fig. 2E) and expressed antiviral innate immune genes (TLR1 and CMTM2) (Fig. 1C), consistent with AddModuleScore results indicating antiviral function (Fig. 4E).
The neu3 strongly expressed neu-m3 (Fig. 2E) and oxidative stress-associated genes involved in oxidative stress, prostaglandin oxidation formation, and histone modifications (VNN1 [27], PTGS2 [28], and HIST2H2BE) (Fig. 1C). Genes associated with NET formation were also highly expressed (Fig. 4C), highlighting neu3’s antimicrobial function related to NETs and oxidative stress.
The neu4 cells exhibited high expression of neu-m1, neu-m6 (Fig. 2E), CCL4, and CCL5 (Fig. 1C). AddModuleScore analysis indicated low expression levels of genes related to phagocytosis, degranulation, and NET formation (Fig. 4A–C). This finding suggests that neu4 cells possess weaker phagocytic and anti-infective functions than those of other subclusters. This may be related to the elevated expression of anti-inflammatory genes TNFAIP3 [29] and TNFRSF1B [30] in neu4 (Fig. 1C).
The subcluster neu5 represented immature LDNs, characterized by high expression of neu-m5 (Fig. 2E) and low expression of G0S2 (Fig. 1C), suggesting strong proliferative capacity. The neu5 cells constitute a group of cycling cells continuously differentiating into other LDG subclusters. The neu-m3 and neu-m4 remained highly expressed in neu5 (Fig. 2E). Consistently, AddModuleScore analysis demonstrated elevated expression of gene sets associated with killing gram-negative bacteria, even under physiological conditions (HC group), in neu5 (Fig. 4F). Additionally, neu5 exhibited the highest expression of genes involved in degranulation and cytotoxic effects (Fig. 4B,D). These results confirm the strong pro-inflammatory and anti-infective activity of neu5.
The neu6 showed high expression levels of neu-m2, neu-m7, and histone genes (Fig. 2E). These features support antiviral activity through NET formation and promotion of coagulation. This finding aligns with increased antiviral innate immunity (Fig. 4E) and positive regulation of coagulation pathways (Fig. 4G,H) observed in AddModuleScore analysis.
The basophils displayed high IgE sensitivity and high expression of MS4A2, GATA2, and CLC genes (Fig. 1C). They had higher expression levels of genes related to phagocytosis than other subclusters (Fig. 4A). However, the expression levels of genes associated with degranulation, cytotoxicity, and antiviral immunity were moderate (Fig. 4B,D,E). This may result from limited activation and maturation before migrating to peripheral tissues.
Collectively, these findings demonstrate that LDN subclusters exhibit pro-inflammatory and anti-infective properties, albeit with functional heterogeneity.
In addition to pro-inflammatory and anti-infective functions, neu5 cells exhibited robust proliferative potential. Gene expression profiling indicated that neu5 and basophil subclusters represent immature granulocytes. This raised a critical question: can other LDN subclusters induce further proliferation and differentiation of neu5 or basophils, thus increasing LDN proportions and modulating their functional properties? To address this, cell-cell interaction analysis was conducted on LDN subclusters using CellCall.
Intriguingly, the interactions were significantly enriched only in the severe group (CE and PT) (Fig. 5A,B), but not in the healthy (HC) or ordinary (OR) groups.
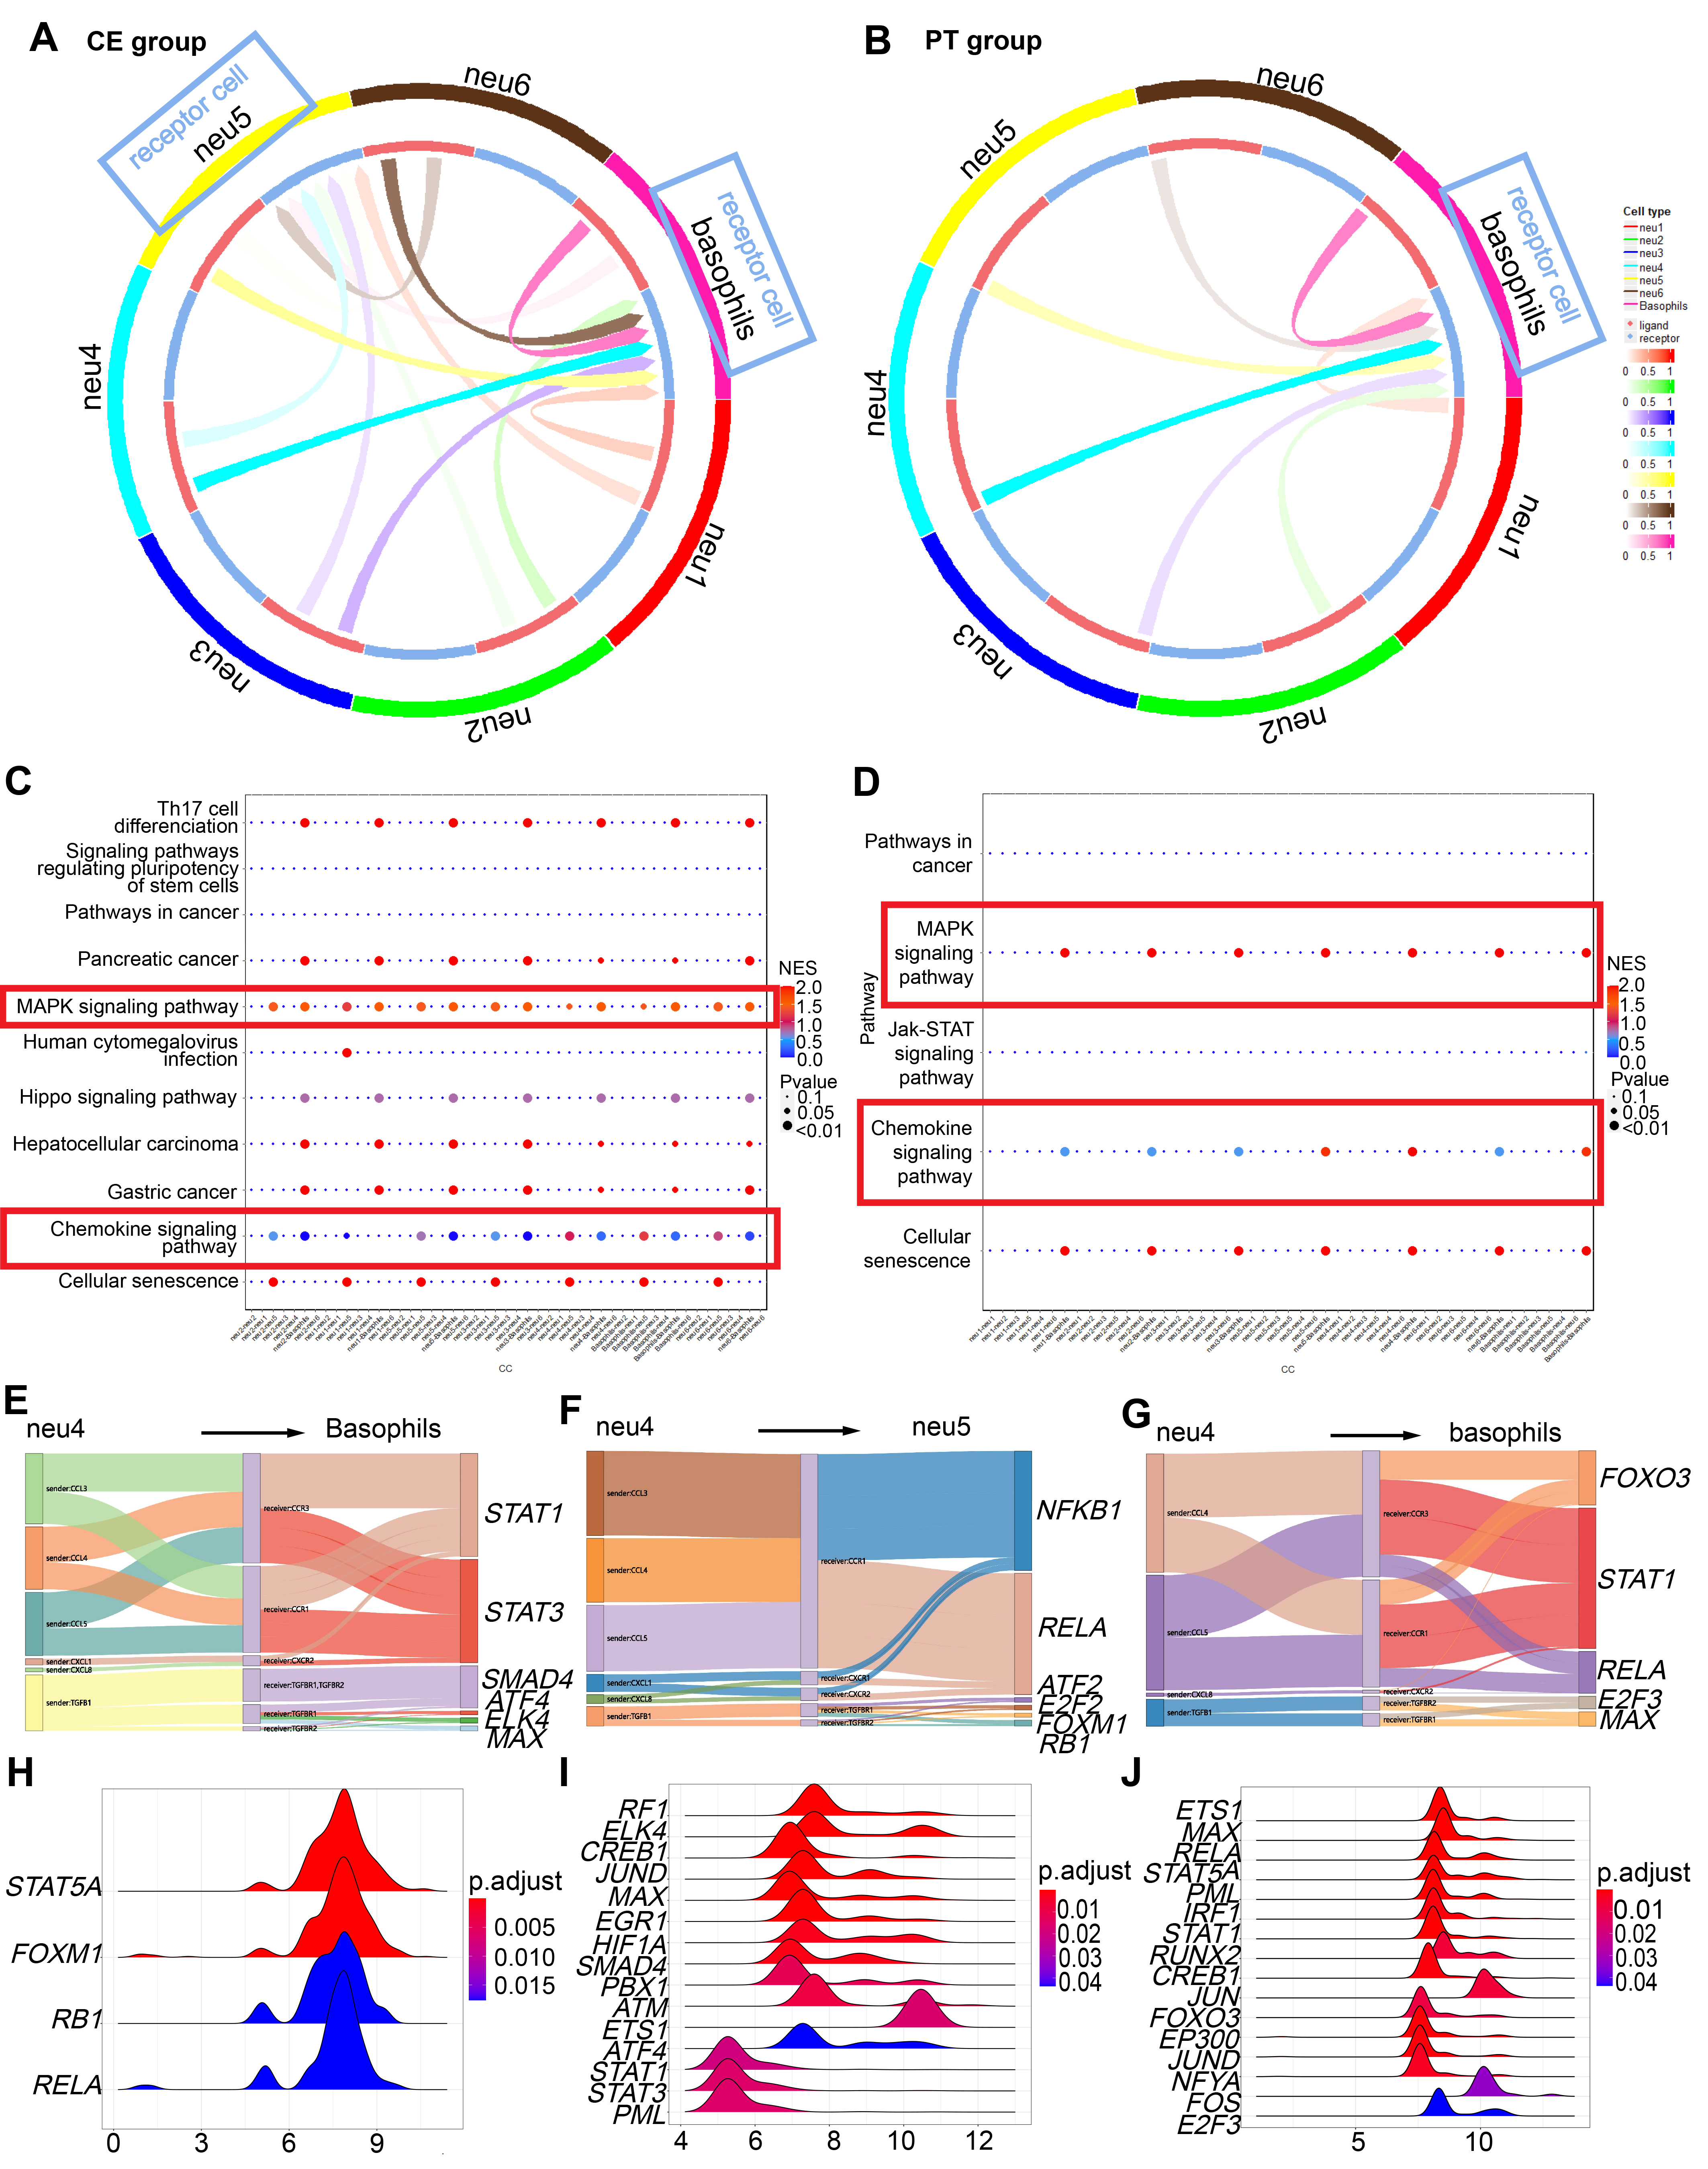 Fig. 5.
 CellCall analysis among LDG subclusters, further revealing proinflammatory-differentiation potential of neu5 and basophils. Cell-cell interactions were enriched exclusively in severe groups (CE and PT). (A) Circos plot indicating receptor-cell enrichment in basophils and neu5 in the CE group with blue boxes. (B) Circos plot indicating receptor-cell enrichment only in basophils in the PT group with blue boxes. (C) Receptor-to-TF pathway distance in MAPK and chemokine signaling pathways in the CE group, as denoted by red boxes. (D) Receptor-to-TF pathway distance in MAPK and chemokine signaling pathways in the PT group, as denoted by red boxes. (E,F) Sankey diagrams showing the significant ligand-receptor (L-R) pairs from neu4 to basophils (E) and to neu5 (F), along with downstream transcription factors (TFs) in the CE group. (G) Sankey diagram showing the significant L-R pairs from neu4 to basophils, along with downstream TFs in the PT group. (H,I) Ridge plots depicting fold-change distributions of transcription genes (TGs) of activated TFs in basophils (H) and neu5 (I) in the CE group. (J) Ridge plots depicting fold-change distributions of TGs of activated TFs in basophils in the PT group. CE, severe group without primary glucocorticoid treatment; PT, severe group with primary glucocorticoid treatment; MAPK, mitogen-activated protein kinase.
3.2.3.1 Pro-inflammatory Proliferation of basophils and neu5 in the CE Group
Interaction analysis demonstrated receptor-cell enrichment preferentially in neu5 and basophils within the CE group, with stronger intercellular signaling toward basophils compared with neu5 (Supplementary Fig. 2A).
Through mitogen-activated protein kinase (MAPK) and chemokine signaling pathways (Fig. 5C), all subclusters activated transcription factors (TFs) in basophils, including STAT1, STAT3, SMAD4, AFT4, ELK4, and MAX (Fig. 5E, Supplementary Fig. 2B). ATF4 is a master TF regulating stress-response genes involved in cellular repair or inflammatory responses [31, 32]. SMAD4, ELK4, and MAX regulate cell growth and development [33, 34, 35]. Downstream transcription genes (TGs) included IRF1 (Fig. 5H), which activates antiviral responses [36]; HIF1A, involved in inflammation after viral infections [37]; and JUND, which enhances expression of inflammatory cytokines such as IL1B. Thus, basophils in the CE group continued maturing toward a proinflammatory and antiviral phenotype.
In neu5 cells, through MAPK and chemokine signaling pathways (Fig. 5C), subclusters activated TFs, including ATF2, NFKB1, FOXM1, RELA, E2F2, and RB1 (Fig. 5F, Supplementary Fig. 2C). ATF2 [38, 39] and E2F2 [40] relate to cell proliferation and differentiation. RB1 is a well-known tumor suppressor regulating cell cycle progression from G1 to S phase. Downstream TGs were enriched mainly in STAT5A, FOXM1, RB1, and RELA (Fig. 5I). Thus, neu5 differentiation in the CE group exhibited proinflammatory characteristics.
3.2.3.2 Suppressed Pro-Inflammatory Proliferation and Differentiation of neu5 in the PT Group
In the PT group, receptor cells were only enriched in basophils (Fig. 5B). Via MAPK and chemokine signaling pathways (Fig. 5D), all subclusters activated TFs, including E2F3, MAX, FOXO3, RELA, and STAT1 in basophils (Fig. 5G). STAT5A was also activated during interactions among basophils (Supplementary Fig. 3B). These results suggested a continued generation of pro-inflammatory basophils in the PT group. Notably, interactions between neu4 and basophils had the greatest weight (Supplementary Fig. 3A). Ligand-receptor-TF interactions, such as CCL5-CCR1/CCR3-RELA and CCL4/CCL5-CCR3/CCR1-STAT1, were more prominent in neu4-basophil (Fig. 5G) and neu5-basophil interactions (Supplementary Fig. 3B) than in other interactions. The downstream TGs were still enriched mainly in STAT5A, RELA, JUN, and FOS (Fig. 5J). These results indicated a still proinflammatory differentiation tendency in basophils. Therefore, glucocorticoid treatment inhibited differentiation of neu5 towards a proinflammatory state, while preserving proinflammatory basophil differentiation.
Our previous studies identified cytokine storms as a key pathological mechanism in SFTS. Here, we investigated whether pro-inflammatory LDNs, which expand during the acute SFTS phase in a severity-dependent manner, participate in cytokine storms and systemic hyperinflammation, potentially contributing to inflammatory progression.
Although not statistically significant, the severe group (CE) exhibited a higher mean peak body temperature compared to the ordinary group (OR) (39.06
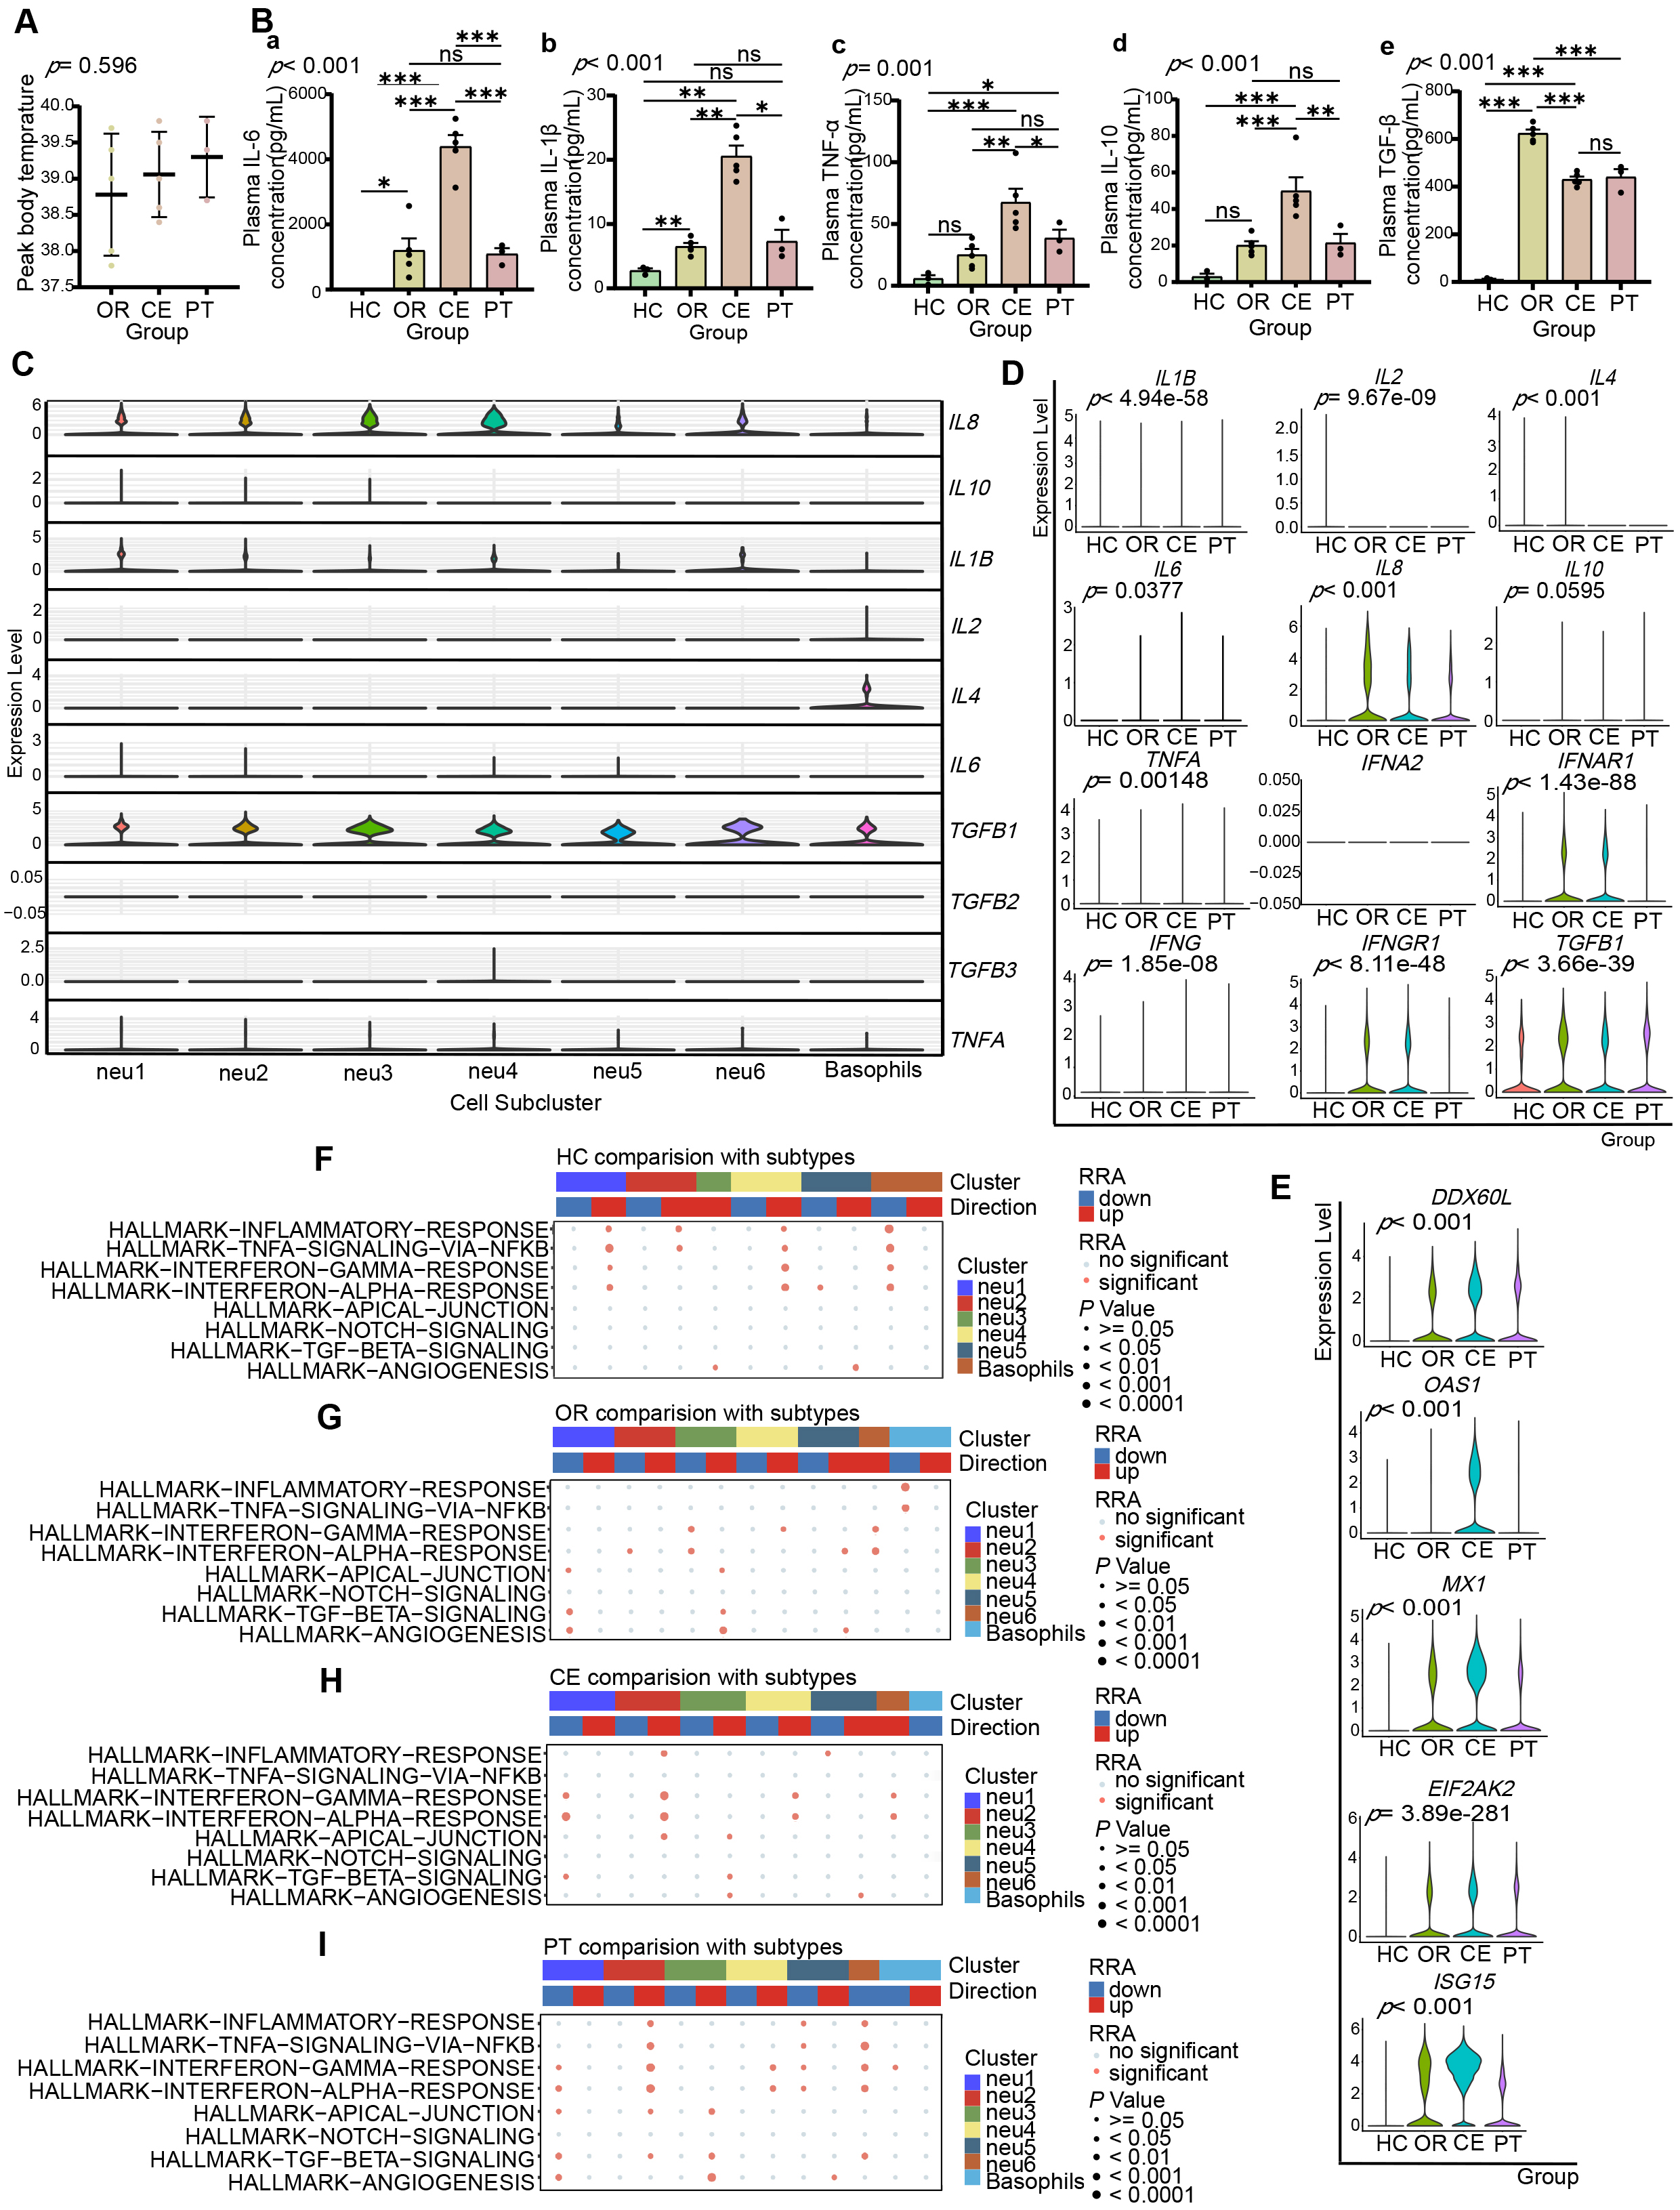 Fig. 6.
 Enhanced pro-inflammatory role of LDNs is closely associated with exacerbated systemic inflammation in severe patients. (A) Scatter plot illustrating peak body temperatures throughout the disease course in OR (38.78
Analysis of cytokine gene expression in LDN subclusters (Fig. 6C) revealed IL1B expression across all LDN subclusters, with higher mean expression in neu1 and neu2, the highest in neu1. IL6 was mainly expressed by neu1 and neu2, with the highest in neu1, and minimal in neu4 and neu5. CXCL8 (IL8) was expressed by all subclusters, with the highest in neu2, and the highest mean in neu4. IL10 was expressed by neu1, neu2, and neu3, with the highest peak expression in neu1.
Intergroup analysis (Fig. 6D) showed higher cytokine gene expression (IL6, IL8, TNFA, IFNG, IL10) in LDNs from patient groups (OR, CE) compared with healthy controls (HC). CE-group LDNs exhibited higher IL6, TNFA, and IFNG expressions, while lower IL10, IL4, and TGFB1 expressions compared with the OR group. The immune-related Gene Set Enrichment Analysis (Robust Rank Aggregation) (irGSEA (RRA)) analysis indicated no significant upregulation in gene sets of inflammation-related pathways, “TNFA-SIGNALING-VIA-NFKB”, “INFLAMMATORY-RESPONSE”, and “INTERFERON-GAMMA-RESPONSE”, in neu2, neu3, and neu4 of OR versus HC (Fig. 6F,G, Supplementary Fig. 7A,B), but significant upregulation in all LDN subclusters of CE versus OR (Fig. 6G,H, Supplementary Fig. 7C,D). Thus, LDNs contribute to systemic inflammation, particularly intensified in the CE group.
LDNs did not express type I interferon genes (IFNA1, IFNB1) but expressed type I interferon receptor gene IFNAR1 (Fig. 6D). irGSEA (RRA) analysis revealed progressive upregulation of the “INTERFERON-ALPHA-RESPONSE” pathway from HC to CE (Fig. 6F–H, Supplementary Fig. 7A–C). Correspondingly, expression of antiviral protein genes (EIF2AK2, OAS1, MX1, CXCL9, CXCL10, ISG15, DDX60L) progressively increased from HC to CE (Fig. 6E). These findings suggest LDNs may act as effectors of type I interferon signaling, promoting antiviral protein production. Type II interferon gene IFNG, receptor gene IFNGR1 (Fig. 6D), and the “INTERFERON-GAMMA-RESPONSE” pathway similarly showed progressive upregulation (Fig. 6F–H, Supplementary Fig. 7A–C), suggesting LDNs as effectors and responders to type II interferons in antigen presentation and antiviral immunity.
Both CE and PT groups represented severe cases, but the PT-group patients received glucocorticoid treatment before blood sampling. Plasma cytokine levels (IL-1
Single-cell RNA-seq analysis of 54,342 granulocytes, including LDNs (CSF3R+, FCGR3B+, CXCR2+, HLA-DRA–, HLA-DRB1–) and basophils (GATA2+, CLC+, MS4A2+, CXCR4+), revealed six previously unidentified LDN subclusters with heterogeneous proportions and functions among different severity SFTS groups.
Previous studies have shown significantly increased proportions of LDNs in peripheral blood from patients with RNA viral infections, such as COVID-19 [41] and HIV [12], compared to healthy individuals. These LDNs possess pro-inflammatory properties and closely correlate with systemic inflammatory responses and disease prognosis. Utilizing high-resolution scRNA-seq, this study first observed elevated proportions of LDNs and their subsets in peripheral blood from SFTS patients during the early phase of disease, which were strongly associated with disease severity. These findings may serve as early indicators for predicting severe SFTS progression.
Single-cell analysis identified six functionally heterogeneous LDN subclusters, exhibiting both pro-inflammatory and anti-infection properties. Additionally, in severe cases, neu5 and basophil subclusters demonstrated inducible pro-inflammatory differentiation upon interactions with other subclusters. This differentiation may facilitate rapid replenishment and functional enhancement of LDNs during disease progression. AddModuleScore analysis revealed that LDNs universally showed enhanced neutrophil degranulation, NET formation, and antiviral innate immune functions, features directly associated with combating DBV infection.
Cytokine storms develop through a cascade of interacting inflammatory mediators [42, 43]. Prior studies reported that elevated IL-6 and IL-10 (with IL-10 enhancing IL-6), and reduced TGF-
Interestingly, gene expression levels of IL6, TNFA, and TGFB1 in LDGs showed significant positive correlations with corresponding plasma protein concentrations (Supplementary Fig. 6), implying that LDGs are active producers of these inflammatory mediators. Moreover, transcriptomic analysis revealed progressively upregulated key inflammatory pathways (“TNFA-SIGNALING-VIA-NFKB”, “INFLAMMATORY-RESPONSE”, “INTERFERON-GAMMA-RESPONSE”, and “INTERFERON-ALPHA-RESPONSE”) directly associated with disease severity. Collectively, these findings highlight LDGs as crucial cytokine sources and effectors that actively participate in initiating and sustaining cytokine storms during the acute phase of SFTS.
CCL5 mediates inflammatory responses and immune cell recruitment by binding to CCR5, CCR3, and CCR1 receptors, contributing to various pathological conditions, including inflammation, chronic diseases, and malignancies [46]. Notably, the CCL5-CCR5 axis exacerbates pulmonary inflammation in COVID-19 patients and may intensify cytokine storm syndrome [47]. Through scRNA-seq analysis of LDGs from acute-phase SFTS patients, we identified functional CCL5-CCR3 interactions that coordinate inflammatory responses and cellular differentiation. Data analysis revealed significant positive correlations between CCL5 and CCR3 expression, and inverse correlations between CCL5/CCR3 and TGFB1 expression (Supplementary Fig. 5). These findings suggest that the CCL5-CCR3 axis may regulate cytokine gene expression, such as TGFB1, in LDGs during acute SFTS infection, offering new mechanistic insights into inflammatory dysregulation.
Although glucocorticoids are effective immunomodulators, their administration in severe SFTS requires careful evaluation of potential risks and benefits. In clinical practice, we administered glucocorticoids to severe SFTS patients to control excessive inflammatory responses and mitigate related damage. In the glucocorticoid-treated (PT) group, we observed reduced plasma levels of cytokines such as IL-1
Although our study relied on transcriptional markers to define LDNs, their functional characteristics (e.g., cytokine production and interferon response) align with the pathogenic role of LDNs observed in other cytokine storm syndromes. Future studies integrating surface protein detection methods (e.g., CITE-seq) may further refine LDN classification in SFTS. Additionally, while our data establishes a significant association between LDNs and cytokine storms, the underlying mechanisms remain to be fully elucidated.
This study establishes the first single-cell transcriptional profile of peripheral blood LDGs from acute SFTS patients. We identified six functionally heterogeneous LDN subclusters, providing single-cell sequencing data to support future SFTS research. Increased proportions of LDNs and their subclusters in peripheral blood closely correlated with SFTS severity, indicating their potential as early biomarkers for severe disease progression. LDN subclusters universally exhibited pro-inflammatory and anti-infective gene expression profiles, implicating their involvement in cytokine storm initiation and progression. These findings offer new insights into SFTS pathogenesis, particularly regarding excessive systemic inflammation observed in severe cases. Future multi-omics studies and functional experiments will be expected to validate and expand upon these findings.
SFTS, severe fever with thrombocytopenia syndrome; DBV, Dabie bandavirus; LDNs, Low-density neutrophils; scRNA-seq, single-cell RNA sequencing; DEGs, differentially expressed genes; hdWGCNA, high-dimensional Weighted Gene Coexpression Network Analysis; GO, Gene Ontology; ssGSEA, single-sample Gene Set Enrichment Analysis; irGSEA (RRA), immune-related Gene Set Enrichment Analysis (Robust Rank Aggregation); TFs, transcription factors; TGs, transcription genes; CRF, case fatality rate; GCS, Glasgow Coma Scale.
scRNA-Seq data were generated as described above. The dataset, Single-cell RNA sequencing data of PBMC from SFTS patients, has been uploaded to the repository Genome Sequence Archive for Human. The accession number is HRA007977. All data can be found at https://ngdc.cncb.ac.cn/search/specific?db=hra&q=HRA007977. The other datasets used or analyzed during the current study are available from the corresponding author on reasonable request.
JL and JZhu conceived the study and supervised the project. JZhao and CW designed and performed the research. JZhao wrote the manuscript. KJ, YD, YZ, YL, NH, CZ, and PS collected the patients’ peripheral blood samples and clinical information. TZ, ZY, TY, YM, and XS participated in the acquisition and interpretation of scRNA-seq data for the work. All authors (JZhao, CW, KJ, YD, YZ, TZ, ZY, TY, YL, NH, YM, CZ, PS, XS, JZhu, and JL) contributed to the discussion and editorial changes in the manuscript. All authors read and approved the final manuscript. All authors have participated sufficiently in the work and agreed to be accountable for all aspects of the work.
The study was conducted in accordance with the Declaration of Helsinki. All peripheral blood samples and information collection of patients were approved by the Ethics Committee of the First Affiliated Hospital with Nanjing Medical University (Ethic Approval Number: 2022-SR-366).
The requirement for obtaining written informed consent was waived by the ethics committee for the following reasons:
(1) Minimal risk: Only anonymized residual blood samples were used non-invasively.
(2) No sensitive data: Excluded genetic/racial/HIV information.
(3) Full compliance: Data de-identification meets GDPR/HIPAA standards.
(4) Ethics approved: Full ethical review confirmed the appropriateness of the exemption.
We are grateful to all the participants who donated blood samples for this research. We also extend our thanks to the Singleron team (Nanjing, Jiangsu, China) for performing the high-quality 3’ end single-cell RNA sequencing services.
This research was funded by the National Natural Science Foundation of China (grant number: 81871242) and the YiQi Fund Project (grant numbers: 2024YQZL01 and 2023YQFH05).
The authors declare no conflict of interest.
During the preparation of this work, the authors used DeepSeek and Grammarly in order to check spelling and grammar. After using this tool, the authors reviewed and edited the content as needed and take full responsibility for the content of the publication.
Supplementary material associated with this article can be found, in the online version, at https://doi.org/10.31083/FBL40723.
References
Publisher’s Note: IMR Press stays neutral with regard to jurisdictional claims in published maps and institutional affiliations.