


1 Department of Medical Oncology, The First Affiliated Hospital of Nanchang University, 330000 Nanchang, Jiangxi, China
2 Nanchang Key Laboratory of Tumor Gene Diagnosis and Innovative Treatment Research, Gaoxin Branch of the First Affiliated Hospital of Nanchang University, 330000 Nanchang, Jiangxi, China
3 Department of Oncology, Gaoxin Branch of the First Affiliated Hospital of Nanchang University, 330000 Nanchang, Jiangxi, China
4 Department of Biochemistry and Molecular Biology, School of Basic Medical Sciences, Nanchang University, 330006 Nanchang, Jiangxi, China
Abstract
Acquired resistance limits the therapeutic efficacy of osimertinib in lung adenocarcinoma (LUAD). Redox homeostasis is crucial for LUAD progression. However, how redox imbalance interacts with the tumor microenvironment (TME) to drive osimertinib resistance (OR) remains unclear.
The single-cell RNA sequencing (scRNA-seq) data GSE243562 were combined with the Cancer Genome Atlas (TCGA)-LUAD transcriptomes to map the TME cell population heterogeneity in osimertinib-resistant LUAD. Through univariate Cox regression and least absolute shrinkage and selection operator (LASSO) regularization, a prognostic signature founded on redox-related genes (RRGs) was built. Therapeutic compounds targeting these signature genes were prioritized by molecular docking. Their expression patterns were subsequently validated in vitro.
Cancer-associated fibroblasts (CAFs) were central hubs in the TME of osimertinib-resistant LUAD, exhibiting enhanced intercellular communication. Computational profiling identified 10 differentially expressed RRGs, predominantly enriched in CAFs. Using a six-gene signature comprising AGER, CYP2J2, FMO2, HSPA1B, SOD3, and VASN, we categorized LUAD patients into separate risk categories. High-risk patients showed significantly reduced survival, an immunosuppressive status, and a higher tumor mutation burden (p < 0.05). The overexpression of these six genes was confirmed in OR cells. Critically, inhibiting SOD3 restored osimertinib sensitivity in vitro (p < 0.05). Clinically, SOD3 expression was lower in patients sensitive to third-generation epidermal growth factor receptor-tyrosine kinase inhibitors (EGFR-TKIs) than in those with resistant disease.
Targeting CAFs represents a promising strategy to overcome osimertinib resistance. Our six-gene redox signature offers a clinical framework for patient risk stratification and novel therapeutic strategy design. Future work will explore these targets to develop new treatments for LUAD.
Keywords
- single-cell analysis
- transcriptome
- lung adenocarcinoma
- osimertinib
- oxidative stress
- biomarkers
Lung cancer is the leading cause of cancer-related deaths worldwide. Lung adenocarcinoma (LUAD) accounts for approximately 50% of all cases [1]. Epidermal growth factor receptor (EGFR)-mutant non-small cell lung cancer (NSCLC) patients respond significantly to EGFR-tyrosine kinase inhibitors (TKIs). This illustrates a major success for precision medicine [2]. Despite initial efficacy, acquired resistance to EGFR-TKIs ultimately drives disease progression, even with sequential first- to third-generation regimens [3]. Well-established resistance mechanisms to all three generations of EGFR-TKIs include secondary EGFR mutations, cellular-mesenchymal epithelial transition factor (c-MET) amplification, and lineage transformation [4]. In contrast, the mechanisms underlying clinical drug tolerance remain elusive. Accumulating evidence supports the superior efficacy of combination targeted therapies for achieving more durable clinical responses [5]. Therefore, deciphering the molecular mechanisms of acquired resistance and identifying predictive biomarkers are imperative to optimizing therapeutic strategies and improving survival outcomes in NSCLC.
Cellular redox homeostasis is maintained by regulating the production of reactive oxygen species (ROS) and the activity of antioxidant defense systems [6]. Disrupted redox homeostasis is a cancer hallmark, regulated by conserved redox-related genes (RRGs) [7, 8]. Unlike normal cells, cancers exhibit a dysregulated redox state with concurrent ROS elevation and enhanced antioxidant defense, with a consequence of metabolic reprogramming, genomic instability, mitochondrial dysfunction, and tumor microenvironment (TME) adaptations [9, 10]. ROS play dual and context-dependent roles in carcinogenesis. In NSCLC, this redox interplay influences progression, drug resistance, and apoptosis. Here, differentially expressed RRGs are key regulators, particularly of resistance mechanisms, making them promising therapeutic targets to overcome NSCLC resistance, metastasis, and recurrence [11, 12, 13]. However, the prognostic role and functional mechanisms of RRGs in NSCLC lack clarity.
Single-cell RNA sequencing (scRNA-seq) deciphers tissue heterogeneity by categorizing cells, advancing precision medicine [14]. Beyond defining cell types, it precisely defines gene function within heterogeneous populations to reveal cancer-promoting pathways [15]. Leveraging these advantages, studies increasingly identify novel biomarkers by integrating scRNA-seq with bulk transcriptome data [16, 17]. Given the complex landscape of therapy resistance, we combined these approaches to develop a prognostic signature for improving NSCLC outcome prediction and guiding therapy.
Using single-cell resolution mapping, we identified differentially expressed redox-related genes (DE-RRGs) in malignant cell clusters of osimertinib-resistant LUAD. Integration with bulk transcriptomics established a six-gene prognostic signature (AGER, CYP2J2, FMO2, HSPA1B, SOD3, VASN). Immune profiling and molecular docking revealed the signature’s therapeutic potential, which was confirmed by the upregulated DE-RRG expression we observed in resistant cells. Crucially, SOD3 knockdown restored osimertinib sensitivity in vitro, and lower SOD3 levels were clinically associated with sensitivity to third-generation EGFR-TKIs. Our work defines clinically actionable biomarkers and reveals novel therapeutic vulnerabilities in treatment-resistant LUAD.
The scRNA-seq data GSE243562 were obtained from the gene expression omnibus (GEO) database (https://www.ncbi.nlm.nih.gov/geo/), using patient-derived xenograft (PDX) models of osimertinib-treated lung cancer. Samples GSM7790998 and GSM77901000 were classified as osimertinib sensitivity (OS), while GSM7790999 and GSM77901001 were classified as osimertinib resistance (OR). Bulk RNA-seq data were further acquired from the cancer genome atlas (TCGA)-LUAD cohort (https://portal.gdc.cancer.gov) and the GSE72094 dataset. Model development was conducted in the TCGA-LUAD cohort, with independent validation performed using the GSE72094 dataset. All datasets were standardized using R software (v4.3.0, https://cran.r-project.org/bin/windows/base/old/4.3.0/R-4.3.0-win.exe).
Quality control was performed using the “Seurat” package (v5,
https://github.com/satijalab/seurat). Cells were filtered based on the following
criteria: nCount_RNA (1000–50,000), nFeature_RNA (200–10,000), percentage of
mitochondrial genes (
The 940 RRGs were sourced from MsigDB (https://www.gsea-msigdb.org/gsea/msigdb)
and published literature [18] (Supplementary Table 1). Marker genes were
selected based on significant population specificity (adj_p
Pseudotime analysis was performed using the “Monocle” package (v2.26.0, http://cole-trapnell-lab.github.io/monocle-release). The fibroblast cluster was isolated and subsequently classified into subpopulations based on established cell marker genes. The “DDRTree” method was then applied for dimensionality reduction, and cell differentiation states were ordered using the “orderCells” function. Expression patterns of the DE-RRGs were mapped along the inferred pseudotime. The intercellular communication was analyzed with the “CellChat” package (v2.1.0, https://github.com/jinworks/CellChat) to quantify and visualize receptor-ligand interactions.
The DEGs of TCGA-LUAD cohort was analyzed using DESeq2 (
Gene Ontology (GO, http://geneontology.org/) and Kyoto Encyclopedia of Genes and
Genomes (KEGG, https://www.kegg.jp) pathway analyses were performed to
characterize the functions and pathways associated with DEGs. Enrichment analyses
for biological processes, molecular functions, cellular components, and KEGG
pathways were conducted using the “clusterProfiler” package (v4.16.0,
https://bioconductor.org/packages/clusterProfiler), with a statistical
significance cutoff of p
The association between the prognostic risk signature and immune infiltration was assessed by single-sample gene set enrichment analysis (ssGSEA) to quantify immune cell abundance in the TCGA-LUAD cohort. Additionally, a Pearson correlation analysis was performed between the six DE-RRGs and the infiltrating immune cells.
Somatic mutation analysis was performed on TCGA datasets using the “maftools” package (v2.24.0, https://bioconductor.org/packages/maftools). Differences in tumor mutational burden (TMB) across risk groups were then assessed using the Tumor Immune Dysfunction and Exclusion (TIDE) platform (http://tide.dfci.harvard.edu/), integrated with copy number variation data.
Autodock (Linux, v4.2, Olson, CA, USA) was employed to perform molecular docking analyses of small molecule compounds that interact with prognostic genes. Initially, the comparative toxicogenomics database (CTD, https://ctdbase.org/) was queried to extract bioactive compounds corresponding to prognostic genes and subsequently their structural information were obtained from the PubChem database (https://pubchem.ncbi.nlm.nih.gov/). Then, we accessed and downloaded the biological macromolecular structures corresponding to the prognostic genes from the UniProt database (https://www.uniprot.org/). Standardized docking of macromolecule-ligand complexes identified strongest binders via energy minimization. Structural representations were rendered in PyMol v2.6 (DeLano Scientific LLC, Palo Alto, CA, USA).
NSCLC cell lines HCC827 (EGFR exon 19 deletion) and H1975 (EGFR L858R and T790M
mutations) (authenticated via STR profiling) were sourced from the Type Culture
Collection of the Chinese Academy of Sciences (Shanghai, China).
Osimertinib-resistant derivatives (HCC827/OR, H1975/OR) were established through
stepwise exposure to osimertinib (10 nM
Total RNA was extracted from cells using TRIzol (15596018CN, Invitrogen, Carlsbad, CA, USA). Subsequently, 1 µg of the total RNA was converted into cDNA with the help of the PrimeScript RT Reagent Kit (AE311-02, TransGen Biotech, Beijing, China). For qPCR, the SYBR Green PCR Master Mix in the kit above was utilized, and the results were analyzed using GraphPad Prism (v7.0.4, GraphPad Software, San Diego, CA, USA) based on One-way ANOVA. Human GAPDH (B661104-0001, Sangon Biotech (Shanghai) Co., Ltd., Shanghai, China) served as the internal housekeeping control. The sequences for PCR primers were provided in Supplementary Table 3.
Total protein was extracted via a combination of radioimmunoprecipitation and lysis buffer. The isolated proteins underwent 10% sodium dodecyl sulfate polyacrylamide gel electrophoresis (SDS-PAGE), followed by transfer onto polyvinylidene fluoride membranes. These membranes were then blocked with a 5% milk solution and incubated overnight at 4 °C with the primary antibodies. Subsequently, the membranes were treated with horseradish peroxidase-conjugated secondary antibodies (1:1000, SA00001-2, Proteintech, Wuhan, Hubei, China) relevant to the primary ones used. Signal detection was carried out with an enhanced chemiluminescence detection kit (New Cell & Molecular Biotech, P10100, Suzhou, Jiangsu, China). The primary antibodies employed included SOD3 (1:1000, HA721408, HuaBio, Hangzhou, Zhejiang, China) and GAPDH (1:15000, 10494-1-AP, Proteintech, Wuhan, Hubei, China).
Lentiviral shRNA vectors against SOD3 (shSOD3) and non-targeting controls (shNC) were custom-synthesized by Genepharma (Shanghai, China) with sequence verification. Transfection was performed using jetPRIME® transfection reagent (No: 114–115, Polyplus-transfection®, Strasbourg, Alsace, France) at 1:2 DNA: reagent ratio. Cells at 70–80% confluency in 6-well plates were transfected with 2 µg shRNA vectors per well following manufacturer protocol. The specific sequence is as follows: shSOD3: 5′-GGAGTGGATCCGAGACATGTA-3′; shNC: 5′-CGGGCGACTTCGGCAACTT-3′.
Cell proliferation was quantified using Cell Counting Kit-8 (CCK-8; No. K1018,
APExBIO, Houston, TX, USA) according to manufacturer specifications. Cells (2
ROS quantification used the Reactive Oxygen Species Assay Kit (S0033S, Beyotime, Shanghai, China). Cells stained with 10 µM DCFH-DA (serum-free medium, 37 °C, 30 min) were analyzed on a CytoFLEX LX flow cytometer (DxFLEX, Beckman Coulter, Inc., Brea, CA, USA) with FlowJo v10.9.0 (BD Biosciences, Franklin Lake, NJ, USA).
Paraffin-embedded tissue samples from 24 pathologically confirmed EGFR-mutant NSCLC patients were included before targeted therapy. All cases received third-generation EGFR-TKIs targeted therapy (Osimertinib, n = 12; Almonertinib, n = 8; Furmonertinib, n = 4). The samples were derived from the pathological specimen bank of the First Affiliated Hospital of Nanchang University [Ethics Approval Number: (2024) CDYFYYLK (10-005)]. All patients or their guardians signed informed consent forms.
Following preparation from surgical/biopsy specimens, 4-µm-thick Formalin-Fixed, Paraffin-Embedded tissue sections were processed through a 20-minute antigen retrieval step in 95 °C citrate buffer (pH 6.0). Immunostaining was performed using human monoclonal anti-SOD3 antibody (1:200, HA721408, HuaBio, Hangzhou, Zhejiang, China) incubated overnight at 4 °C. Detection employed HRP-conjugated secondary antibody (G1302, Servicebio, Wuhan, Hubei, China) and DAB chromogen (P0203, Beyotime, Shanghai, China) as previously described [22].
Statistical analyses utilized R Studio (v23.3.0, Posit Software, Boston, MA,
USA). Normality-conforming continuous variables underwent independent
t-tests for group comparisons, while non-parametric distributions
employed Wilcoxon tests. Significance was defined at p
Fig. 1 outlines the study design. We analyzed four osimertinib-treated PDX samples by scRNA-seq. After rigorous quality control, we retained 12,327 high-quality cells for analysis, including 9874 from osimertinib-sensitive tumors and 2453 from resistant tumors. Subsequent t-SNE visualization of the dataset resolved 27 unique clusters, which we classified into 10 distinct cell types: epithelial cells, fibroblasts, Treg cells, alveolar cells, CD8+ T cells, cancer cells, dendritic cells, B cells, monocytes/macrophages, and mesenchymal cells (Fig. 2A,B). The t-SNE plot further revealed clear clustering by tumor origin (Fig. 2C). We validated these cellular subclasses with 10 established marker genes (Fig. 2D) and highlighted the top five DEGs per cluster in a heatmap (Fig. 2E). Analysis of cellular composition revealed variable cell-type proportions across samples (Fig. 2F). Alveolar cells constituted the largest population in three samples (GSM7790998, GSM7790999, GSM7791000), whereas epithelial cells predominated in the remaining sample (Fig. 2G). Notably, we observed significant differences in cellular composition between OS- and OR-LUAD tissues (Fig. 2H).
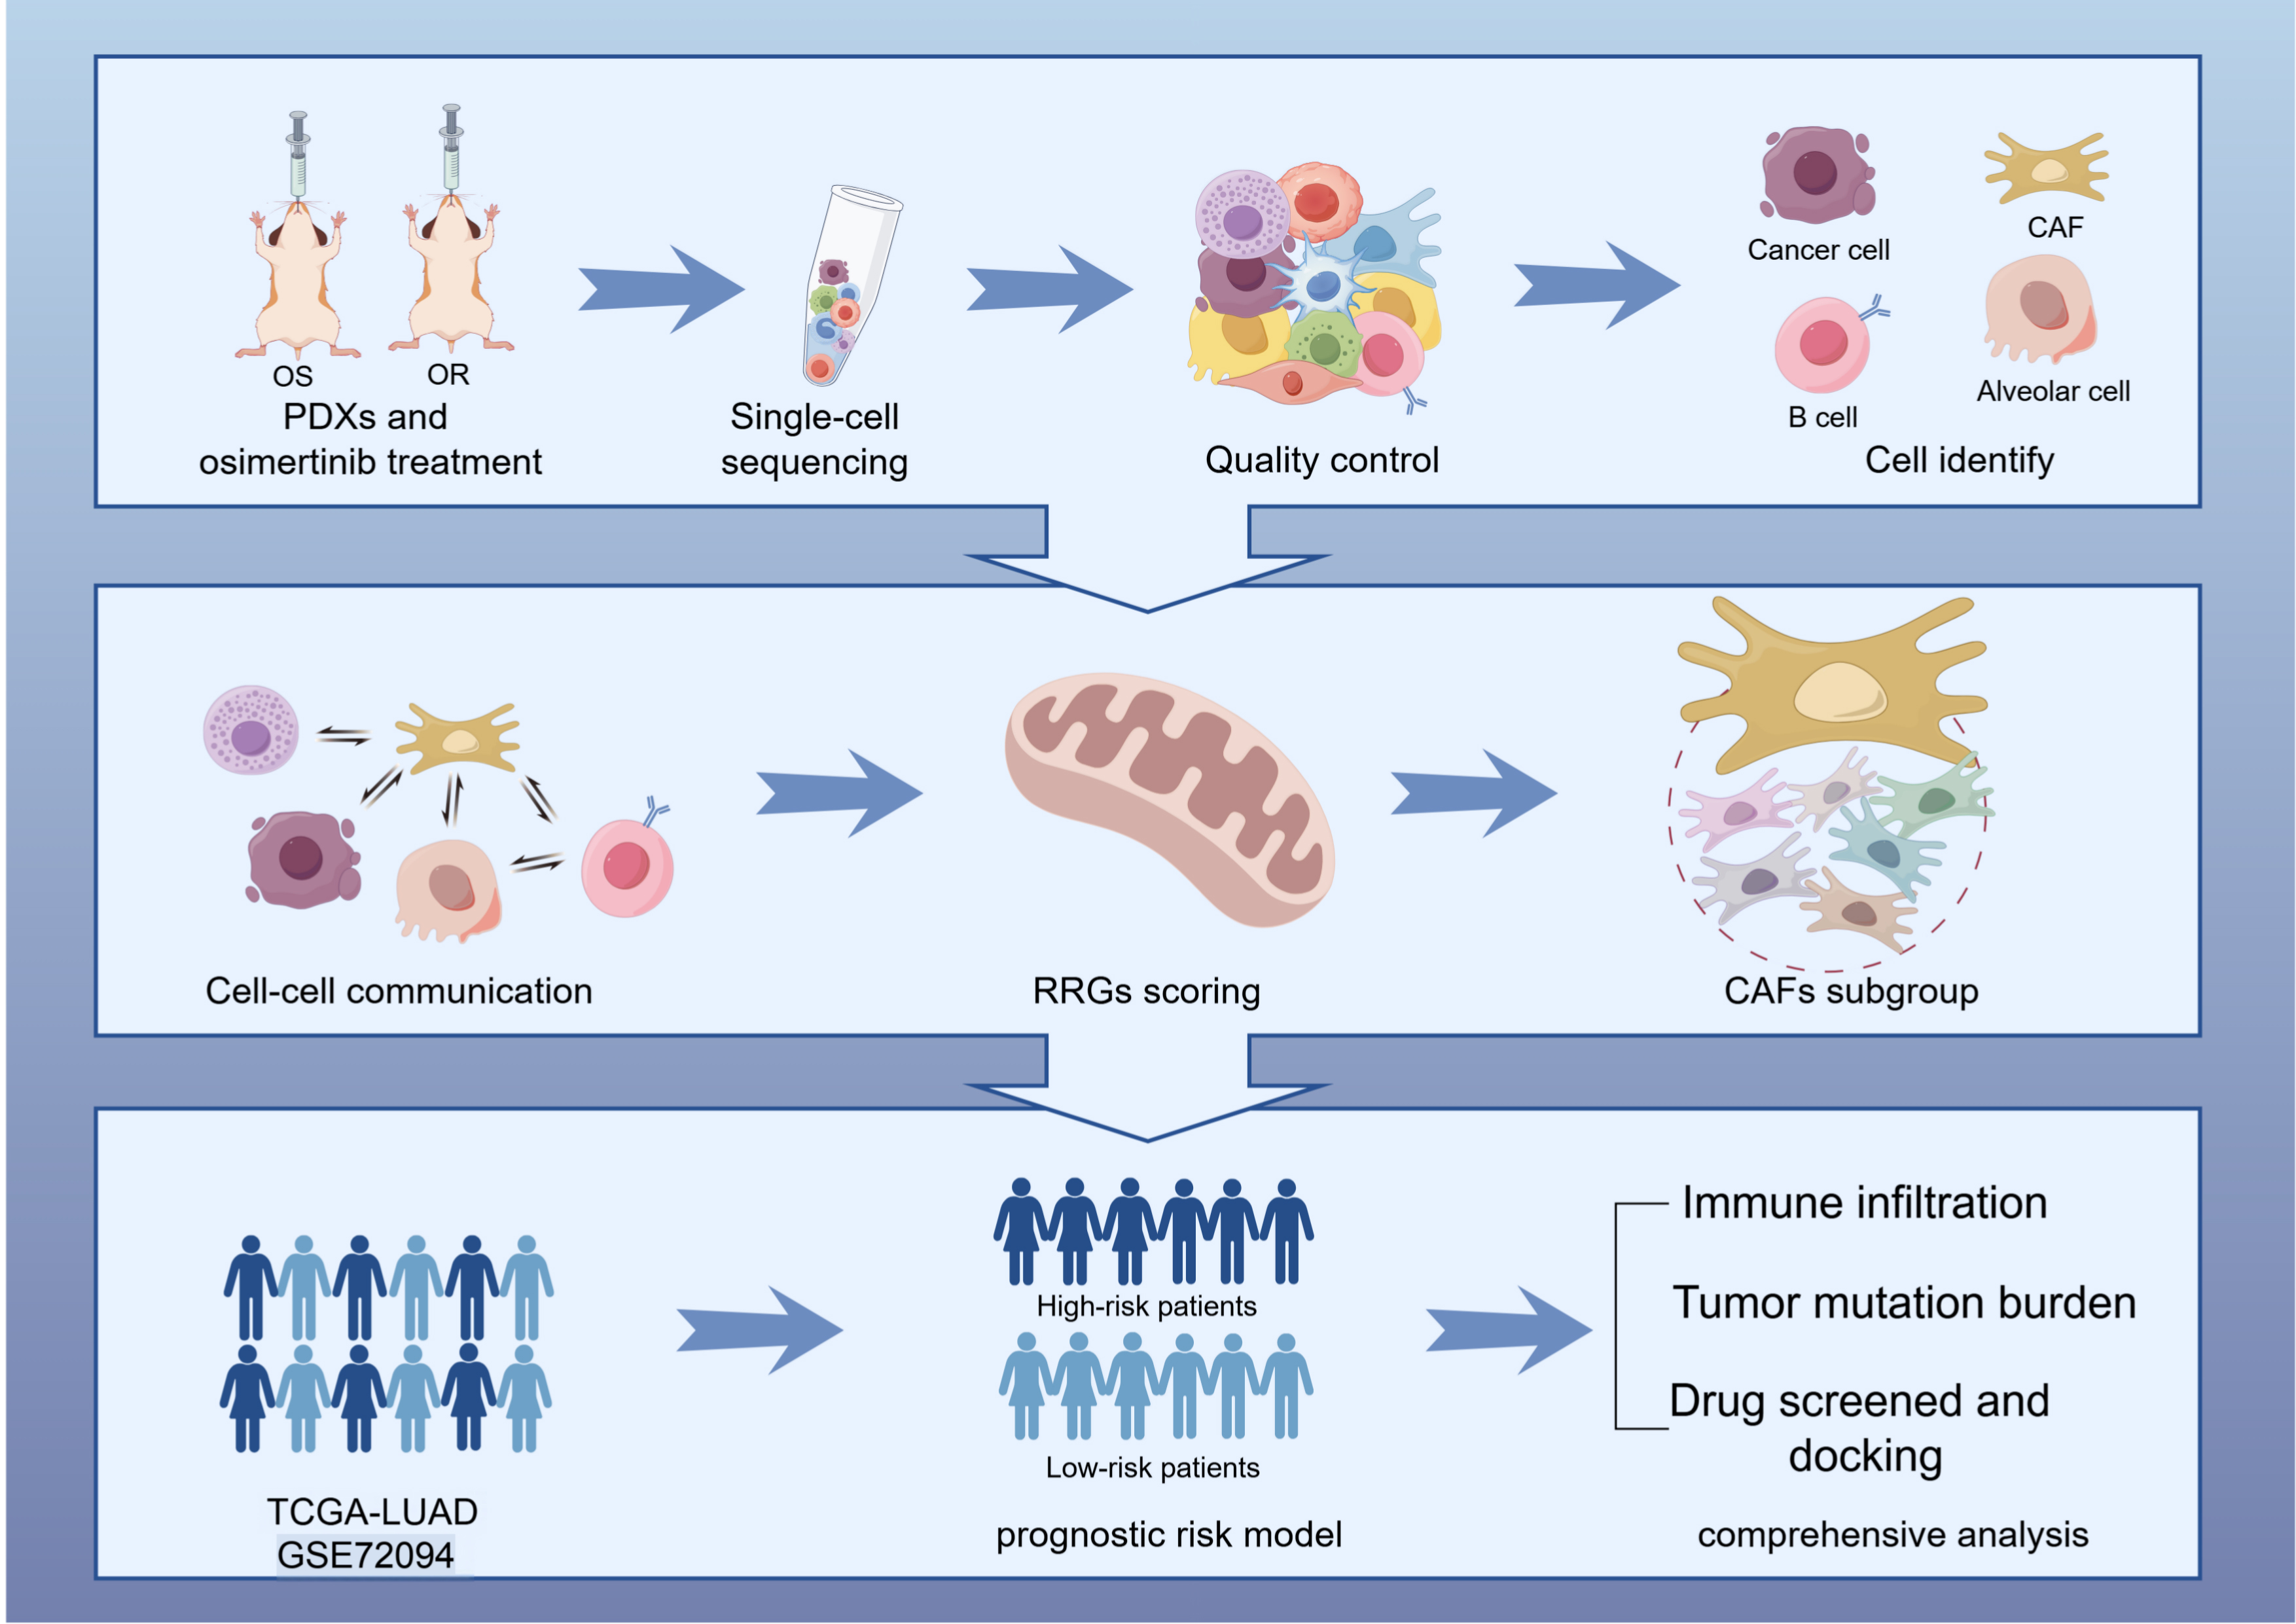 Fig. 1.
Research pipeline. OS, osimertinib sensitivity; OR, osimertinib resistance; PDX, patient-derived xenograft; CAFs, cancer-associated fibroblasts; RRGs, redox-related genes; LUAD, lung adenocarcinoma; TCGA, the cancer genome atlas. The Figure was created with Figdraw.
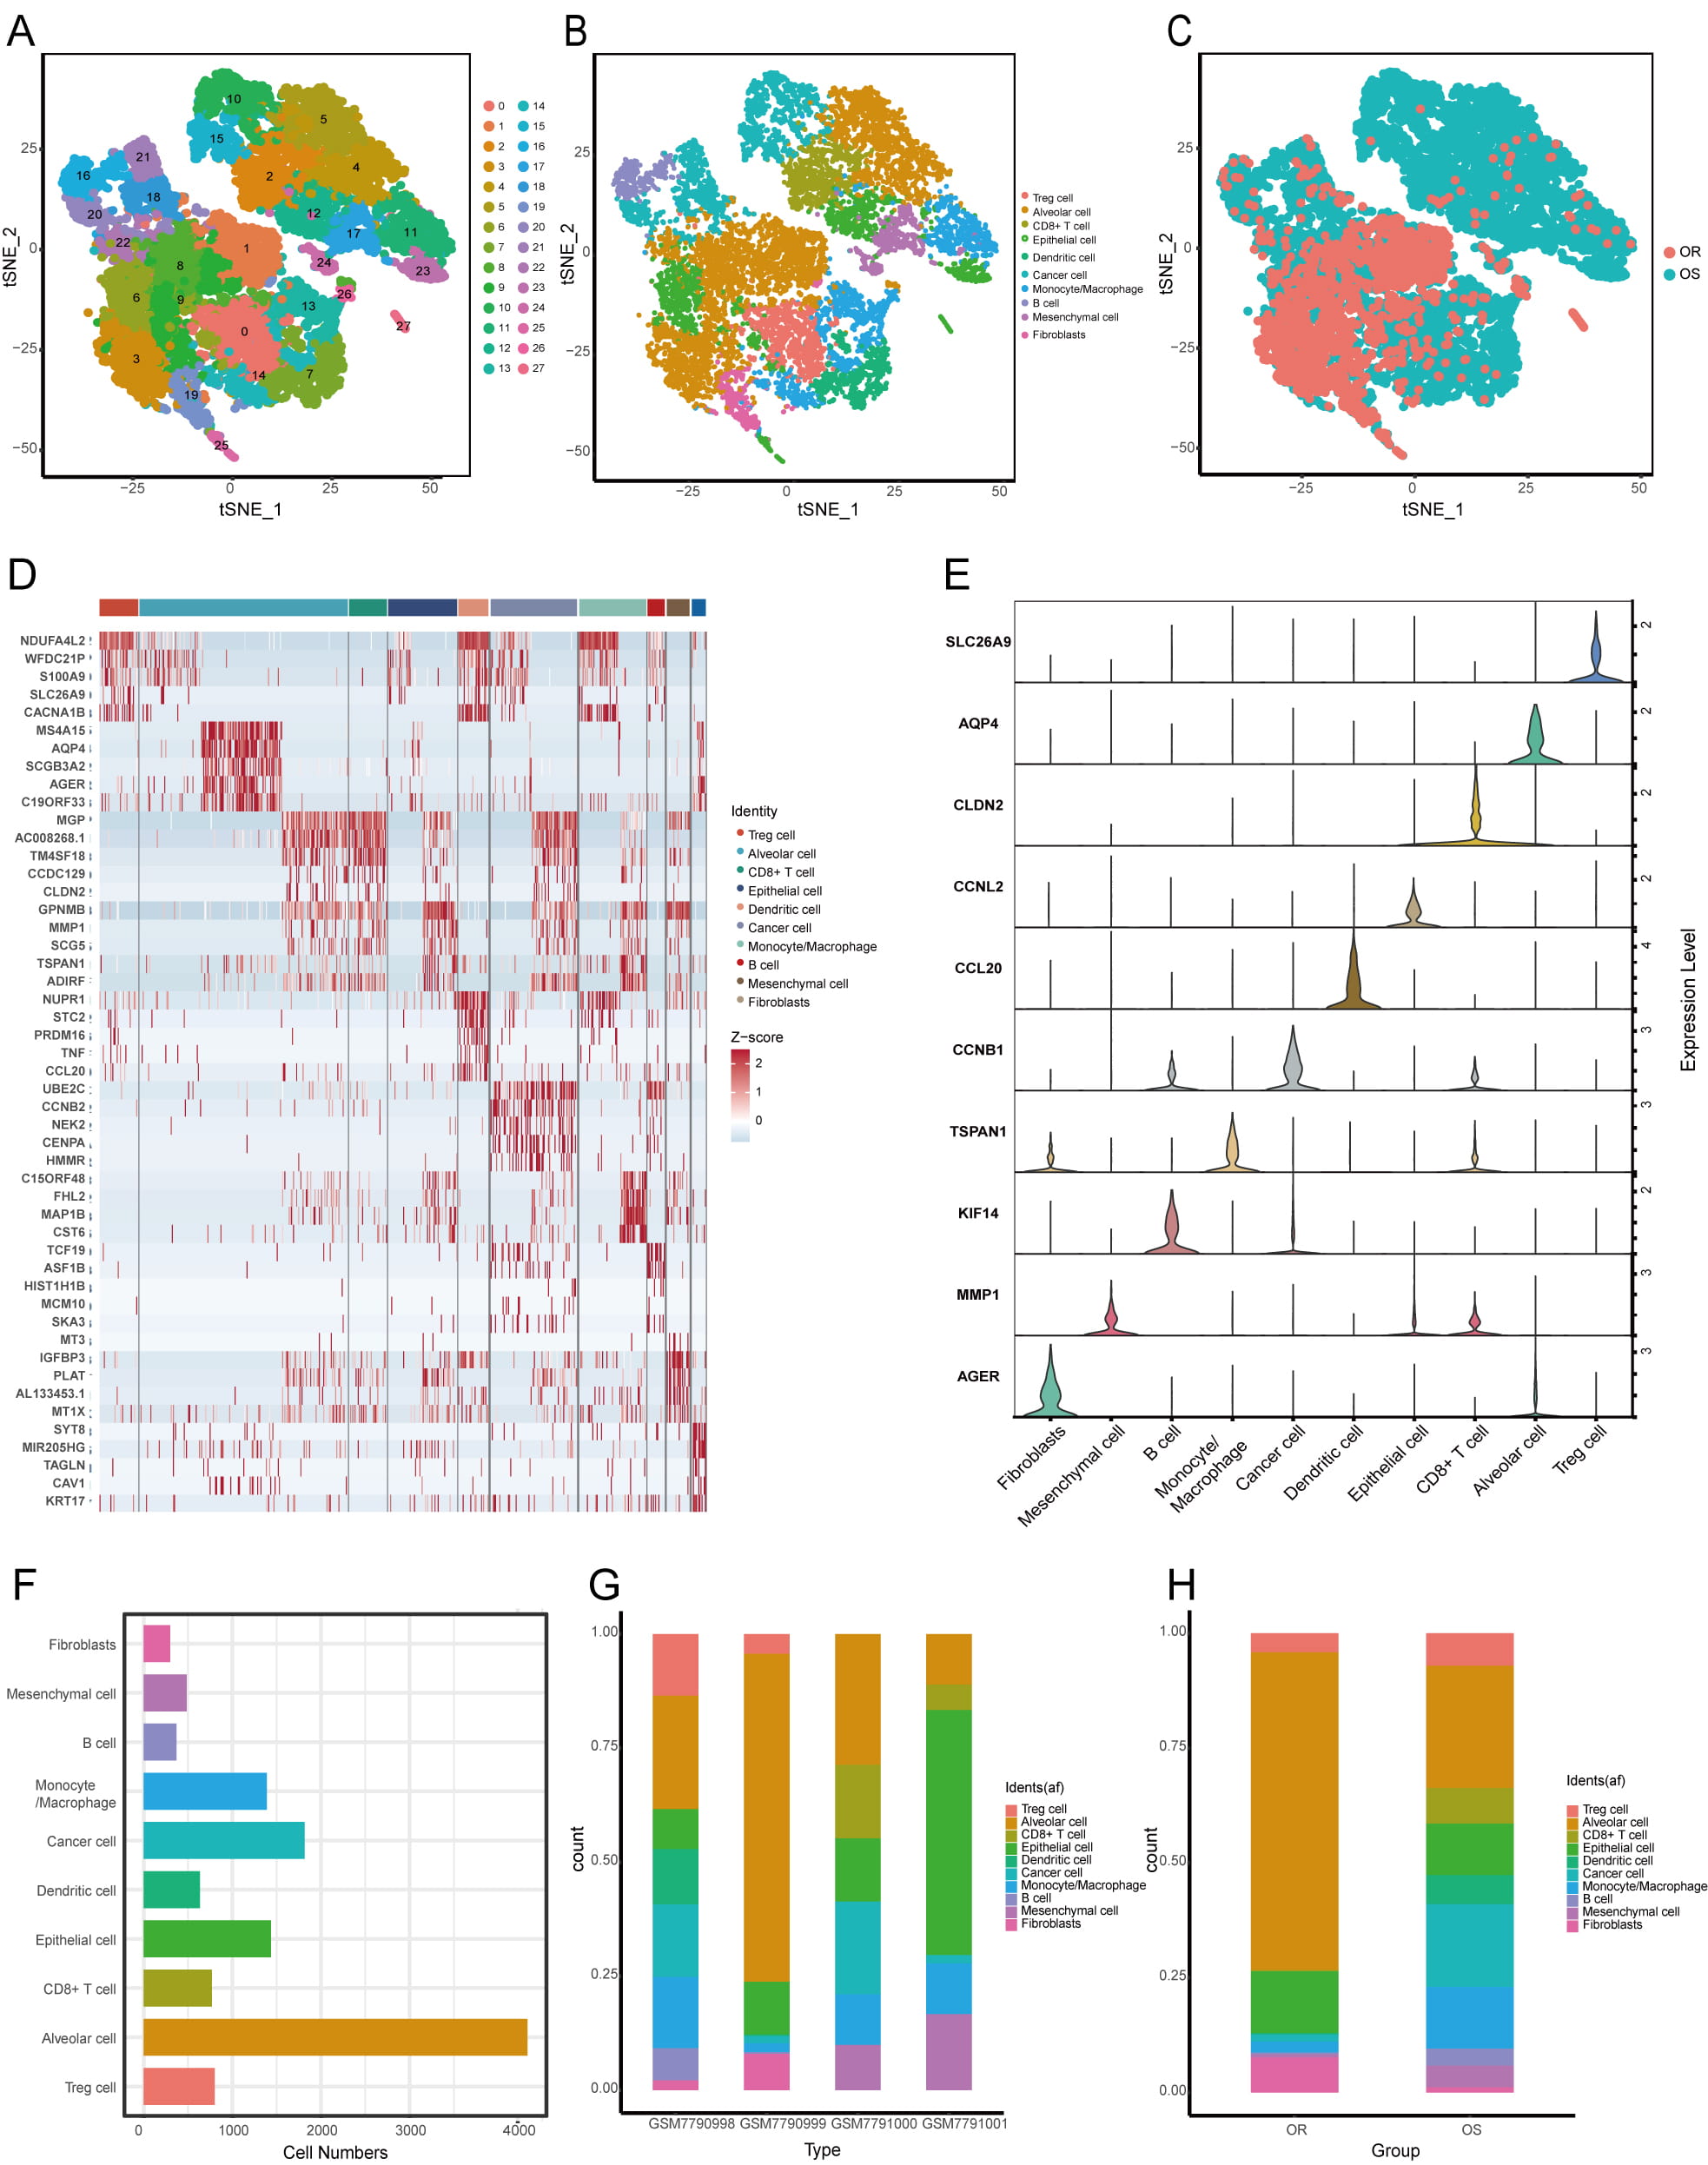 Fig. 2.
Cell Populations in OS- and OR-LUAD tumor microenvironment (TME). (A) t-SNE projection of 27 distinct cell clusters. (B) t-SNE visualization color-coded by cell type. (C) t-SNE visualization color-coded by sample origin. (D) Heatmap illustrating differentially expressed marker genes (rows) across 10 distinct cell clusters. (E) Violin plots showing expression distribution of diagnostic marker genes per cell cluster. (F) The overall quantity of each cell type. (G) Cellular cluster distribution across four PDX samples. (H) Proportion of cell populations in the OS and OR sample groups. t-SNE, t-distributed stochastic neighbor embedding.
We mapped a global cell communication network across major cell types using single-cell data (Fig. 3A). Compared to OS-samples, OR-samples exhibited markedly stronger interactions between cancer-associated fibroblasts (CAFs) and other cell types, particularly epithelial and immune cells (Fig. 3B). Our systematic interrogation of ligand-receptor networks revealed OR-specific enrichment of PPIA-BSG signaling between tumor cells and Tregs, epithelial cells, and CAFs (Supplementary Fig. 1A,B). Fibroblast-focused analysis further showed intensified CAF-tumor crosstalk in OR samples, primarily mediated by WNT7B-(FZD2 + LRP5) and MDK-SDC1 pairs, which were significantly weaker in OS samples (Fig. 3C,D). We also observed reduced COL1A1-SDC1 and COL1A1-SDC4 interactions in the OS group. Together, these results suggest that enhanced CAF-tumor communication contributes to osimertinib resistance.
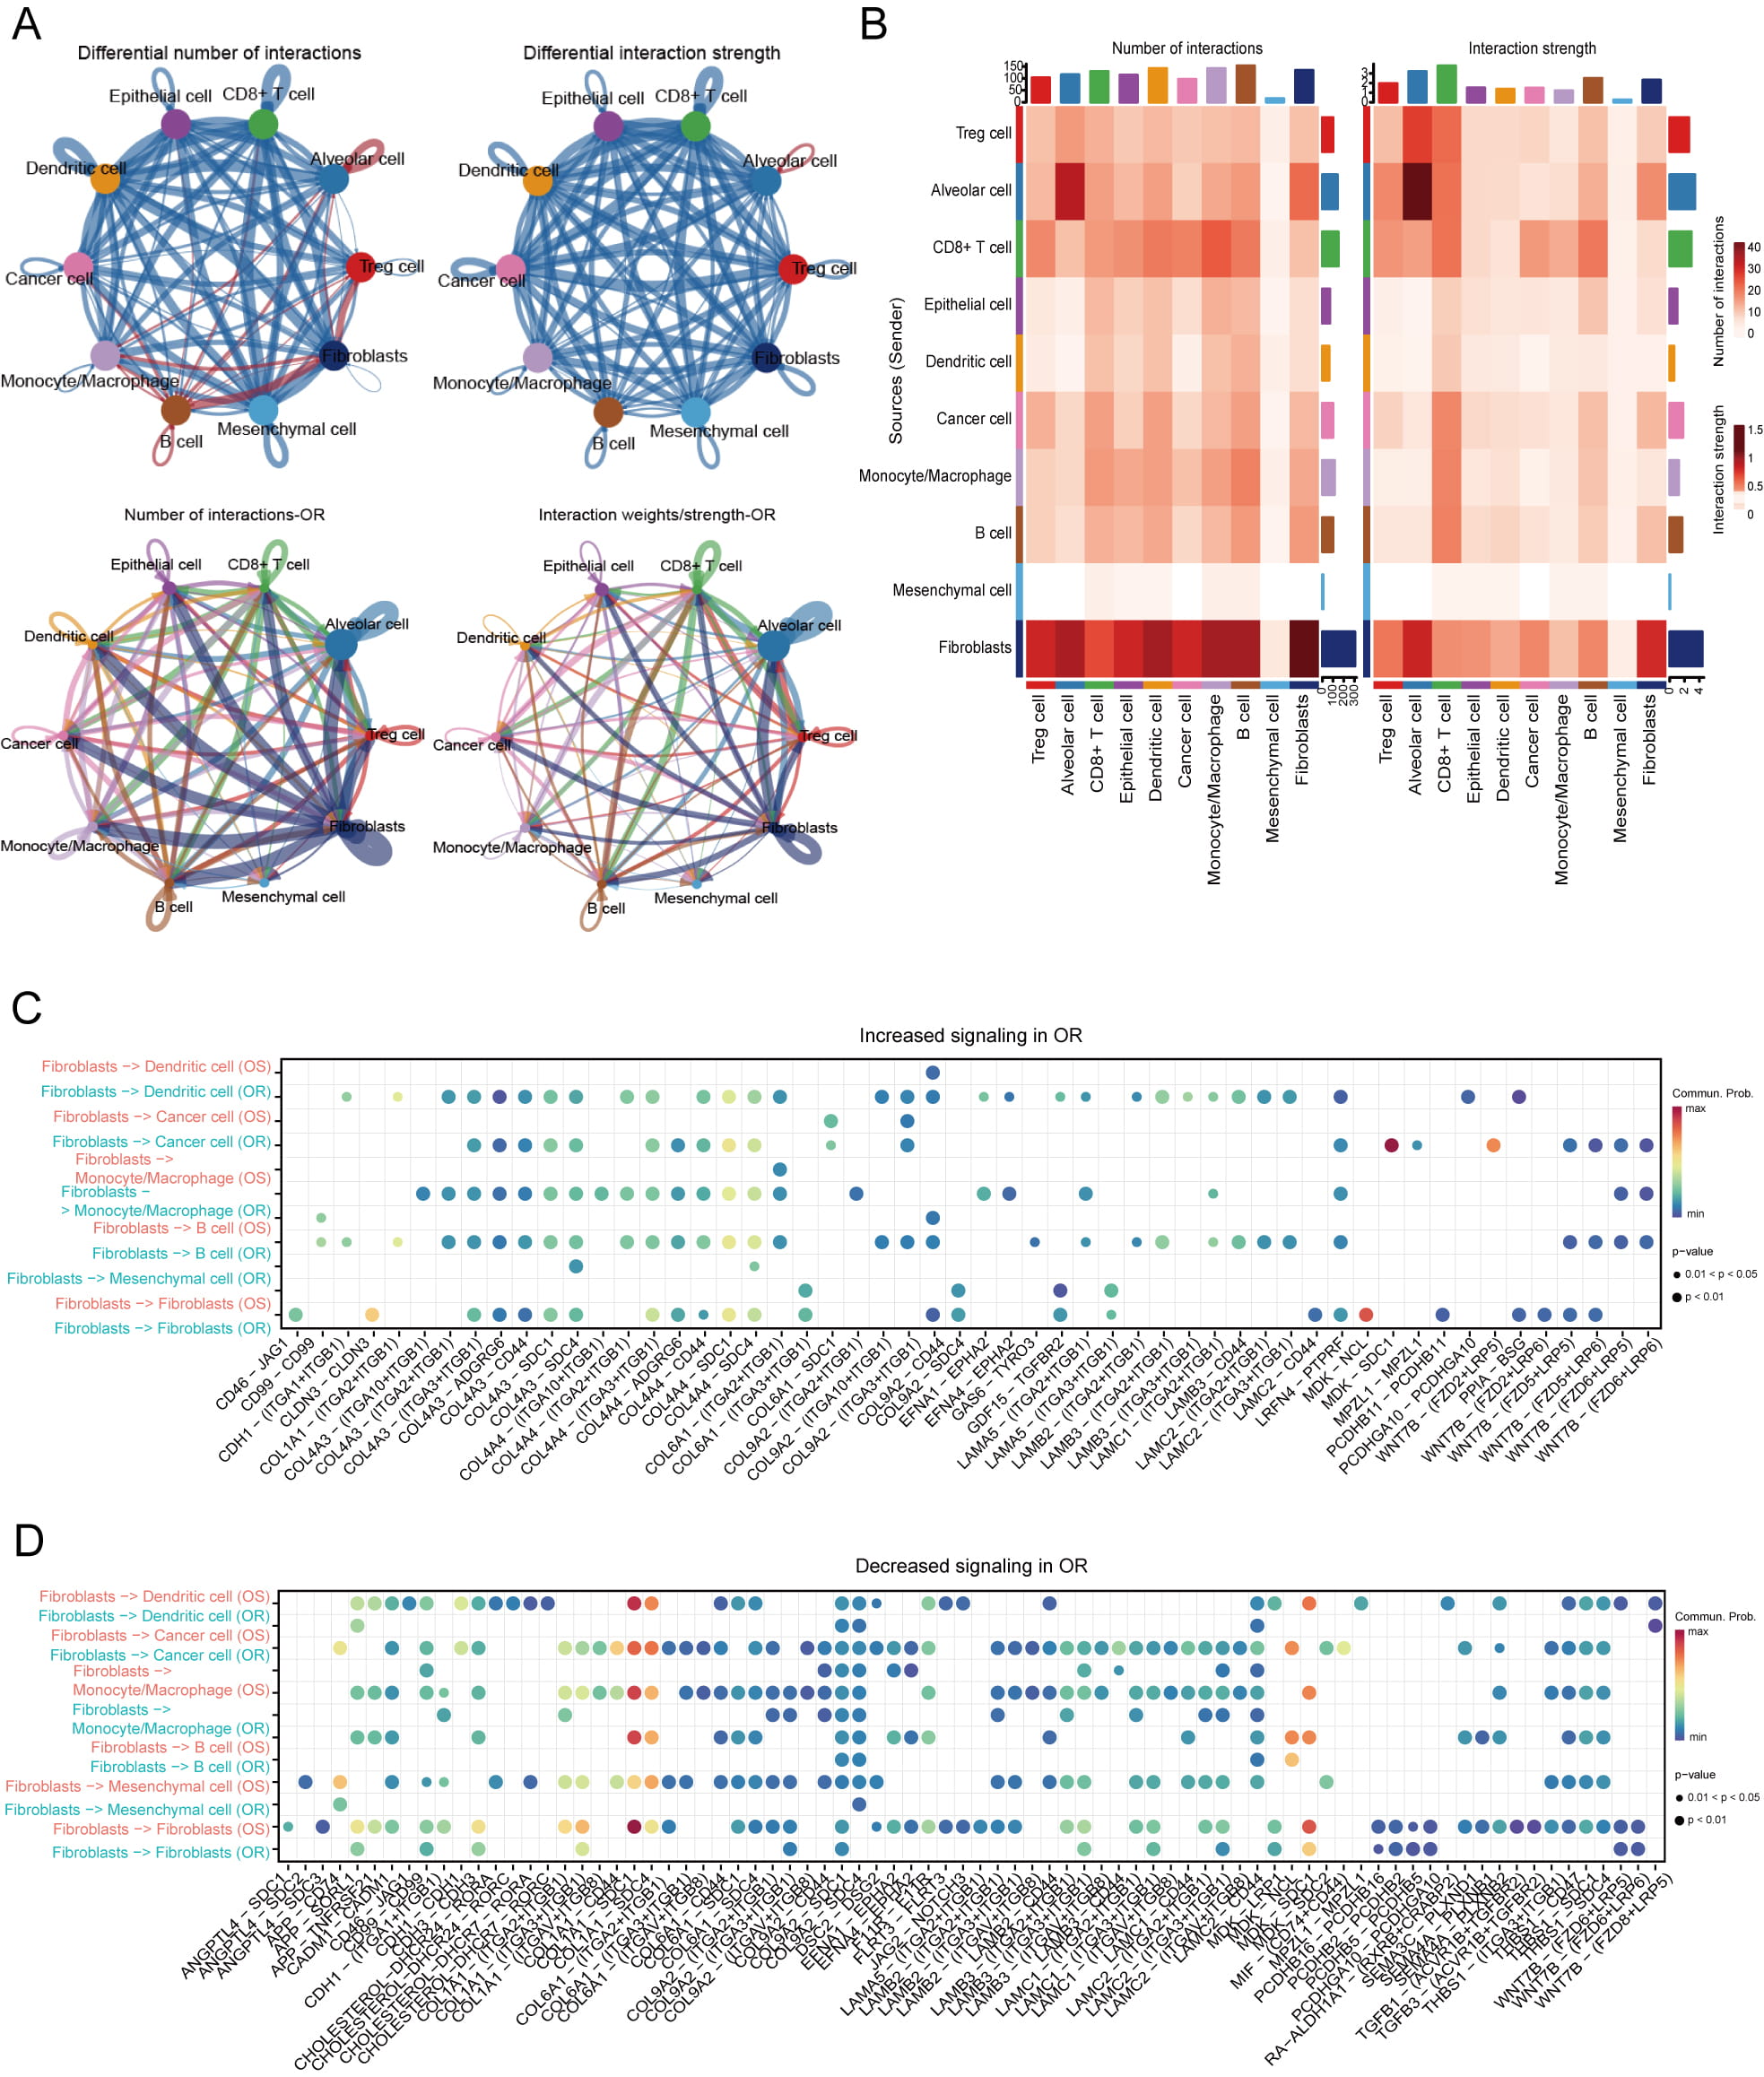 Fig. 3.
Communication between cells within OR clusters. (A) Communication networks and interactions among different cell types in OS and OR samples; OS is shown in the top row, OR is shown in the bottom row. (B) Cell‒cell communication is illustrated through the number of interactions (left) and the strength of those interactions (right). The blue blocks indicate down-regulated interactions, whereas the red blocks indicate up-regulated communication within the OR group. (C,D) Alterations in the interaction networks of receptor‒ligand interactions between fibroblasts and various other cell types were observed in both the OS and OR groups. The Y-axis denotes the cell types, whereas the X-axis illustrates the receptor‒ligand pairs.
We detected altered EGFR phosphorylation with concurrent increases in focal
adhesion kinase (FAK) and protein kinase B (AKT) phosphorylation in OR cells,
indicating potential EGFR-independent resistance mechanisms
(Supplementary Fig. 2A). OR-related DEGs were primarily associated with
ROS pathways (Supplementary Fig. 2B–D). By cross-referencing 149
OR-specific markers with 940 RRGs, we identified 10 DE-RRGs: ABCA1,
AGER, CYP2J2, FMO2, GSTA4, HSPA1B,
JUN, KLF2, SOD3, and VASN (Fig. 4A). Then, we
analyzed relationships among the 10 DE-RRGs (Fig. 4B). Significant positive
correlations (all p
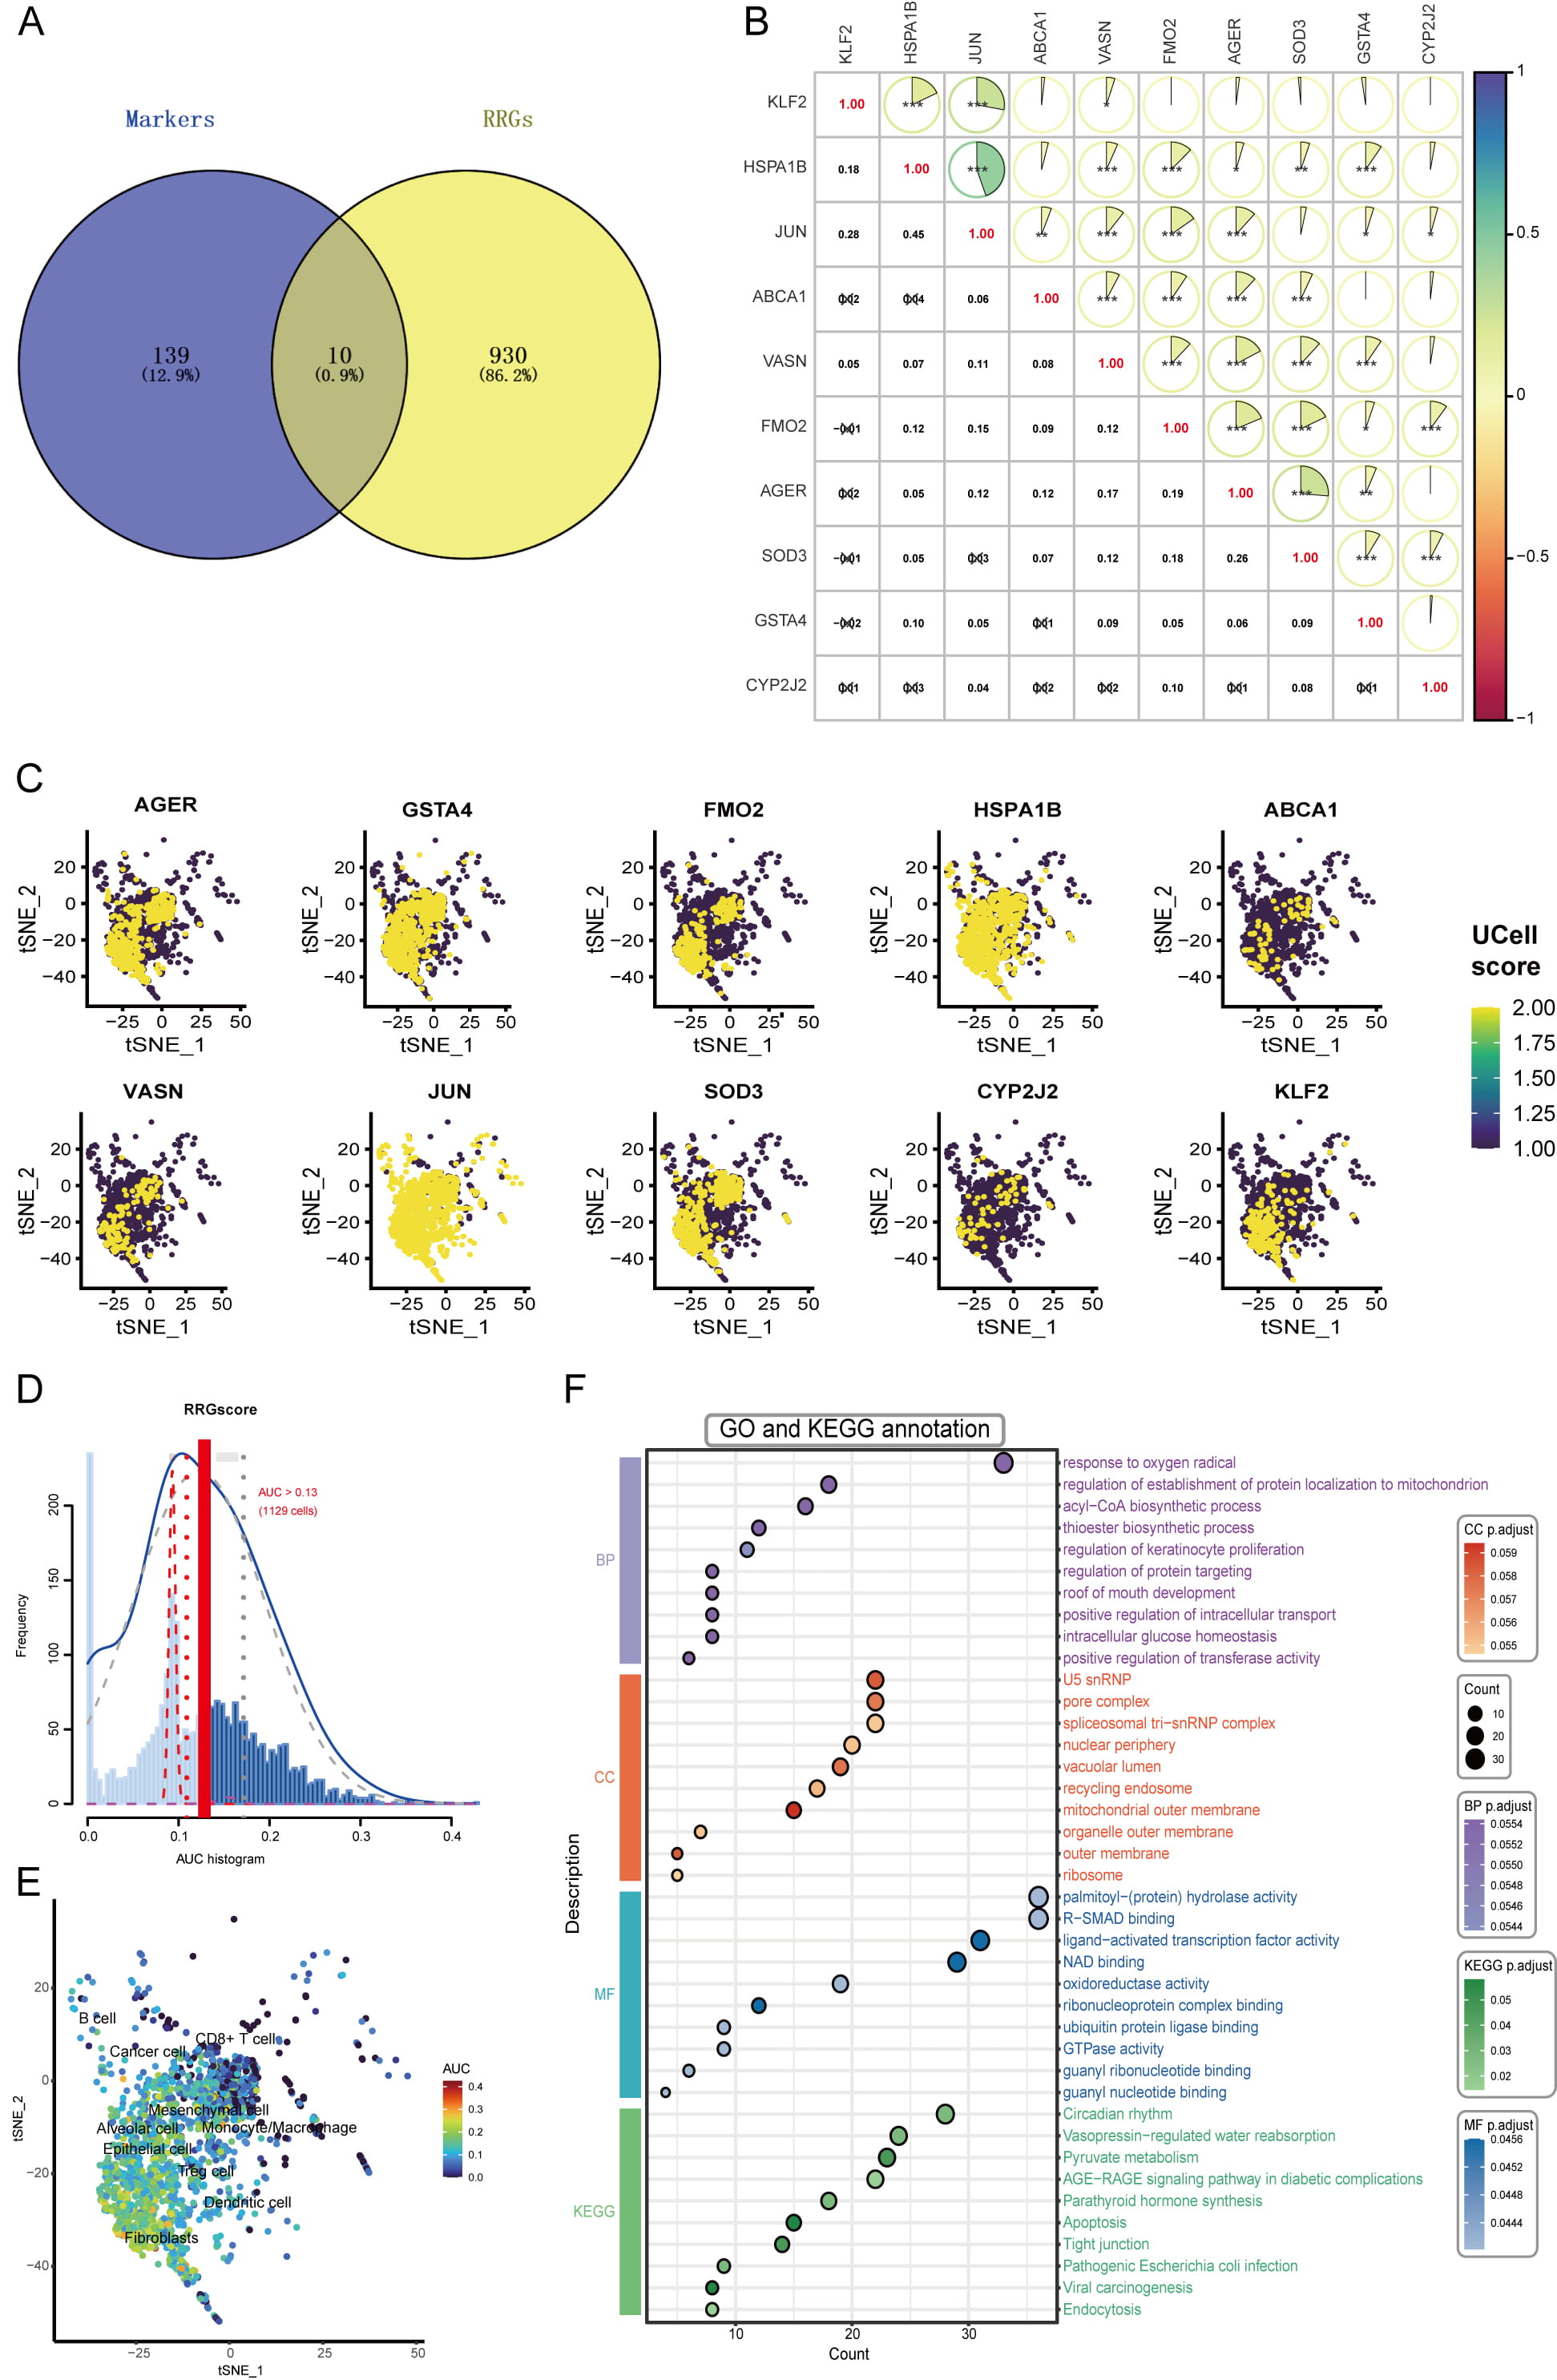 Fig. 4.
Identification of DE-RRGs and scoring. (A) Venn diagram
identifying DE-RRGs at the intersection of OR-specific markers and RRGs. (B)
Correlation analysis of the 10 identified DE-RRGs, displaying pairwise
correlation coefficients; *p
We isolated 187 CAFs and classified them into six distinct subtypes based on specific marker expression: KRT17 + mesCAFs, BRAP + Fib1, SLC35A5 + Fib2, PSMD9 + panCAFs, RPS3AP26 + Fib3, and CARD9 + iCAFs (Fig. 5A,B). Evaluation of the 10 DE-RRGs across these subtypes revealed ubiquitous expression of JUN and HSPA1B in all CAFs, while CYP2J2 showed minimal expression in any subgroup (Fig. 5C). Using computational trajectory inference, we modeled CAF differentiation through seven distinct states (color-coded in Fig. 5D). Pseudotime analysis indicated that differentiation proceeds from right to left, with darker blue hues representing earlier stages (Fig. 5F). The panCAFs emerged primarily at early differentiation stages and demonstrated potential to evolve into mesothelial CAF (mesCAFs) and other CAF types (Fig. 5E). Expression dynamics of the 10 DE-RRGs varied significantly along this differentiation trajectory (Fig. 5G). Throughout the differentiation trajectory, DE-RRGs such as CYP2J2, SOD3, and VASN gradually increased. In contrast, ABCA1, FMO2, and KLF2 displayed a decreasing trend. Additionally, AGER, GSTA4, HSPA1B, and JUN did not demonstrate any significant trend during the trajectory analysis.
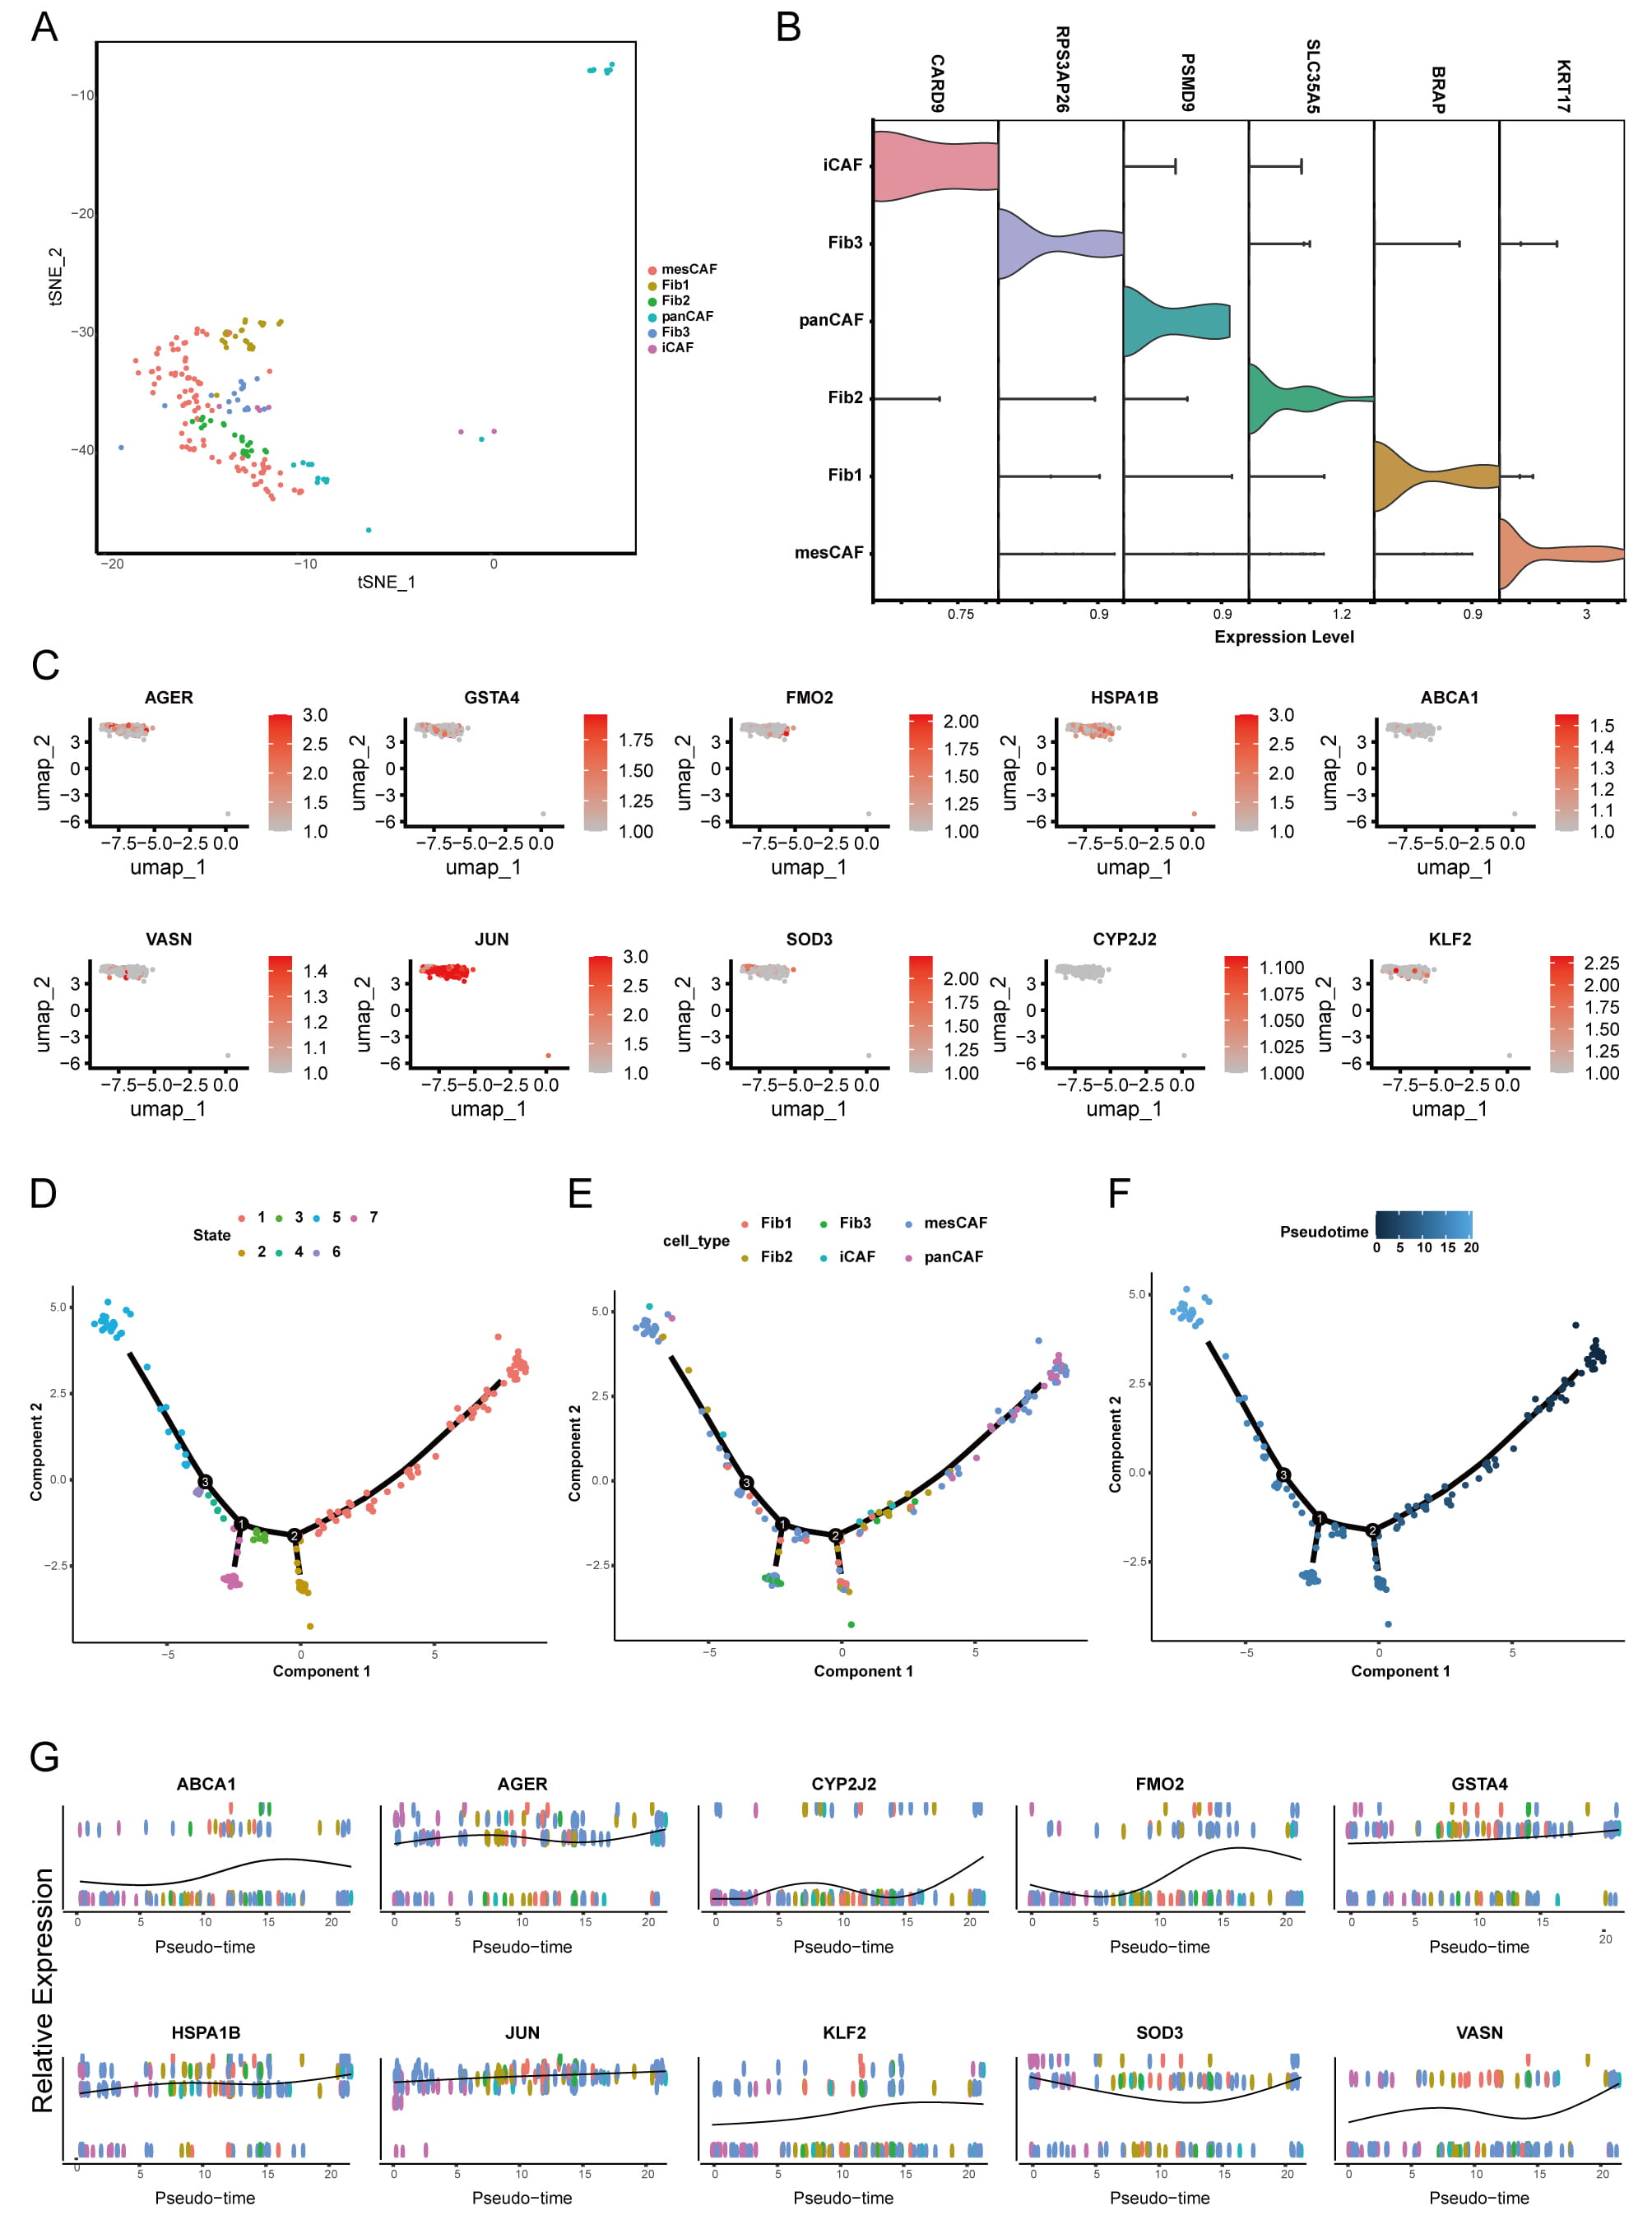 Fig. 5.
Analysis of CAF subdivision and trajectory assessment. (A) t-SNE visualizations depicting 6 distinct subpopulations of fibroblasts in the OR group. (B) Violin plots illustrating the expression levels of cellular markers across 6 distinct CAF subpopulations. (C) UMAP plots of 10 DE-RRGs across 6 CAF subpopulations. (D–F) Differentiation trajectory of CAFs, represented by their state (D), cell type (E), and pseudotime (F). (G) The expression profiles of 10 DE-RRGs throughout the differentiation pseudotime trajectory. UMAP, Uniform Manifold Approximation and Projection.
We analyzed bulk transcriptome data from 513 TCGA-LUAD patients, identifying
21,494 DEGs between tumor and normal adjacent tissues (14,884 upregulated and
6610 downregulated) visualized in a waterfall plot (Fig. 6A). Among these, we
identified 10 DE-RRGs shown in a heatmap (Fig. 6B). Using complete survival data
from 513 cases (Supplementary Table 4), univariate Cox regression
assessed the prognostic value of these DE-RRGs. Subsequent LASSO and multivariate
Cox analyses refined the signature to six genes (AGER, CYP2J2,
FMO2, HSPA1B, SOD3, VASN) and calculated
their risk coefficients (Supplementary Fig. 3A,B). The resulting risk
score formula was: risk score = (–0.048
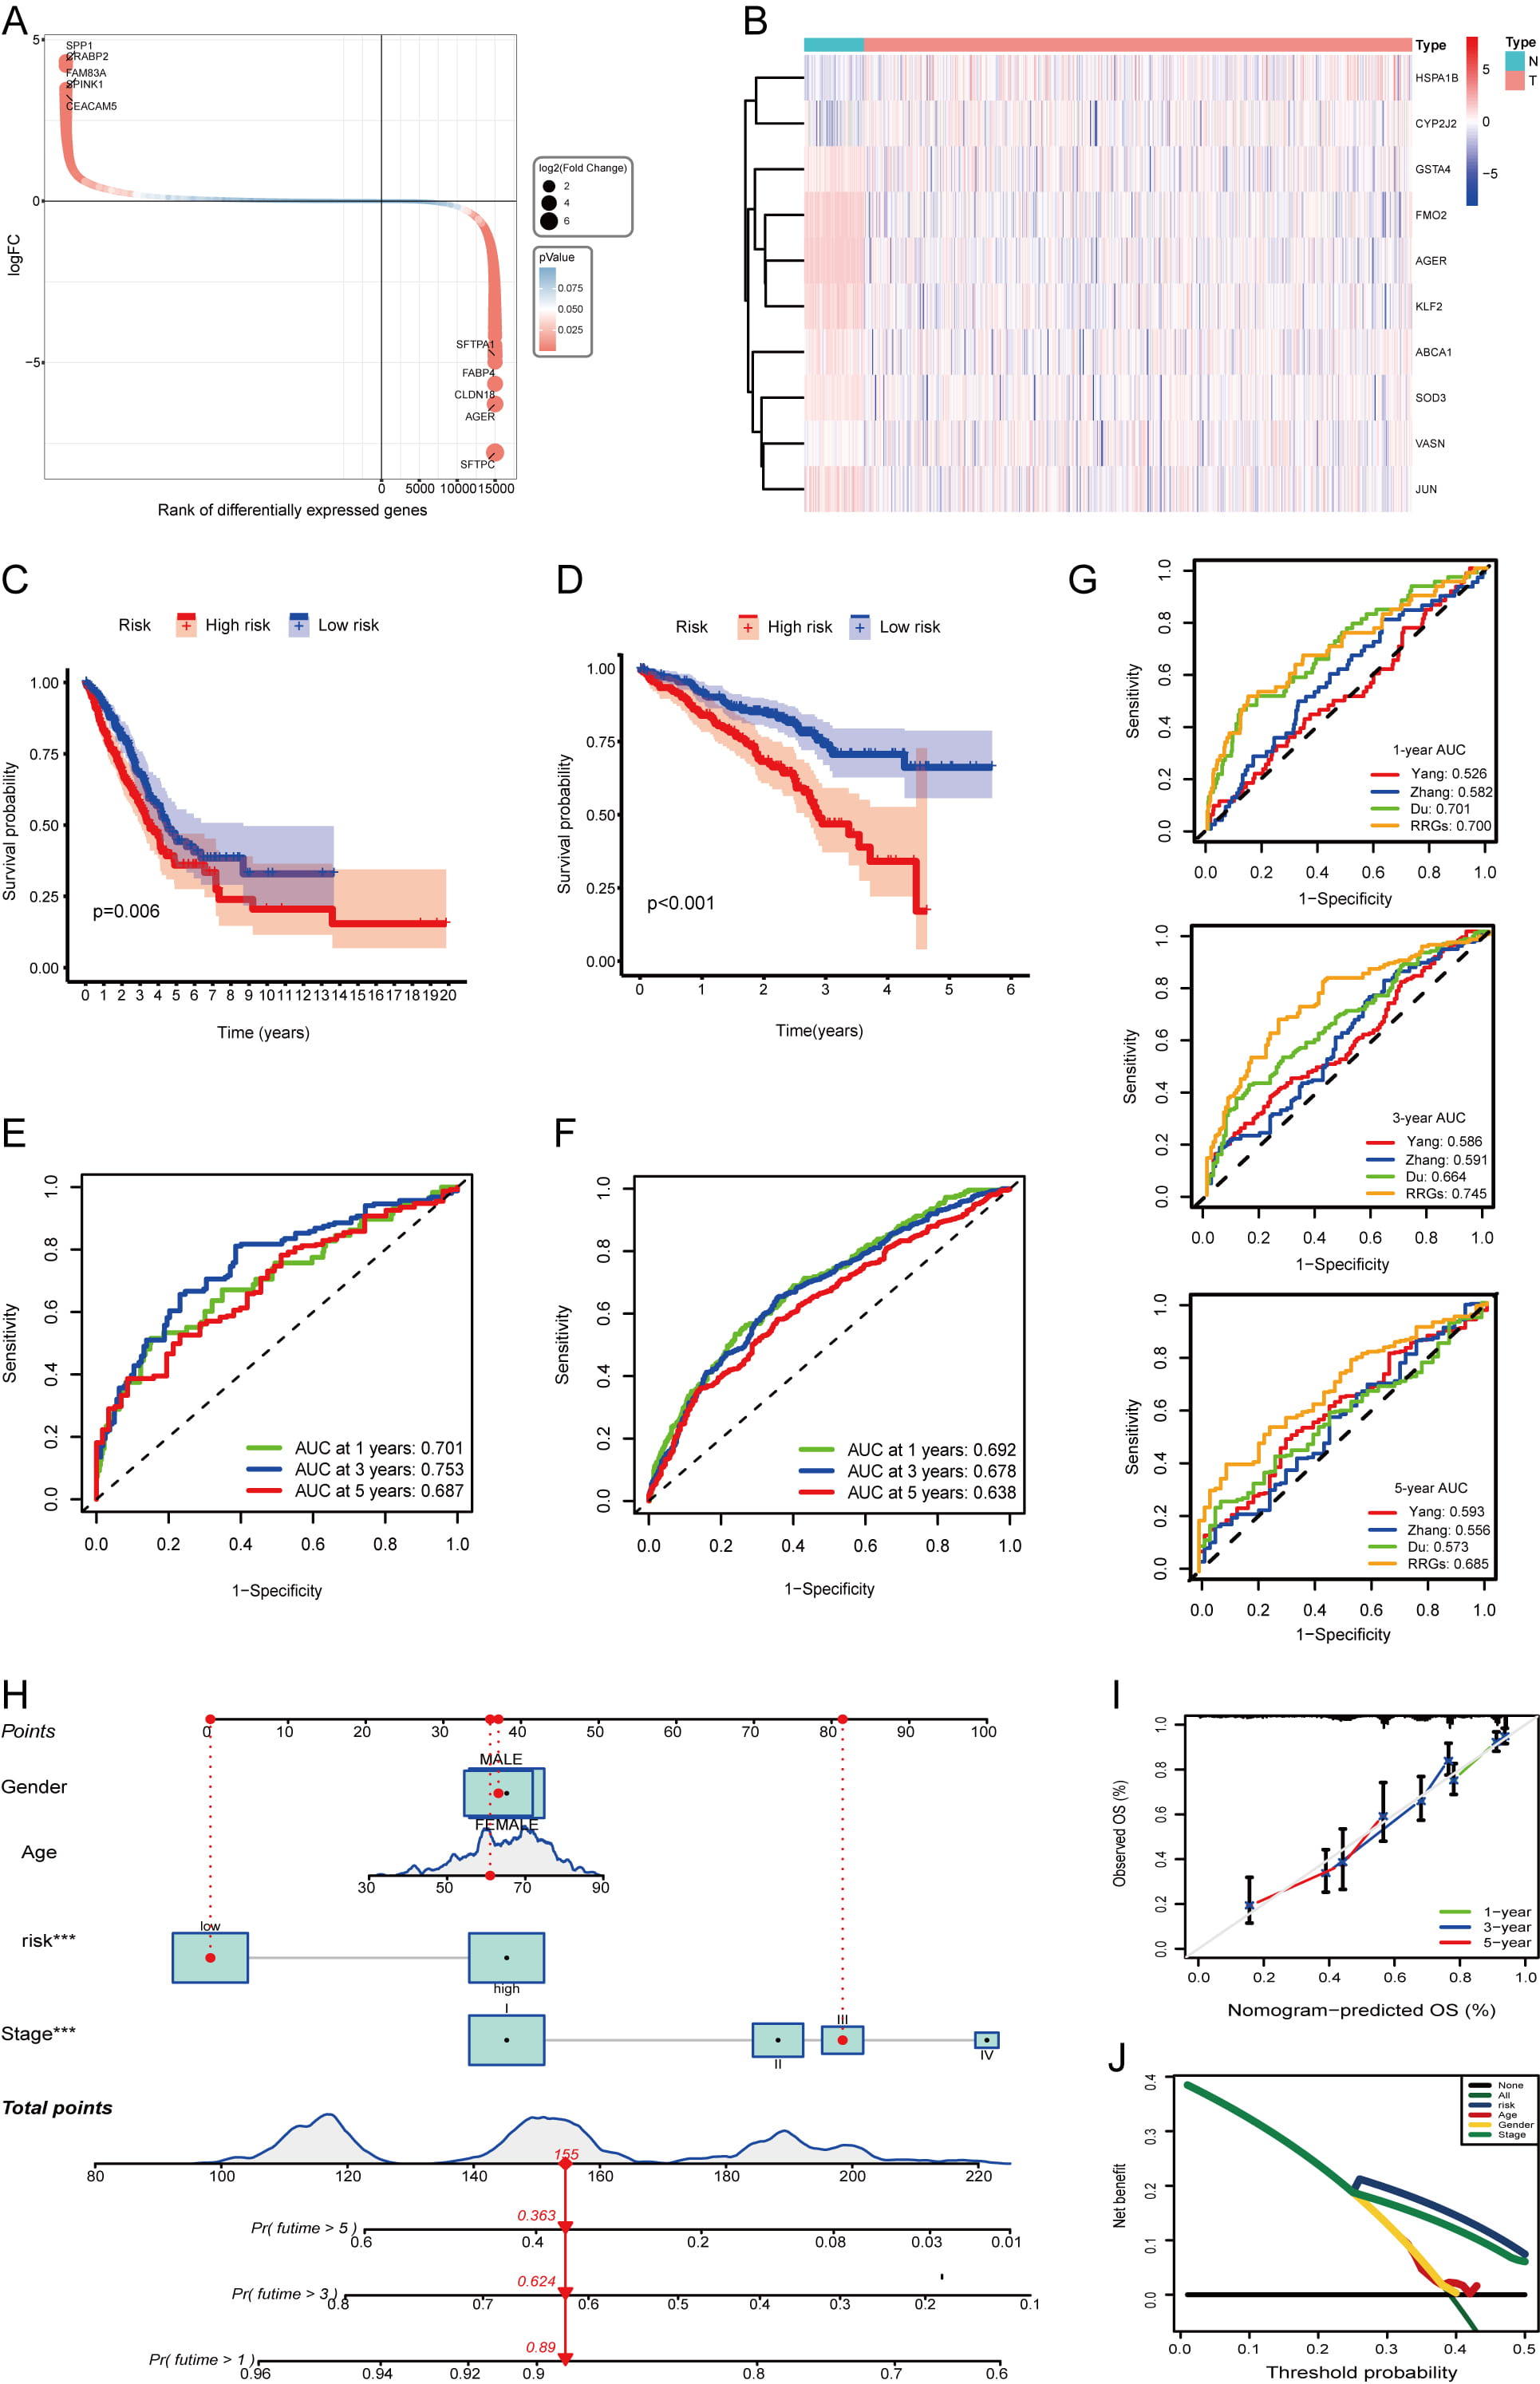 Fig. 6.
Construction and validation of the prognostic risk model. (A) Evaluation of the DEGs between the normal and tumor groups. Each gene is represented by a circle, with its color indicating the level of significance regarding the differences in expression. (B) Heatmap illustrating the expression of 10 DE-RRGs between normal and tumor samples derived from the TCGA-LUAD cohort. (C,D) K‒M curves illustrating the survival outcomes of patients categorized into two risk groups within the TCGA-LUAD cohort (C) and GSE72094 cohort (D). (E,F) The ROC curves were constructed to evaluate the survival rates at 1-year, 3-year, and 5-year intervals for the TCGA-LUAD cohort (E) and GSE72094 cohort (F). (G) Comparison of time-dependent area under the ROC curve among prognostic signatures at 1-, 3-, and 5-years in the TCGA-LUAD dataset. (H) The specifics of the nomogram are provided. (I) A calibration curve was generated to predict overall survival at 1, 3, and 5 years. (J) Evaluation of risk scores accuracy via DCA curves. ROC, receiver operating characteristic; K-M, Kaplan-Meier; DCA, decision curve analysis.
Survival differences between the two risk groups revealed significant genomic heterogeneity. To explore the underlying mechanisms, we performed GSEA analysis. High-risk patients showed activation of cell cycle, DNA replication, proteasome, ribosome, and spliceosome pathways, but suppression of asthma-related immunity, intestinal immune network, lupus erythematosus, and vascular smooth muscle contraction pathways (Fig. 7A,B). GO analysis confirmed that DEGs significantly affected tumor-promoting biological processes and cellular functions (Fig. 7C). KEGG analysis further confirmed the strong influence of these DEGs on key signaling pathways (Fig. 7D), ultimately explaining the prognostic differences observed in LUAD patients.
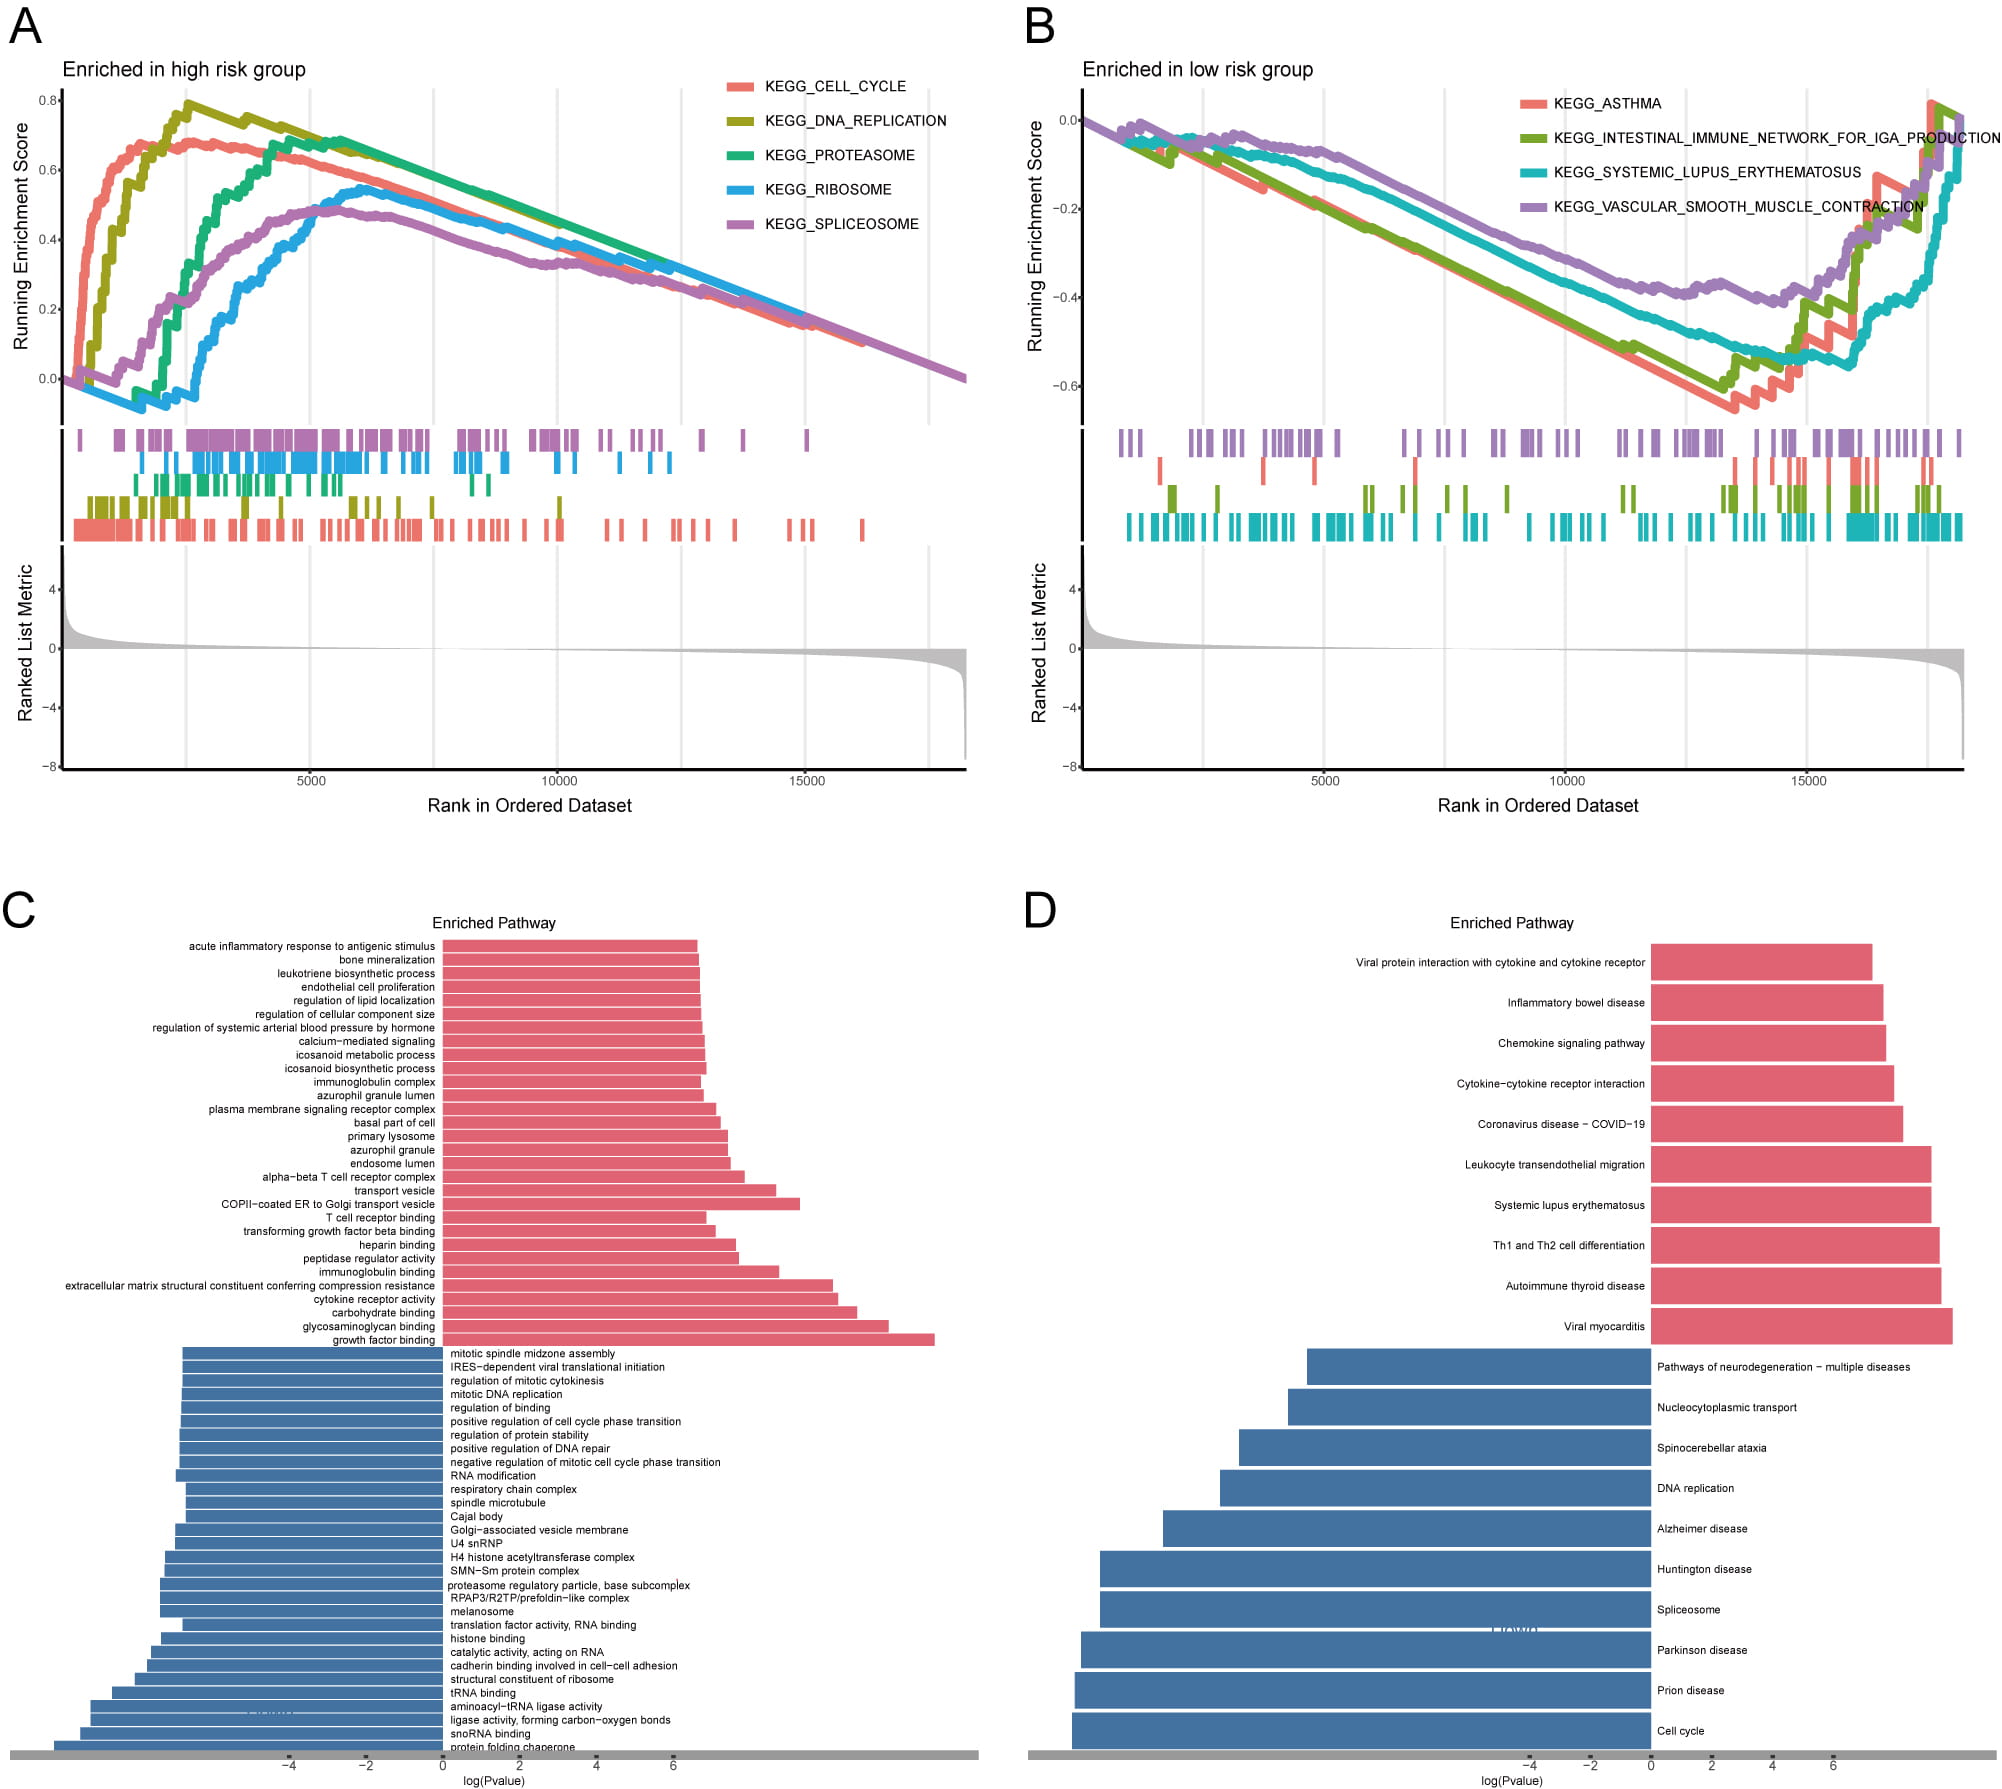 Fig. 7.
Enrichment analysis of DEGs across two risk cohorts. (A,B) The GSEA analysis of DEGs between the high- (A) and low-risk cohorts (B). (C,D) GO (C) and KEGG (D) analyses; red color represents the pathway enrichment analysis for genes that are upregulated, whereas blue denotes the pathway enrichment analysis for downregulated genes. GSEA, gene set enrichment analysis.
We next investigated the link between the risk signature and the tumor immune microenvironment. We observed an inverse correlation between risk score and immune clearance, but a positive correlation with immunosuppressive activity across multiple immune cell types. For example, CD8+ T cell levels were significantly higher in the low-risk group than in the high-risk group (Fig. 8A,B). Correlation analysis revealed distinct immune interaction patterns for the six prognostic RRGs (Fig. 8C). AGER, FMO2, SOD3, and VASN showed positive correlations with M2 macrophages and negative correlations with CD4+ T cell activation. Conversely, CYP2J2 and HSPA1B expression correlated negatively with neutrophil and plasma cell infiltration. These results confirm that the six RRGs critically shape the immune landscape in LUAD. We also examined single nucleotide variations between risk groups. In high-risk patients, TP53 (54%), TTN (53%), CSMD3 (44%), MUC16 (42%), and RYR2 (40%) showed the highest mutation frequencies (Fig. 9A). The same five genes showed the highest mutation frequency in the low-risk group, albeit in a slightly different order (Fig. 9B). Thus, we combined TP53 mutations and risk scores to predict LUAD patient prognosis. Regardless of TP53 status, high-risk patients exhibited markedly reduced survival (Fig. 9C). TMB positively correlated with risk score (Fig. 9D, Supplementary Fig. 4A). Moreover, our signature achieved higher AUC values than TMB in the TCGA cohort (Supplementary Fig. 4B). Finally, the high-risk group exhibited higher GISTIC scores and more frequent amplification and deletion events than the low-risk group (Fig. 9E).
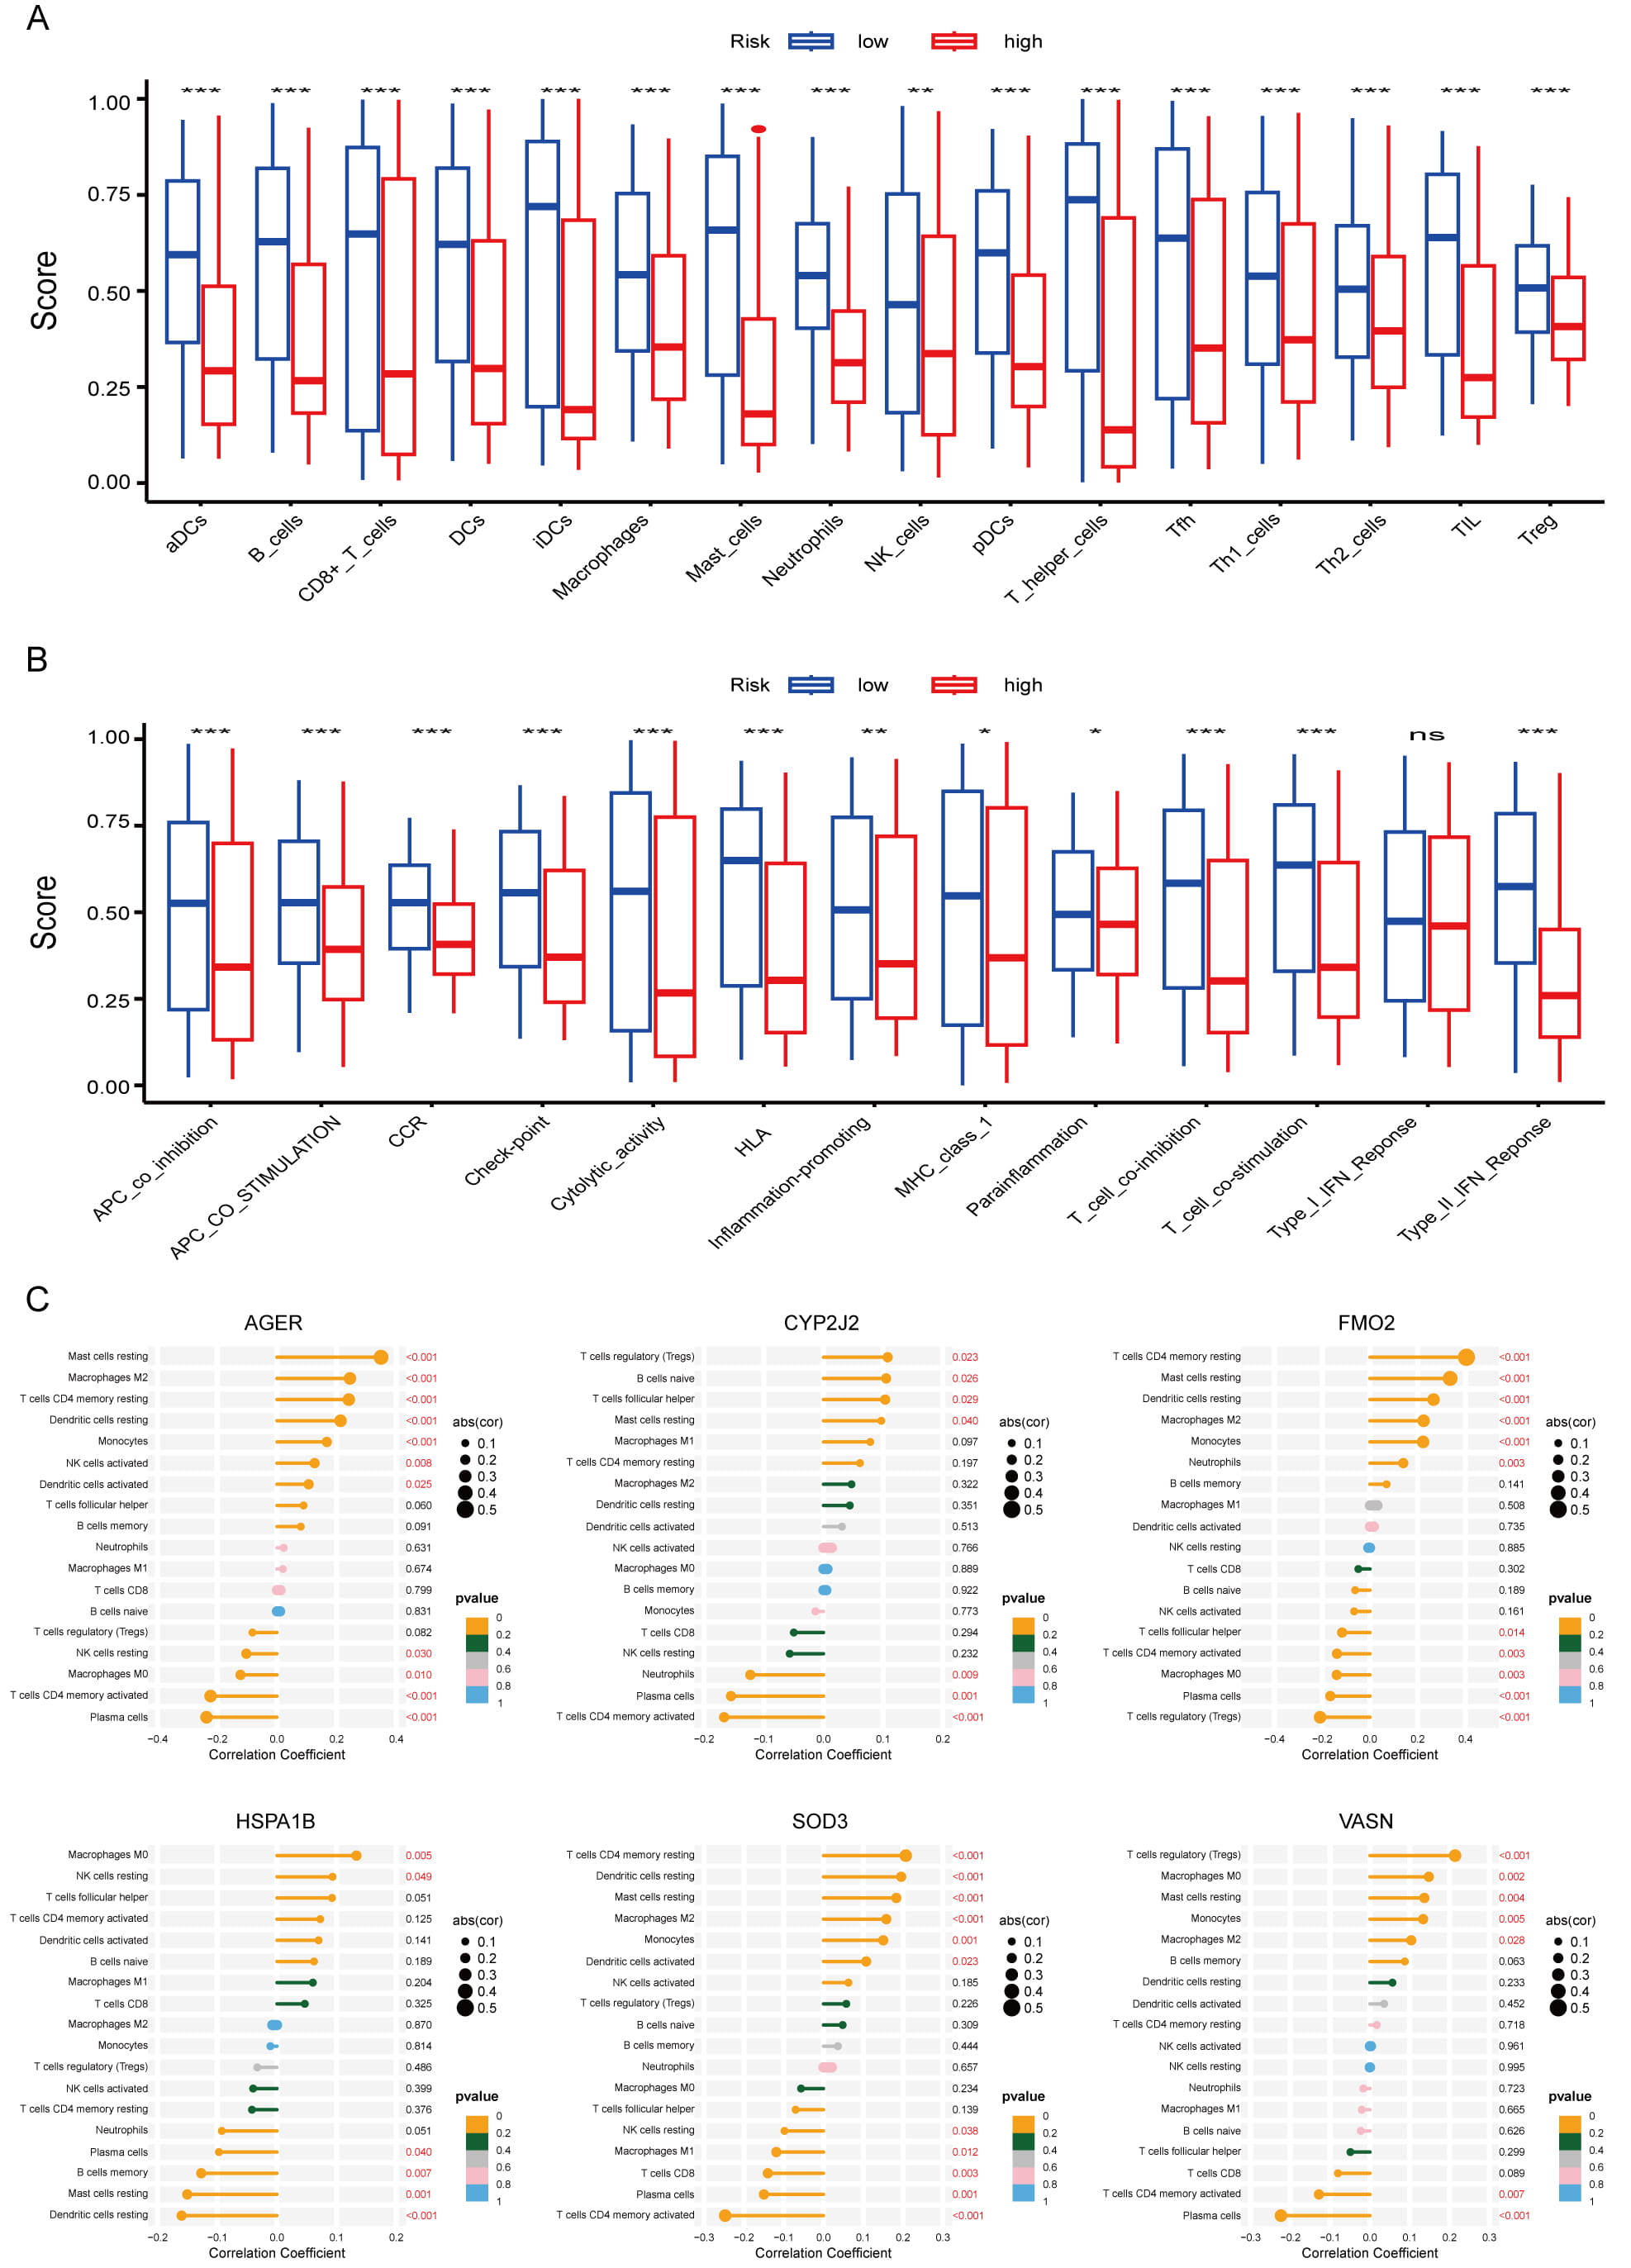 Fig. 8.
Analysis of immune microenvironment in LUAD. (A,B) Differences
in immune infiltration between the high- and low-risk cohorts; *p
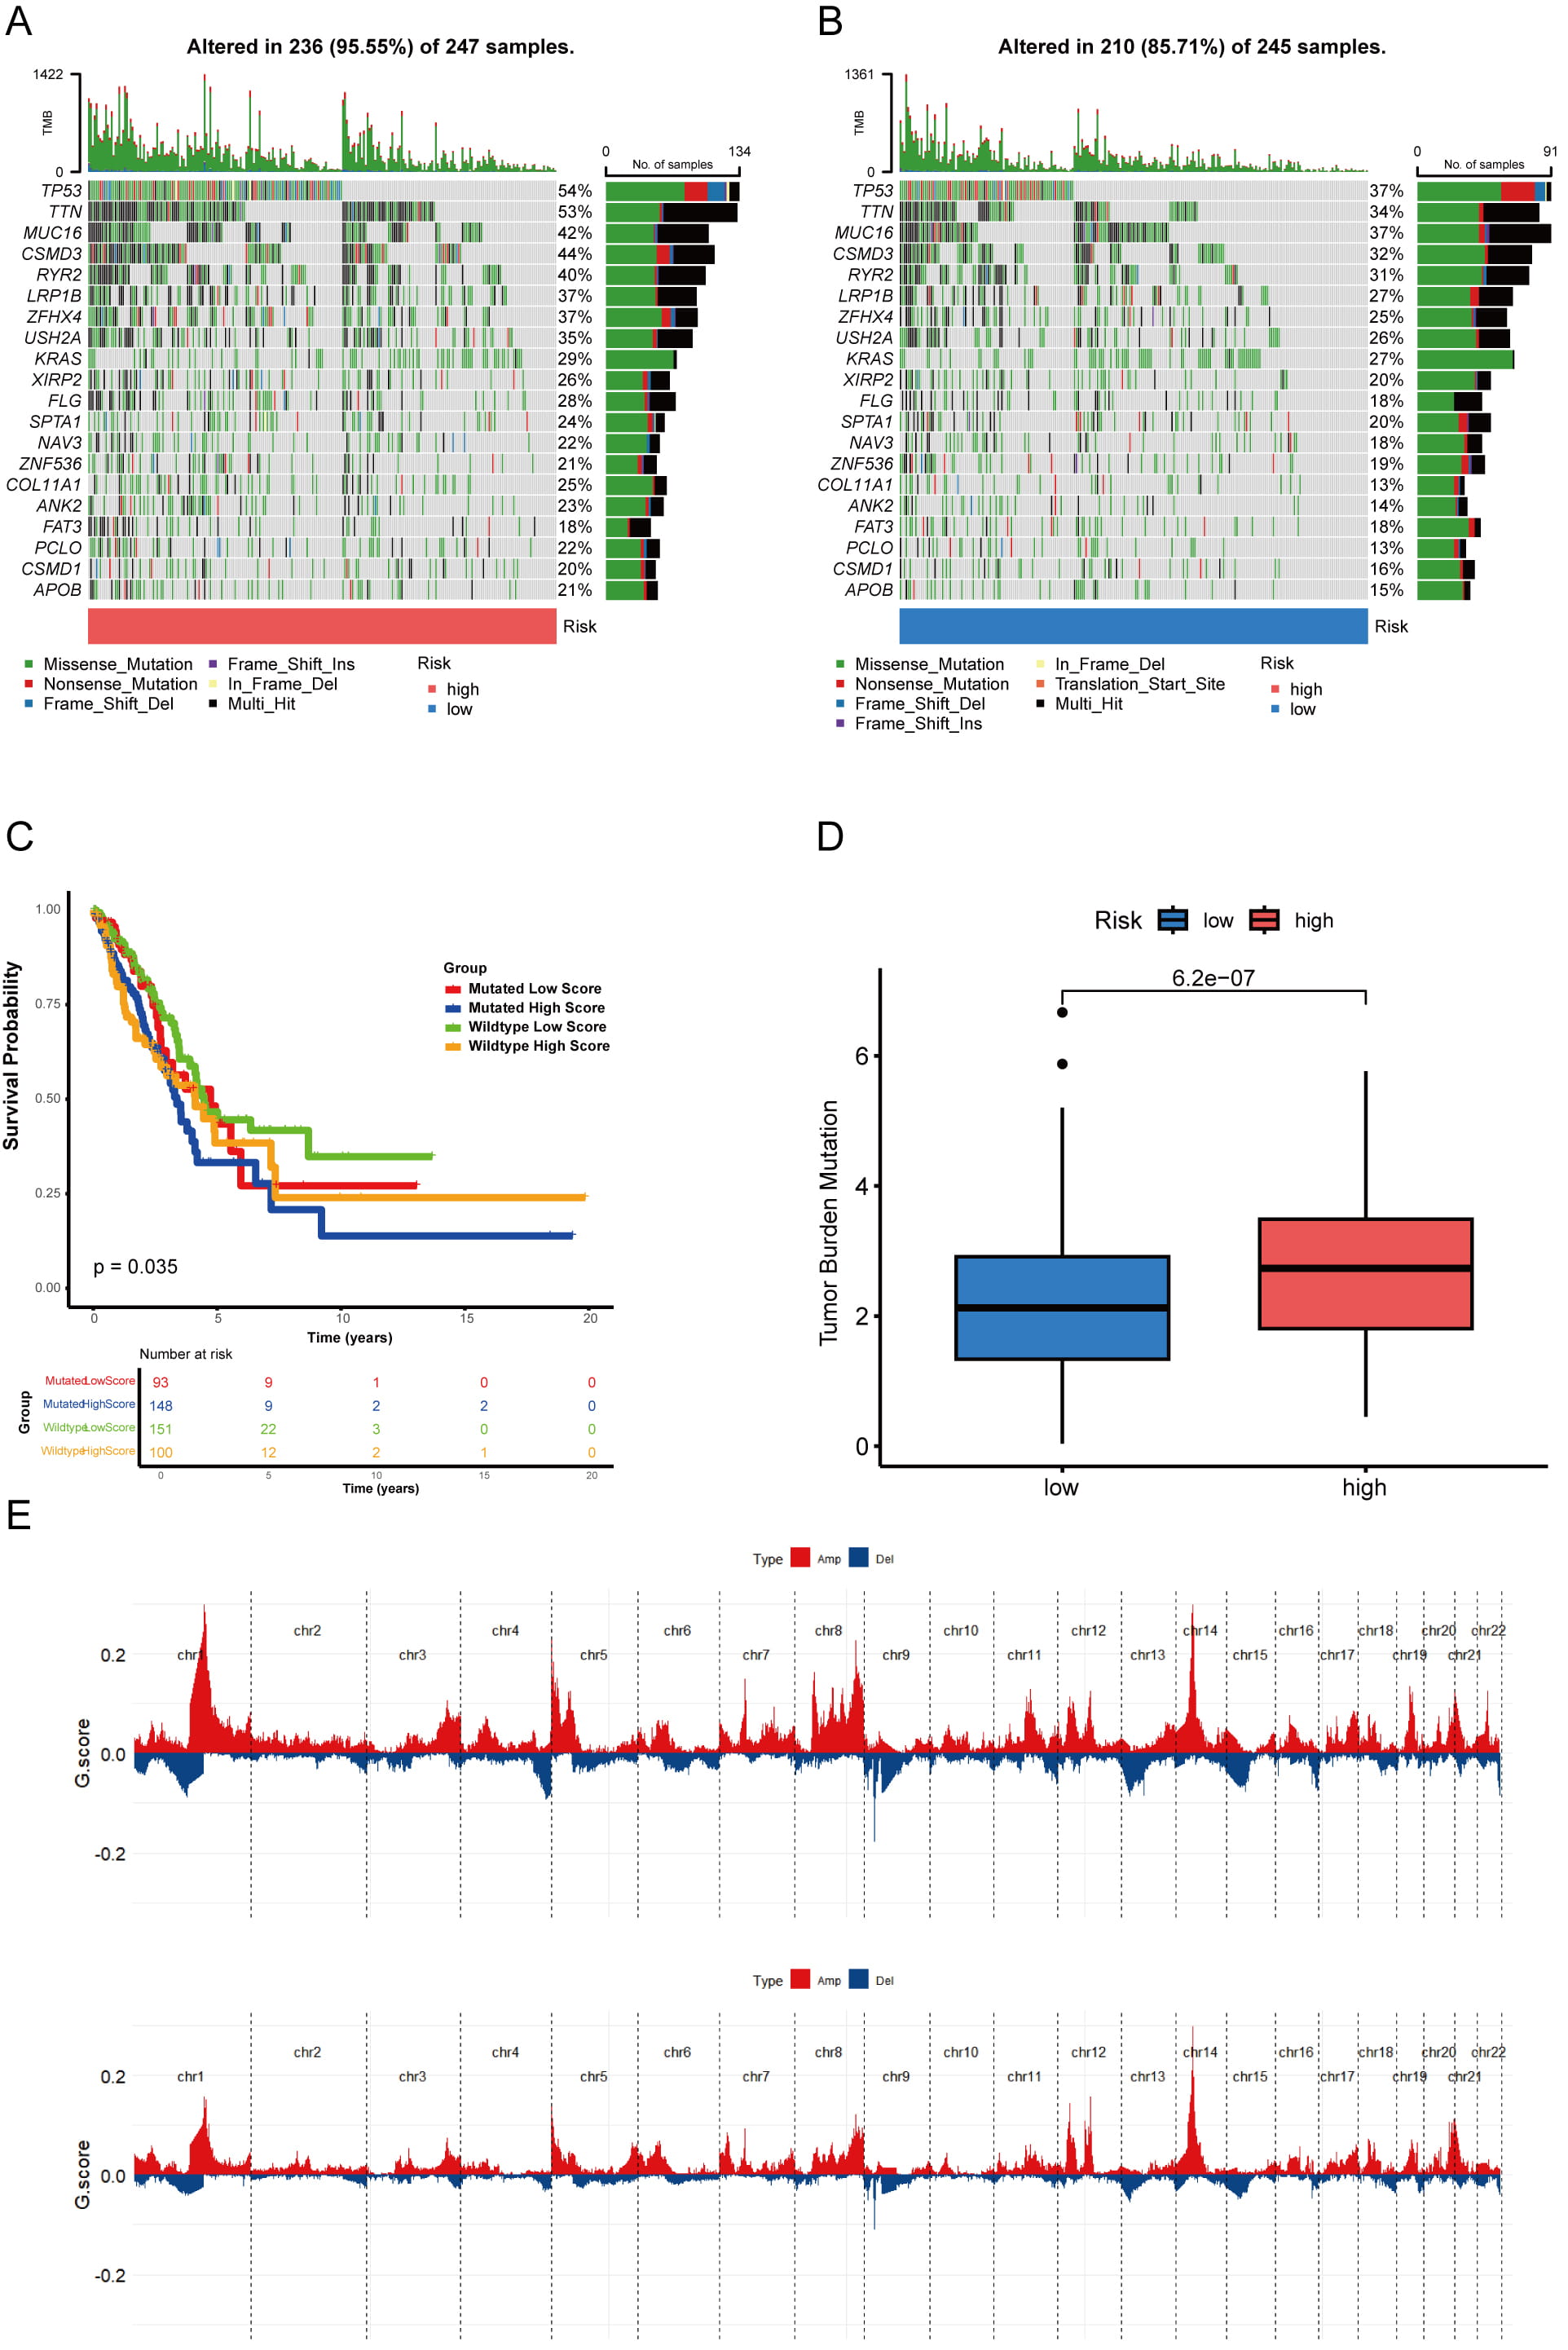 Fig. 9.
Analysis of gene mutations in LUAD. (A,B) A waterfall chart displaying somatic mutations in both the two risk cohorts. (C) K‒M curves for TCGA-LUAD patients based on the integration of risk scores and TP53 mutation. (D) Comparison of the TMB between groups categorized into two risk groups. (E) Analysis of copy number variations in two distinct risk groups; amplification mutations are indicated by red lines, whereas blue lines denote deletion mutations.
Our molecular docking analysis identified six small-molecule inhibitors targeting prognostic RRGs. Rotenone effectively bound AGER (–6.4 kcal/mol) and decreased its mRNA expression (Fig. 10A). MRK003 showed strong binding to CYP2J2 (–10.1 kcal/mol; Fig. 10B), while lutein effectively targeted FMO2 (–9.5 kcal/mol; Fig. 10C). Methotrexate (MTX) emerged as a potent binder of HSPA1B (–10.8 kcal/mol; Fig. 10D). Epigallocatechin gallate (EGCG) bound SOD3 with high affinity (–7.4 kcal/mol; Fig. 10E), reduced its protein levels (Supplementary Fig. 5A,B), and exhibited an IC50 of 25.91 µM in HCC827/OR cells. Sunitinib efficiently targeted VASN (–8.2 kcal/mol) and suppressed its expression (Fig. 10F). Together, these compounds provide a targeted therapeutic strategy against osimertinib-resistant NSCLC.
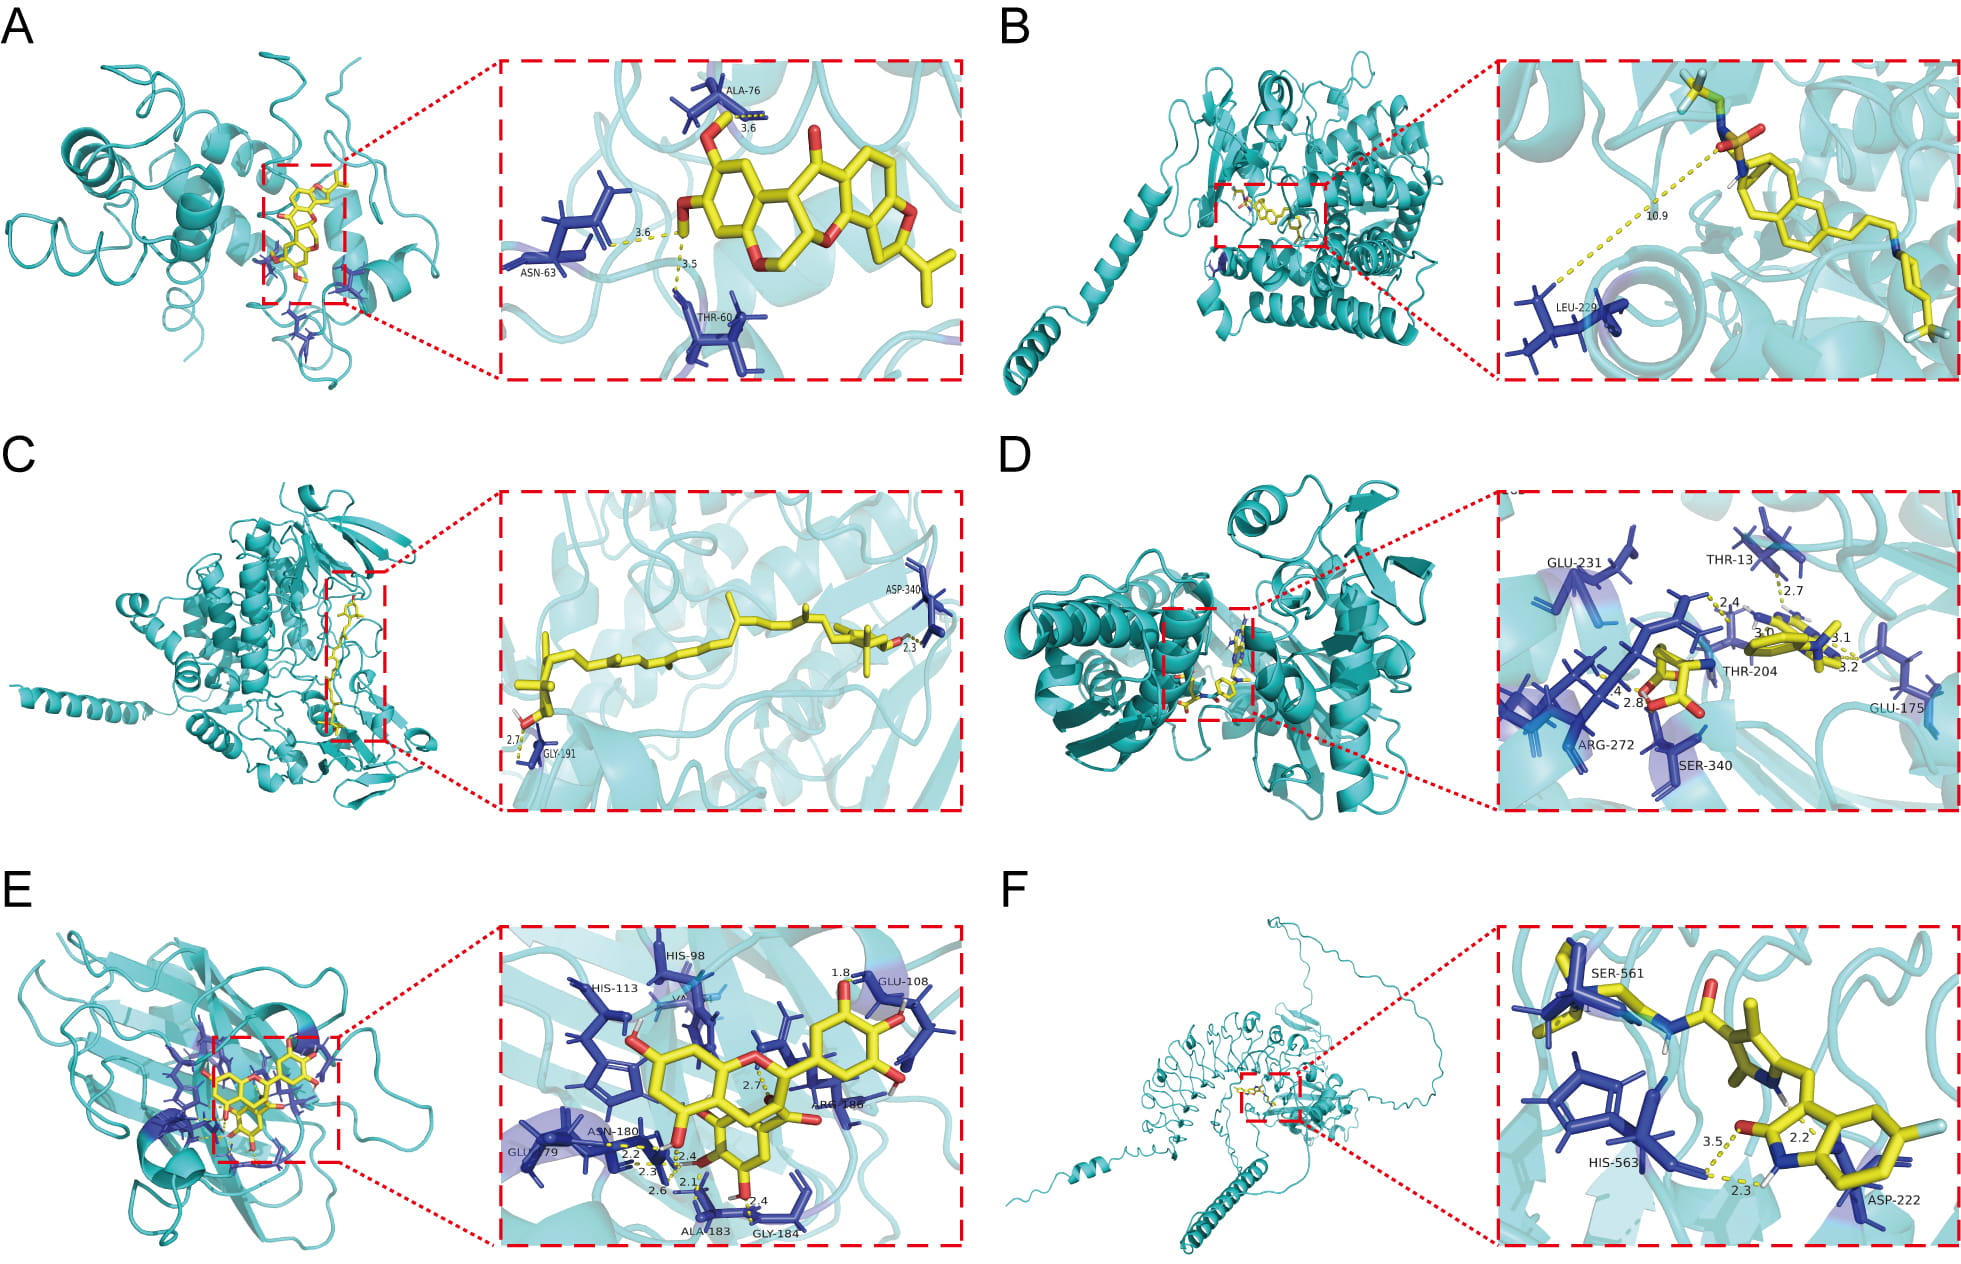 Fig. 10.
Small-molecule docking to prognostic DE-RRGs. (A) Docking analysis of AGER in conjunction with rotenone. (B) Docking analysis of CYP2J2 in conjunction with MRK003. (C) Docking analysis of FMO2 in conjunction with lutein. (D) Docking analysis of the interaction of HSPA1B. (E) Docking analysis of SOD3 in conjunction with epigallocatechin gallate. (F) Docking analysis of VASN in conjunction with sunitiib.
We evaluated mRNA expression of the six candidate genes in osimertinib-resistant
and parental cell lines. All six genes showed significantly higher mRNA levels in
resistant cells than in parental controls (p
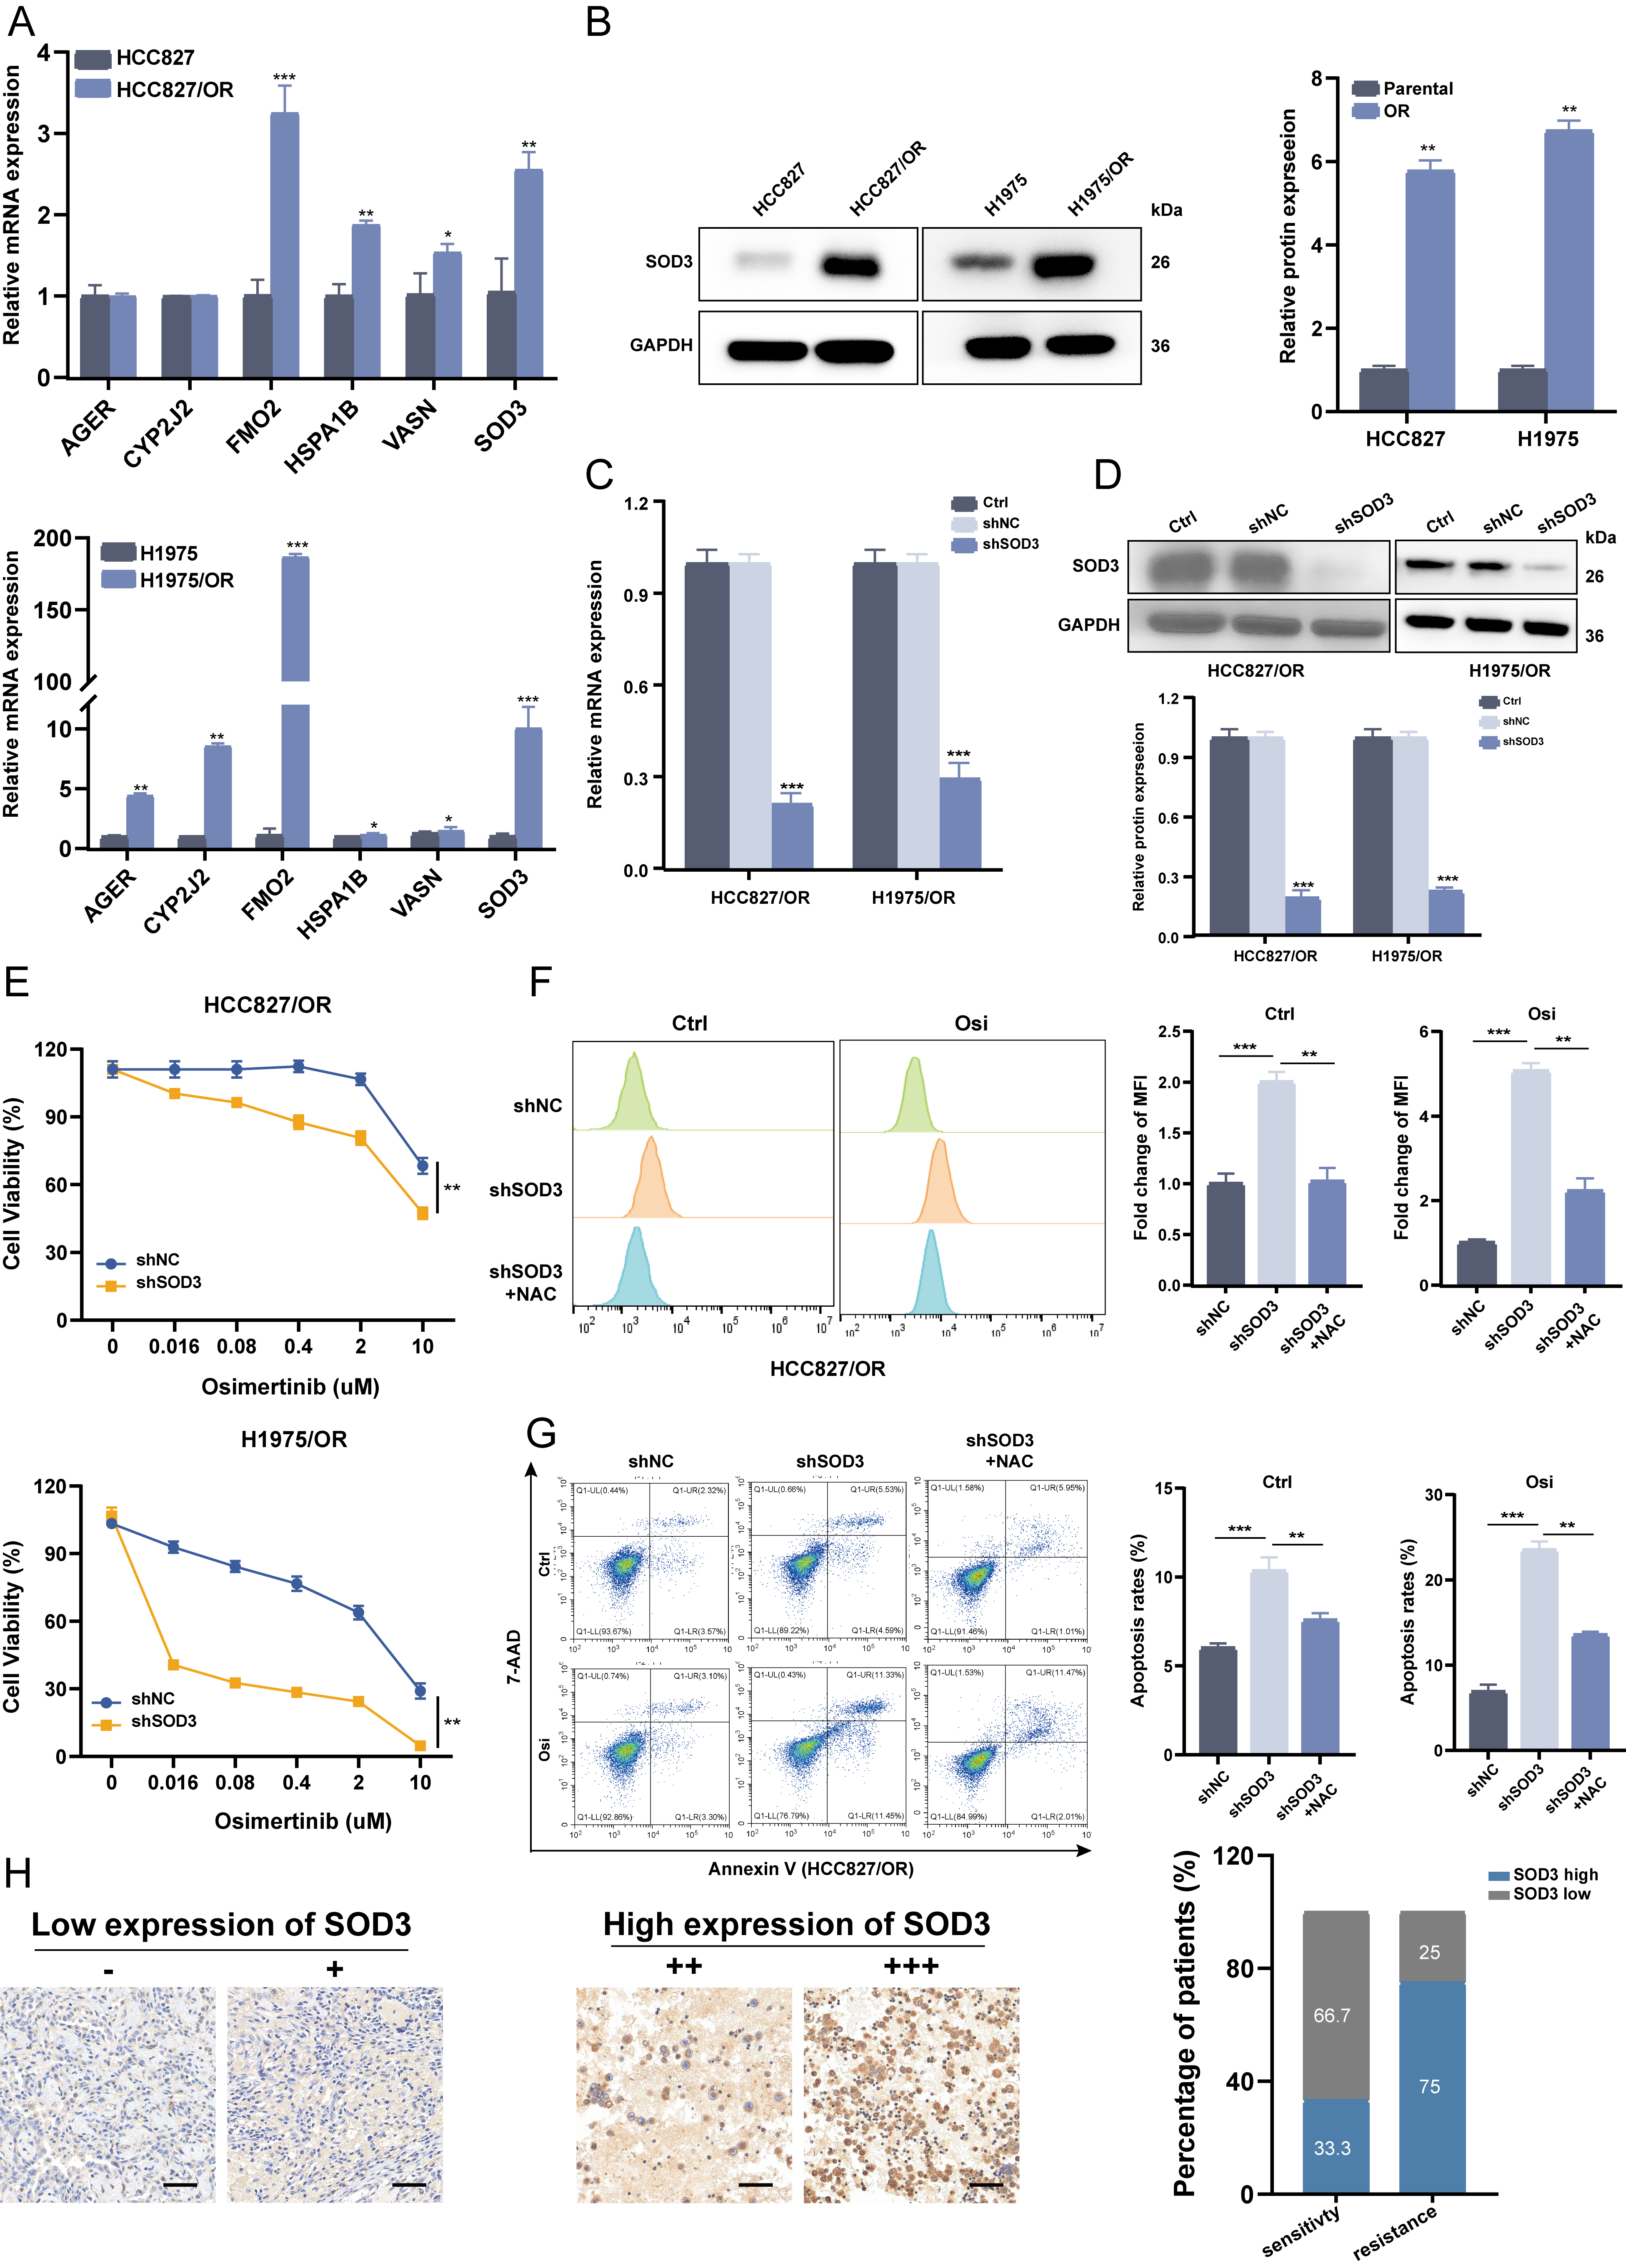 Fig. 11.
Knockdown of SOD3 restored osimertinib sensitivity in
vitro. (A) RT-qPCR was used to assess the mRNA expression of the 6 DE-RRGs in
HCC827/OR, H1975/OR and their parental cells. (B) Immunoblot analysis of SOD3
proteins was performed on HCC827/OR cells and their parental counterparts, with
representative images obtained from three independent experiments. (C,D)
HCC827/OR and H1975/OR cells were transfected with SOD3 shRNA or shNC, and the
expression of SOD3 was measured by RT-qPCR (C) and western blotting (D). (E) The
viability of HCC827/OR and H1975/OR cells treated with osimertinib was determined
by CCK-8 assay after SOD3 knockdown. Data are shown as the mean
Osimertinib, a third-generation EGFR-TKI, serves as the first-line treatment for EGFR-mutant LUAD. However, acquired resistance remains the primary cause of treatment failure [23, 24]. Early detection and effective counterstrategies are crucial to improve patient outcomes. Thus, identifying novel biomarkers that predict prognosis and therapeutic benefits in osimertinib-treated LUAD patients is critically needed.
Oxidative stress, driven by ROS generation, promotes cancer progression and
treatment resistance by disrupting genomic stability and altering signaling
pathways [25, 26]. Moderate ROS levels can activate key oncogenic pathways, such as
nuclear factor kappa-B (NF-
We analyzed scRNA-seq data from matched OS- and OR-PDX models. The OR group exhibited a higher abundance of CAFs, corroborating prior reports [30]. Cell communication analysis revealed a remodeled interaction network in resistant tumors, with strengthened contacts among Tregs, epithelial cells, CAFs, and tumor cells, notably via the peptidylprolyl isomerase A-basigin (PPIA-BSG) axis, which Liu et al. [31] implicated in lung cancer metastasis. CAFs displayed especially enhanced crosstalk with multiple cell types in OR samples. Key hyperactivated ligand-receptor pairs included midkine-syndecan 1 (MDK-SDC1), known to induce immunosuppressive macrophages [32, 33], and WNT7B-(FZD2 + LRP5), which promotes tumor progression [34].
We also identified 10 DE-RRGs and assigned RRG activity scores to individual cells. High-scoring cells localized predominantly to CAF clusters, consistent with established roles of CAFs in driving osimertinib resistance through secreted factors like IL-6, periostin, hepatocyte growth factor (HGF), and insulin-like growth factors (IGFs) [35, 36, 37, 38]. Given substantial CAF heterogeneity—including inflammatory CAFs (iCAFs) that recruit immune cells via Eotaxin-1 (CCL11)/Chemokine (C-X-C Motif) Ligand 12 (CXCL12) and matrix-producing CAFs (mCAFs) that overexpress ECM-remodeling genes (like matrix metalloproteinase 11 (MMP11) and collagen type I alpha 1 (COL1A1)) [39]—we classified CAFs into six distinct subtypes. Pseudotime analysis indicated that panCAFs arise early and may differentiate into other CAF subtypes, paralleling findings in cholangiocarcinoma [40]. During this process, ABCA1, FMO2, and KLF2 were downregulated, while CYP2J2, SOD3, and VASN were upregulated, suggesting these RRGs help regulate CAF differentiation. We propose that these DE-RRGs operate during early CAF differentiation to enhance intercellular communication, thereby fostering metastasis, resistance, and disease progression. CAFs, as central components of the mesenchymal tumor microenvironment, may thus supply biomarkers, such as specific RRGs or their products, for predicting osimertinib resistance. Further studies should clarify the functional mechanisms of specific CAF subpopulations and RRGs in acquired resistance.
Using parallel scRNA-seq and bulk transcriptome data, we constructed a robust prognostic model based on six DE-RRGs. This model effectively stratified LUAD patients into distinct survival groups. Differential pathway activation revealed potential mechanisms underlying these survival disparities. High-risk scores associated with an immunosuppressive, tumor-progressive microenvironment, whereas low-risk scores indicated a more tumor-suppressive milieu. Incorporating TMB further improved prognostic accuracy. Mutation profiles also differed significantly between risk groups, suggesting these patterns could help guide personalized therapeutic strategies for LUAD patients.
Our findings reveal that these genes above are significantly up-regulated to
varying degrees in LUAD-OR cell lines, indicating possible role in acquired
EGFR-TKIs resistance. AGER binds toll-like receptor 4 (TLR4) and mediates
AGE-RAGE signaling, contributing to diabetic angiopathy and thymic hyperplasia.
Previous studies indicate that AGER overexpression suppresses proliferation,
invasion, and migration in H1299 cells, suggesting a protective role in LUAD with
significant prognostic value [41]. However, we found AGER positively
correlates with M2 macrophage infiltration (p
Drug repurposing represents an innovative therapeutic strategy enabled by
deepening mechanistic insights into disease pathogenesis. Exemplified by
compounds like EGCG, originally anti-inflammatory now investigated in oncology,
this paradigm informed our targeted screening of prognostic genes to overcome
osimertinib resistance and improve LUAD outcomes. Rotenone binds AGER to
downregulate its expression while inhibiting mitochondrial complex I, activating
NADPH-Oxidase 2 (NOX2)-mediated ROS generation that induces apoptosis in lung
cancer cells [52]. This oxidative phosphorylation (OXPHOS) disruption may counter
osimertinib adaptive resistance in NSCLC [53], though mechanisms require further
elucidation. MRK003, a potent
We integrated single-cell RNA sequencing to identify osimertinib resistance mechanisms at a subpopulation level, overcoming the resolution limitations of bulk-tissue analysis. To our knowledge, this study establishes the first gene signature specifically predictive of osimertinib resistance in NSCLC, distinct from previous cuproptosis-related prognostic models [65]. Furthermore, we provide novel functional insights into the therapeutic potential of SOD3—a key signature gene—through combined molecular docking and experimental validation, moving beyond purely predictive correlations. However, several limitations should be noted. First, although we show that CAF–tumor cell interactions promote osimertinib resistance, CAF heterogeneity necessitates further subtype-specific investigation using spatial transcriptomics at tumor–CAF niches and co-culture systems with purified CAF subsets. Second, while transcriptomic and functional data suggest metabolic adaptation contributes to resistance, direct validation through metabolic flux assays or lipidomics is needed to quantify changes in ATP generation, glycolysis, and lipid metabolism. Current single-cell datasets remain constrained by limited sample sizes and follow-up data due to high costs. Integrating bulk and single-cell RNA-seq data with advanced computational algorithms will help overcome these constraints. Although RRGs inhibition restored osimertinib sensitivity in vitro, future studies should include in vivo validation using shRNAs and osimertinib co-treatment in PDX models. Finally, although we identified RRGs mediating resistance, common genomic alterations in LUAD like TP53 mutations may influence redox signaling. Future work should stratify patients by mutation status to refine prognostic biomarkers, prospectively validate the signature’s clinical utility and investigate underlying molecular mechanisms.
Integrating single-cell and bulk transcriptome analyses, we identified key DE-RRGs as prognostic biomarkers and potential therapeutic targets in LUAD. Our results establish a critical link between redox homeostasis, osimertinib-resistant cell population, and patient survival outcomes. These findings provide novel mechanistic and therapeutic insights for treating lung adenocarcinoma.
LUAD, lung adenocarcinoma; TME, tumor microenvironment; OR, osimertinib resistance; RRGs, redox-related genes; CAFs, Cancer-associated fibroblasts; NSCLC, non-small cell lung cancer; EGFR, epidermal growth factor receptor; TKIs, tyrosine kinase inhibitors; ROS, reactive oxygen species; scRNA-seq, single-cell RNA sequencing; DE-RRGs, differentially expressed redox-related genes; PDX, patient-derived xenograft; TCGA, cancer genome atlas; GEO, gene expression omnibus; t-SNE, t-distributed stochastic neighbor embedding; LASSO, least absolute shrinkage and selection operator; ROC, receiver operating characteristic; GO, gene ontology; KEGG, kyoto encyclopedia of Genes and Genomes; ssGSEA, single-sample gene set enrichment analysis; TMB, tumor mutational burden; CNVs, copy number variations; IHC, immunohistochemistry; DEGs, differentially expressed genes; OS, osimertinib sensitivity; MTX, methotrexate; EGCG, epigallocatechin gallate; TLR4, toll-like receptor 4; AGER, advanced glycosylation end product-specific receptor; CYP2J2, cytochrome P450 family 2 subfamily J polypeptide 2; HSPA1B, heat shock 70 kDa protein 1B; FMO2, flavin-containing monooxygenase 2; VASN, vasorin; SOD3, superoxide dismutase 3; KLF2, kruppel like factor 2; ABCA1, ATP-binding cassette transporter A1; GSTA4, Glutathione S Transferase A4; AGE-RAGE, advanced glycation end products-receptor for advanced glycation end products; mesCAFs, mesothelial CAF; UMAP, Uniform Manifold Approximation and Projection; NF-
The data generated or analysed to support the findings during this study are available from the TCGA (https://portal.gdc.cancer.gov/) and GEO (https://www.ncbi.nlm.nih.gov/geo/) open database. The datasets used and analyzed during the current study are available from the corresponding author on reasonable request.
FQ designed the study. CF and DL made contribution to the data analyses and drew up the manuscript. CL and RQ finished statistical analysis for the data. GZ, FY and CS conducted molecular experiments. JD and TL processed figures and tables. FQ undertook support for the project. All authors contributed to editorial changes in the manuscript. All authors read and approved the final manuscript. All authors have participated sufficiently in the work and agreed to be accountable for all aspects of the work.
The information utilized in this research was sourced from publicly available databases. The samples were derived from the pathological specimen bank of the First Affiliated Hospital of Nanchang University [Ethics Approval Number: (2024) CDYFYYLK (10-005)] and abided by the rules of the Declaration of Helsinki. All patients or their guardians signed informed consent forms.
Not applicable.
This study was funded by the National Natural Science Foundation of China (No. 82460598), Surface project of the Natural Science Foundation of Jiangxi Province (No. 20212ACB206029), Technology Supporting Program of Jiangxi Province (No. 2021-NCZDSY-009), Major science and technology research projects of Nanchang (No. 2022-KJZC-028).
The authors declare no conflict of interest.
Supplementary material associated with this article can be found, in the online version, at https://doi.org/10.31083/FBL40454.
References
Publisher’s Note: IMR Press stays neutral with regard to jurisdictional claims in published maps and institutional affiliations.