
 , Ji-Hee Nam 1,†, Min-Seon Song 1, Jun-Ho Lee 1, Kyung-Eun Noh 1, Ji-Soo Oh 1, Nam-Chul Jung 1, Jie-Young Song 2, Dae-Seog Lim 1,*
1 Division of Life Sciences and Department of Life Science, Graduate School, CHA University, 13488 Seongnam-si, Gyeonggi-do, Republic of Korea
2 Division of Radiation Biomedical Research, Korea Institute of Radiological and Medical Sciences, 01812 Seoul, Republic of Korea
†These authors contributed equally.
Abstract
Parkinson’s disease (PD) is characterized by a progressive decline in dopaminergic neurons within the substantia nigra (SN). Although its underlying cause has yet to be fully elucidated, accumulating evidence suggests that neuroinflammation contributes substantially to disease development. Treatment strategies targeting neuroinflammation could improve PD outcomes. Monocyte-derived tolerogenic dendritic cells (tolDCs) modulate immune responses and induce regulatory T cells (Tregs) during various inflammatory diseases. However, the mechanisms underlying tolDC-mediated immunoregulation in PD remain unclear.
We investigated the immune modulatory role of tolDCs by analyzing gene expression patterns and identified that the C-type lectin domain family 5 member A (Clec5a) was highly induced in tolDCs. To assess its function, we generated Clec5a-knockdown tolDCs and measured cytokine production, including interleukin (IL)-10 and IL-6, forkhead box protein P3 (Foxp3)+ Treg induction, and nuclear factor kappa B (NF-κB) signaling activity. Furthermore, we evaluated the therapeutic effects of Clec5a-expressing dendritic cells (DCs) in a 1-methyl-4-phenyl-1,2,3,6-tetrahydropyridine (MPTP)-induced PD mouse model. Dopaminergic neuron survival, α-synuclein (α-syn) accumulation, neuroinflammatory markers, and locomotor behavior were analyzed following DC administration.
Clec5a-knockdown tolDCs exhibited reduced immunomodulatory function and IL-10 levels but enhanced IL-6 levels. In addition, these cells induced fewer Foxp3+ Tregs and showed significantly enhanced NF-κB signaling activity. In the MPTP-induced PD model, administration of Clec5a-expressing DCs ameliorated dopaminergic neuron loss and α-syn accumulation. Furthermore, Clec5a-expressing DCs reduced the number of CD45highCD11b+CD86+ macrophages in the brain, reduced brain inflammatory cytokine expression, and improved locomotor activity.
These findings suggest that Clec5a plays a critical role in the immunomodulatory function of tolDCs. The administration of Clec5a-expressing DCs effectively reduced neuroinflammation and protected dopaminergic neurons in an MPTP-induced PD model. Therefore, Clec5a-expressing tolDCs may demonstrate therapeutic potential by managing PD symptoms by suppressing inflammatory responses associated with neurodegeneration.
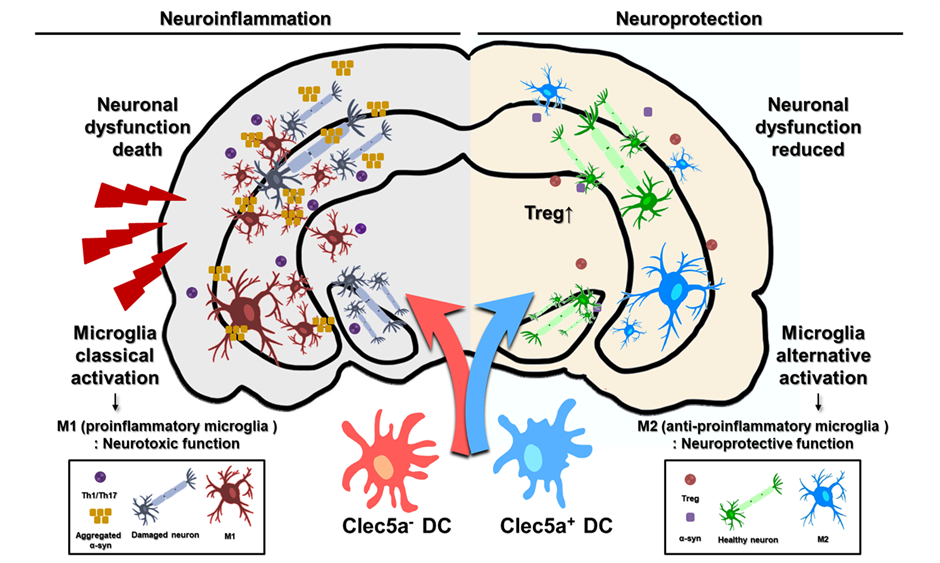
Graphical Abstract
Keywords
- dendritic cells
- immune tolerance
- Clec5a
- regulatory T cells
- Parkinson disease
Parkinson’s disease (PD) ranks as the second most common neurodegenerative
disease globally and predominantly affects individuals of advanced age [1, 2, 3]. The
clinical profile of PD encompasses both motor dysfunctions, such as resting
tremors, bradykinesia, rigidity, and impaired postural reflexes, and various
non-motor symptoms, all of which substantially contribute to morbidity [4]. These
manifestations are largely driven by the progressive degeneration of
nigrostriatal dopaminergic neurons and the intracellular aggregation of misfolded
Dendritic cells (DCs), as pivotal regulators of immune surveillance, specialize in presenting antigens (Ags) and initiating immune responses within both the peripheral and the central nervous system (CNS), where they continuously monitor and respond to immunological cues. Located near the cerebrospinal fluid, DCs can migrate to the draining cervical lymph nodes (LNs), where they may either exhibit tolerogenic capabilities or elicit immunogenic T-cell responses [21]. The objectives of DC-based therapy for PD are to promote Treg responses and induce tolerance against certain brain Ags [22]. By modulating immune responses against self-Ags, tolerogenic dendritic cells (tolDCs) serve as key modulators in immune-mediated diseases, including autoimmune and chronic inflammatory disorders such as rheumatoid arthritis [23, 24], Type 1 diabetes [25, 26], multiple sclerosis [27, 28], and myocardial infarction [29, 30]. Despite their therapeutic potential, tolDC-based therapies are challenging as the functionally distinct DC subsets need to be identified. Furthermore, due to the opposing functional characteristics of tolDCs and immunogenic mature DCs (mDCs), it is vital to identify the functional markers that can help distinguish between them. We previously performed gene profiling on mouse-derived tolDCs [31], which suggested that the C-type lectin domain family 5 member A (Clec5a) is uniquely overexpressed in tolDCs compared with other DC subsets.
Predominantly expressed on cells of the myeloid lineage, Clec5a, also known as myeloid DNAX-activating protein of 12 kDa (DAP12)-associating lectin 1 (MDL-1), interacts with the adaptor molecule DAP12 to initiate downstream signaling, which may result in either immunostimulatory or immunosuppressive responses depending on the cellular context [32, 33, 34]. Therefore, the dual functions of DAP12 may help explain the diverse roles of Clec5a in different cell types. Notably, some studies have suggested that Clec5a is involved in various immune responses, such as calcium mobilization, immunosuppressive leukocyte accumulation, and inflammatory cytokine production [35, 36, 37, 38]. However, its specific role in DCs remains unclear. Moreover, the role of Clec5a expression in mediating the therapeutic effects of DCs in PD has not yet been investigated.
Therefore, this study evaluated the therapeutic effects of Clec5a-expressing
tolDCs in 1-methyl-4-phenyl-1,2,3,6-tetrahydropyridine (MPTP)-induced PD mice,
which is the most widely used animal model for PD [39, 40, 41]. We confirmed that
tolDCs suppress neuroinflammation and attenuate PD-related dopaminergic
neurodegeneration. We further observed that tolDCs enhanced forkhead box protein
P3 (Foxp3)+ Tregs and reduced the levels of inflammatory cytokines,
including IL-1
Male C57BL/6N mice (aged 6–8 weeks, weighing 14–16 g) were obtained from Orient Bio (Seongnam, Gyeonggi-do, Republic of Korea). They were kept in a controlled environment with a 12/12 h light/dark cycle and regulated temperature and humidity.
To modulate Clec5a expression, a short hairpin RNA (shRNA) construct targeting the gene was synthesized by GenePharma (Shanghai, China). The sense sequence was inserted into the plasmid lentiviral knockout (pLKO)-shRNA-green fluorescent protein (GFP) vector. A control vector lacking the shRNA insert (pLKO-GFP) was used for comparison. The inserted shRNA sequence was as follows: 5′-CACCGGAACAGTCTGTCCCAGAAACTTCAAGAGAGTTTCTGGGACAGACTGTTCCTTTTTTG-3′.
The 293T cells (ATCC, CRL-3216, Manassas, VA, USA) were co-transfected with recombinant vectors and packaging plasmids (pRSV.Rev, pMDLg/pRRE, and pMD.G) using Lipofectamine™ 3000 Transfection Reagent (Invitrogen, Thermo Fisher Scientific, Waltham, MA, USA, Lot#2237579) for 4 h to generate lentivirus. Short tandem repeat (STR) profiling was used to validate 293T cells and confirm that they were free of mycoplasma. Post-transfection, the culture medium was replaced with fresh medium supplemented with GlutaMAX™ (Gibco, Thermo Fisher Scientific, Waltham, MA, USA, Lot#2360312) and sodium pyruvate (Gibco). After 24 h, the lentiviral supernatant was harvested, purified via ultracentrifugation, aliquoted, and stored at –80 °C. To determine viral titers, GFP-positive 293T cells were quantified by flow cytometry following exposure to serially diluted lentiviral vectors.
Bone marrow-derived DCs were prepared from C57BL/6 mice euthanized with CO2,
following established protocols [42]. Bone marrow cells were isolated, dispersed
into single-cell suspensions, and plated at 2
On day 5, the cells were transduced with lentiviral particles at a multiplicity
of infection (MOI) of 6 in the presence of 8 µg/mL polybrene (Santa Cruz
Biotechnology, Dallas, TX, USA). After 24 h, the culture medium was replaced. For
generation of tolDCs and Clec5a-knockdown tolDCs, the cells were stimulated on
day 8 with 10 ng/mL TNF-
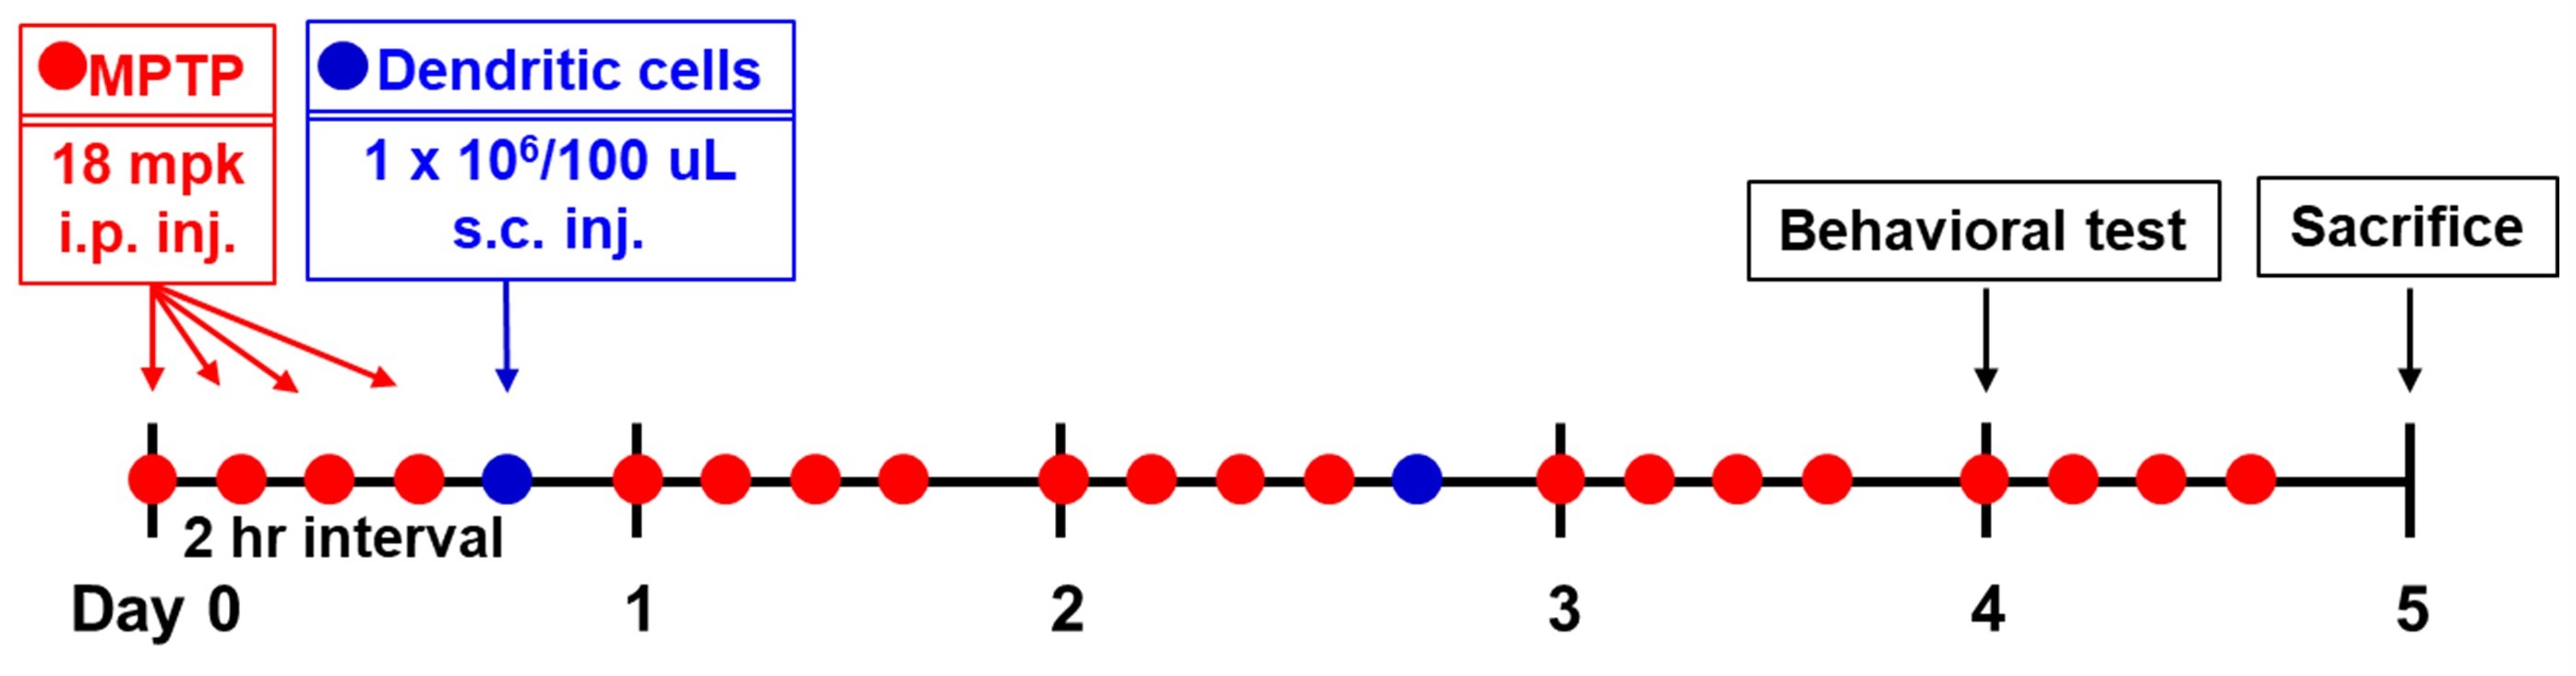
The experimental design is summarized in Fig. 1. MPTP-HCl (18 mg/kg of free
base; Sigma-Aldrich, #M0896) was intraperitoneally injected into the mice four
times at 2 h intervals for 5 days [43]. The control animals received only
phosphate-buffered saline (PBS). On days 0 and 2, 2 h after the last MPTP
injection, the mice were subcutaneously injected at the back of the neck with 1
 Fig. 1.
Scheme of the experimental protocol. MPTP, 1-methyl-4-phenyl-1,2,3,6-tetrahydropyridine.
The clinical symptoms of PD, which include chronic neurodegeneration with features indicating core motor function disruption, as well as behavioral symptoms, are challenging to reproduce in a mouse model [39]. Thus, we established a score based on the motor dysfunctions described in an MPTP-induced monkey model [44]. PD progression was assessed through daily observations in the home cage. The PD score was calculated by summing the scores of each of the four components (Supplementary Table 1).
On day 4, three types of behavioral experiments were performed. The forepaw stepping adjustment test is a widely accepted method for evaluating forelimb akinesia in mice. During the procedure, the mouse’s hindlimbs were gently elevated by lifting its tail, ensuring that only the forepaws remained in contact with the surface. The animal was then guided backward by the tail for a distance of 1 m at a consistent speed over approximately 3–4 s. The entire process was recorded on video, and the number of adjusting steps made by each forepaw was subsequently analyzed.
The pole test was conducted by positioning the mice head-upward at the top of a vertical wooden pole (50 cm in length and 1 cm in diameter) situated within their home cages. Before testing, mice underwent a 2-day training period, during which they completed three trials per day. On the test day, each mouse performed three additional trials, and the mean time required to execute a complete 180° turn (T-turn) and descend to the cage floor was measured. To prevent physical fatigue, cutoff times were established at 90 s for the T-turn and 180 s for the total descent. In cases where the mice fell while turning, the maximum time was recorded.
The tremor assessment was performed by a blinded researcher. To measure the tremor amplitude, brief video recordings (8–10 s) of mice positioned on a small platform were obtained, consisting of approximately 60 consecutive frames. These frames were merged into a smart object, and the “mean” stack mode in Adobe Photoshop software v.25.12.3 (Adobe Inc., San Jose, CA, USA) was used to integrate the motion into a single composite image. This approach allowed for the visualization of the displacement of the spine across frames, with the images inverted to enhance clarity. The image contrast was then analyzed using pixel intensity measurements in ImageJ v.1.53t (National Institutes of Health, Bethesda, MD, USA, https://imagej.net) to determine the degree of sharpness.
On day 5, following MPTP injection, mouse brains were collected post-perfusion, as previously described. The brain tissue was immersed overnight in 4% paraformaldehyde (PFA) in PBS for fixation. Samples were subsequently equilibrated in 15% and 30% sucrose solutions for at least 16 h. Using a cryostat Leica CM3050 S (Leica Biosystems, Nussloch, Germany), the brains were coronally sliced into 30 µm-thick sections and preserved at –20 °C in a cryoprotectant medium until further analysis. For immunofluorescence staining, every sixth section encompassing the SN was selected. To prevent nonspecific interactions, frozen sections were pretreated in PBS containing 3% goat serum and 1% Triton™ X-100 (MilliporeSigma, Burlington, MA, USA) for 30 min. The tissue sections were then incubated overnight at 4 °C with a primary mouse anti-TH antibody (Invitrogen). The next day, the sections were incubated for 2 h at ambient temperature with a fluorescein isothiocyanate (FITC)-conjugated goat anti-mouse IgG secondary antibody (Jackson ImmunoResearch, West Grove, PA, USA). Afterward, the sections were washed three times with PBS (5 min per wash). Fluorescent signals were acquired using a Leica fluorescence microscope (Leica Microsystems, Wetzlar, Germany), and TH-positive cells were quantified using LAS AF imaging software v.4.0 (Leica Microsystems). Antibody information is provided in Supplementary Table 2.
DCs were seeded onto coverslips pre-coated with poly-L-lysine (MilliporeSigma) and subsequently fixed in 1% PFA in PBS for 10 min. Following fixation, the cells were permeabilized with 0.1% Triton™ X-100 in PBS, followed by washing with 0.05% Tween 20 in PBS (PBST; Daejung Chemicals & Metals, Siheung, Gyeonggi-do, Republic of Korea). To minimize nonspecific interactions, the cells were incubated with 5% normal goat serum for 30 min at room temperature. Subsequently, an anti-Clec5a antibody (R&D Systems, Minneapolis, MN, USA) was applied for an overnight incubation at 4 °C. The next day, the cells were treated with an Alexa Fluor 594-conjugated anti-mouse IgG antibody (Jackson ImmunoResearch) in antibody diluent (Agilent Technologies, Santa Clara, CA, USA) for 2 h at room temperature. After multiple washes with PBST, the coverslips were mounted using Fluoroshield™ containing DAPI (Sigma-Aldrich). Imaging was conducted using a TCS NT/SP confocal microscope (Leica) equipped with argon, krypton, and helium/neon lasers. Supplementary Table 2 summarizes the antibodies used in this study.
Phenotypic analysis involved direct immunofluorescence staining of the DC surface markers. The cells were stained using the following antibodies at 4 °C for 20 min: allophycocyanin (APC)-conjugated anti-CD11c (BioLegend, San Diego, CA, USA) and phycoerythrin (PE)-conjugated anti-CD11c (Invitrogen), PE-conjugated anti-CD40 (BD Biosciences), anti-CD80 (Invitrogen), anti-major histocompatibility complex (MHC) class II (BD Biosciences), anti-IL-10 (BD Biosciences), FITC-conjugated anti-CD14 (BioLegend), anti-CD54 (BD Biosciences), anti-CD86 (BioLegend), anti-MHC class I (BioLegend), propidium iodide (PI; BD Biosciences), and corresponding isotype controls. The cells were analyzed using a NovoCyte 3005 (ACEA Biosciences, Agilent Technologies, San Diego, CA, USA), and the data were analyzed using the FlowJo v.10 software (FlowJo, Ashland, OR, USA). All antibody information is presented in Supplementary Table 3.
On day 5, following MPTP injection, the perfused mouse brains were harvested as
described above. For in vivo experiments, the brain tissue was lysed
using the PRO-PREP™ protein extraction kit (iNtRON Biotechnology,
Seongnam, Gyeonggi-do, Republic of Korea, #17081). The total protein concentration of the
lysate was measured using a Pierce™ Bradford Plus Protein Assay
Kits (Thermo Fisher Scientific, #23236). Cytokine levels were quantitated using
commercial enzyme-linked immunosorbent assay (ELISA) kits following the
manufacturer’s protocols. For in vitro experiments, cytokine
levels—including IL-1
Spleens from mice were harvested and dissociated in RPMI 1640 medium. To enrich
CD3+ T cells, splenocytes were applied to nylon wool fibers (Polysciences,
Inc., Warrington, PA, USA) according to the manufacturer’s protocol. The purified
T cells were labeled with a CFSE labeling kit (65-0850-84, Invitrogen, Waltham, MA, USA) and
subsequently co-cultured with DCs at a 1:10 ratio (DC:T cells). CD3+ T cells
(1
To assess T cell subsets, surface markers were stained with APC-conjugated
anti-CD4 (BioLegend) and FITC-conjugated anti-CD25 (BD Biosciences), followed by
incubation at 4 °C for 20 min. The cells were subsequently fixed and
permeabilized using either the BD Intracellular Staining Kit (554722/554723, BD Biosciences, San Jose, CA, USA) or
the Foxp3/Transcription Factor Staining Buffer Set (00-5523-00, Invitrogen, Waltham, MA, USA). Intracellular
staining was performed with PE-conjugated anti-IFN-
Total RNA was extracted using Labozol (CMRZ001, Cosmogenetech, Seoul, Republic of Korea), and cDNA was synthesized with the LaboPass cDNA synthesis kit (CMRTK002, Cosmogenetech) according to the manufacturer’s instructions. Quantitative real-time PCR was performed using Clec5a-specific primers and SensiFast™ SYBR® Hi-Rox Mix (Bioline, Memphis, TN, USA). The primer sequences were: Clec5a forward, 5′-TCTGCTGTATTTCCCACAGG-3′; Clec5a reverse, 5′-TTCGTCATTTCTCCCAAAGA-3′; glyceraldehyde-3-phosphate dehydrogenase (GAPDH) forward, 5′-AACAGCAACTCCCACTCTTC-3′; and GAPDH reverse, 5′-CCTGTTGCTGTAGCCGTATT-3′. Gene expression was normalized to GAPDH and analyzed in triplicate (Relative expression levels were calculated using the 2-ΔΔCT method with GAPDH as the reference gene).
Protein quantification of whole-cell lysates from DCs was performed using the
Pierce™ Bradford Plus Protein Assay Kits following lysis with the
PRO-PREP™ protein extraction solution (iNtRON Biotechnology).
Equal amounts of protein were loaded and separated by sodium dodecyl sulfate
polyacrylamide gel electrophoresis (SDS-PAGE) and then transferred to
polyvinylidene fluoride (PVDF) membranes (Thermo Fisher Scientific). The
membranes were blocked in 10% skim milk (w/v) prepared in PBST and subsequently
incubated overnight at 4 °C with the following primary antibodies:
Clec5a, phosphorylated (p)-extracellular signal-regulated kinase (Erk)1/2,
Erk1/2, p-nuclear factor kappa B (NF-
On day 5, after MPTP injection, the perfused mouse brains were harvested as
described above. Percoll® (Sigma-Aldrich) was used for leukocyte
isolation, according to the manufacturer’s instructions. Briefly, the brains were
gently homogenized and pelleted. The homogenates were resuspended in 37%
isotonic Percoll®. A discontinuous isotonic
Percoll® density gradient consisting of 70%, 37%, 30%, and 0%
layers was prepared. The gradient was centrifuged at 300
All experimental procedures were performed in at least three independent
replicates. Data are expressed as the mean
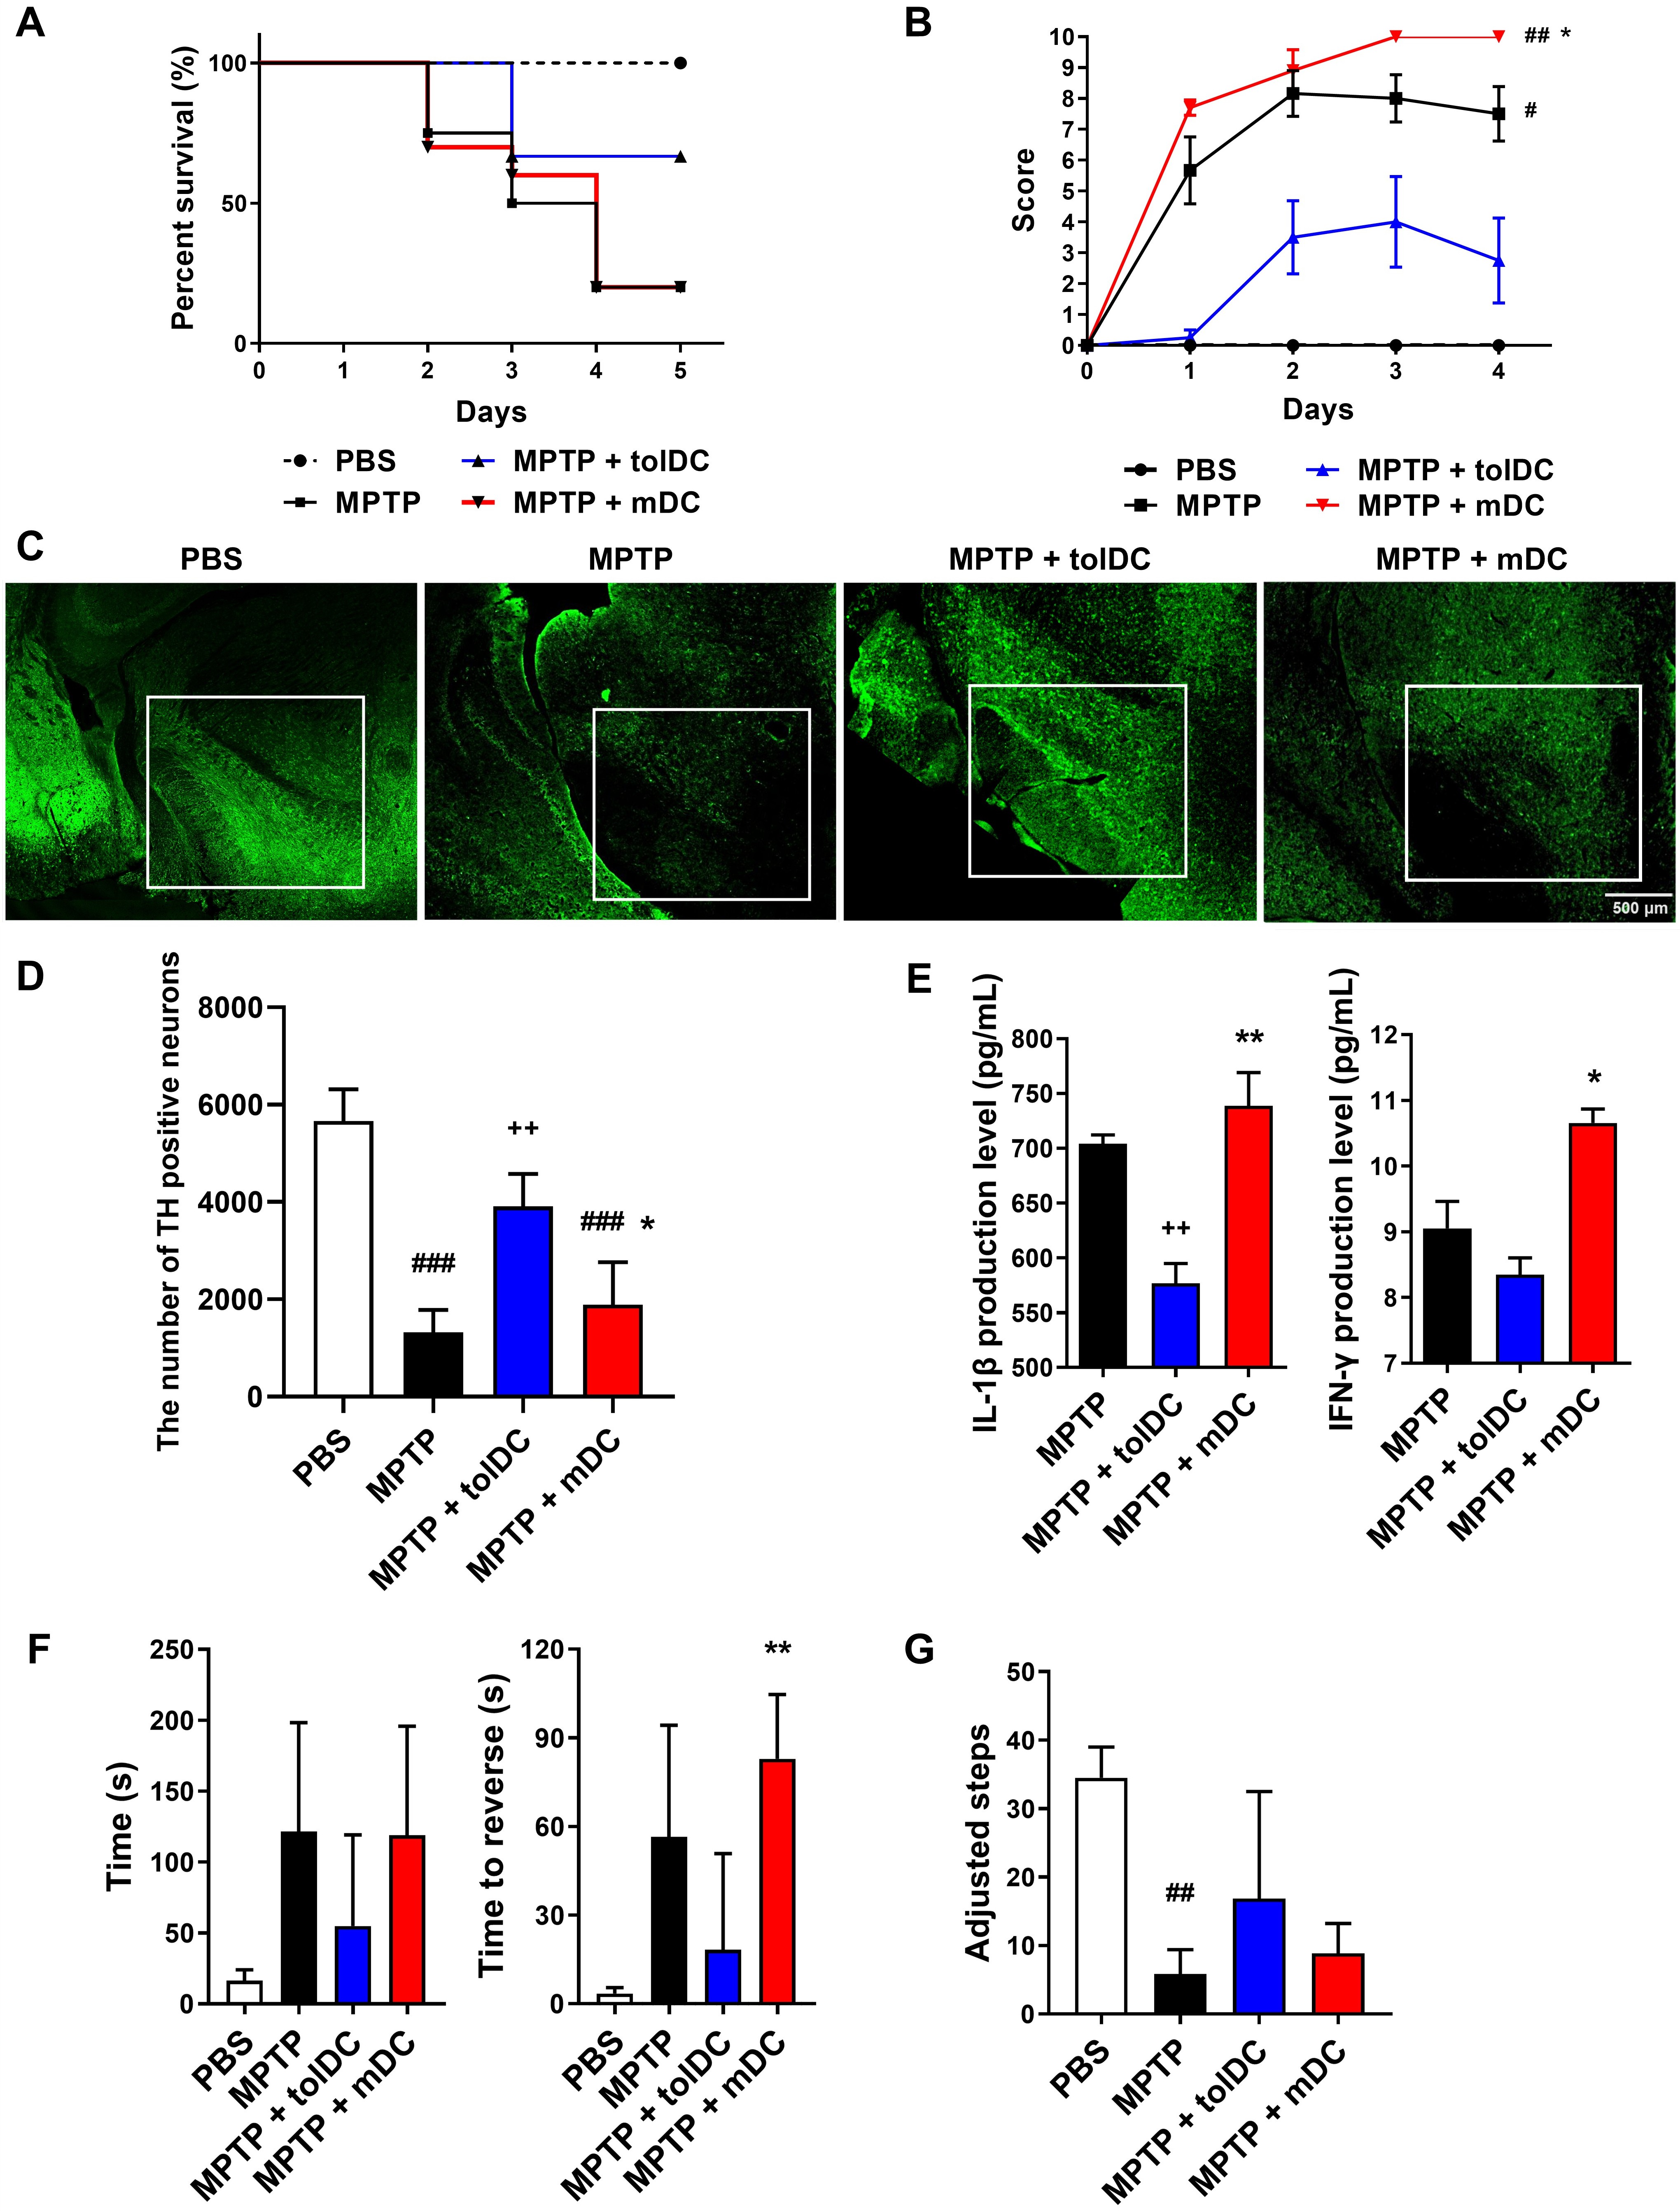
To evaluate the therapeutic effects of tolDCs, we administered either tolDCs or
mDCs to MPTP-intoxicated mice. On day 5, the tolDC-treated mice (MPTP + tolDC)
exhibited a higher survival rate compared with the mDC-treated (MPTP + mDC) or
MPTP-intoxicated (MPTP) groups (Fig. 2A). Disease progression was monitored over
time across all groups. Compared with the MPTP group, the MPTP + tolDC group
displayed a lower Parkinson’s score, whereas the MPTP + mDC group showed the
highest score (Fig. 2B). To investigate whether tolDCs exerted neuroprotective
effects in the experimental PD model, dopaminergic neuronal degeneration in the
substantia nigra pars compacta (SNpc) was analyzed using immunofluorescence
staining. MPTP administration reduced TH-positive dopaminergic neuron numbers in
the SN compared with the PBS-treated mice. While MPTP + tolDC significantly
preserved dopaminergic neurons, the neuronal loss was comparable between the MPTP
+ mDC and MPTP groups (Fig. 2C,D). To determine whether the injected DCs
modulated inflammation in the MPTP-intoxicated mouse brains, we measured the
levels of IL-1
 Fig. 2.
Neuroprotective effect of tolerogenic dendritic cells (tolDCs).
(A) Survival rates. Kaplan–Meier survival analysis in the phosphate-buffered
saline (PBS) (n = 10), MPTP (n = 20), MPTP + tolDC (n = 10), and MPTP + mDC (n =
10) groups. tolDCs and mature DCs (mDCs) were generated by treatment with
The therapeutic potential of tolDCs in MPTP-treated mice was assessed in comparison with that of mDCs. In vitro analyses of tolDC-mediated immune responses revealed reduced levels of co-stimulatory molecules and proinflammatory cytokines relative to mDCs (Supplementary Fig. 1A,B). Conversely, the expression of IL-10, a representative anti-inflammatory cytokine, was elevated in tolDCs compared with that in mDCs (Supplementary Fig. 1C). Moreover, tolDCs had a lower proliferative capacity than mDCs but promoted the Th2 and Treg populations in the co-culture experiments (Supplementary Fig. 1D–G). These results suggest that tolDCs efficiently induced immune tolerance by suppressing inflammatory cytokine production and enhancing the proportion of Tregs.
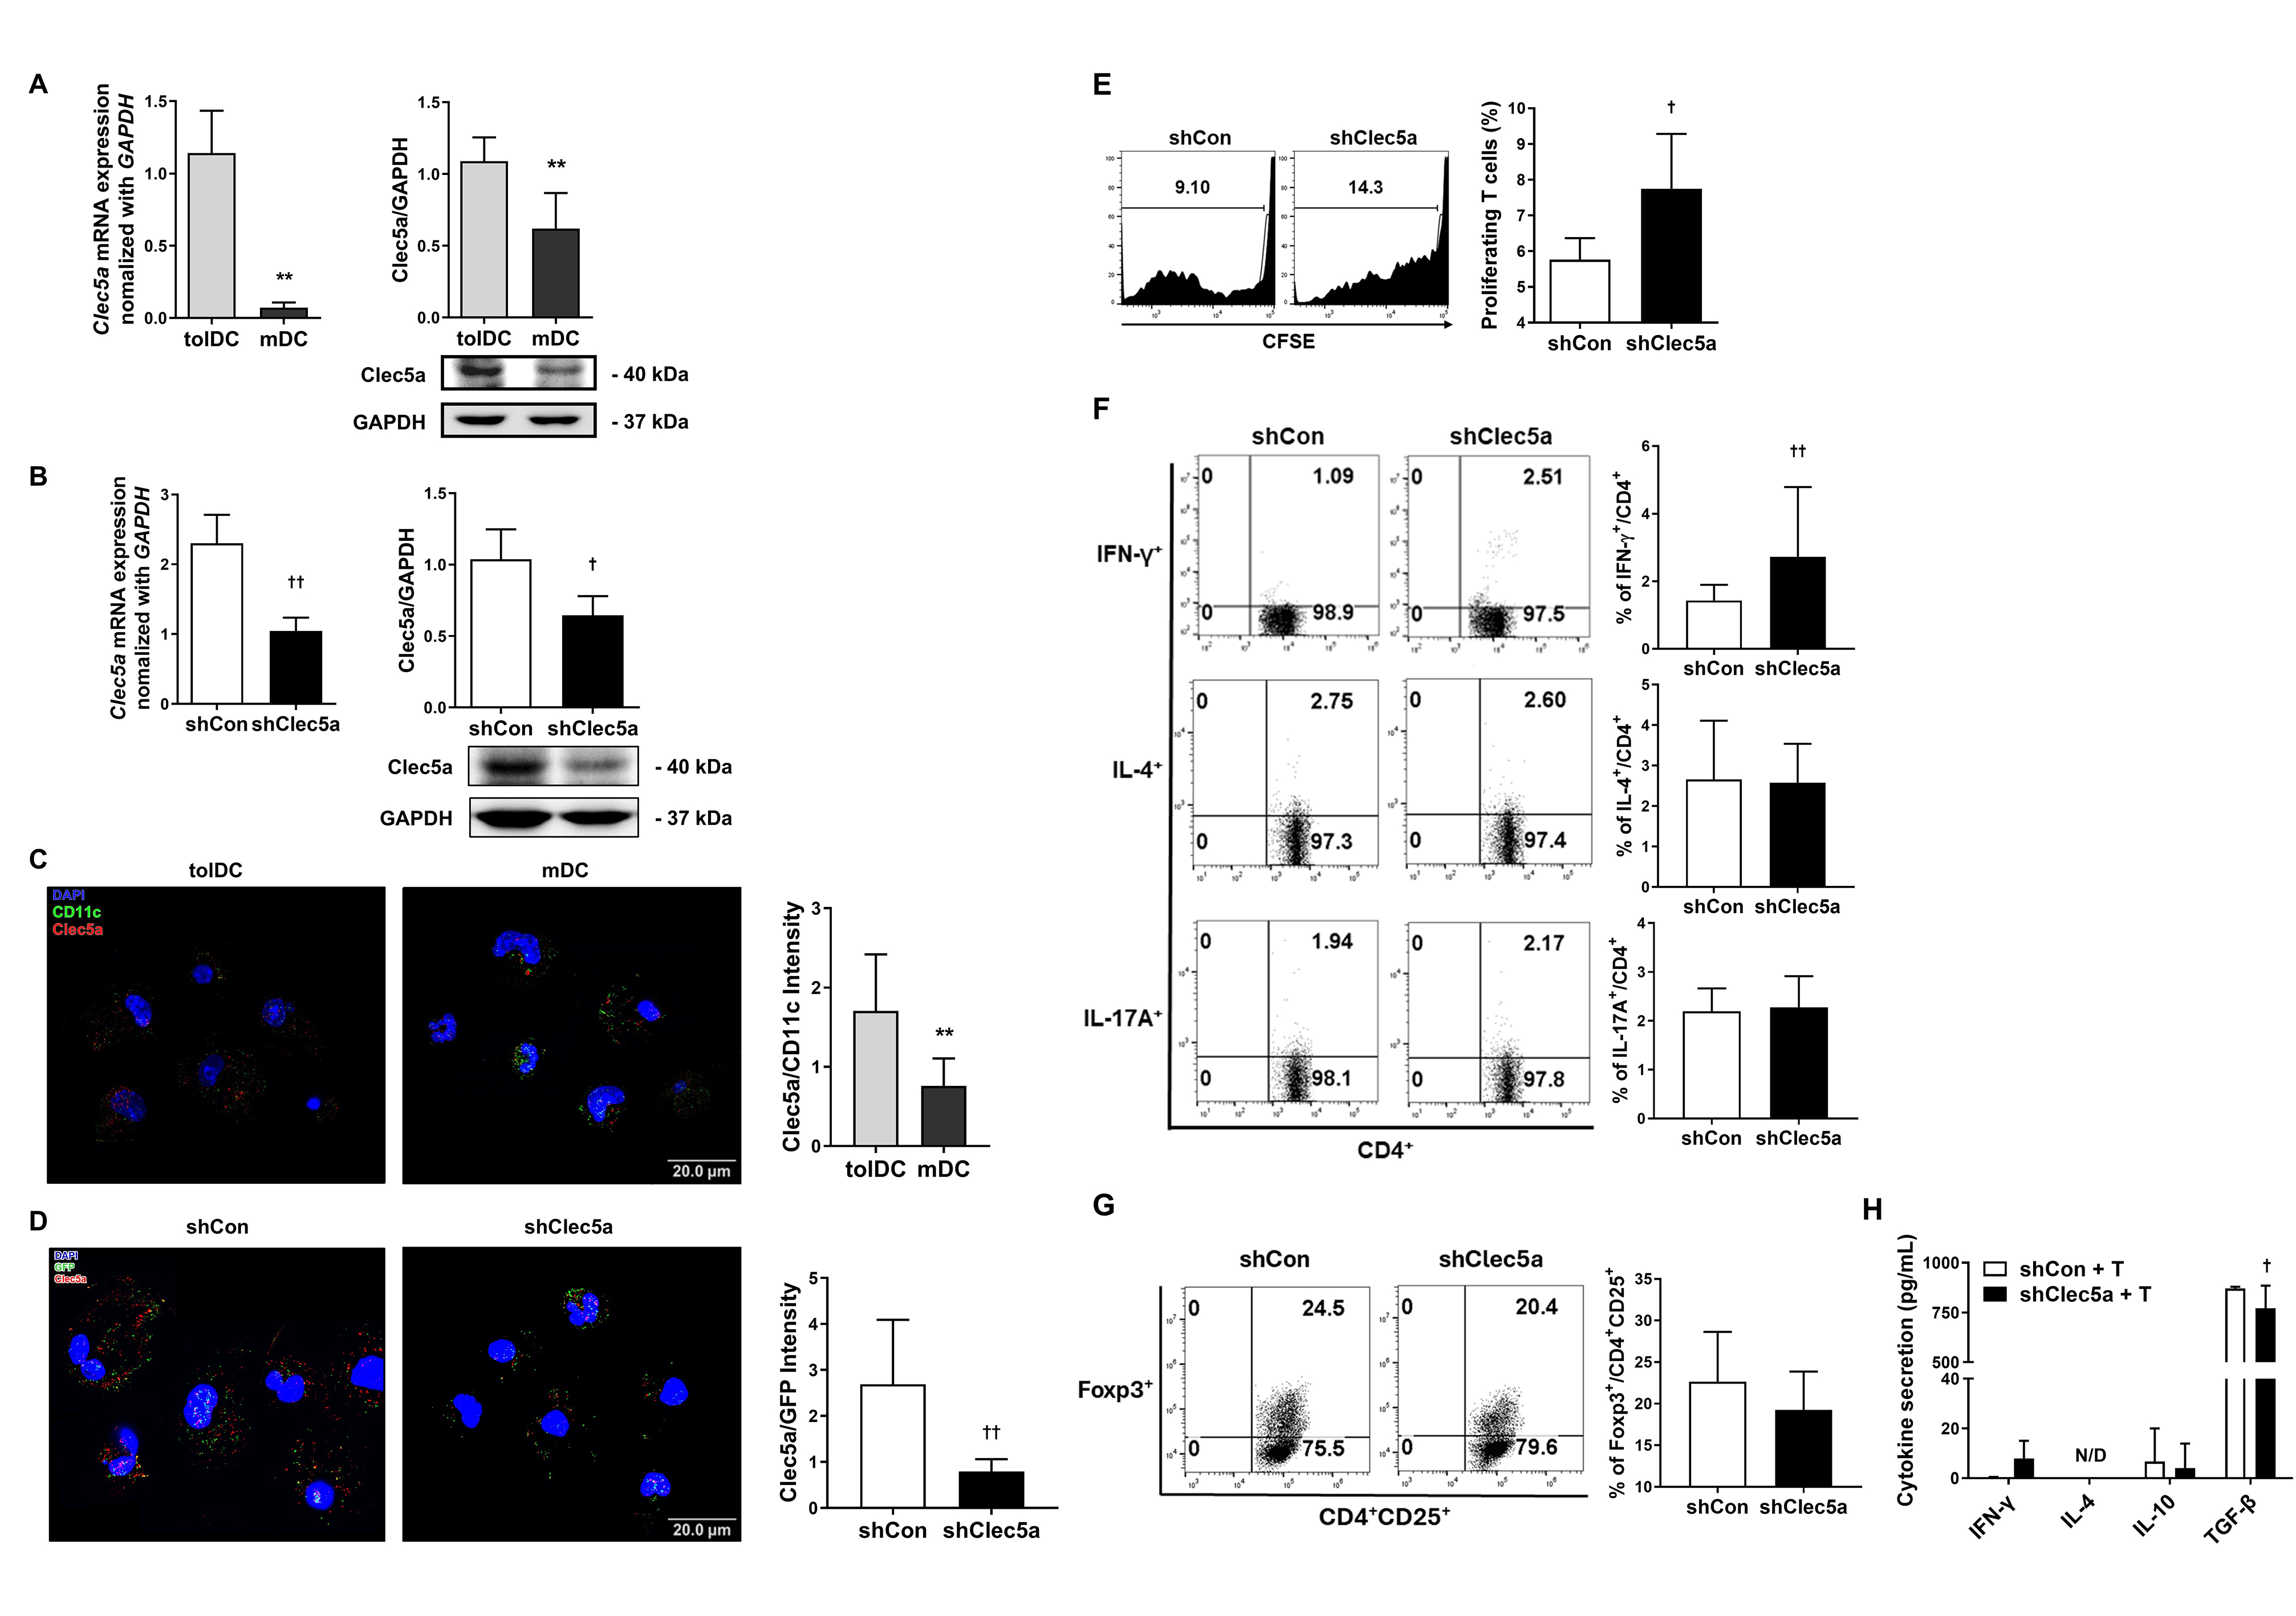
Next, we examined the functional markers in DC subsets to determine the basis for the functional differences between tolDCs and mDCs. As Clec5a is upregulated in tolDCs [31], we generated tolDCs and mDCs to determine whether tolDCs expressed Clec5a by employing quantitative real-time PCR (qRT-PCR). The results indicated that Clec5a was significantly overexpressed in tolDCs compared with mDCs. In addition, western blot analysis of whole cell lysates showed enhanced Clec5a levels in tolDCs (Fig. 3A).
 Fig. 3.
C-type lectin domain family 5 member A (Clec5a) expression is
affected by the immune response in tolDCs. (A) Clec5a mRNA levels were
quantified using quantitative real-time PCR (qRT-PCR) (left; Mann–Whitney U
test; n = 6 independent DC samples; **p
To investigate the functional significance of Clec5a in tolDCs, lentiviral
transduction with Clec5a-targeting shRNA was employed. The Clec5a knockdown
efficiency was verified through qRT-PCR and western blotting (Fig. 3B).
Immunofluorescence analysis further revealed that Clec5a was strongly expressed
on the surface of tolDCs (Fig. 3C) and was significantly downregulated in the
Clec5a-knockdown tolDCs (shClec5a). Additionally, the transduction of lentiviral
vectors was confirmed by GFP expression in DCs (Fig. 3D). We next evaluated
whether Clec5a knockdown affected tolDC function. The results demonstrated that
although Clec5a did not influence the expression of surface molecules, it
markedly induced the production of IL-6 while decreasing the expression of IL-10
in tolDCs (Supplementary Fig. 2A–C). To evaluate the impact of shClec5a
on T cell activation, DCs were co-cultured with CD3+ T cells. Compared with
shCon, T cell proliferation (Fig. 3E) and the CD4+IFN-
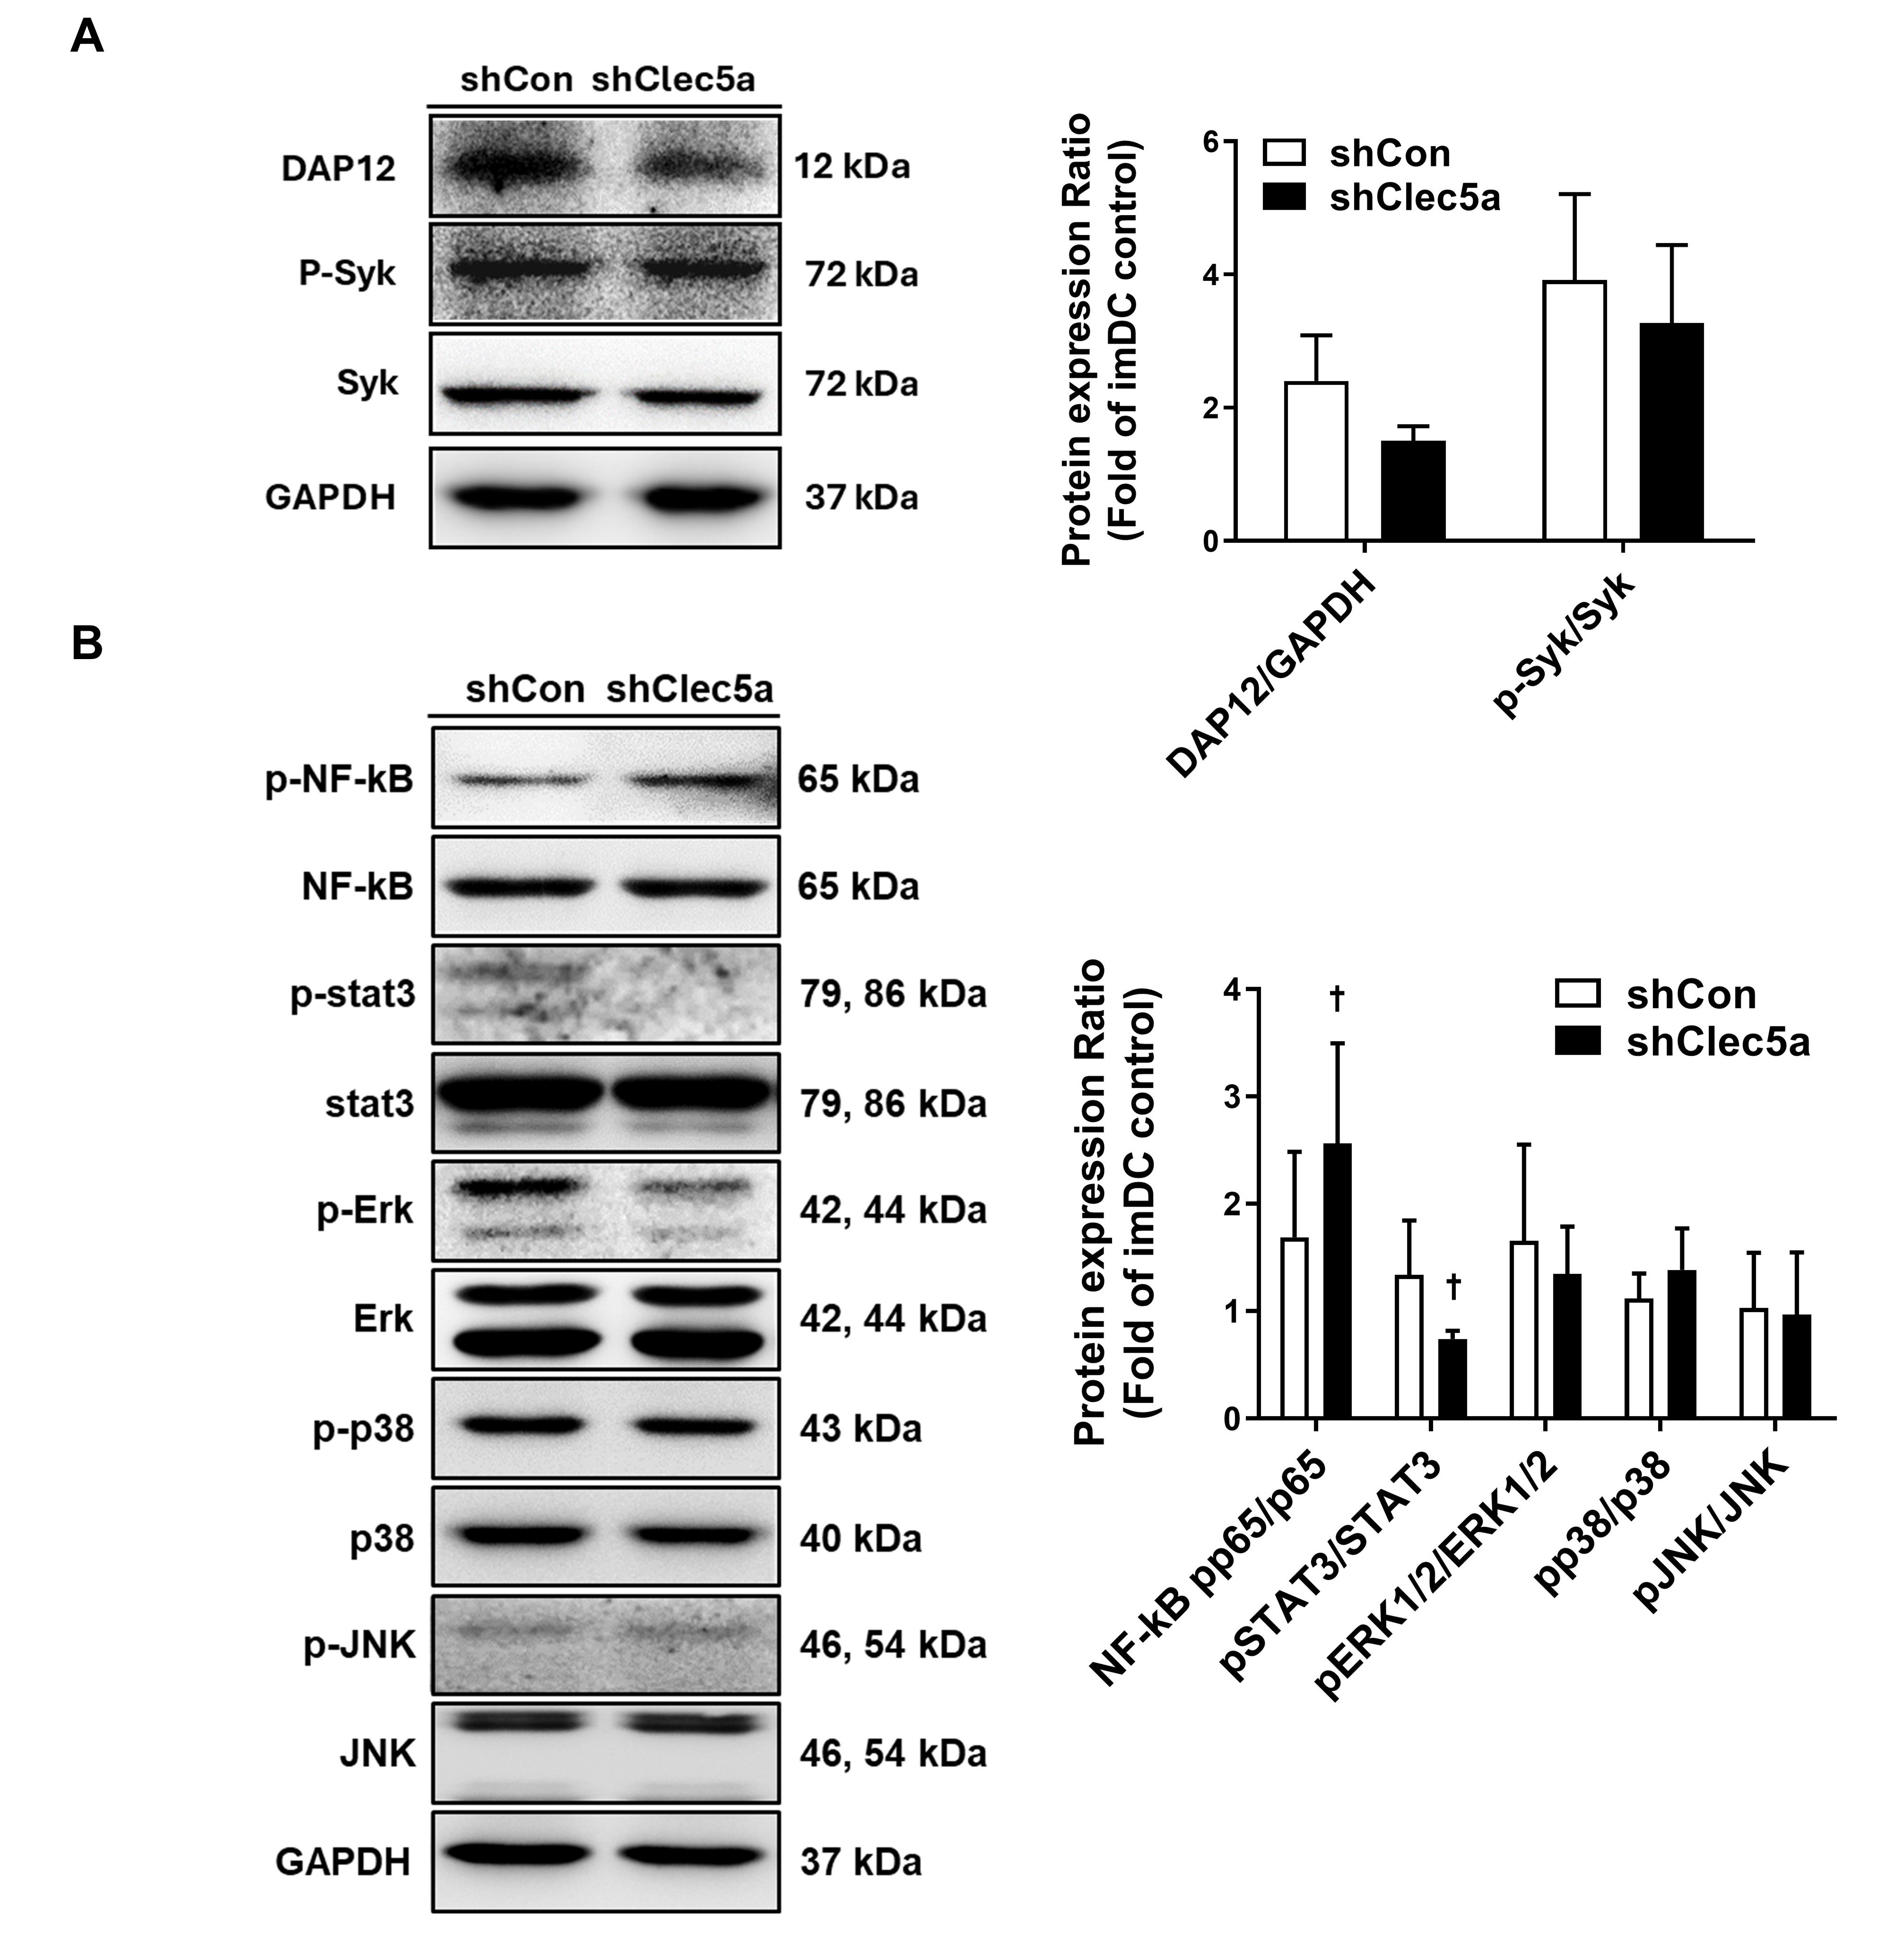
The key downstream molecules were assessed to explore the signaling mechanisms
underlying Clec5a-mediated immune regulation. In Clec5a-knockdown tolDCs, the
expression of DAP12 and phosphorylated Syk was slightly reduced (Fig. 4A). While
the phosphorylation of Erk, p38, and JNK remained unchanged between the shCon and
shClec5a groups, STAT3 phosphorylation significantly declined, and NF-
 Fig. 4.
Cell signaling analysis of shClec5a. (A) Western blotting was
conducted to assess the expression of DNAX-activating protein of 12 kDa (DAP12),
p-spleen tyrosine kinase (Syk), and Syk. The p-Syk expression was normalized to
that of Syk. The corresponding bar graphs indicate the fold changes relative to
imDCs (Mann–Whitney U test, n = 3). (B) Western blot analysis was also performed
for key signaling proteins, including nuclear factor kappa B (NF-
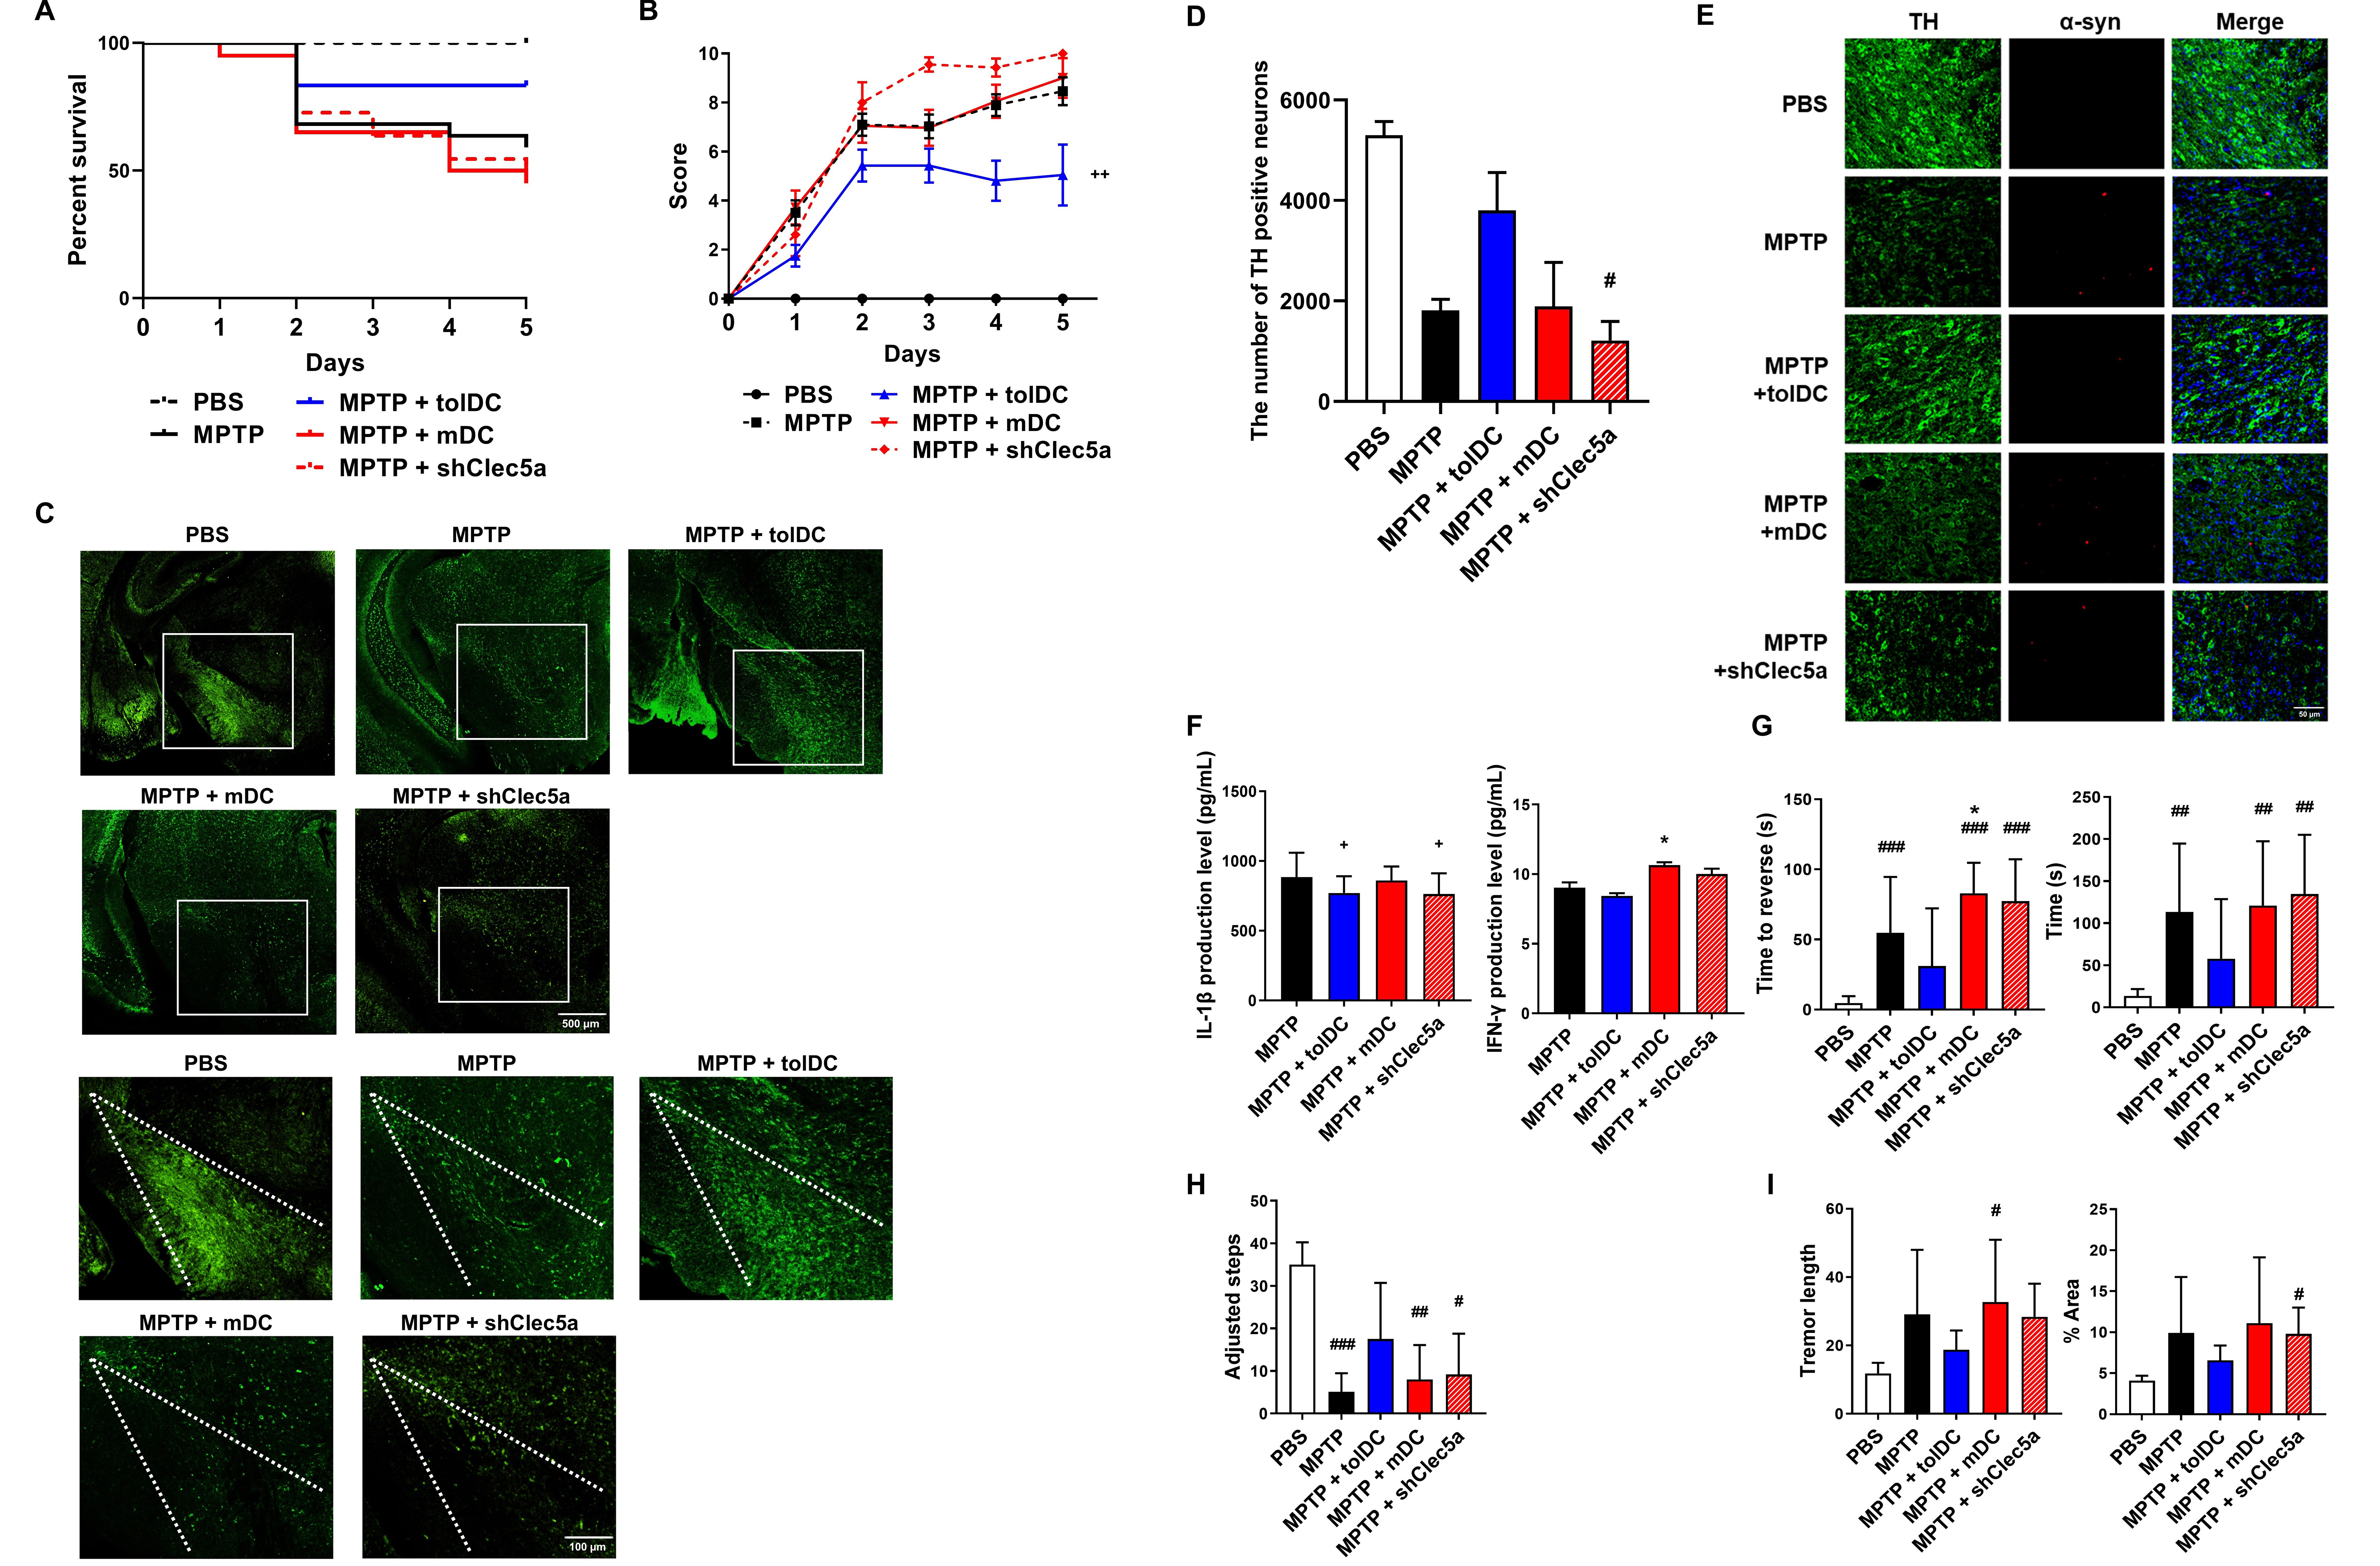
To determine whether the modulation of Clec5a expression in tolDCs influenced
their therapeutic efficacy against PD, we administered
Clec5a-expressing tolDCs to MPTP-intoxicated mice. The experimental protocol was the
same as described previously. Kaplan–Meier analysis indicated enhanced survival
in the tolDC-treated mice (MPTP + tolDC) compared with that in the mDC-treated
(MPTP + mDC), shClec5a-treated (MPTP + shClec5a), or MPTP-intoxicated (MPTP) mice
on day 5 (Fig. 5A). Disease severity increased with time in all experimental
groups, whereas the MPTP + shClec5a group exhibited the highest Parkinson’s score
compared with the MPTP group (Fig. 5B). Compared with the MPTP group, although
MPTP + tolDC ameliorated the loss of dopaminergic neurons, the loss was greater
or similar in the MPTP + mDC and MPTP + shClec5a groups (Fig. 5C,D). In the SN
region,
 Fig. 5.
Neuroprotective effects of Clec5a-expressing DCs. (A) Survival
rates. Kaplan–Meier survival analysis in PBS (n = 15), MPTP (n = 38), MPTP +
tolDC (n = 22), MPTP + mDC (n = 19), and MPTP + shClec5a (n = 11) groups. tolDCs
and mDCs were generated by treatment with
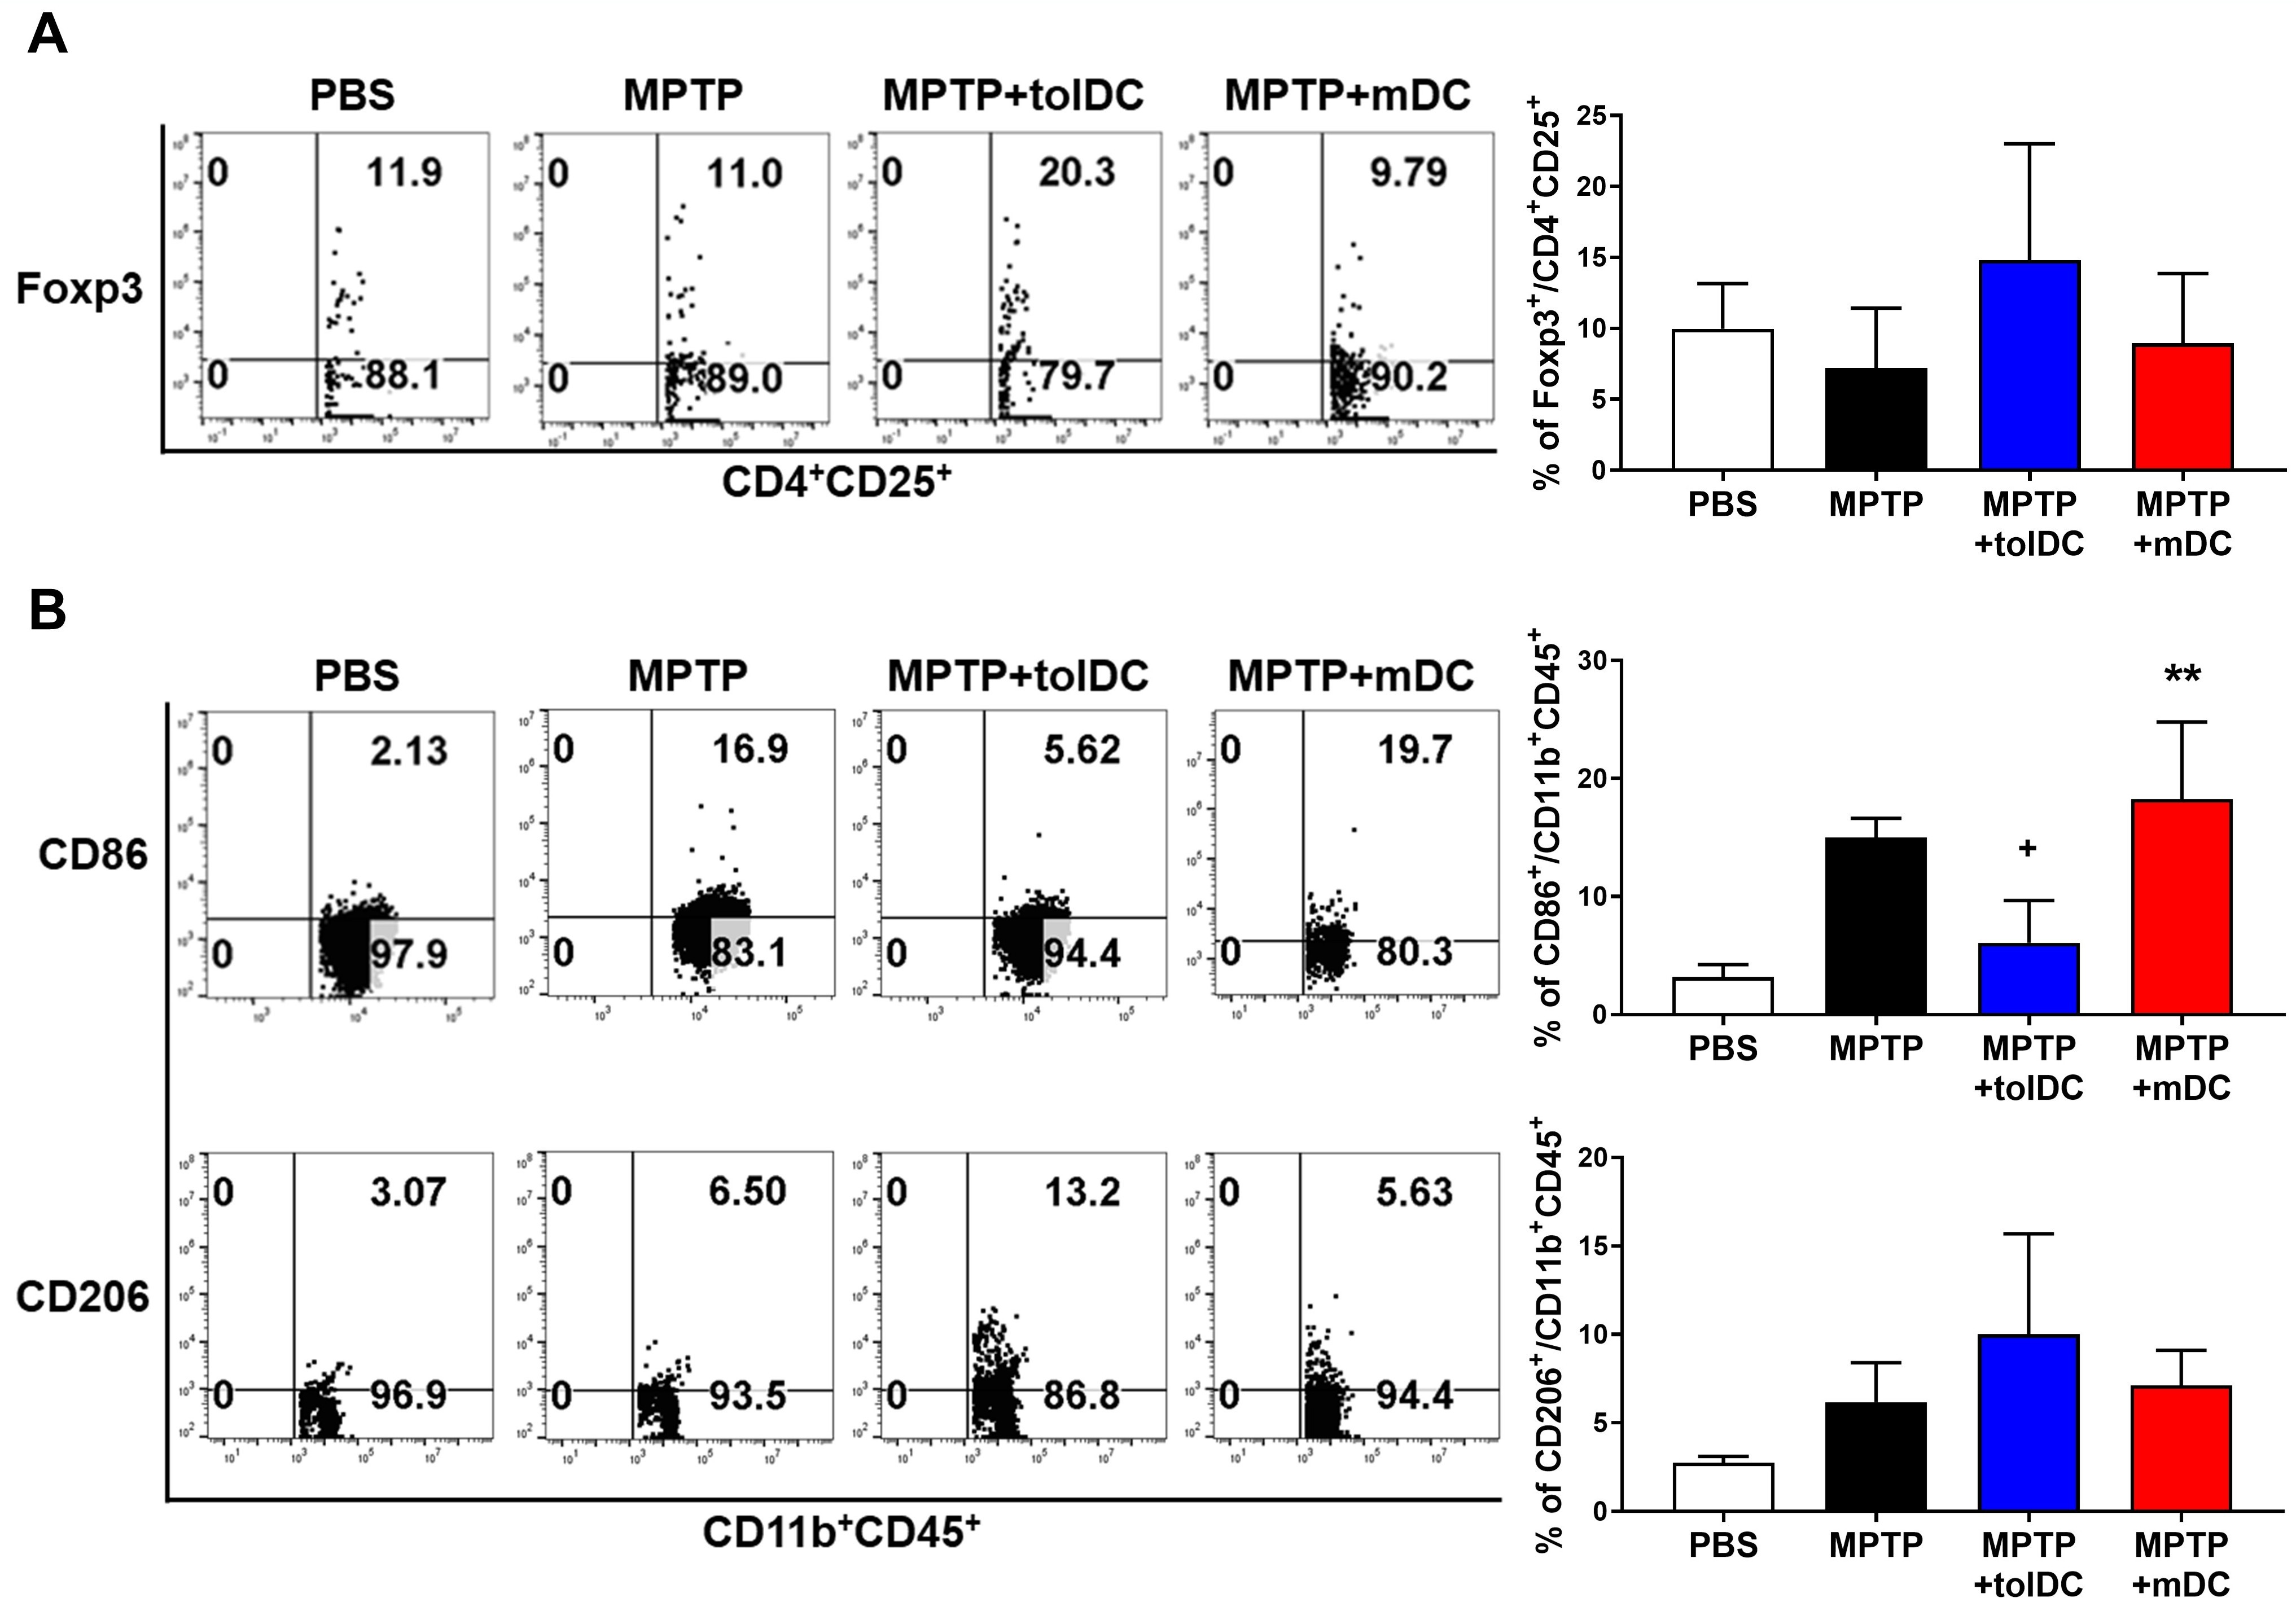
To determine the in vivo effects of tolDC treatment on the brain and systemic immune systems, the mice were euthanized, and their spleens, LNs, and perfused brains were isolated. Flow cytometry analysis measured the proportions of Tregs (Fig. 6A) and M1/M2 macrophages (Fig. 6B) in the brain tissue after tolDC administration. The percentages of CD4+CD25+Foxp3+ Tregs and CD45+CD11b+CD206+ M2 macrophages were enhanced in the brains of PD mice following tolDC injection. Furthermore, in the MPTP + mDC group, the proportion of Tregs in the brain decreased, and that of CD45+CD11b+CD86+ M1 macrophages significantly increased compared with the MPTP + tolDC mice. Such effects were not observed in the spleen (Supplementary Fig. 4A), although the proportion of Tregs in the submandibular LNs increased (Supplementary Fig. 4B). These results suggest that tolDCs may significantly reduce the number of M1 macrophages in the brain, potentially suppressing the excessive immune response in the CNS.
 Fig. 6.
tolDC-induced Treg infiltration and M2 macrophage
differentiation in the brain. (A) The percentages of regulatory T cells (Tregs)
(CD4+CD25+Foxp3+) in the brain (Kruskal–Wallis ANOVA; n
PD is a progressive neurodegenerative disease characterized by dopaminergic
neuron loss, motor dysfunction, and
Clec5a was selectively upregulated in tolDCs, thereby increasing IL-10 and Treg
differentiation, but decreasing IL-6 levels. Clec5a knockdown in tolDCs abrogated
these effects, enhancing Th1 responses but impairing Treg generation,
highlighting its essential role in shaping the immune balance. Clec5a
mechanistically modulated two key signaling pathways: STAT3 and NF-
Crucially, the functional relevance of Clec5a-expressing tolDCs was confirmed in vivo. In this study, we specifically identified Treg and M1/M2 cells among the various brain cell types when assessing the impacts of tolDC. Clec5a-expressing tolDCs improved the pathological and behavioral impairments in the MPTP-induced PD model by regulating immune responses in the brain and reducing M1 macrophages but increasing Treg populations, which were associated with anti-inflammatory changes. Although we did not directly assess Treg suppressive function, the accompanying cytokine profile and behavioral improvements suggest their functional relevance. However, the MPTP mice injected with the Clec5a-knockdown tolDCs exhibited more severe pathogenesis and an accelerated loss of dopaminergic neurons. These observations provide compelling evidence that Clec5a plays a vital role in the neuroprotective activity of tolDCs. Although we did not investigate the direct interaction between tolDCs and microglia, the observed effects are likely mediated by peripherally induced Tregs. Exploring how these Tregs influence CNS-resident immune cells, such as microglia, would be an important direction for future studies.
From a translational perspective, DCs offer a unique therapeutic advantage in
neurodegenerative diseases such as PD due to their dual roles in immune
regulation and Ag presentation. This is supported by recent findings indicating
that metabolic risk factors can affect treatment outcomes in PD models [47].
Compared with microglia, DCs are more effective in priming T cells and can
migrate to lymphoid organs, making them superior candidates for CNS immune
modulation [48, 49]. Notably,
Our study provides evidence that Clec5a-expressing tolDCs play an important role
in modulating neuroinflammation and promoting neuroprotection in a PD model. We
demonstrated that Clec5a enhances IL-10 production and Treg populations while
inhibiting NF-
The data supporting the findings of this study are available within the article and Supplementary Material. All data was generated at the Department of Life Science of CHA University and is available from the corresponding authors upon reasonable request.
SYC, JHN, and DSL conceived the study and designed the experiments; SYC, JHN, MSS, JHL, KEN, and JSO performed the experiments; NCJ, JYS, and DSL analyzed and interpreted the data; SYC, JHN, MSS, and DSL wrote the manuscript. All authors contributed to editorial changes in the manuscript. All authors read and approved the final manuscript. All authors have participated sufficiently in the work and agreed to be accountable for all aspects of the work.
All protocols involving the use of animals were reviewed and approved by the Institutional Animal Care and Use Committee of CHA University (Project IACUC210167), and all experiments were conducted in accordance with the relevant regulations and guidelines. Without performing carcinogenic procedures, animals will be euthanized using CO2 gas solely for the purpose of collecting samples for DC generation. The PD mouse model will span a total period of two weeks from initiation to completion. The study will involve the minimum number of animals and a short experimental duration, with close monitoring of behavioral changes to determine appropriate humane endpoints. All animal experiments adhered to the 3R principles (Replacement, Reduction, Refinement).
Not applicable.
This research was supported by the Basic Science Research Program through the National Research Foundation of Korea (NRF), funded by the Ministry of Education (grant number: 2021R1I1A2045723).
The authors declare no conflict of interest.
Supplementary material associated with this article can be found, in the online version, at https://doi.org/10.31083/FBL39570.
References
Publisher’s Note: IMR Press stays neutral with regard to jurisdictional claims in published maps and institutional affiliations.