


 , Ji Yi Choi 2,3,†, Geum Ok Baek 2, Moon Gyeong Yoon 2, Se Ha Jang 2,3, Ji Eun Han 2, Soon Sun Kim 2, Jae Youn Cheong 2, Jee-Yeong Jeong 1,*
 , Jung Woo Eun 2,*
1 Department of Biochemistry, Kosin University College of Medicine, 49267 Busan, Republic of Korea
2 Department of Gastroenterology, Ajou University School of Medicine, 16499 Suwon, Republic of Korea
3 Department of Biomedical Sciences, Ajou University Graduate School of Medicine, 16499 Suwon, Republic of Korea
†These authors contributed equally.
Abstract
Hepatocellular carcinoma (HCC) is the leading cause of cancer-related mortality worldwide. Despite advances in therapeutic approaches, the lack of effective biomarkers continues to limit early detection and prognostic evaluation. Pseudogenes, once considered nonfunctional, have emerged as regulators of biological processes in tumors and as potential biomarkers. This study aimed to identify and validate BMS1 Pseudogene 8 (BMS1P8) as a liver-specific, clinically relevant diagnostic and prognostic biomarker in HCC.
A comprehensive survey of pseudogene expression across different stages of liver disease was performed and validated using clinical HCC samples. Correlation, enrichment, and competing endogenous RNA (ceRNA) analyses integrating matched microRNA (miRNA)-seq and mRNA-seq were used to explore the functional networks surrounding BMS1P8. Public RNA-seq datasets (GSE114564, The Cancer Genome Atlas-Liver Hepatocellular Carcinoma (TCGA_LIHC)) were used to delineate differentially expressed pseudogenes, and 98 paired tumor and non-tumor tissues were assessed using quantitative reverse transcription polymerase chain reaction. Diagnostic and prognostic performances were evaluated using receiver operating characteristic curves and Kaplan–Meier statistics.
BMS1P8 was markedly upregulated in HCC and was overexpressed in 25 other cancer types. Receiver operating characteristics analysis yielded an area under the curve of 0.81, underscoring the diagnostic utility. High BMS1P8 expression and enrichment of cell cycle pathways were associated with poor survival. ceRNA screening revealed an inverse BMS1P8–miR-30c-2-3p correlation and concordant NME/NM23 nucleoside diphosphate kinase 6 (NME6) upregulation, with the BMS1P8/miR-30c-2-3p/NME6 triad further stratifying patient outcomes.
Our findings highlight BMS1P8 as a novel liver-specific biomarker with substantial diagnostic and prognostic value in HCC. Its diagnostic utility suggests its potential application in early detection and personalized treatment strategies, contributing to improved patient outcomes.
Keywords
- hepatocellular carcinoma
- pseudogene
- biomarkers
- diagnosis
- prognosis
Hepatocellular carcinoma (HCC) is one of the most common and lethal malignancies worldwide, representing a major global health burden owing to its high incidence and mortality rates [1]. It typically develops in the context of chronic liver disease, including hepatitis B virus (HBV) or hepatitis C virus (HCV) infection, alcoholic liver disease, and non-alcoholic steatohepatitis (NASH) [2, 3, 4]. Despite advances in the management of early-stage HCC with surgical resection, transplantation, and local ablative therapies, most cases are diagnosed at an advanced stage, contributing to poor long-term outcomes [5].
Thus, the early and accurate detection of HCC is imperative to improve patient survival. Although several diagnostic modalities, including imaging and serological tests, exist, these approaches have inherent limitations. Alpha-fetoprotein (AFP), the most commonly used serum biomarker, lacks the sensitivity and specificity required for reliable screening in the general population [6]. This shortcoming underscores the urgent need for more effective molecular biomarkers that can reliably detect HCC at an early stage and provide prognostic insights.
Recently, pseudogenes have attracted increasing interest as potential cancer biomarkers. Originally viewed as nonfunctional remnants of gene duplication or retrotransposition events, pseudogenes can be transcribed and exhibit regulatory functions like non-coding RNAs [7]. Growing evidence suggests that pseudogenes are involved in diverse biological processes, including cell cycle regulation, signal transduction, and epigenetic control [8]. For example, the phosphatase and tensin homolog pseudogene 1 (PTENP1) has gained attention for its capacity to regulate the tumor-suppressor gene PTEN by functioning as a microRNA (miRNA) decoy, thereby influencing cancer cell proliferation and survival in several malignancies [9, 10, 11]. Similarly, POU class 5 homeobox 1B (POU5F1B), a pseudogene of POU5F1/OCT4, is upregulated in gastric cancer and contributes to oncogenic behaviors [12]. Above these and other studies have underscored how pseudogenes can actively shape tumor biology and serve as potential diagnostic or prognostic markers across diverse cancer types.
In this study, we conducted a comprehensive analysis of pseudogene expression across multiple stages of liver disease and HCC, using publicly available RNA-seq datasets (GSE114564 and The Cancer Genome Atlas - Liver Hepatocellular Carcinoma (TCGA_LIHC)) and clinical samples. Our findings revealed that BMS1 Pseudogene 8 (BMS1P8) is highly upregulated in HCC with strong diagnostic performance and potential prognostic relevance. We further investigated its functional relationships using correlation analyses and pathway enrichment, which implicated BMS1P8 in cell cycle regulation and underscored its importance as a candidate biomarker for HCC. Moreover, competing endogenous RNA (ceRNA) analysis suggested that BMS1P8 may act as a molecular sponge for tumor-suppressive miR-30c-2-3p, thereby reducing the post-transcriptional repression of the oncogenic effector NME/NM23 nucleoside diphosphate kinase 6 (NME6). These findings provide a foundation for future studies to validate BMS1P8’s clinical utility and explore its mechanism of action in hepatocarcinogenesis.
We developed the GSE114564 dataset
(https://www.ncbi.nlm.nih.gov/geo/query/acc.cgi?acc=GSE114564) by integrating
RNA-seq data from previously published HCC-related studies, capturing a range of
phenotypes, including normal liver tissues and various HCC subtypes [13, 14, 15].
This comprehensive dataset, comprising 39,864 genes and 7913 pseudogenes, was
used to characterize the progression from normal liver (NL) to advanced HCC
(aHCC), encompassing intermediate stages such as chronic hepatitis (CH), liver
cirrhosis (LC), dysplastic nodules (DN), and early-stage HCC (eHCC). Differential
expression analysis was performed to identify pseudogenes significantly
upregulated (log2 fold change [FC]
Expression levels in non-tumor (NT) versus tumor (T) samples were further assessed using TCGA_LIHC dataset (https://xenabrowser.net/datapages/?cohort=GDC%20TCGA%20Liver%20Cancer%20(LIHC)&removeHub=https%3A%2F%2Fxena.treehouse.gi.ucsc.edu%3A443), followed by overall survival (OS) and disease-free survival (DFS) analyses to evaluate prognostic relevance. Here, OS was defined as the time from HCC diagnosis to death from any cause, and DFS was defined as the time from curative treatment to disease recurrence. Additionally, pan-cancer expression data from the TCGA database were examined to assess whether BMS1P8 expression was specific to liver cancer or also present in other malignancies. These data were downloaded from the Genomic Data Commons (GDC) hub of UCSC Xena (https://xena.ucsc.edu/) to ensure comprehensive coverage and accessibility [16].
Total RNA was extracted from frozen tissues using QIAzol Reagent (Qiagen, Cat#
79306, Hilden, Germany), following the manufacturer’s instructions. cDNA was
synthesized from 500 ng of total RNA using 5
To validate the BMS1P8 expression patterns identified from public omics data, 98 paired HCC and corresponding non-cancerous liver tissues were obtained from the Biobank of Ajou University Hospital (Suwon, South Korea). qRT-PCR analysis was carried out as described above. Demographic and clinical information, including age, sex, etiology of liver disease, body mass index (BMI), platelet count, serum albumin, total bilirubin, international normalized ratio (INR), creatinine, sodium, aspartate aminotransferase (AST), alanine aminotransferase (ALT), AFP, protein induced by vitamin K absence-II (PIVKA-II), hemoglobin, glucose, total cholesterol levels, and the presence of ascites, was recorded (Table 1).
| Variables | HCC (n = 98) | |
| Age (years), mean |
56 | |
| Male sex, n (%) | 74 (75.5) | |
| Etiology, n (%) | –– | |
| HBV | 91 (92.9) | |
| HCV | 4 (4.1) | |
| Alcohol | 2 (2) | |
| HCV + Alcohol | 1 (1) | |
| Cirrhosis, n (%) | 71 (72.4) | |
| Ascites, n (%) | 15 (15.3) | |
| BMI (kg/m2), mean |
24.1 | |
| Platelet, ×109/L, mean |
178.4 | |
| Albumin (g/dL), mean |
4.5 | |
| Total bilirubin (mg/dL), mean |
0.8 | |
| INR, mean |
1.1 | |
| Creatinine (mg/dL), mean |
0.92 | |
| Sodium (mmol/L), mean |
139.3 | |
| AST (U/L), mean |
43.5 | |
| ALT (U/L), mean |
40.5 | |
| AFP (ng/mL), mean |
3185.2 | |
| PIVKA-II (mAU/mL), mean |
8711.3 | |
| Hemoglobin (g/dL), mean |
14.4 | |
| Glucose (mg/dL), mean |
123.0 | |
| Total cholesterol (mg/dL), mean |
170.4 | |
AFP, alpha-fetoprotein; ALT, alanine aminotransferase; AST, aspartate aminotransferase; BMI, body mass index; HBV, hepatitis B virus; HCC, hepatocellular carcinoma; HCV, hepatitis C virus; INR, international normalized ratio; PIVKA-II, protein induced by vitamin K absence-II.
Gene Ontology (GO) analyses of the enriched genes were performed using the enrichGO function in the R clusterProfiler package (v3.18.1, Bioconductor; https://bioconductor.org/packages/clusterProfiler). Enrichment analysis of the MSigDB Hallmark 2020 database (Broad Institute, Cambridge, MA, USA; https://www.gsea-msigdb.org/gsea/msigdb) was conducted using the enrichr function in the R enrichR package (v3.0; https://cran.r-project.org/package=enrichR). Additional pathway analyses, including the Kyoto Encyclopedia of Genes and Genomes (KEGG) 2021 Human (Kanehisa Laboratories, Kyoto, Japan; https://www.genome.jp/kegg/) and Reactome Pathways 2024 (Ontario Institute for Cancer Research, Toronto, Canada; https://reactome.org), were also carried out with clusterProfiler to identify biological processes and signaling pathways potentially associated with BMS1P8.
A composite risk score was calculated by standardizing expression levels of the seven genes (BMS1P8, CCNB2, CDC20, CDC45, ESPL1, PLK1, and PTTG1) using Z-score transformation across the TCGA_LIHC cohort. Z-scores were computed for each gene as follows:
where X is the individual gene expression, µ is
the mean expression, and
This composite metric integrates the combined expression pattern into a single prognostic variable. Receiver operating characteristic (ROC) curve analysis was subsequently performed using these risk scores to evaluate the diagnostic and prognostic performance of the 7-gene signature.
Raw mature-miRNA read counts for TCGA_LIHC were downloaded from the GDC using
the TCGAbiolinks pipeline (v2.30.1, Bioconductor;
https://bioconductor.org/packages/TCGAbiolinks) [17, 18]. Counts were filtered to
retain miRNAs expressed at
For ceRNA screening, Pearson correlation coefficients (r) were calculated
between BMS1P8 and each miRNA across matched mRNA- and miRNA-seq tumor
samples. Candidate tumor-suppressive miRNAs were defined as (i) downregulated in
tumors (log2 FC
All results are expressed as mean
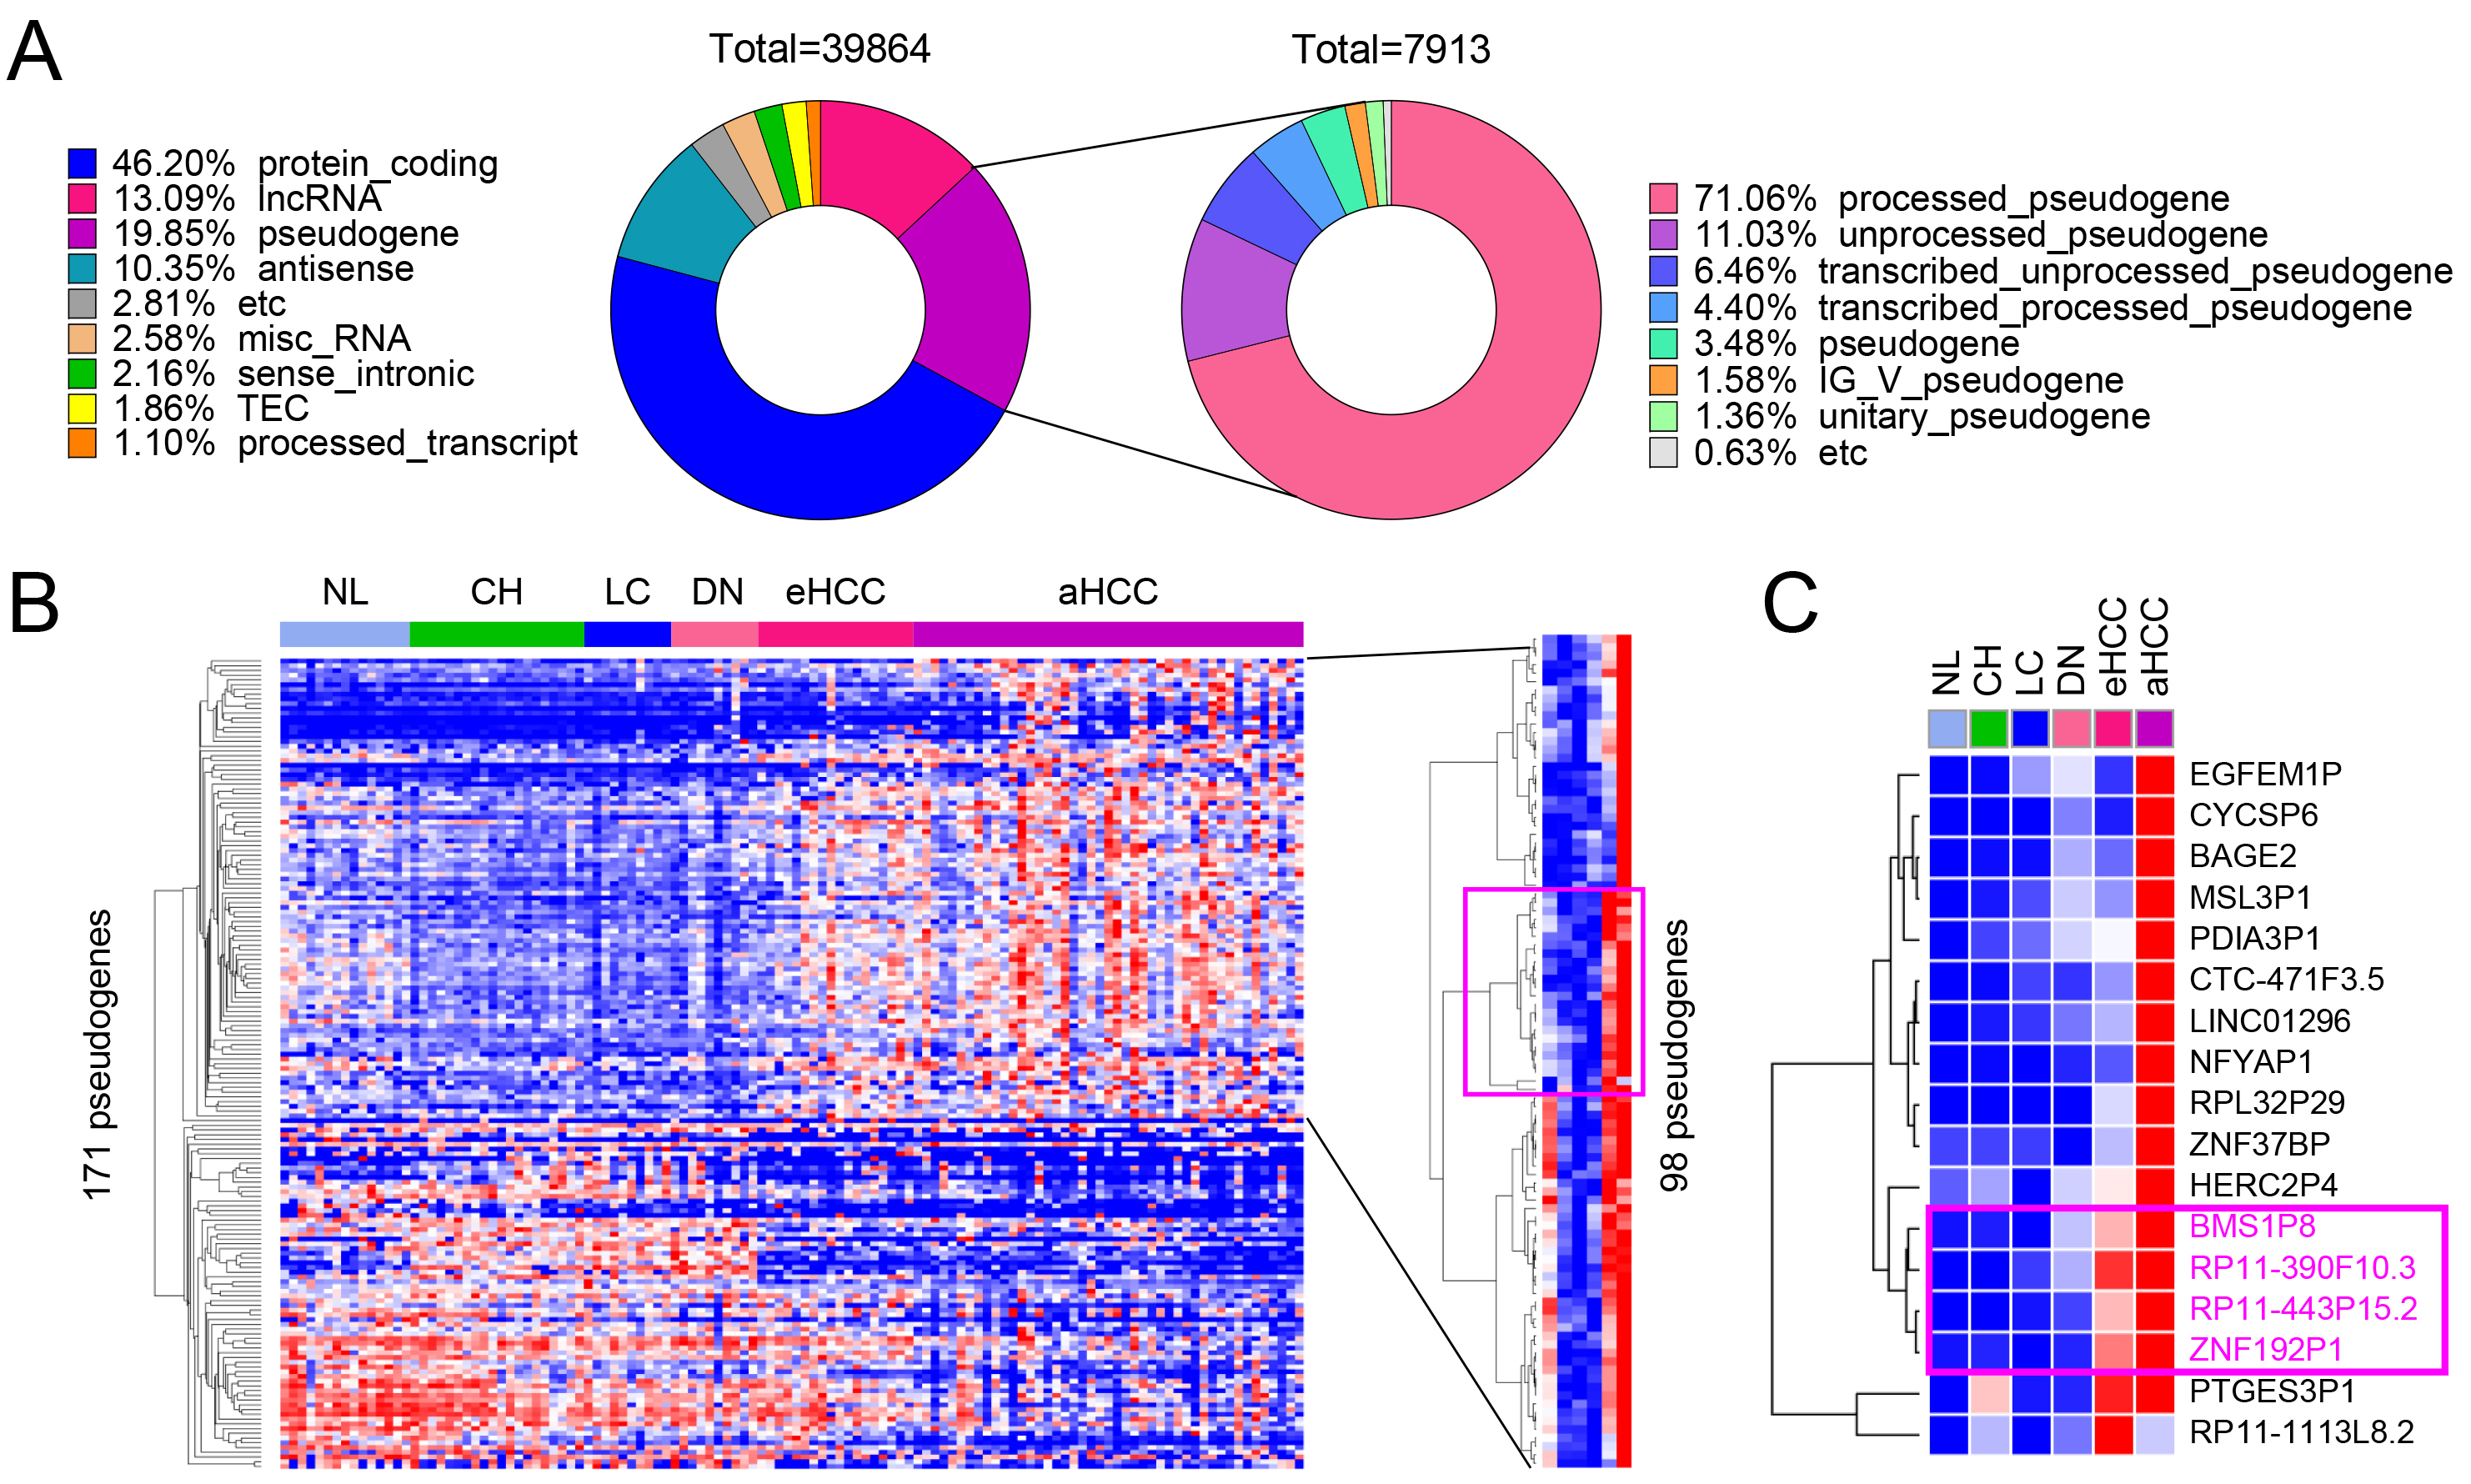
Using the multistage liver disease and cancer dataset GSE114564, RNA sequencing analysis was conducted to systematically evaluate gene expression changes across different stages of liver disease and cancer progression. A total of 39,864 genes were analyzed, classified into eight categories based on their coding potential: protein-coding genes (46.20%), long non-coding RNA (lncRNA) genes (13.09%), pseudogenes (19.85%), antisense transcripts (10.35%), miscellaneous RNA (2.58%), sense intronic RNA (2.16%), and processed transcripts (1.10%) (Fig. 1A, left pie chart). Among these, 7913 pseudogenes were identified and further categorized based on their biogenesis and characteristics. The majority, 71.06%, were processed pseudogenes, which are retro-transposed copies of functional genes that have lost their coding potential. The second-largest group, 11.03%, included unprocessed pseudogenes that retain introns and resemble their parent genes. Additionally, 6.46% were transcribed unprocessed pseudogenes, and 4.40% were transcribed processed pseudogenes. Smaller fractions included 3.48% generic pseudogenes, 1.58% IG_V_pseudogenes, and 1.36% unitary pseudogenes. The remaining 0.63% were classified as etc., encompassing pseudogenes with ambiguous or uncommon features (Fig. 1A, right pie chart).
 Fig. 1.
Identification of differentially expressed pseudogenes in HCC. (A) Gene composition of the GSE114564 dataset, including 39,864 genes, with 7913 pseudogenes. (B) Heatmap of 171 pseudogenes showing differential expression across liver disease stages including non-cancerous liver (NL, normal liver; CH, chronic hepatitis; LC, liver cirrhosis; DN, dysplastic nodule) and tumor (eHCC, early-stage HCC; aHCC, advanced HCC) tissues, with 98 pseudogenes significantly upregulated during HCC progression. (C) Key upregulated pseudogenes, including BMS1P8, RP11-390F10.3, RP11-443P15.2, and ZNF192P1, identified as potential HCC diagnostic markers.
Based on these classifications, the hepatic tissue samples were categorized into six groups to represent the different stages of liver disease and cancer progression: NL, CH, LC, DN, eHCC, and aHCC (Fig. 1B). Heatmap analysis of 171 differentially expressed pseudogenes revealed dynamic expression patterns across these stages, with 98 pseudogenes significantly upregulated in advanced HCC (Fig. 1B). Notably, BMS1P8, RP11-390F10.3, RP11-443P15.2, and ZNF192P1 showed consistent upregulation during disease progression, highlighting their potential role in driving HCC development (Fig. 1C). Although PTGES3P1 clustered with other upregulated pseudogenes in early- and late-stage HCC (Fig. 1C), further analysis indicated it may not be a robust liver cancer–specific biomarker. PTGES3P1 showed elevated expression in the chronic hepatitis (CH) group, suggesting non-specific upregulation. Analysis of variance (ANOVA) with Tukey’s multiple comparisons test revealed significant differences only between normal liver and aHCC and between LC and aHCC, without consistent stepwise increases in HCC progression. Moreover, ROC analysis yielded an AUC below 0.7 for distinguishing tumor from non-tumor tissues, indicating limited diagnostic potential. Based on these findings, we concluded that PTGES3P1 does not meet the criteria for a promising HCC-specific biomarker (Supplementary Fig. 1A). These findings underscore the importance of pseudogene expression in the molecular landscape of liver cancer progression.
The expression patterns of four pseudogenes, BMS1P8, RP11-390F10.3, RP11-443P15.2, and ZNF192P1, were analyzed across six stages of liver disease progression (NL, CH, LC, DN, eHCC, and aHCC) using the GSE114564 dataset. Among these, BMS1P8, RP11-443P15.2, and ZNF192P1 exhibited progressive and statistically significant increases in expression as the disease advanced, reaching peak levels in advanced HCC. In contrast, RP11-390F10.3 showed a less pronounced and statistically non-significant increase across the stages (Fig. 2A, left panels for each pseudogene).
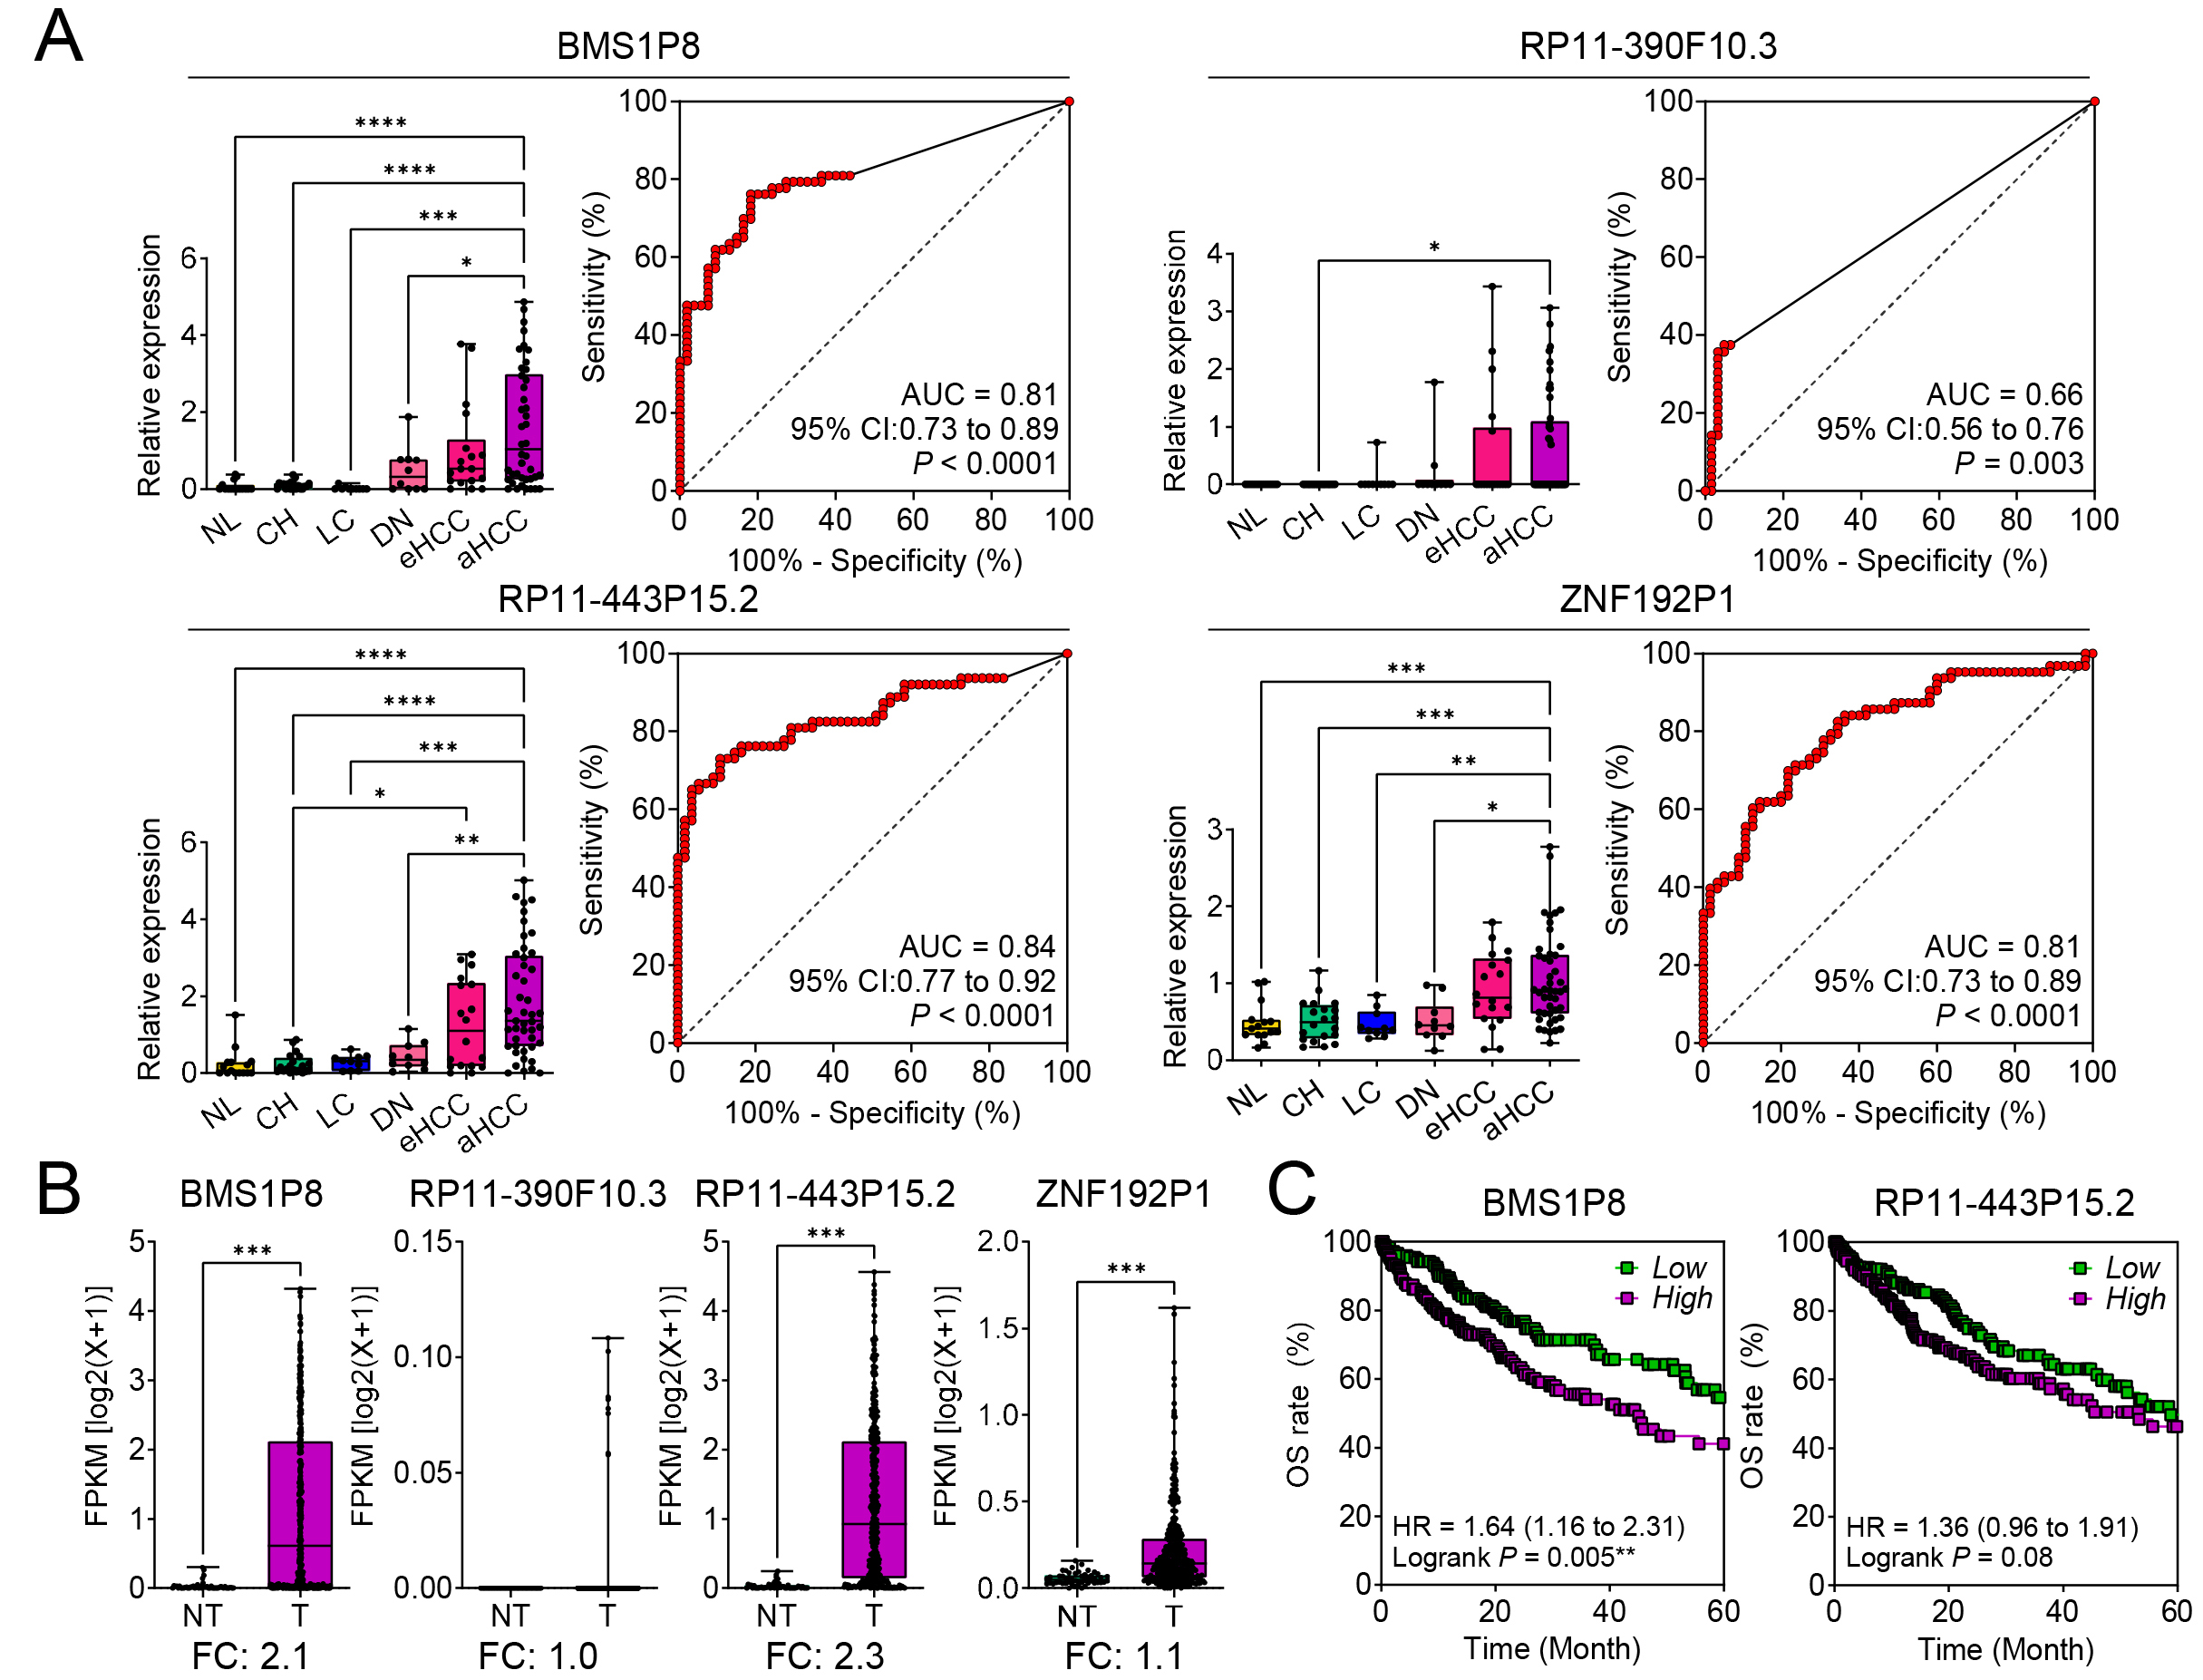 Fig. 2.
Diagnostic and prognostic significance of four pseudogenes in
hepatocellular carcinoma (HCC) progression. (A) Relative expression levels of BMS1P8,
RP11-390F10.3, RP11-443P15.2, and ZNF192P1 in NL, CH,
LC, DN, eHCC, and aHCC, based on the GSE114564 dataset (the left panels for each
pseudogene). Receiver operating characteristic (ROC) curves demonstrate the
diagnostic performance of each pseudogene in distinguishing HCC from non-tumor
liver tissue, with area under the curve (AUC) values and 95% confidence
intervals (CIs) (the right panels for each pseudogene). (B) Validation of
tumor-specific expression for the four pseudogenes in paired non-tumor (NT) and
tumor (T) tissues from The Cancer Genome Atlas - Liver Hepatocellular Carcinoma
(TCGA_LIHC) dataset (n = 421). The y-axis represents fragments per kilobase of
transcript per million mapped reads (FPKM) on a log2(x + 1) scale,
highlighting fold changes (FC). (C) Kaplan–Meier overall survival (OS) analyses
for BMS1P8 and RP11-443P15.2 in the TCGA_LIHC dataset.
High-expression groups (purple) show worse survival compared to low-expression
groups (green). Hazard ratios (HRs), 95% CIs, and log-rank p values are
presented. Statistically significant differences were determined using the
log-rank test; *p
The diagnostic potential was assessed through ROC curve analysis. Among the four
pseudogenes, BMS1P8 showed strong diagnostic performance with an AUC of
0.81 (95% CI: 0.73–0.89, p
To validate tumor-specific expression, these pseudogenes were analyzed in T (n =
371) versus NT (n = 50) tissues using the TCGA_LIHC dataset. BMS1P8 and
RP11-443P15.2 were significantly upregulated in tumor tissues, with fold
changes (FCs) of 2.1 and 2.3, respectively (p
Kaplan–Meier survival analysis revealed the prognostic significance of BMS1P8 and RP11-443P15.2. High expression of BMS1P8 was significantly associated with poorer OS, with a hazard ratio (HR) of 1.64 (95% CI: 1.16–2.31, p = 0.005) (Fig. 2C, left). While RP11-443P15.2 showed a trend toward worse survival, its result was not statistically significant (HR = 1.36, 95% CI: 0.96–1.91, p = 0.08) (Fig. 2C, right). These findings highlight BMS1P8 as a strong candidate for further investigation owing to its diagnostic and prognostic value in liver disease and HCC progression.
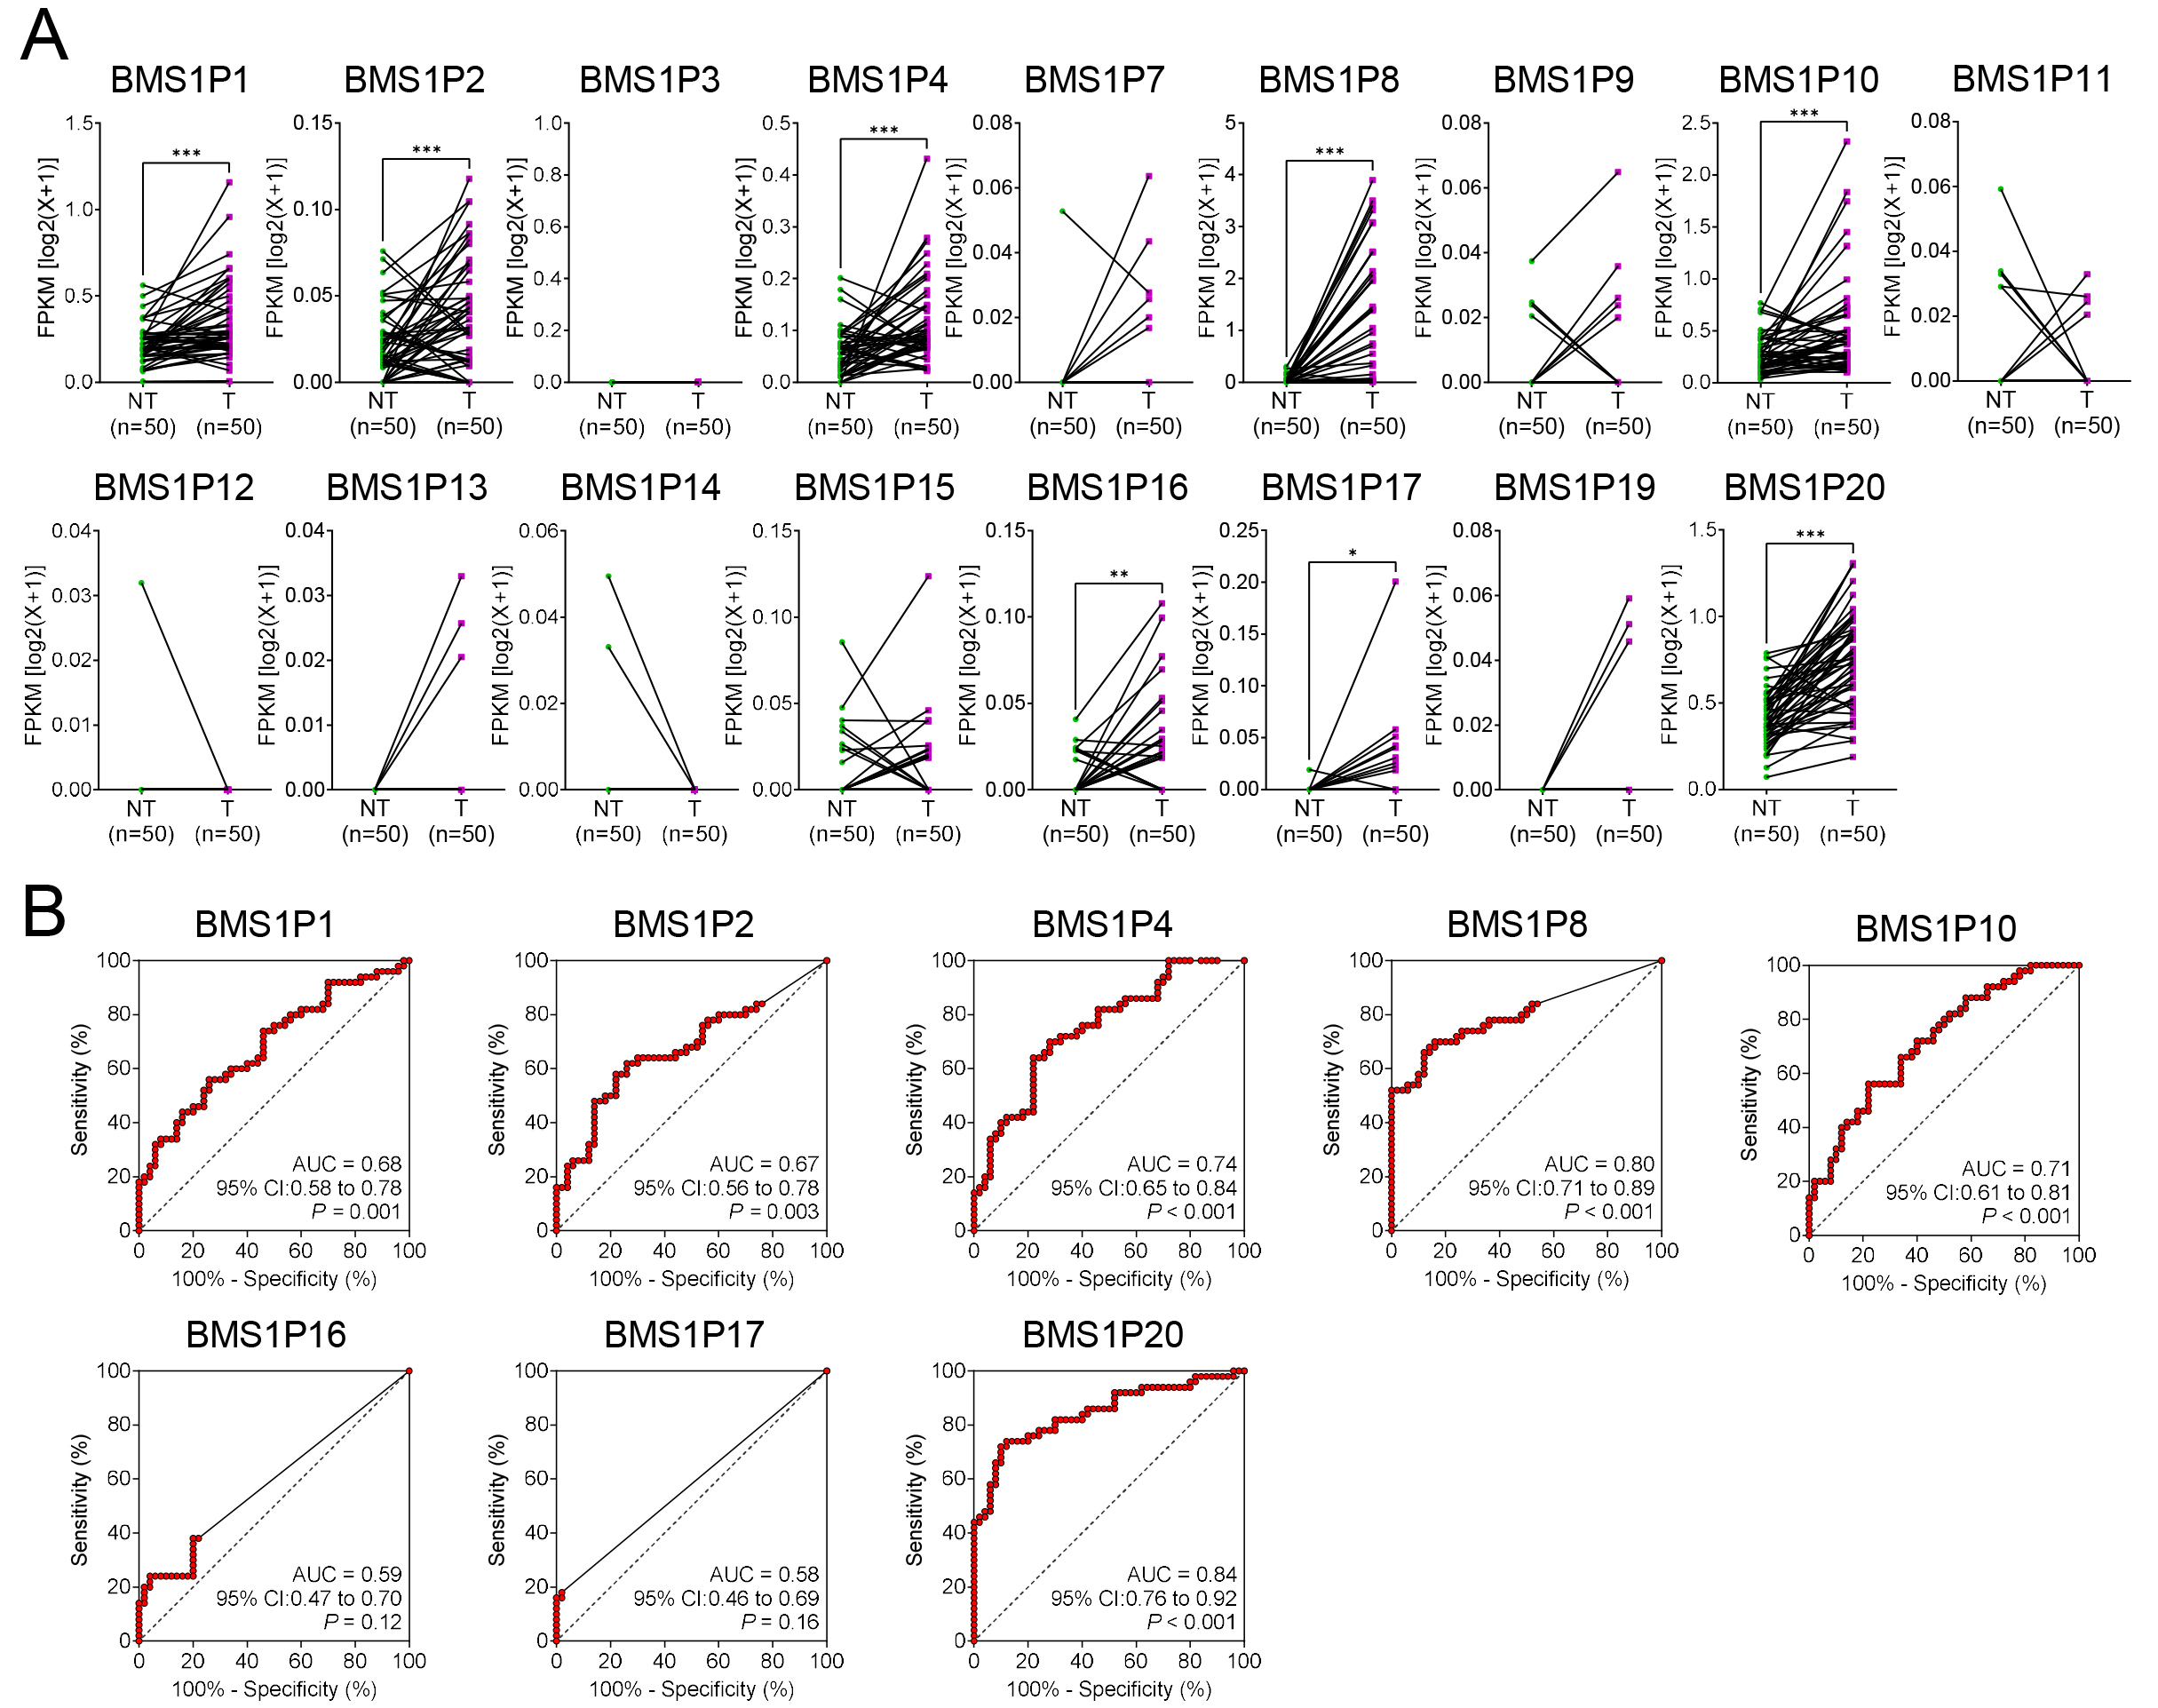
To evaluate the diagnostic potential of BMS1-derived pseudogenes in HCC, matched T and NT tissue pairs (n = 50) were examined to identify the pseudogenes that were significantly upregulated in cancerous liver tissues. Among the 17 tested genes, eight, including BMS1P1, BMS1P2, BMS1P4, BMS1P8, BMS1P10, BMS1P16, BMS1P17, and BMS1P20, exhibited markedly higher expression levels in tumor tissues than those in their NT counterparts (Fig. 3A).
 Fig. 3.
Comparative expression and diagnostic evaluation of
BMS1 pseudogenes in matched HCC and non-tumor liver tissues. (A)
Expression patterns of 17 BMS1 pseudogenes in paired non-tumor (NT) and
tumor (T) samples (n = 50). Each connected line represents an individual patient
sample. The y-axis shows fragments per kilobase of transcript per million mapped
reads (FPKM) on a log2(x + 1) scale. (B) Receiver operating characteristic
(ROC) curves evaluating the diagnostic performance of the eight most upregulated
BMS1 pseudogenes (BMS1P1, BMS1P2, BMS1P4,
BMS1P8, BMS1P10, BMS1P16, BMS1P17, and
BMS1P20) in distinguishing tumor from non-tumor tissues. Area under the
curve (AUC), 95% confidence interval (CI), and corresponding p values
are shown for each pseudogene. Higher AUC values indicate stronger diagnostic
potential. Statistical significance levels (*p
ROC curve analyses were then performed to assess the diagnostic performance of each pseudogene. While several BMS1 pseudogenes demonstrated moderate diagnostic capabilities (AUC = 0.58–0.74), both BMS1P8 and BMS1P20 showed particularly high AUC values of 0.80 (95% CI: 0.71–0.89) and 0.84 (95% CI: 0.76–0.92), respectively, indicating strong potential for HCC detection (Fig. 3B).
Although BMS1P20 appeared to be a strong candidate based on the preliminary findings, further validation using a dataset encompassing multistage liver disease and HCC progression (GSE114564) revealed limited diagnostic relevance. BMS1P20 did not exhibit a statistically significant differential expression between non-cancerous and cancerous tissues, and its AUC value for distinguishing these groups was relatively low (AUC = 0.60, p = 0.06) (Supplementary Fig. 1). In contrast, BMS1P8 consistently demonstrated robust diagnostic performance across both datasets and maintained significant differences in expression between the T and NT samples (Fig. 2A). Collectively, these findings highlight BMS1P8 as the most promising BMS1 pseudogene marker for HCC diagnosis, underscoring its potential utility for early detection and guiding future investigations into the clinical implications of pseudogene-based biomarkers.
To investigate the potential cancer-specific expression of BMS1P8, we initially performed a broad pan-cancer survey using TCGA database, spanning 25 different tumor types. BMS1P8 expression was largely undetectable or remained at very low levels in most cancer types. In contrast, LIHC samples exhibited a pronounced increase in BMS1P8 expression relative to NT tissues (Fig. 4A). This discrepancy underscores the possibility that BMS1P8 plays a role in the oncogenic processes of the liver rather than in a broad spectrum of malignancies.
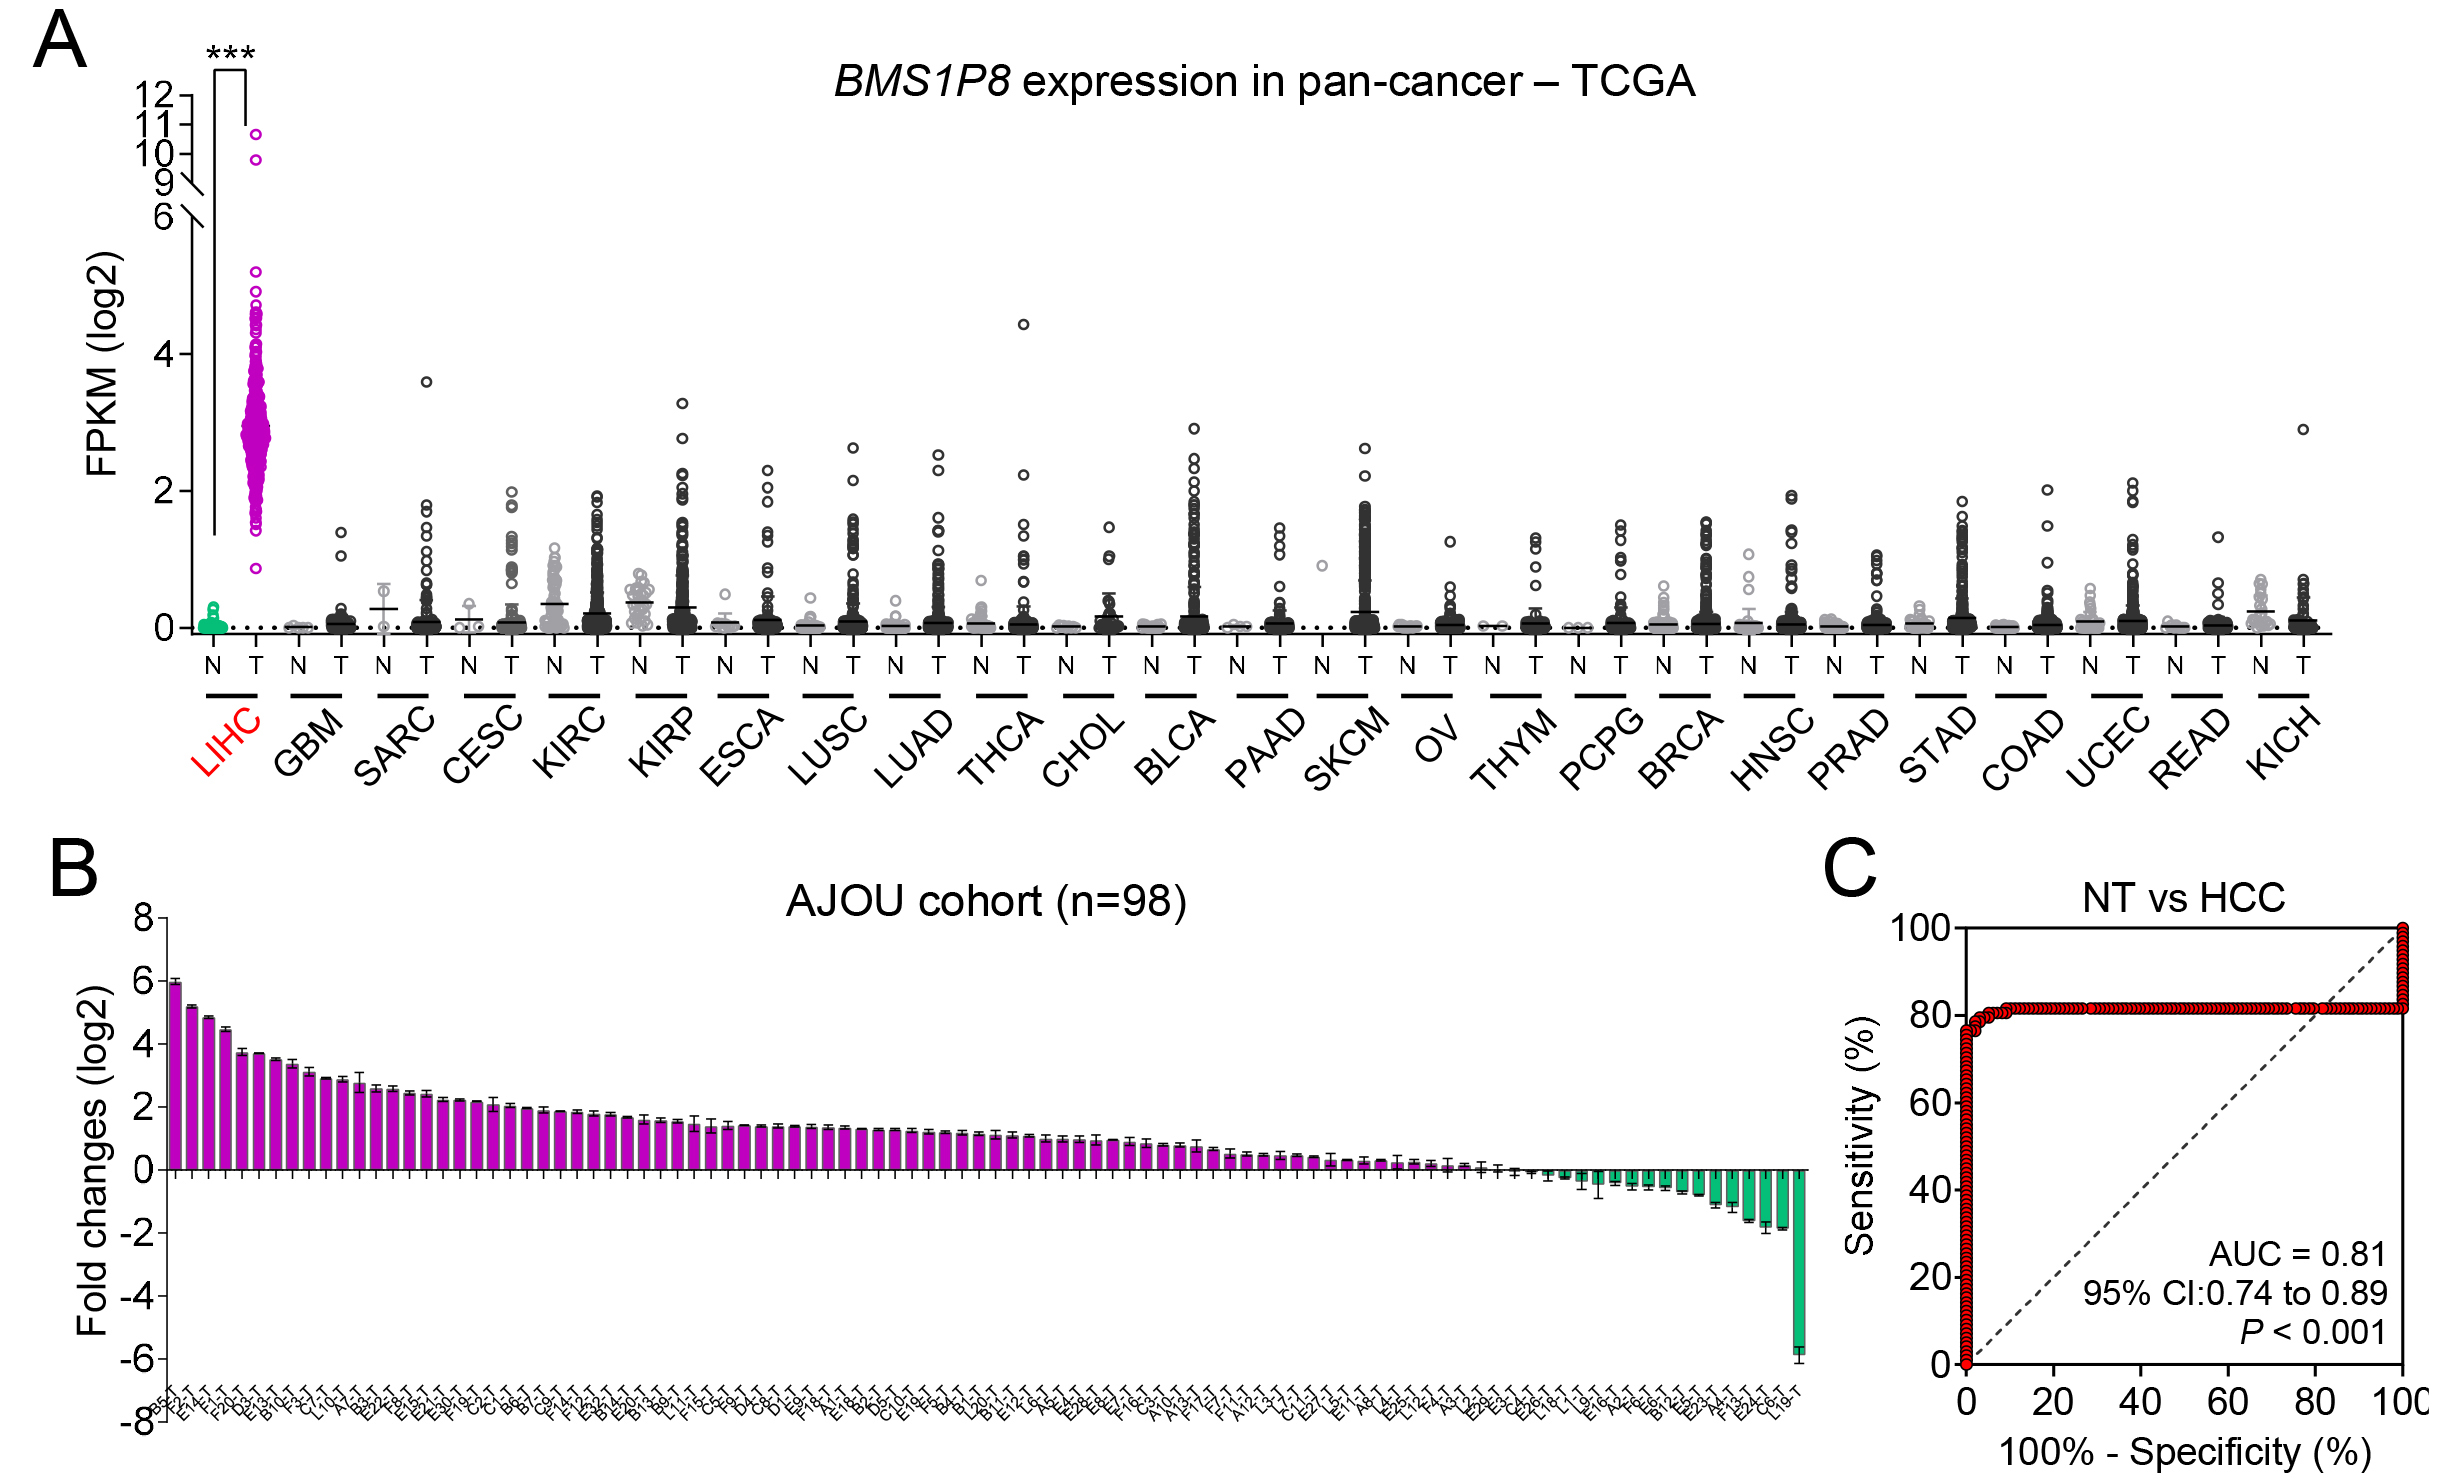 Fig. 4.
BMS1P8 exhibits liver-specific overexpression and
robust diagnostic potential in an independent HCC cohort. (A) Pan-cancer
analysis of BMS1P8 expression across 25 tumor types in the TCGA dataset.
The y-axis indicates FPKM on a log2 scale, highlighting that BMS1P8
is predominantly overexpressed in LIHC compared with other malignancies. (B) Fold
change (log2) of BMS1P8 expression in 98 paired HCC and non-tumor
liver tissues from the Ajou University cohort. Bars above the x-axis indicate
samples with upregulated BMS1P8, while those below represents
downregulation. (C) ROC curve evaluating BMS1P8 as a diagnostic marker for
distinguishing HCC from NT tissues in the Ajou University cohort. The area under
the curve (AUC) is 0.81 (95% CI: 0.74–0.89, p
To confirm these pan-cancer observations at the clinical level, paired tumor and NT liver tissues were collected from 98 patients with HCC undergoing hepatectomy. The relevant clinical information is detailed in Table 1. qRT-PCR revealed that 80 of 98 (82%) patient samples demonstrated significantly elevated BMS1P8 expression (Fig. 4B), thus reinforcing the findings from both the TCGA and GSE114564 datasets. The high proportion of overexpressing cases suggests that BMS1P8 may be functionally relevant to HCC pathogenesis or tumor progression.
In alignment with these expression data, BMS1P8 exhibited robust
diagnostic performance in distinguishing HCC tissues from non-tumor tissues.
Specifically, ROC curve analysis yielded an AUC of 0.81 (95% CI: 0.74–0.89,
p
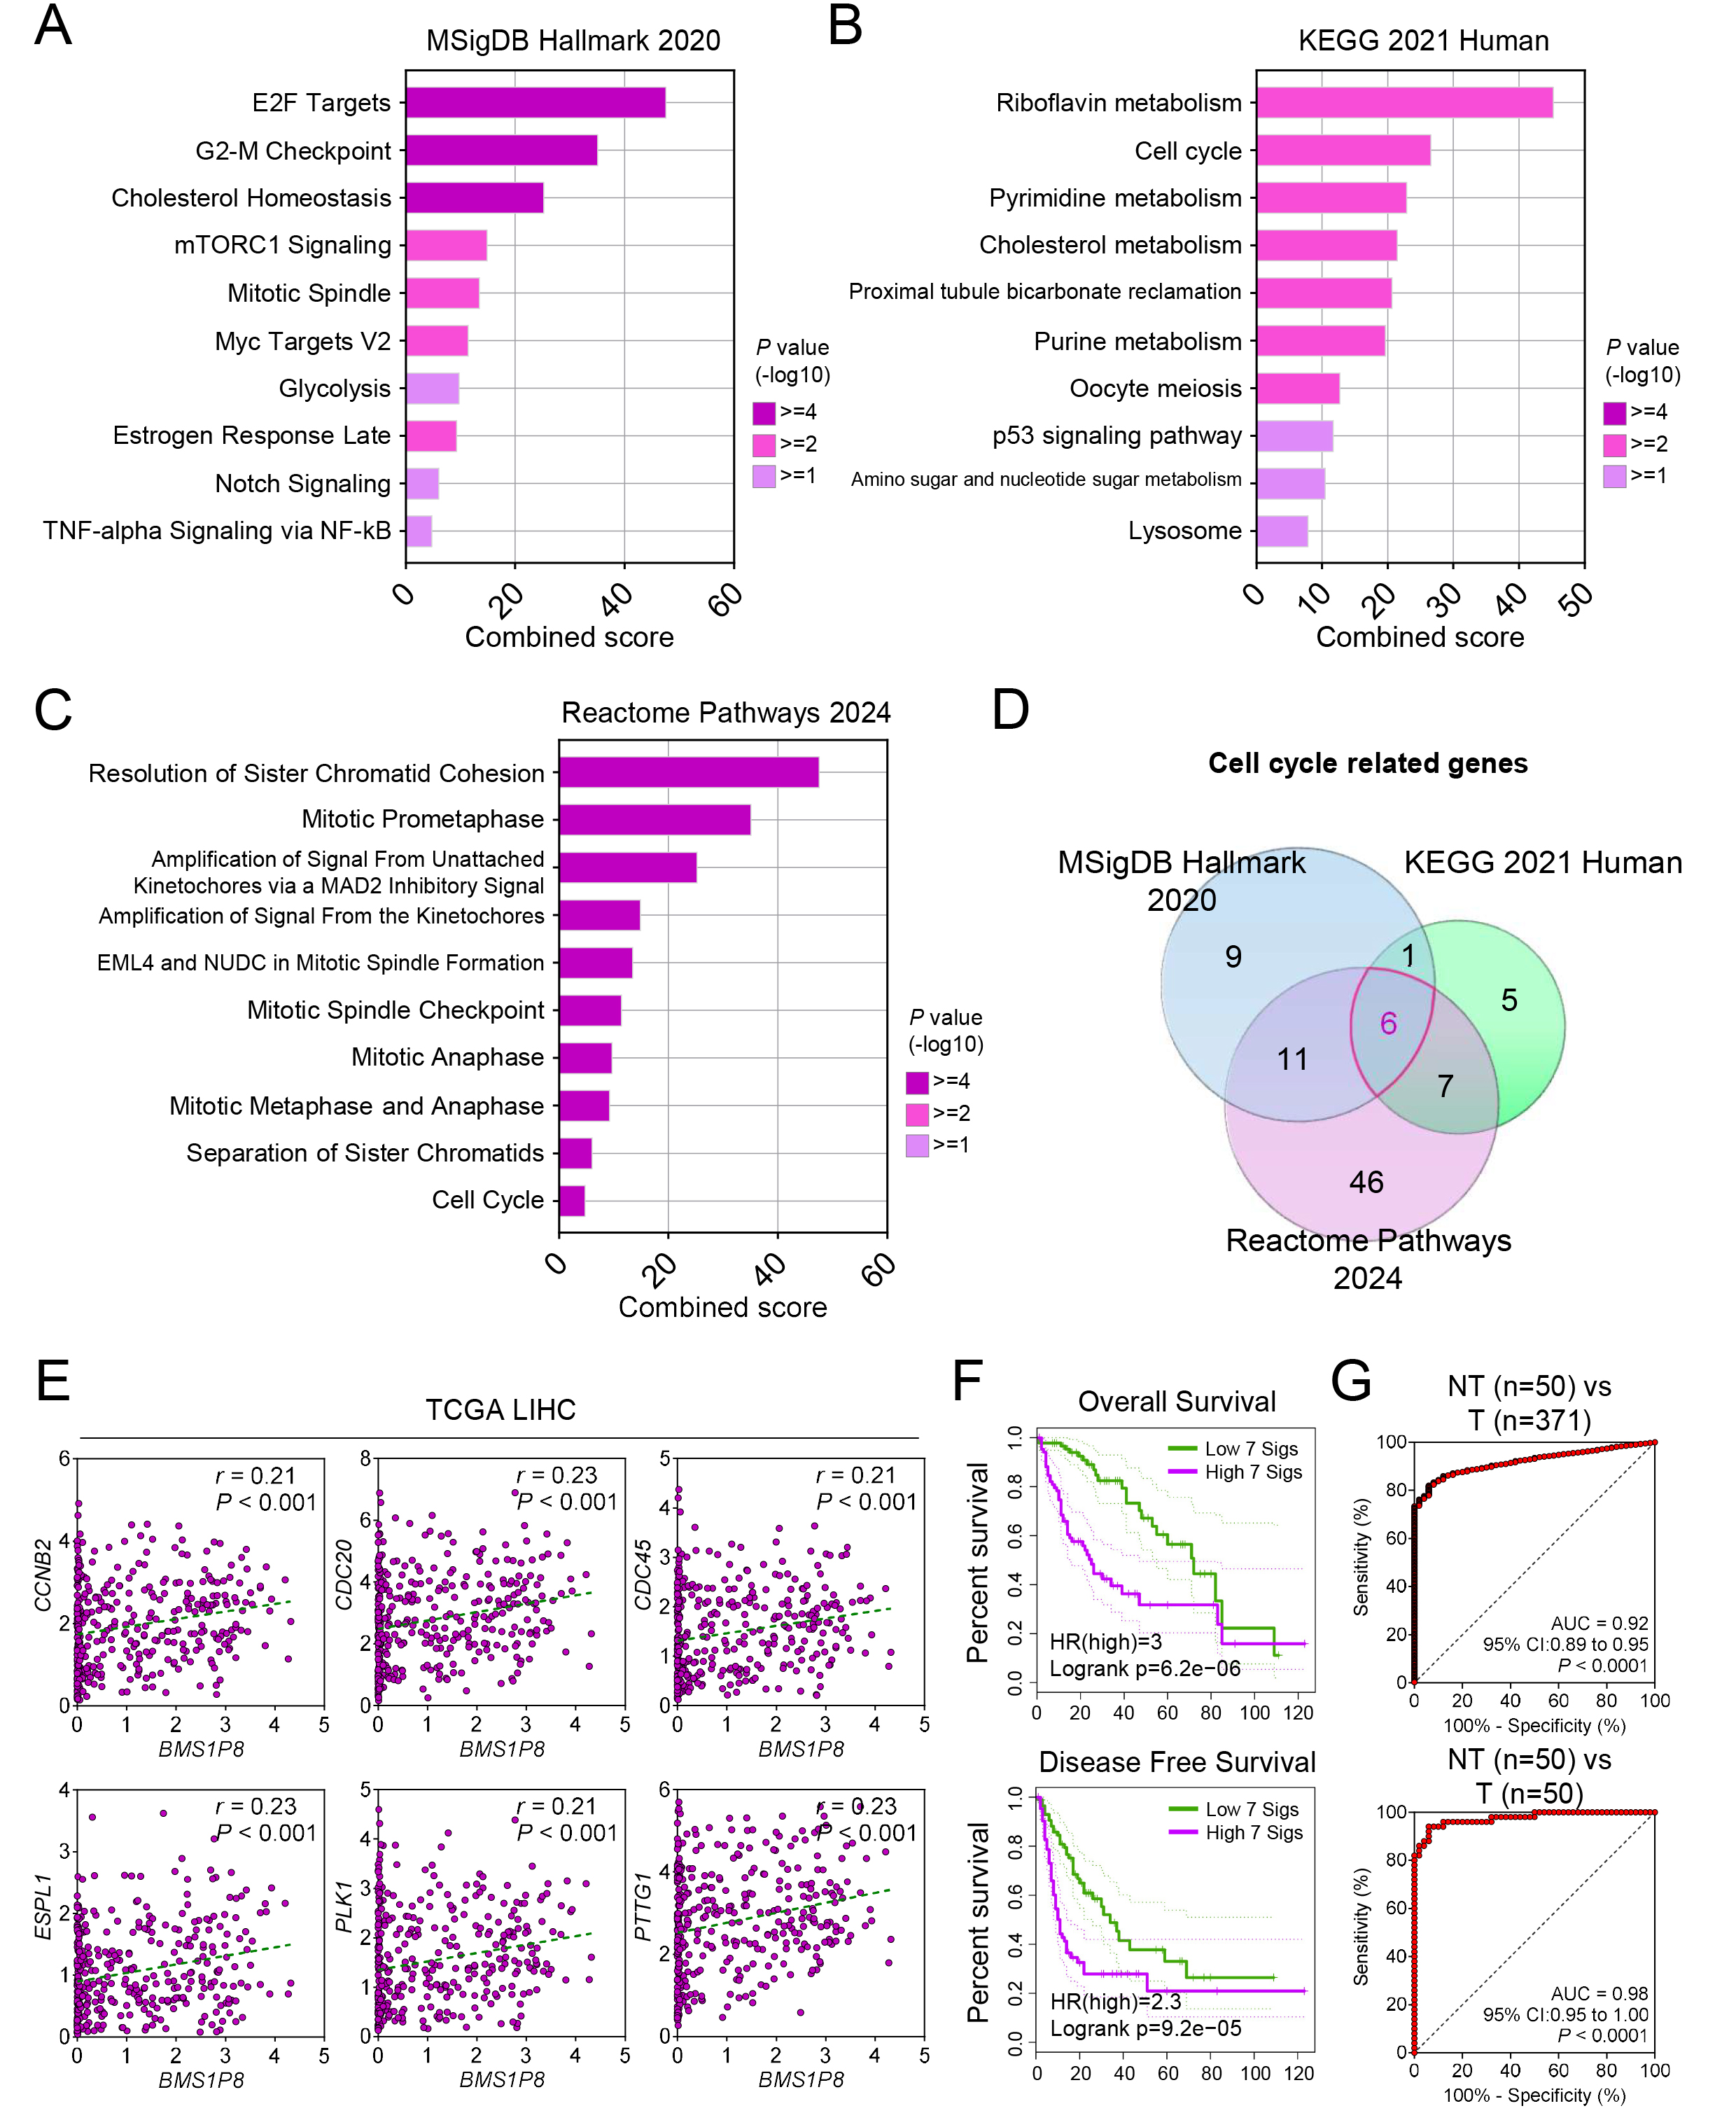
To elucidate the functional importance of BMS1P8 in HCC, correlation
analysis in the TCGA_LIHC dataset identified 1784 genes (
 Fig. 5.
BMS1P8 and its cell cycle–related 7-gene signature
predict prognosis and accurately distinguish HCC tissues. Pathway enrichment
analyses of BMS1P8-correlated genes (
A Venn diagram analysis focusing on cell cycle–related genes correlated with
BMS1P8 across the three databases uncovered six overlapping genes, such
as CCNB2, CDC20, CDC45, ESPL1, PLK1,
and PTTG1 (Fig. 5D). Subsequent validation within the TCGA_LIHC dataset
confirmed significant positive correlations (r
To assess prognostic implications, BMS1P8 was combined with the six
correlated cell cycle genes to form a 7-gene signature (7 sigs), comprising
BMS1P8 plus the six correlated genes including CCNB2, CDC20,
CDC45, ESPL1, PLK1, and PTTG1. Kaplan–Meier
analyses of OS and DFS revealed significantly worse outcomes in patients
exhibiting high expression of this signature (Fig. 5F). Specifically, OS analysis
yielded a log-rank p = 6.2
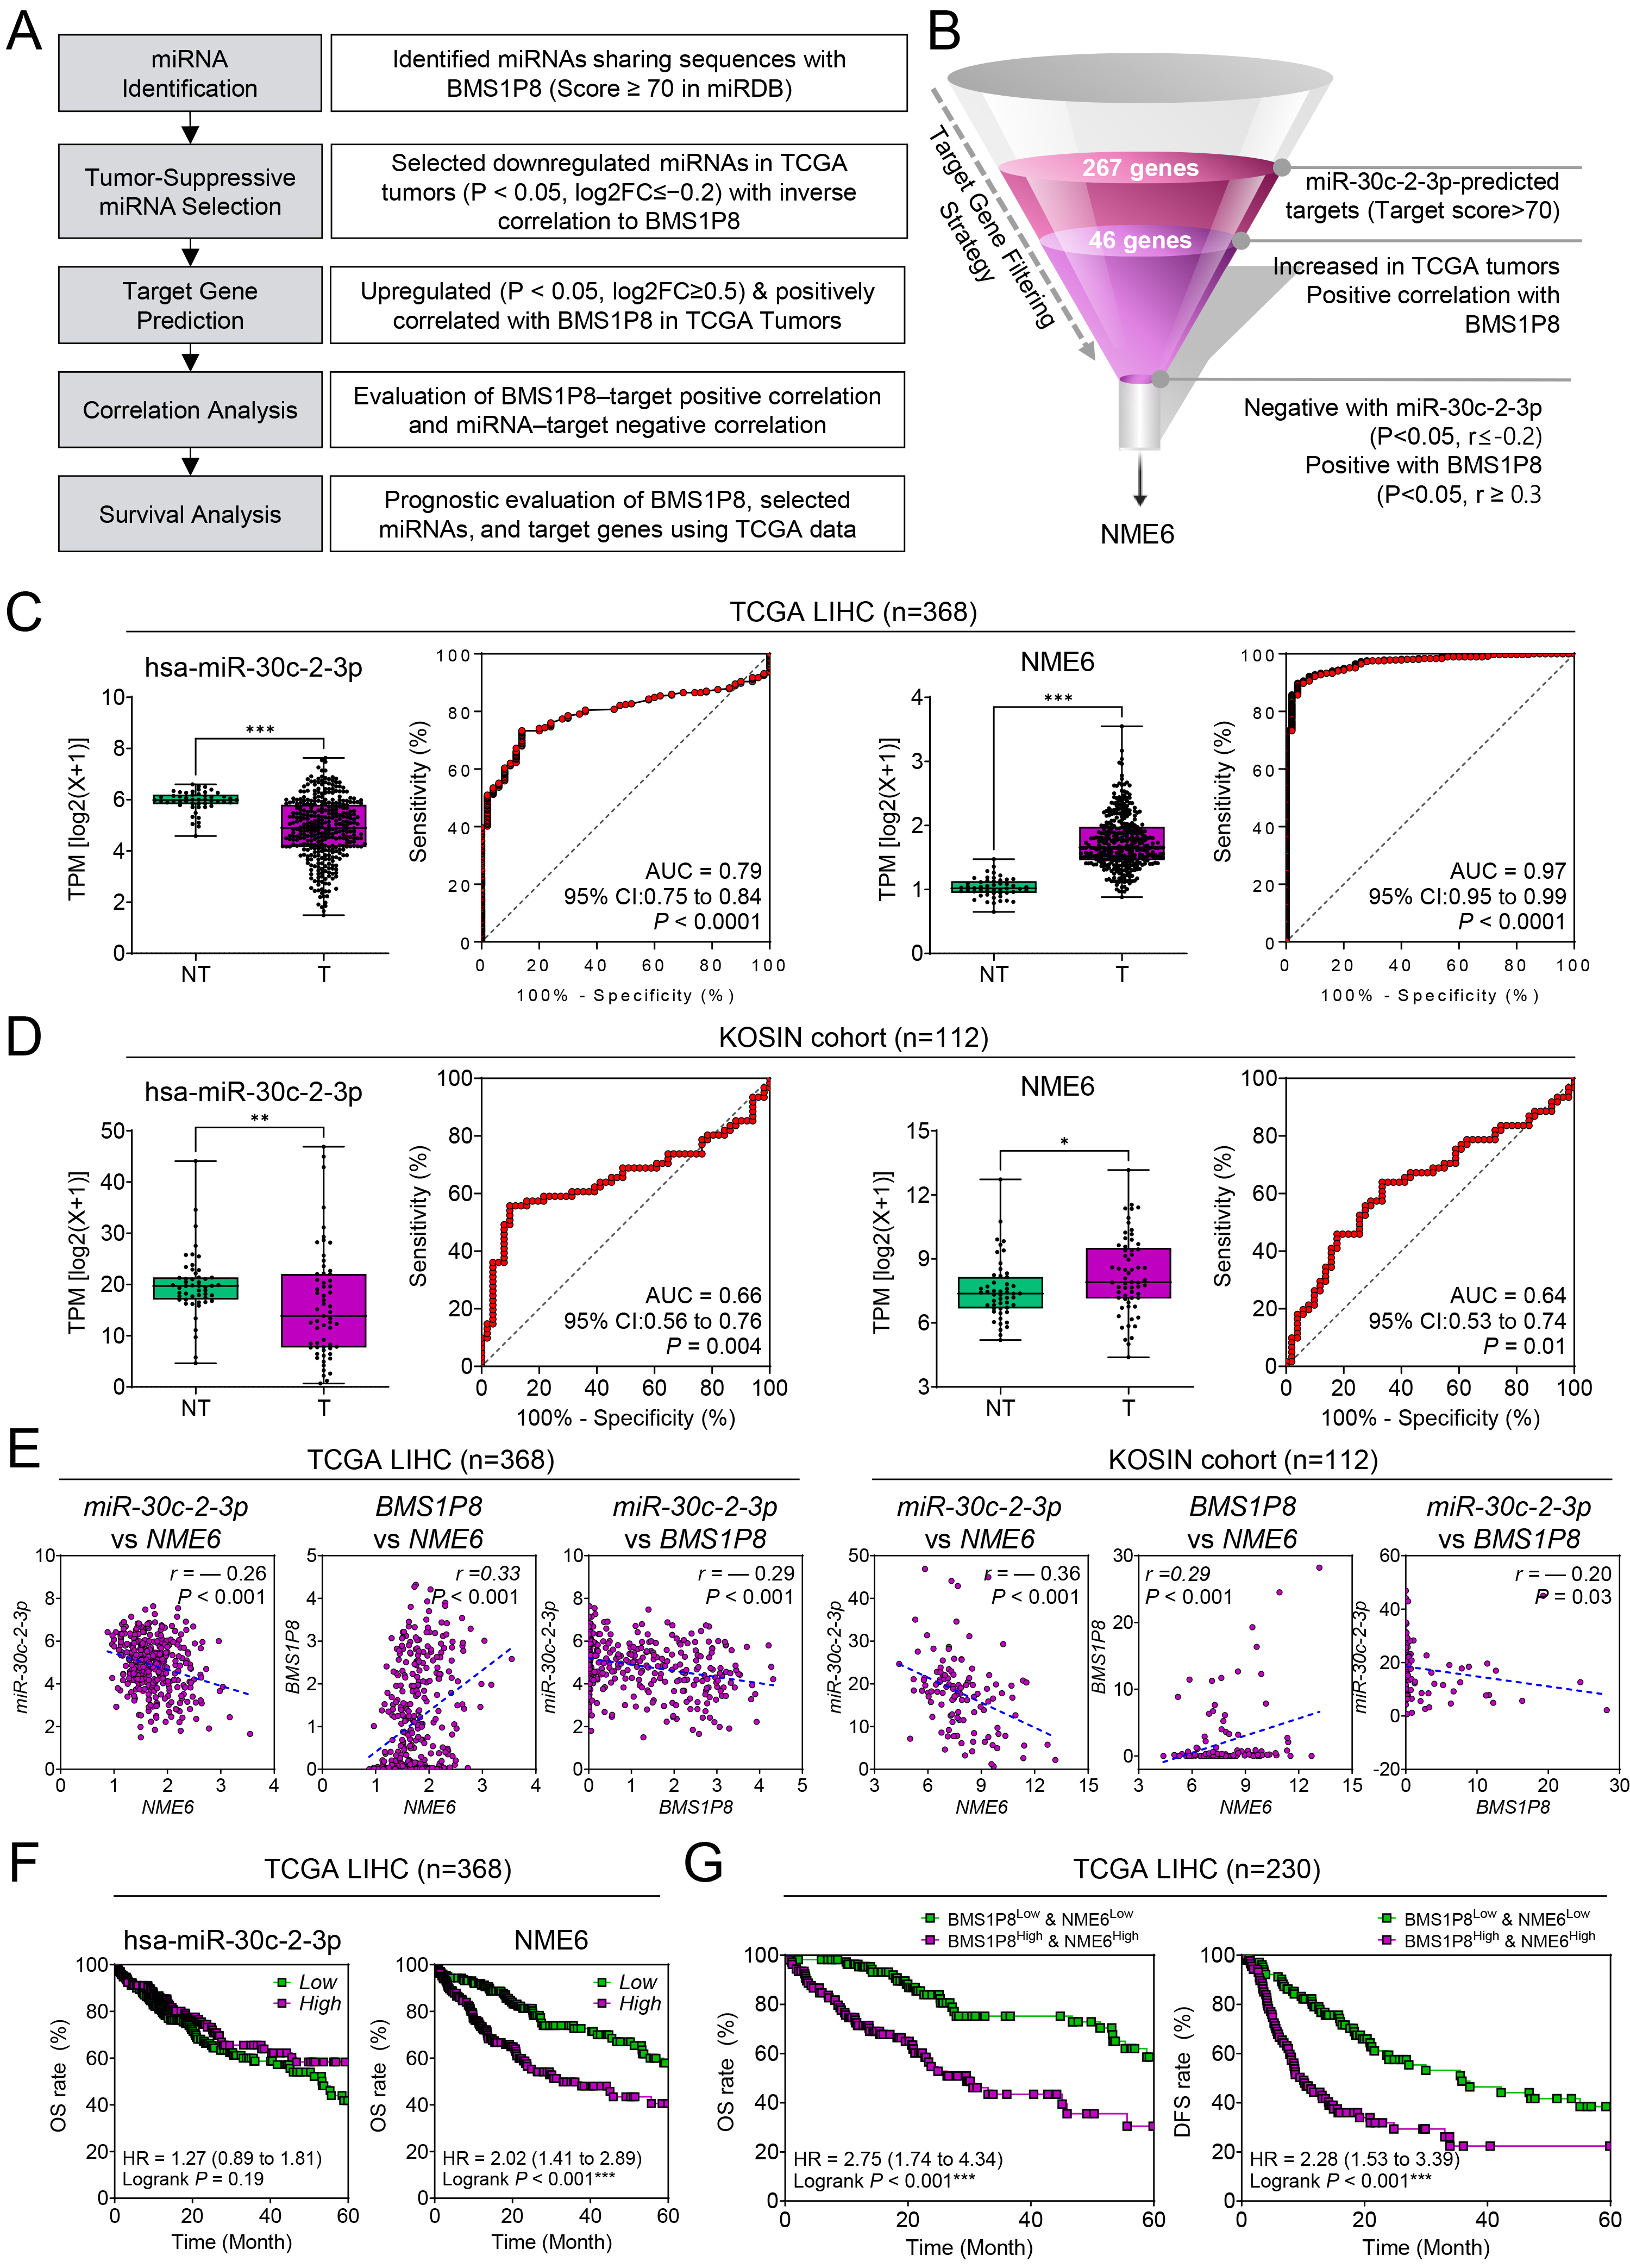
Because pseudogenes, like lncRNAs, are well known to function as ceRNAs
modulating miRNA availability and downstream gene expression, we investigated
whether BMS1P8 might engage in a ceRNA regulatory network influencing
HCC progression [10]. This analysis aimed to explore a potential mechanistic link
by identifying miRNAs that could interact with BMS1P8 and affect
expression of relevant oncogenic targets. Following the analytical workflow (Fig. 6A), miRNAs sharing complementary sequences with BMS1P8 were identified
using BLAST (https://blast.ncbi.nlm.nih.gov/Blast.cgi) and miRNA-target
prediction from miRDB. Among the seven downregulated miRNAs that showed negative
correlations with BMS1P8 in HCC (Supplementary Table 1,
Supplementary Fig. 2), we focused on hsa-miR-30c-2-3p, which showed the
most significantly reduced expression in HCC and the strongest negative
correlation with BMS1P8. miRDB prediction yielded 267 target genes with
a target score
 Fig. 6.
A BMS1P8–miR-30c-2-3p–NME6 competing-endogenous-RNA
(ceRNA) axis in HCC. (A) Analytical workflow showing the five-step
in-silico pipeline that identified miR-30c-2-3p and its target
NME6 within the BMS1P8 ceRNA network. (B) Funnel diagram
summarizing progressive filtering of miR-30c-2-3p targets: 267 predicted targets
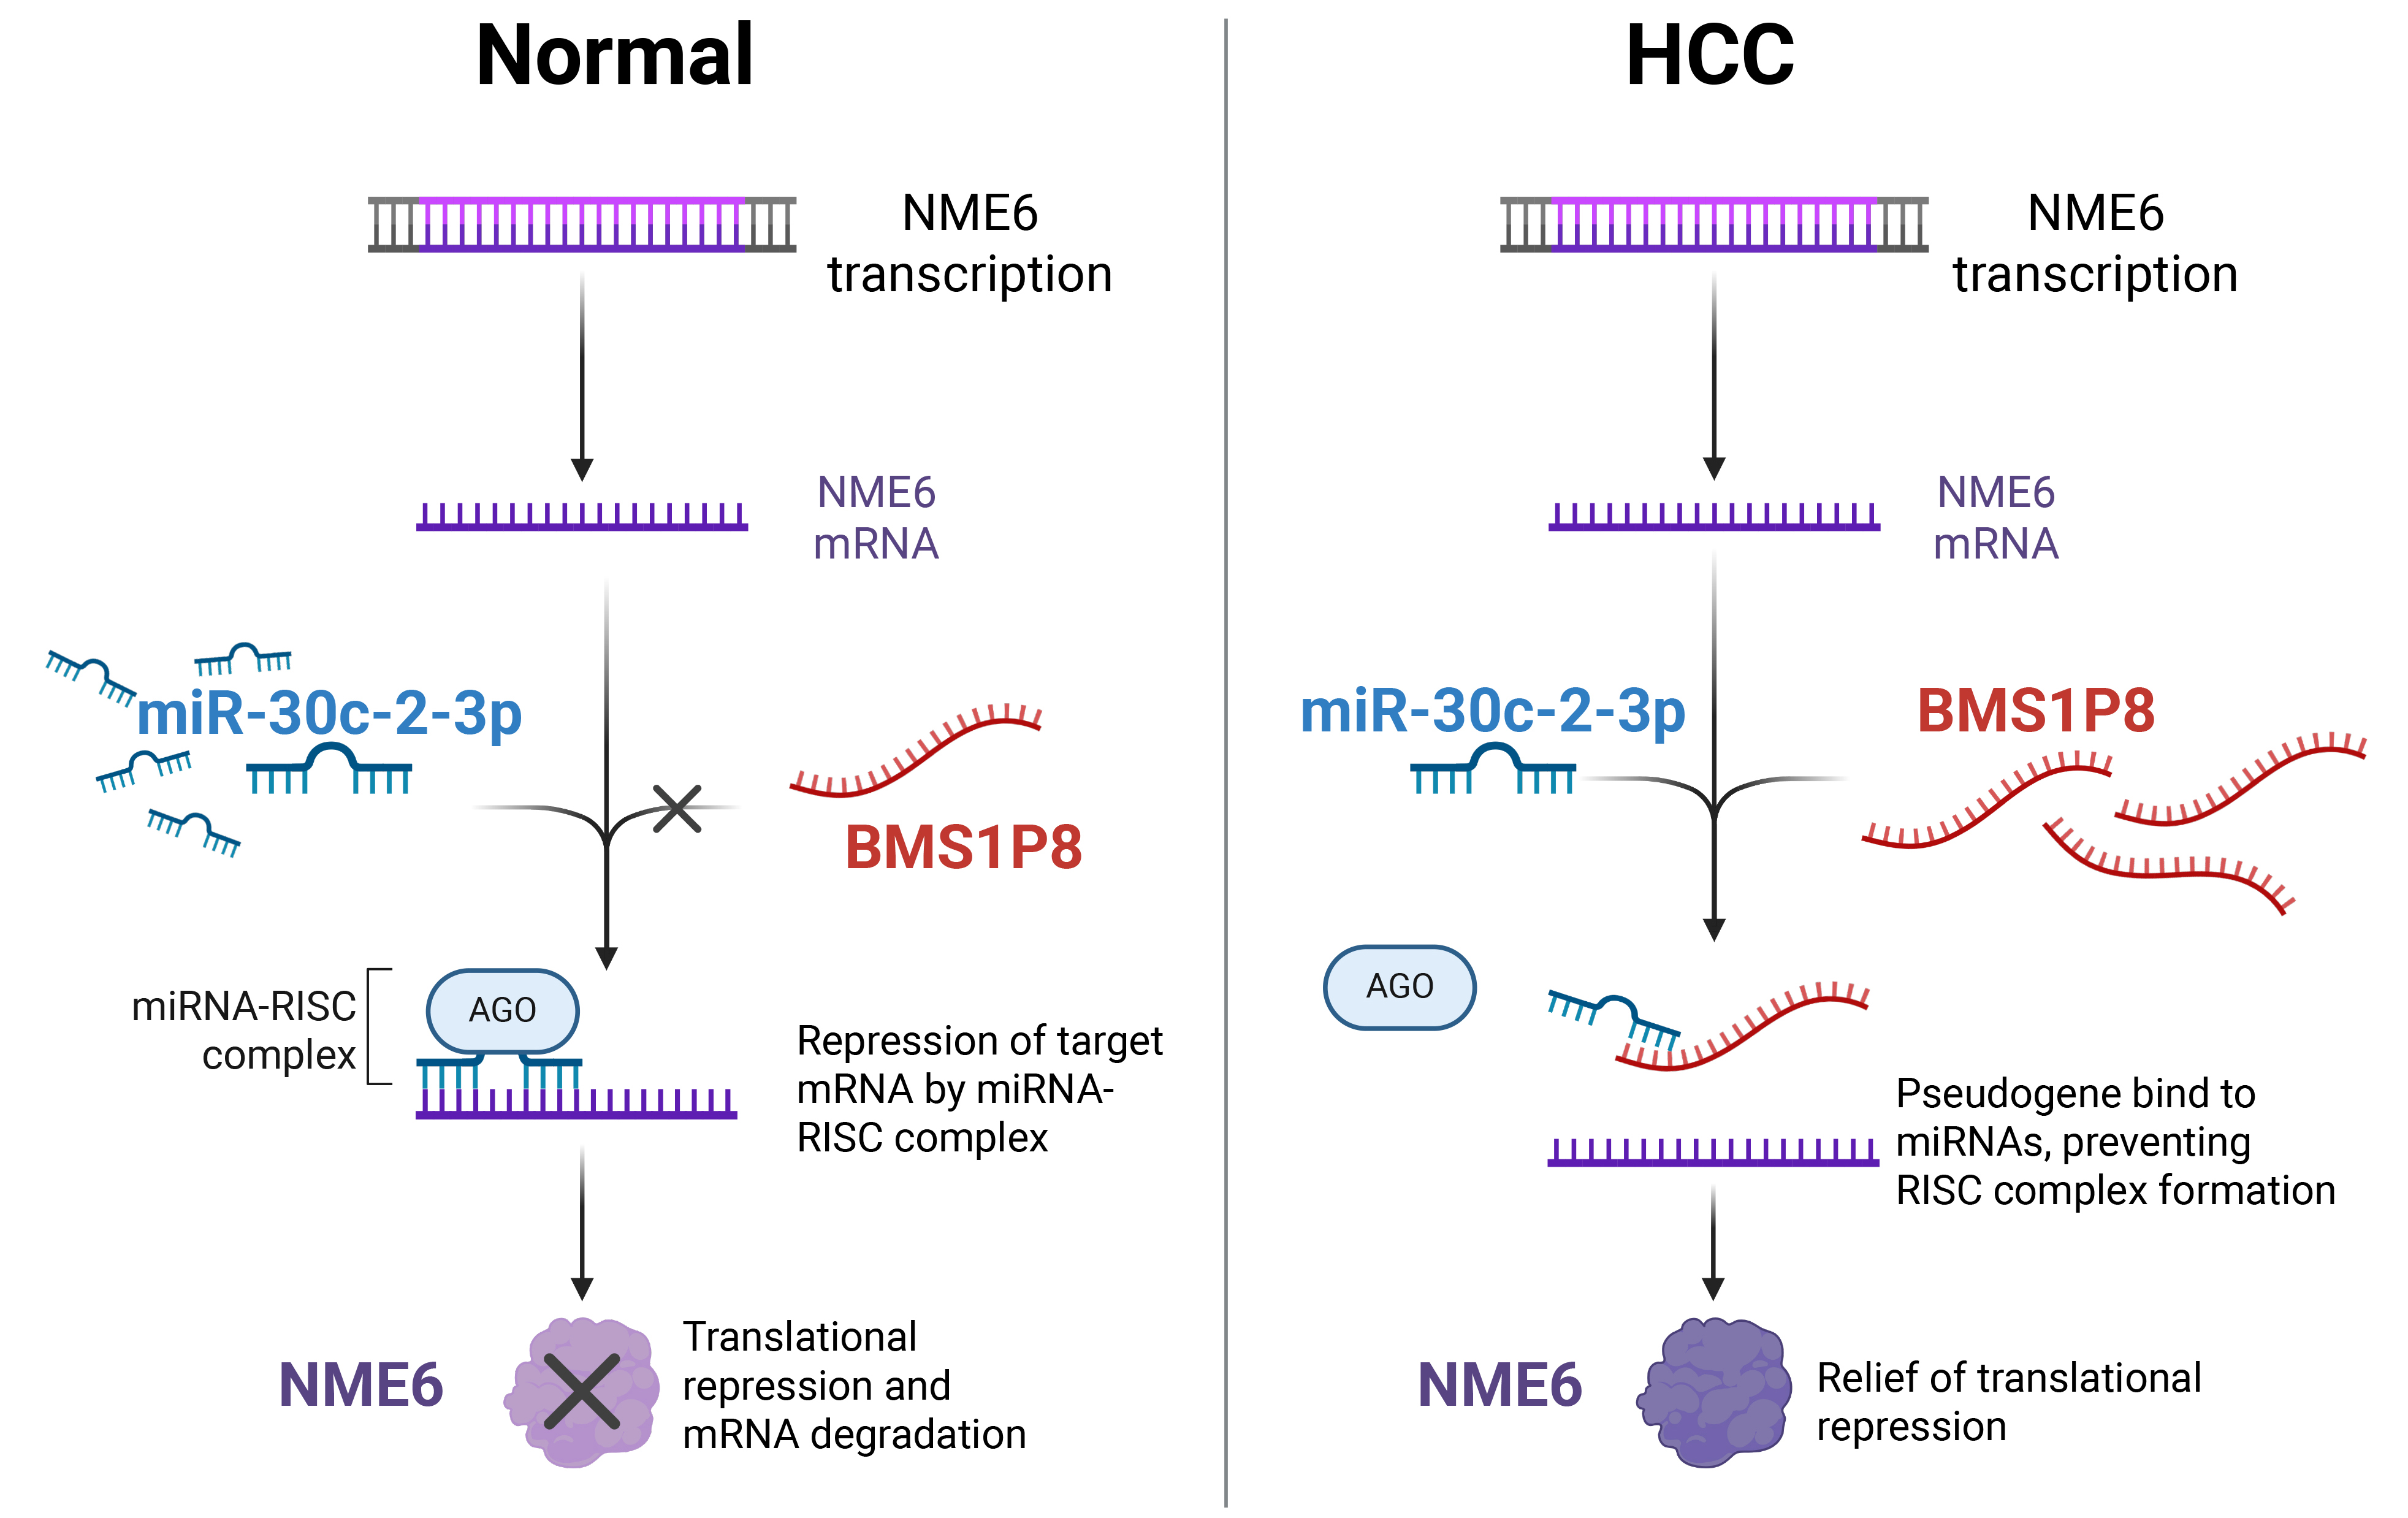 Fig. 7.
Proposed mechanistic model of the BMS1P8–miR-30c-2-3p–NME6 ceRNA axis in HCC. In normal hepatocytes (left), miR-30c-2-3p binds to NME6 mRNA, recruiting the RNA-induced silencing complex (RISC) complex and leading to translational repression and mRNA degradation of NME6. In HCC cells (right), elevated BMS1P8 sequesters miR-30c-2-3p, preventing RISC formation on NME6 mRNA, thereby relieving translational repression and resulting in increased NME6 expression. The figure was created using BioRender.com (Agreement number: MG28JOSDOF). The original figure source is available at https://BioRender.com/5bss1pr.
Pseudogenes are traditionally considered junk DNA or nonfunctional remnants arising from gene duplication or retrotransposition events [20]. Their sequences typically harbor premature stop codons or frame shifts, preventing the production of functional proteins [21]. However, with the advent of high-throughput technologies, including next-generation RNA sequencing, single-cell transcriptomics, and clustered regularly interspaced short palindromic repeat-based functional screens, our understanding of these genetic elements has evolved substantially [22, 23]. This paradigm shift has been supported by emerging research data: many pseudogenes are transcriptionally active and can exert regulatory functions analogous to non-coding RNAs, influencing fundamental cellular processes including proliferation, apoptosis, and metastasis [8]. For instance, the pseudogene-expressed lncRNA small ubiquitin-like modifier 1 pseudogene 3 (SUMO1P3) has been identified as upregulated in gastric cancer tissues compared with adjacent nontumorous tissues, and its expression associated with tumor size, differentiation, lymphatic metastasis, and invasion [24]. In parallel, recent work has delineated additional pseudogene-driven circuits that shape the key hallmarks of HCC. Double homeobox A pseudogene 8 (DUXAP8) sponges miR-490-5p, releasing budding uninhibited by benzimidazoles 1 (BUB1) and intensifying phosphatidylinositol-4,5-bisphosphate 3-kinase catalytic subunit beta (PI3K)/AKT serine/threonine kinase 1 (AKT)-driven proliferation, while misato family member 2, pseudogene (MSTO2P) simultaneously boosts E-cadherin and activates the PI3K/AKT/mechanistic target of rapamycin kinase (mTOR) axis to sustain tumor growth [25, 26]. Also, methyltransferase 3, N6-adenosine-methyltransferase complex catalytic subunit (METTL3)-mediated N6-methyladenosine modification stabilizes glucosylceramidase beta 1 like, pseudogene (GBAP1); the resultant GBAP1 overexpression sequesters miR-22-3p, up-regulates bone morphogenetic protein receptor type 1A (BMPR1A), and activates both BMP/Smad family member and PI3K/AKT cascades, promoting hepatocarcinogenesis [27, 28]. Small nuclear ribonucleoprotein polypeptide F pseudogene 1 (SNRPFP1) is markedly up-regulated in HCC, associates with poor prognosis, and promotes proliferation, motility, and apoptosis resistance by sponging the tumor-suppressive miR-126-5p [29], whereas oncogenic ubiquitin conjugating enzyme E2 M pseudogene 1 (UBE2MP1) promotes proliferation and apoptosis resistance by sponging miR-145-5p to de-repress regulator of G protein signaling 3 (RGS3) [30]. Collectively, these mechanistic insights—highlighting the emerging theme that pseudogene exert their influence primarily through miRNA-sponge activity—have driven the development of multi-pseudogene prognostic signatures that outperform conventional clinicopathologic variables, thereby reinforcing the regulatory and clinical relevance of pseudogenes in HCC and broader cancer biology.
In this study, we identified BMS1P8 as a liver cancer–specific
pseudogene with diagnostic and prognostic implications. By conducting a
comprehensive analysis of RNA-seq datasets and validating the findings in
clinical samples, we observed that BMS1P8 expression was minimal in most
other tumor types but prominently upregulated in HCC. Notably, BMS1P8
remained barely detectable in CH and LC but rose modestly in DN and surged in
both early- and advanced-stage HCC (Fig. 2A), indicating that its induction is
tumor-specific rather than a generic response to chronic liver injury. The robust
diagnostic performance of BMS1P8 underscores its potential as a
biomarker for early detection or patient stratification. Moreover, our
correlation and pathway enrichment analysis implicated BMS1P8 in cell
cycle regulation, a critical pathway often dysregulated in HCC progression. These
insights were supported by the positive associations between BMS1P8
expression and multiple cell cycle–related genes as well as the adverse
prognostic outcomes linked to a BMS1P8-based 7-gene signature including
CCNB2, CDC20, CDC45, ESPL1, PLK1,
and PTTG1. Although the threshold of correlation coefficient (r
NME/NM23 nucleoside diphosphate kinase 6 (NME6) is a member of the NME gene family, which plays important roles in cellular processes such as nucleoside diphosphate kinase activity, maintenance of nucleotide pools, and regulation of cell proliferation and differentiation [32, 33]. While several NME family members, such as NME1 and NME2, have been extensively studied as metastasis suppressors in various cancers, the specific biological functions of NME6 remain less well characterized [34]. Nonetheless, emerging studies have reported that NME6 expression is elevated in multiple malignancies, including breast, colorectal, and lung cancer, where it has been associated with increased tumor cell proliferation, enhanced metastatic potential, and poorer clinical outcomes [35, 36, 37]. Although direct experimental research on NME6 in HCC is limited, data mining analyses have indicated that NME6 expression is elevated in HCC tissues and inversely correlated with patient survival, suggesting a potential oncogenic role for NME6 in liver cancer progression [38]. In our analysis, we observed significant upregulation of NME6 in HCC tumor tissues compared to non-tumor samples, accompanied by a strong association with poor prognosis. Furthermore, our ceRNA network analysis indicated that BMS1P8 may sequester miR-30c-2-3p, leading to derepression of NME6, thereby implicating this axis as a potential driver of HCC progression through dysregulation of cell cycle–related and oncogenic pathways.
One of the most notable findings is the liver specificity of BMS1P8, which helps distinguish it from other pseudogenes that may be broadly upregulated across multiple malignancies. This tissue specificity may allow BMS1P8 to serve as a more targeted biomarker for HCC, potentially reducing false-positive results that can occur with conventional markers such as AFP [6]. Furthermore, the strong prognostic value observed for BMS1P8 supports its clinical utility not only in diagnosing HCC but also in risk stratification and treatment decision-making. Despite these promising results, our study has certain limitations. Although the correlation and enrichment data suggest a functional role for BMS1P8 in cell cycle regulation, we did not perform in vitro or in vivo functional assays to validate the mechanistic underpinnings of how BMS1P8 might drive tumorigenesis.
In conclusion, our findings demonstrate the diagnostic and prognostic importance of BMS1P8 in HCC and highlight its potential tissue specificity. Moreover, our identification of links between BMS1P8 expression and cell cycle-related pathways provides a foundation for understanding its role in liver cancer progression. Although this study derived key insights primarily from tissue-based RNA analysis, we recognize that tissue sampling is invasive and may limit clinical applicability. However, with the recent advancements in liquid biopsy technologies, including extracellular vesicle (EV)-based RNA analysis, there is potential for BMS1P8 to be detected in serum or plasma-derived EVs. This raises the possibility of applying BMS1P8 as a non-invasive biomarker in clinical practice. Therefore, further studies evaluating the detectability of BMS1P8 in patient blood samples and its correlation with tissue expression will be essential. Future mechanistic studies of this pseudogene could lead to improved early diagnosis and therapeutic strategies for HCC patients.
This study identified BMS1P8 as a liver-specific pseudogene biomarker with a strong diagnostic and prognostic value in HCC. Its distinct upregulation in liver cancer compared with other malignancies underscores its potential clinical utility for early detection and patient stratification. Furthermore, the correlation between BMS1P8 and cell cycle–related pathways highlight its relevance to disease progression. Our results also revealed a potential BMS1P8/miR-30c-2-3p/NME6 ceRNA circuit that may amplify oncogenic signaling in HCC. Elucidating and targeting this newly defined axis could broaden the therapeutic possibilities for BMS1P8. These findings not only enhance our understanding of the molecular landscape of HCC but also provide a foundation for future translational research aimed at integrating BMS1P8 into diagnostic workflows and exploring its potential as a target for therapeutic intervention.
AFP, alpha-fetoprotein; ALT, alanine aminotransferase; AST, aspartate aminotransferase; AUC, area under curve; aHCC, advanced hepatocellular carcinoma; BMI, body mass index; cDNA, complementary deoxyribo nucleic acid; CH, chronic hepatitis; CI, confidence interval; DFS, disease-free survival; DN, dysplastic nodule; eHCC, early staged hepatocellular carcinoma; FC, fold changes; GO, gene ontology; HBV, hepatitis B virus; HCC, hepatocellular carcinoma; HCV, hepatitis C virus; HMBS, hydroxymethylbilane synthase; HR, hazard ratio; INR, international normalized ratio; LC, liver cirrhosis; LIHC, liver hepatocellular carcinoma; lncRNA, long non-coding RNA; MSigDB, Molecular Signatures Database; NASH, non-alcoholic steatohepatitis; NL, normal liver; NT, non-tumor; OS, overall survival; PIVKA-II, prothrombin-induced by vitamin K absence or antagonist-II; qRT-PCR, quantitative real-time polymerase chain reaction; RNA-seq, RNA-sequencing; ROC, receiver operating characteristics; SD, standard deviation; T, tumor tissue; TCGA, The Cancer Genome Atlas.
Data supporting the findings of this study are presented in the paper and supplementary files. All other data are available from the corresponding authors upon reasonable request.
Conceptualization: HSK, JWE; data curation: HSK, JYChoi, GOB, SSK, JYCheong; methodology: MGY, JYJ; investigation: SHJ, JEH, JWE; resources: SSK, JYCheong; visualization: HSK, JYChoi; funding acquisition: HSK, JYCheong, JYJ, JWE; project administration: JYJ, JWE; supervision: JYJ, JWE; writing–original draft: HSK, JWE; writing – review & editing: JYCheong, JWE. All authors contributed to editorial changes in the manuscript. All authors read and approved the final manuscript. All authors have participated sufficiently in the work and agreed to be accountable for all aspects of the work.
The study was carried out in accordance with the guidelines of the Declaration of Helsinki. This study was approved by the Institutional Review Board of the Ajou University Hospital (Suwon, South Korea) (approval number: AJOUIRB-EX-2024-332 and AJOUIRB-EX-2024-389). The requirement for informed consent was waived.
The biospecimens and data used in this study were provided by the Biobank of Ajou University Hospital, a member of the Korea Biobank Network. In addition, we thank all the members of MOAGEN (Daejeon, South Korea) for providing bioinformatics analysis and guidance. Fig. 7 was created using BioRender.com (Agreement number: MG28JOSDOF). The original figure source is available at https://BioRender.com/5bss1pr.
This work was supported by the Korea Health Technology R&D Project through the Korea Health Industry Development Institute (KHIDI), funded by the Ministry of Health and Welfare, Republic of Korea (grant number HR21C1003); by the National Research Foundation of Korea (NRF), funded by the Ministry of Science and ICT (MSIT), Republic of Korea (grant numbers NRF-2022R1A2C1092155, RS-2022-NR070489, RS-2023-00210847, RS-2025-00562556 and RS-2025-00521818).
The authors declare no conflict of interest.
ChatGPT (version 1o pro) was used for error checking and language refinement during the manuscript preparation. After using this tool, the authors reviewed and edited the content as needed and took full responsibility for the content of the publication.
Supplementary material associated with this article can be found, in the online version, at https://doi.org/10.31083/FBL41684.
References
Publisher’s Note: IMR Press stays neutral with regard to jurisdictional claims in published maps and institutional affiliations.