


 , Lin Zhao 2, Dingyan Yi 3, Zhihua Tian 4, Bin Dong 4, Chunxiang Ye 5, Jingtao Liu 6, Huachong Ma 7,*
 , Wei Zhao 8,*
1 Department of Clinical Medicine, Beijing Luhe Hospital, Capital Medical University, 101149 Beijing, China
2 Key Laboratory of Carcinogenesis and Translational Research, Department of Thoracic Surgery II, Peking University Cancer Hospital & Institute, 100142 Beijing, China
3 College of Chemistry and Life Science, Beijing University of Technology, 100029 Beijing, China
4 Key Laboratory of Carcinogenesis and Translational Research, Department of Central Laboratory, Peking University Cancer Hospital & Institute, 100142 Beijing, China
5 Department of General Surgery, Beijing Chaoyang Hospital, Capital Medical University, 100020 Beijing, China
6 Key Laboratory of Carcinogenesis and Translational Research, Department of Pharmacology, Peking University Cancer Hospital & Institute, 100142 Beijing, China
7 Department of Acute Abdominal Surgery, Beijing Chaoyang Hospital, Capital Medical University, 100020 Beijing, China
8 Key Laboratory of Carcinogenesis and Translational Research, Department of Clinical Laboratory, Peking University Cancer Hospital & Institute, 100142 Beijing, China
Abstract
Efferocytosis (ER) plays a crucial role in the programmed clearance of dead cells, a process that is mediated by phagocytic immune cells. However, further exploration is needed to determine the full extent of its impact on the progression of pancreatic ductal adenocarcinoma (PDAC), particularly through interactions among tumor cells, stromal cells, and immune cells within the tumor microenvironment (TME).
In this study, we comprehensively analyzed the Cancer Genome Atlas (TCGA) and Gene Expression Omnibus (GEO) database, as well as additional databases from multiple bioinformatics websites, utilizing 167 ER features derived from the integration of single-cell RNA sequencing (scRNA-seq) and bulk transcriptomic data. A set of 14 ER-associated prognostic signatures, referred to as the “14-gene panel” genes, was identified based on overall survival (OS)/disease-free survival (DFS) data, Pearson correlation coefficients, and multivariate Cox regression analyses. The model pathways enriched by the four-gene combination represented by “LEAF” and the 14-gene combination represented by the “14-gene panel” presented a high degree of similarity, including among the adhesion, mitotic, G2/M checkpoint, and epithelial‒mesenchymal transition (EMT) signaling pathways. Least absolute shrinkage and selection operator (LASSO) regression was subsequently employed to construct an ER risk scoring system using deep learning, based on the following formula: LGALS3, EMP1, ASPH, and FNDC3B, collectively termed the “LEAF” panel. Additionally, random survival forest (RSF) algorithms facilitated the identification of a key panel of genes, designated “LEAP” genes, including LGALS3, EREG, ASPH, and PLS3; three of which genes (ASPH, LGALS3, and EREG) were identified as key factors influencing the behaviors of PDAC tumors, tumor-associated stroma, and macrophages. Finally, we utilized experimental methods, including Boyden chamber analyses, immunohistochemical staining, and cell cycle analyses, to demonstrate that interference with ASPH suppresses the malignant properties of tumors, including proliferation and migration. Multiplex immunofluorescence staining was employed to identify EREG as highly relevant to the M2 macrophage subpopulation.
Our findings underscore the importance of considering a novel prognostic signature comprising 14 ER genes in the context of the TME when investigating the biology of PDAC. Future studies may explore how modulating these interactions could lead to novel therapeutic opportunities.
Keywords
- efferocytosis
- pancreatic ductal adenocarcinoma
- prognosis
- tumor microenvironment
Pancreatic ductal adenocarcinoma (PDAC) is the most common and aggressive histological subtype of pancreatic cancer, ranking among the leading causes of cancer-related mortality worldwide [1]. PDAC frequently eludes detection until it has progressed to the advanced stages owing to its insidious nature and nonspecific symptoms, leading to delayed diagnoses for the majority of patients [2]. This stealthy progression often leaves clinicians and patients unprepared, exacerbating the challenges of early intervention. As a result, nonsurgical treatments such as radiotherapy and chemotherapy are primary options for advanced cases [2, 3]. Additionally, emerging therapies such as immunotherapy and other innovative approaches are being explored for the treatment of PDAC [4, 5]. Despite advances in early detection and drug development, the prognosis for advanced PDAC patients remains poor, with five-year survival rates less than 10%, even at the localized stages [6]. Patients with PDAC are frequently diagnosed at the advanced or metastatic stages, significantly limiting therapeutic efficacy [4], which underscores the urgent need to discover innovative biomarkers and molecular signatures capable of enabling earlier detection, refining prognostic assessments, and guiding personalized therapeutic strategies to enhance clinical management and reduce the impact of aggressive malignancy.
Efferocytosis (ER)—the process by which apoptotic cells are phagocytosed and eliminated—plays a crucial role in maintaining tissue homeostasis [7]. This biological mechanism is essential for preventing secondary necrosis, which can lead to inflammation and further tissue damage [8]. In the context of cancer, efferocytosis becomes particularly significant as tumor cells undergo various forms of cell death, including apoptosis, necrotic apoptosis, ferroptosis, and pyroptosis [9]. These cell death mechanisms are triggered by factors such as genetic mutations, hypoxic conditions within the tumor microenvironment, and therapeutic interventions such as radiotherapy and chemotherapy [10]. Professional phagocytes, such as macrophages and dendritic cells, along with nonprofessional phagocytes, such as fibroblasts and epithelial cells, play a vital role in detecting and removing apoptotic tumor cells through efferocytosis [11]. This rapid and efficient clearance prevents the release of proinflammatory molecules that could otherwise exacerbate tissue damage and promote tumor progression [11]. The efficiency of this process is facilitated by a range of genes and signaling pathways that increase the recognition and engulfment of apoptotic cells [12, 13]. Notably, many of these genes are overexpressed in various cancers—including in leukemia and lung, breast, and pancreatic cancers—suggesting their involvement in tumor progression and metastasis [14]. The complex interplay between efferocytosis and tumor biology underscores the need for a deeper understanding of this process. While studies on the impact of efferocytosis on PDAC progression are limited, emerging evidence points to its critical role in shaping the tumor microenvironment. Further research into the molecular mechanisms governing efferocytosis in PDAC could provide valuable insights into the development of novel therapeutic strategies aimed at enhancing antitumour immunity and overcoming immune evasion.
In our previous study, we identified galectin-3 (Gal-3) as an important modulator of the tumor microenvironment (TME) in PDAC patients. Gal-3 increases the aggressiveness of tumor cells by promoting their proliferation, migration, and invasion capabilities, and it also activates collagen and fibrin crosslinking within the stromal tissue surrounding the tumor, leading to the formation of a more rigid and fibrotic extracellular matrix. Moreover, its ability to activate collagen and fibrin crosslinking and promote the release of inflammatory cytokines such as Interleukin-6 (IL-6) and IL-8 creates a protumorigenic milieu that accelerates PDAC progression [15]. Interestingly, multiple genes associated with Gal-3 are involved in the ER signaling pathway, although they do not encompass the canonical gene sets typically associated with ER signaling.
In this study, we delineated the prognostic potential and TME landscape of PDAC by leveraging ER features derived from the integration of single-cell RNA sequencing (scRNA-seq) and bulk transcriptomic data. The ER signature comprises 14 genes (DUSP4, ASPH, MMP14, EMP1, EREG, MAP4K4, PANX1, PLS3, FNDC3B, RBMS1, ITGB1, ADAM17, PICALM, and LGALS3) as “14-gene panel”, including those directly associated with the ER and bypass genes closely linked to its function. This study was to provide critical theoretical insights for the prognostic stratification and precision treatment of PDAC. A prognostic scoring system for patients was developed based on the on identified efferocytosis features and was validated via deep learning approaches. We investigated the underlying functional targets responsible for the varying prognoses among patients with different ER risks through comprehensive clustering, immune infiltration, and model comparison analyses from both single-cell and bulk transcriptomes. Additionally, nomogram models of tumor cells, stromal cells, and immune cells were established to accurately predict the survival of patients with PDAC, facilitating individualized treatment plans tailored to their specific ER risk categories.
We retrieved 179 samples from patients with PDAC who underwent RNA sequencing from the Cancer Genome Atlas (TCGA) database (phs000178 from https://www.omicsdi.org/dataset/dbgap/phs000178), which included clinical information, transcriptome expression, and copy number variation (CNV) data, and 171 samples of normal tissues from volunteers from the Genotype-Tissue Expression (GTEx) Project. Additionally, we obtained the pancancer cohort for the gene expression profiling and interactive analyses of the cancer and normal samples from the Gene Expression Profiling Interactive Analysis (GEPIA) and GEPIA2 platforms developed by PUCH (http://gepia2.cancer-pku.cn/, Beijing, China), as well as eight datasets (GSE111627; 141017; 148673; 154763; 154778; 158356; 162708; 165399) from patients with PDAC patients from the GEO database (https://www.ncbi.nlm.nih.gov/geo/, National Institutes of Health (NIH), MD, USA). Moreover, a panel of 223 genes related to efferocytosis was explored in the Molecular Signatures Database (MSigDB, https://www.gsea-msigdb.org/gsea/msigdb), a collection of annotated gene sets for use with the gene set enrichment analysis (GSEA) software (version 4.4) by the USCD (SanDiego, CA, USA).
The single-cell RNA-seq dataset from the GEO database (GSE154778, https://www.ncbi.nlm.nih.gov/geo/query/acc.cgi?acc=GSE154778) comprises 10 samples from patients with primary PDAC and 6 samples from patients with metastatic lesions. The Seurat R package (version 4.3.3, https://cran.r-project.org/web/packages or https://www.bioconductor.org/) was used to analyze the single-cell RNA sequencing data. While, the Tumor Immune Single-Cell Hub 2 (TISCH2) database (http://tisch.compbio.cn/) provided detailed cell type annotations at the single-cell level. Cell clustering was performed via Seurat’s “FindClusters” and “FindNeighbors” functions, and the results were visualized via t-SNE mapping. Cellular annotation was conducted by referencing signature genes associated with specific cell types. Additionally, we utilized the “Add Module Score” function from the Seurat package to assess the activity levels of specific gene sets within individual cells.
We identified 39 of the total-167 genes (Supplementary Table 1) associated with efferocytosis that exhibited prognostic significance for overall survival (OS) and disease-free survival (DFS). Seven genes were subsequently found to be significantly associated with both OS and DFS. A panel of five genes was ultimately selected from these seven genes. The top ten genes were analyzed for protein‒protein interactions via the STRING database (https://cn.string-db.org/, version 12.0) to highlight their enrichment. “Consensus Cluster Plus” package (version 1.70.0, https://cran.r-project.org/web/packages or https://www.bioconductor.org/) was used for consistency clustering to categorize PDAC patients into two subgroups. Significant differences in the clinical and prognostic characteristics were observed between the two subgroups of PDAC patients across the two independent cohorts.
To explore the biological pathways and processes associated with efferocytosis-related genes (ERGs) and models (ERMs), we used the Cluster Profiler R package (version 4.10.1, https://cran.r-project.org/web/packages or https://www.bioconductor.org/) for Gene Ontology (GO, https://geneontology.org/), Kyoto Encyclopedia of Genes and Genomes (KEGG, https://www.kegg.jp/), and gene set enrichment (GSEA, https://www.gsea-msigdb.org/gsea/index.jsp) analyses. These analyses identified key functions, pathways, and molecular interactions involved in efferocytosis. Additionally, we applied gene set variation analysis (GSVA, https://www.bioconductor.org/packages/devel/bioc/html/GSVA.html) to reveal activated or suppressed pathways involved in efferocytosis.
All efferocytosis-related genes were simultaneously included as predictors in a Cox proportional-hazard model with an L1 penalty (LASSO). The procedure was run 100 times; in each run a ten-fold cross-validation identified the penalty parameter (
To establish a robust predictive framework, we implemented a random forest-based algorithm for the feature selection. Each forest was grown with ntree = 1000, nodesize = 5, bootstrap sampling (samptype = “swr”), and
Human pancreatic cancer cell lines (ASPC-1 and BxPC-3) were obtained from the American Type Culture Collection (ATCC, Manassas, VA, USA), and cultured in Dulbecco’s modified Eagle’s medium (DMEM) supplemented with 10% fetal bovine serum (FBS), 100 U/mL penicillin, and 100 mg/mL streptomycin (all products purchased from Thermo Fisher Scientific, Chicago, IL, USA). All cell lines were authenticated via short tandem repeat (STR) DNA fingerprinting and tested negative for mycoplasma. Small interfering RNAs (siRNAs) specifically targeting ASPH (siRNA1 5′-TCACGTGGTTTATGGTGAT-3′ and siRNA2 5′-TGTGGATGATGCCAAAGTT-3′) and a control interfering RNA were obtained from Guangzhou RiboBio Co., Ltd., Guangzhou, Guangdong, China. For the transient transfection, ASPC-1 cells were transfected with the siRNA using Lipofectamine 2000 (11668019, Invitrogen™, Waltham, MA, USA) for 12 hours following which functional assays and the subsequent experiments were conducted.
We obtained tissue samples from patients with primary PDAC patients were obtained from who had undergone duodenopancreatectomy or pancreatospenectomy at the Department of General Surgery, Beijing Chaoyang Hospital. The collection and utilization of these tissues were conducted following the protocol approved by the Ethics Committee of the Beijing Chaoyang Hospital of Capital Medical University (approval No. 2018-K-99), with informed consent obtained from all participants. Paraffin-embedded 5 µm thick sections were prepared for multiplex immunohistochemical staining. Specifically, the sections were deparaffinized and subjected to heat-induced epitope retrieval in Tris buffer (pH 8.0). A four-marker panel consisting of EREG (Epiregulin, 12048), SMA (Smooth Muscle Actin (
Total cellular RNA was extracted using TRIzol reagent and subsequently reverse-transcribed into cDNA using Moloney murine leukemia virus (M-MLV) reverse transcriptase (28025013, Invitrogen™, Waltham, MA, USA). Quantitative PCR (q-PCR) was then carried out with SYBR Green PCR Mix (A25742, Applied Biosystems, Foster City, CA, USA) on an ABI 7500 Fast Real-Time PCR System (Applied Biosystems, Foster City, CA, USA). The relative gene expression levels were calculated using the
The cell viability and proliferation were assessed via the Cell Counting Kit-8 (CCK-8) reagent (CK04, Dojindo Molecular Technologies, Inc., Tokyo, Japan) following the manufacturer’s instructions. The treated cells were evaluated at 12, 24, 48, and 72 hours post-transfection. The absorbance at 490 nm was measured via a multimode microplate reader (BMG Labtech ClarioStar, Cary, NC, USA).
The ATP Content Assay Kit (BC0300, Solarbio, Beijing, China) was employed to quantify intracellular ATP production in accordance with the manufacturer’s instructions.
The cells were collected and washed, followed by incubation with propidium iodide (PI) staining solution (P1304MP, Invitrogen™, Waltham, MA, USA) and 10 µL of permeabilization solution for 30 minutes at room temperature in the dark. The cell cycle distribution was subsequently analyzed via flow cytometry (BD Biosciences, San Diego, CA, USA).
The results of the cell proliferation assay are presented as means
Using the RNA-seq dataset of 179 PDAC samples from the TCGA database, we acquired 167 efferocytosis-related genes (ERGs) from the literature, and employed one-way Cox regression analysis to identify 21 and 18 prognostic genes linked to the OS and DFS of patients with PDAC, respectively (Fig. 1A). A comparison of the PDAC tumor samples and 171 normal tissue samples revealed that 5 (DUSP4, ASPH, MMP14, EMP1, and EREG) of these genes, which are associated with poor survival, were upregulated in tumors (Fig. 1B). In contrast, 2 genes (JUND and EPB41L3) associated with favorable survival were also upregulated in tumors (Fig. 1C). We subsequently utilized the same database to analyze a panel composed of the differential expression patterns of these five genes between PDAC tumor and normal tissues. Our analysis revealed significant differences in the expression levels between tumor and normal samples in this panel (Fig. 1D). The Kaplan-Meier (K‒M) survival analysis revealed a correlation between the PDAC patients’ OS and gene expression with this compound (Fig. 1E). KEGG analysis revealed that these genes are involved in pathways enriched in both tumor and normal tissues, as illustrated by the molecular functions, cellular components, and biological processes depicted in Fig. 1F. For example, the transferase activity; cytokine activity; and extracellular-integrin complex and ErbB1 signalling were enriched in tumor samples, whereas GTPase activity; lysosome, exosome and VEGF; and the VEGF receptor network were enriched in normal samples. Through a protein‒protein interaction (PPI) analysis via the STRING database, we identified the top 10 genes that strongly correlated with the 5 target genes in pancreatic cancer cells, as evidenced by their high pearson correlation coefficient (PCC) scores, as shown in Fig. 1G.
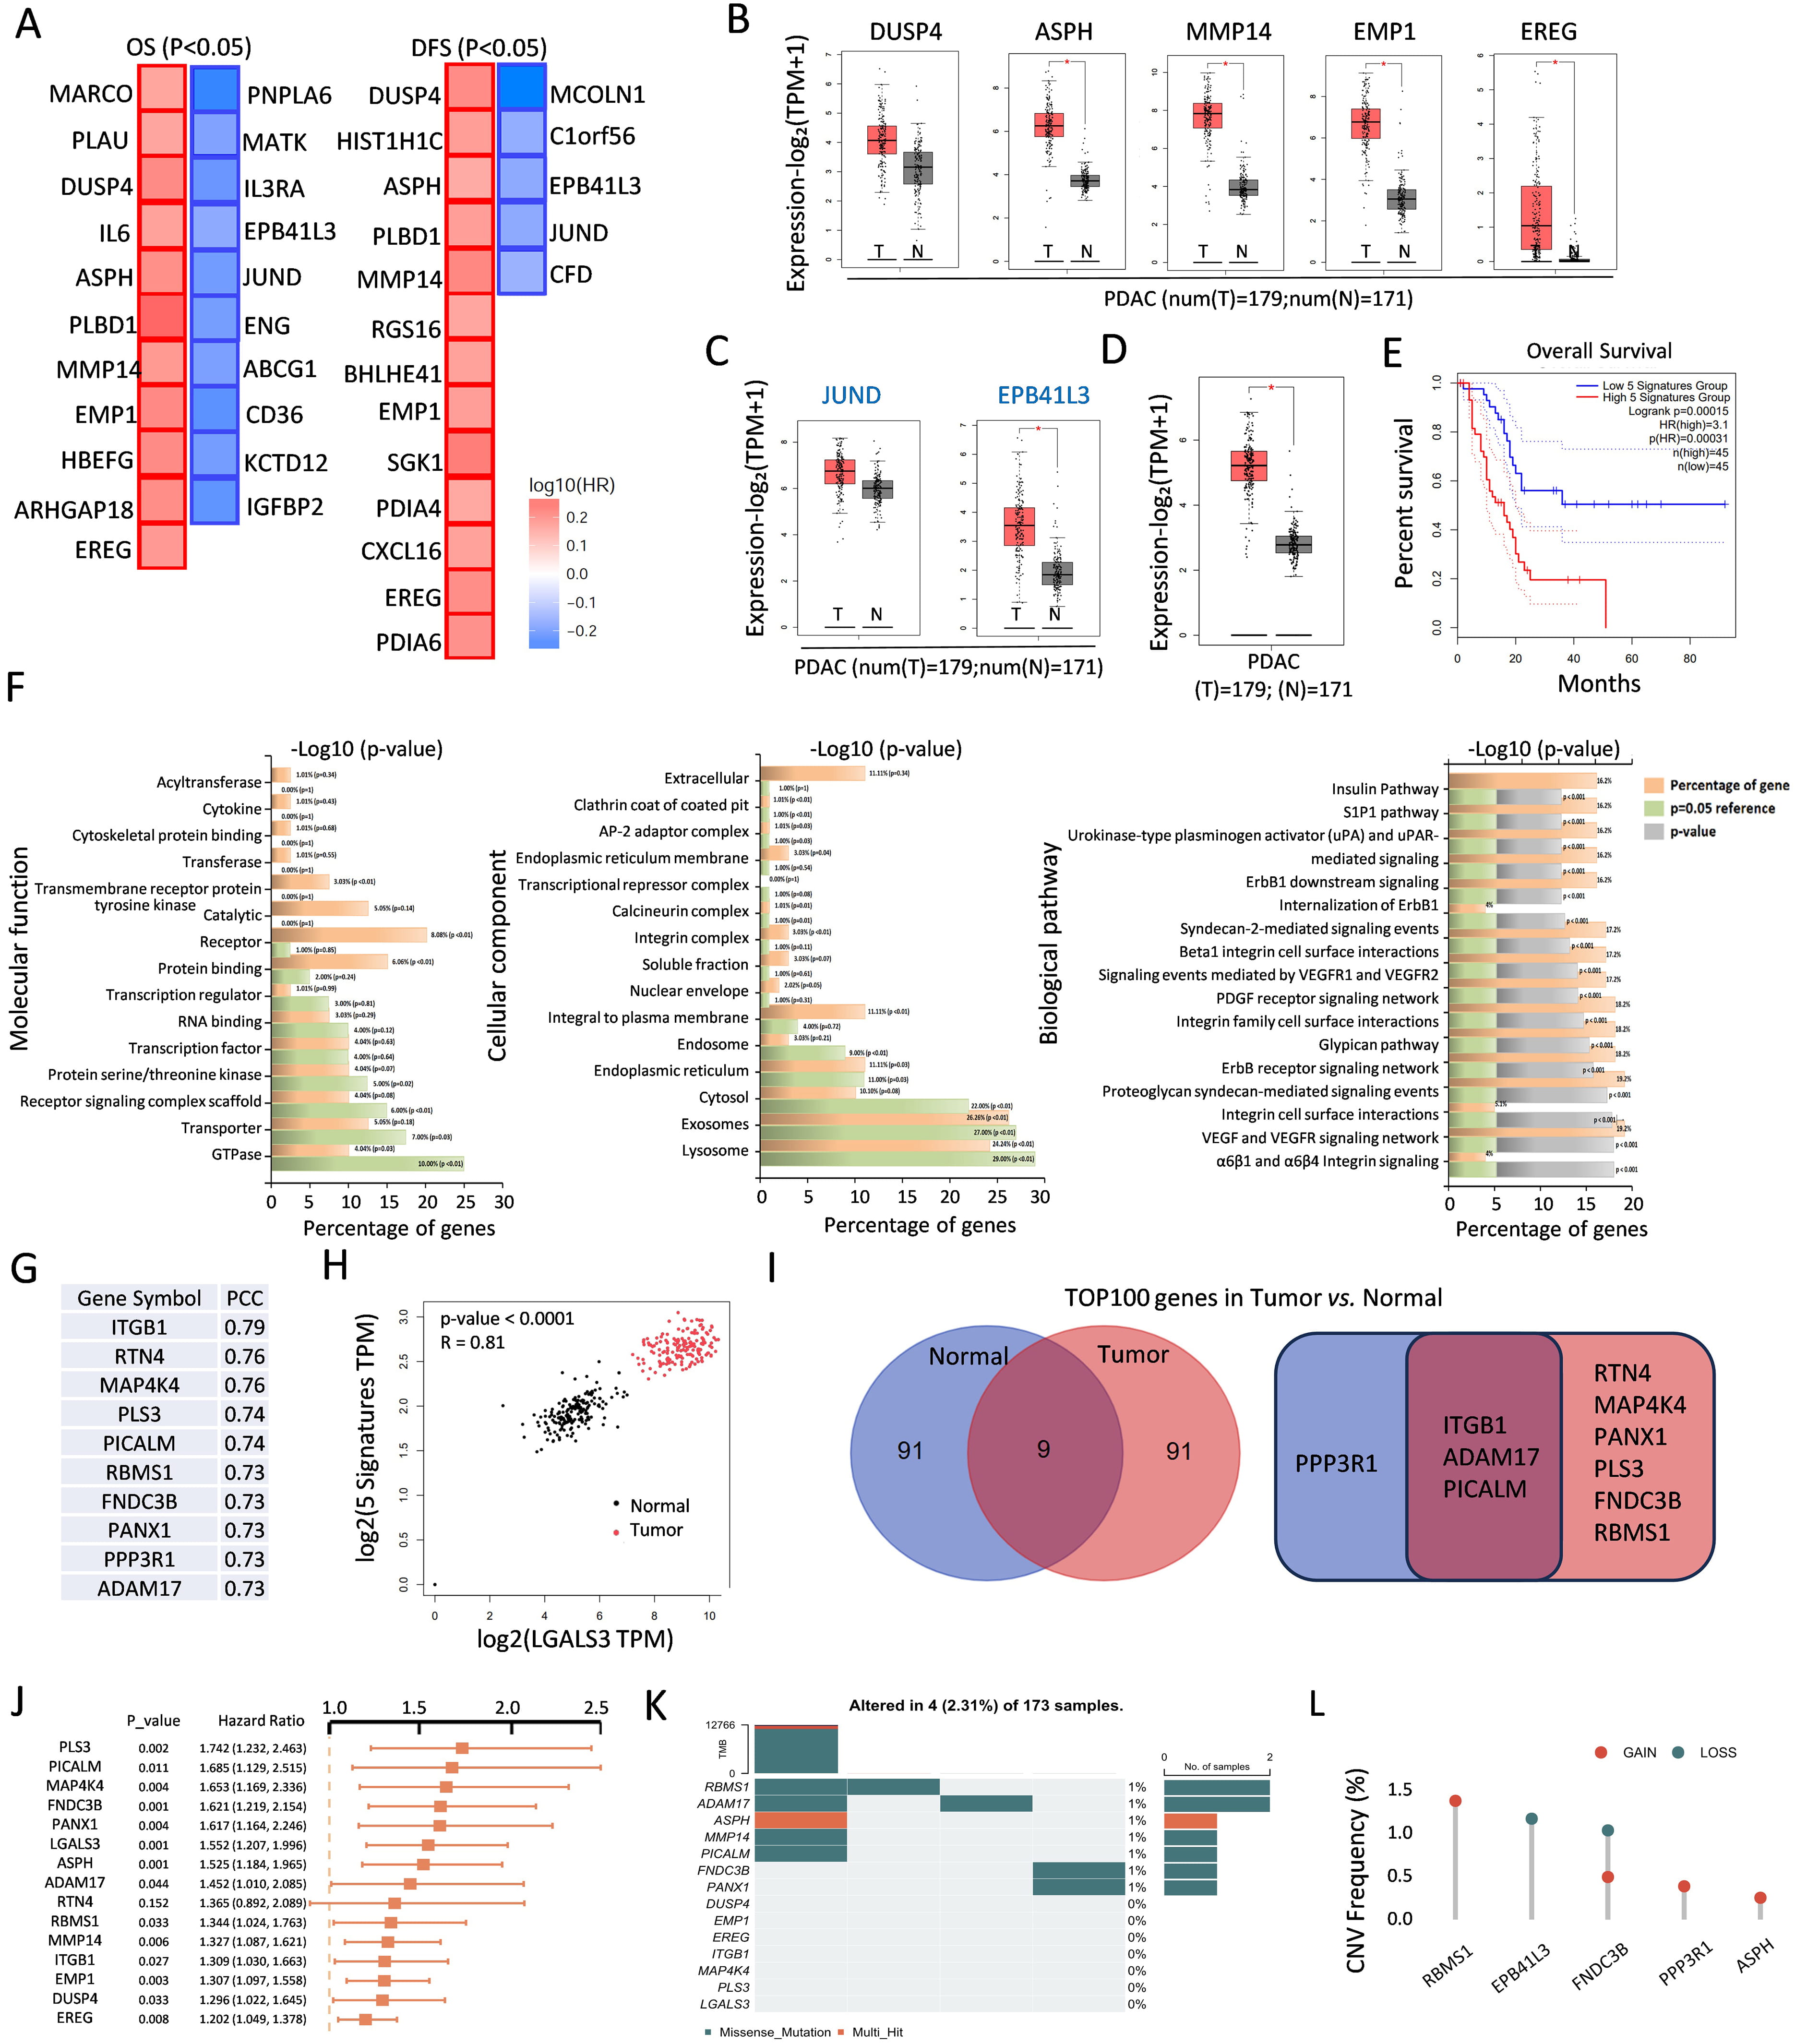 Fig. 1.
 Identification of 39 hub genes related to efferocytosis. (A) The significant prognostic value of OS (11 red boxes, 10 blue boxes) and DFS (13 red boxes, 5 blue boxes) upon ERGs in PDAC. (B,C) Box plots depicting upregulated (B) and downregulated (C) genes both in OS and DFS. *, p
Given its established role as a strong prognostic marker for PDAC, as previously reported by our team and others [15, 16], LGALS3, a member of the galectin family, is positively correlated with the expression of these five signatures in both tumor and normal tissues (Fig. 1H). We further identified the top 100 genes in PDAC tumor and normal tissues that were correlated with LGALS3. As illustrated in the Venn diagram (Fig. 1I), RTN4, MAP4K4, PANX1, PLS3, FNDC3B, and RBMS1 exhibited significantly greater correlations with tumor samples; ITGB1, ADAM17, and PICALM were correlated with both tumor and normal samples; notably, only PPP3R1 was highly correlated with normal samples alone. Next, a univariate Cox regression analysis was performed to generate a significant forest plot for 14 genes, except for RTN4 (Fig. 1J). Among the 173 patients with PDAC, ER-related gene mutations were identified in 2.31% (4 patients). RBMS1 presented the highest mutation frequency, followed closely by ADAM17 and ASPH, as illustrated in Fig. 1K. Additionally, we observed varying degrees of DNA copy number variation (CNV) among the ERGs. As shown in Fig. 1L, RBMS1 displayed extensive CNV amplification, whereas some ERGs presented CNV depletion specifically.
The principal component analysis (PCA) revealed that the distribution of the aforementioned 14 genes (“14-gene panel”) in all the pancreatic cancer samples presented two subpopulations (Fig. 2A). We successfully classified the PDAC patients into two distinct types by employing unsupervised clustering of this panel. The optimal number of clusters, k = 2, was used to divide the entire cohort into Cluster C1 (consisting of 111 patients) and Cluster C2 (consisting of 33 patients) (Fig. 2B,C). The Kaplan‒Meier survival analysis demonstrated significantly improved prognosis in Cluster C2 patients compared with those in the Cluster C1 patients (p = 0.015), as shown in Fig. 2D. Notably, the RNA level of each component in the panel was weakly expressed in the Cluster C2, as shown in Fig. 2E. To further investigate the biological characteristics of these two subtypes, we conducted GSVA. The C1 subtype was significantly enriched in oncogenic pathways, including cell mitosis, protein secretion, focal adhesion, and epithelial‒mesenchymal transition (EMT). In contrast, the C2 subtype was enriched in metabolic pathways, including retinol metabolism, diabetes mellitus, and olfactory transduction signalling (Fig. 2F). The GSEA using hallmark and ontology gene sets from the Molecular Signatures Database (MSigDB) further revealed the significant enrichment of the EMT-related pathways in the C1 subgroup, whereas the C2 subgroup exhibited enrichment in the large ribosomal subunit pathways, as illustrated in Fig. 2G,H. The PDAC patients were stratified into three groups according to the “14-gene panel” expression signature, as shown in the volcano plot. The genes encoding YAP1, ITGAV, MMP7, CST6, and COL11A1 were significantly upregulated (Fig. 2I). We then conducted a KEGG functional enrichment analysis of differentially expressed genes (DEGs), which revealed that high expression of the “14-gene panel” signature is associated with the assembly and activation of the focal adhesion, phosphatidylinositol-3-kinase- protein kinase B (PI3K-AKT), mitogen-activated protein kinases (MAPK), and hippo signaling pathways. In contrast, the downregulated genes are involved in pathways related to protein and fat digestion and absorption (Fig. 2J,K).
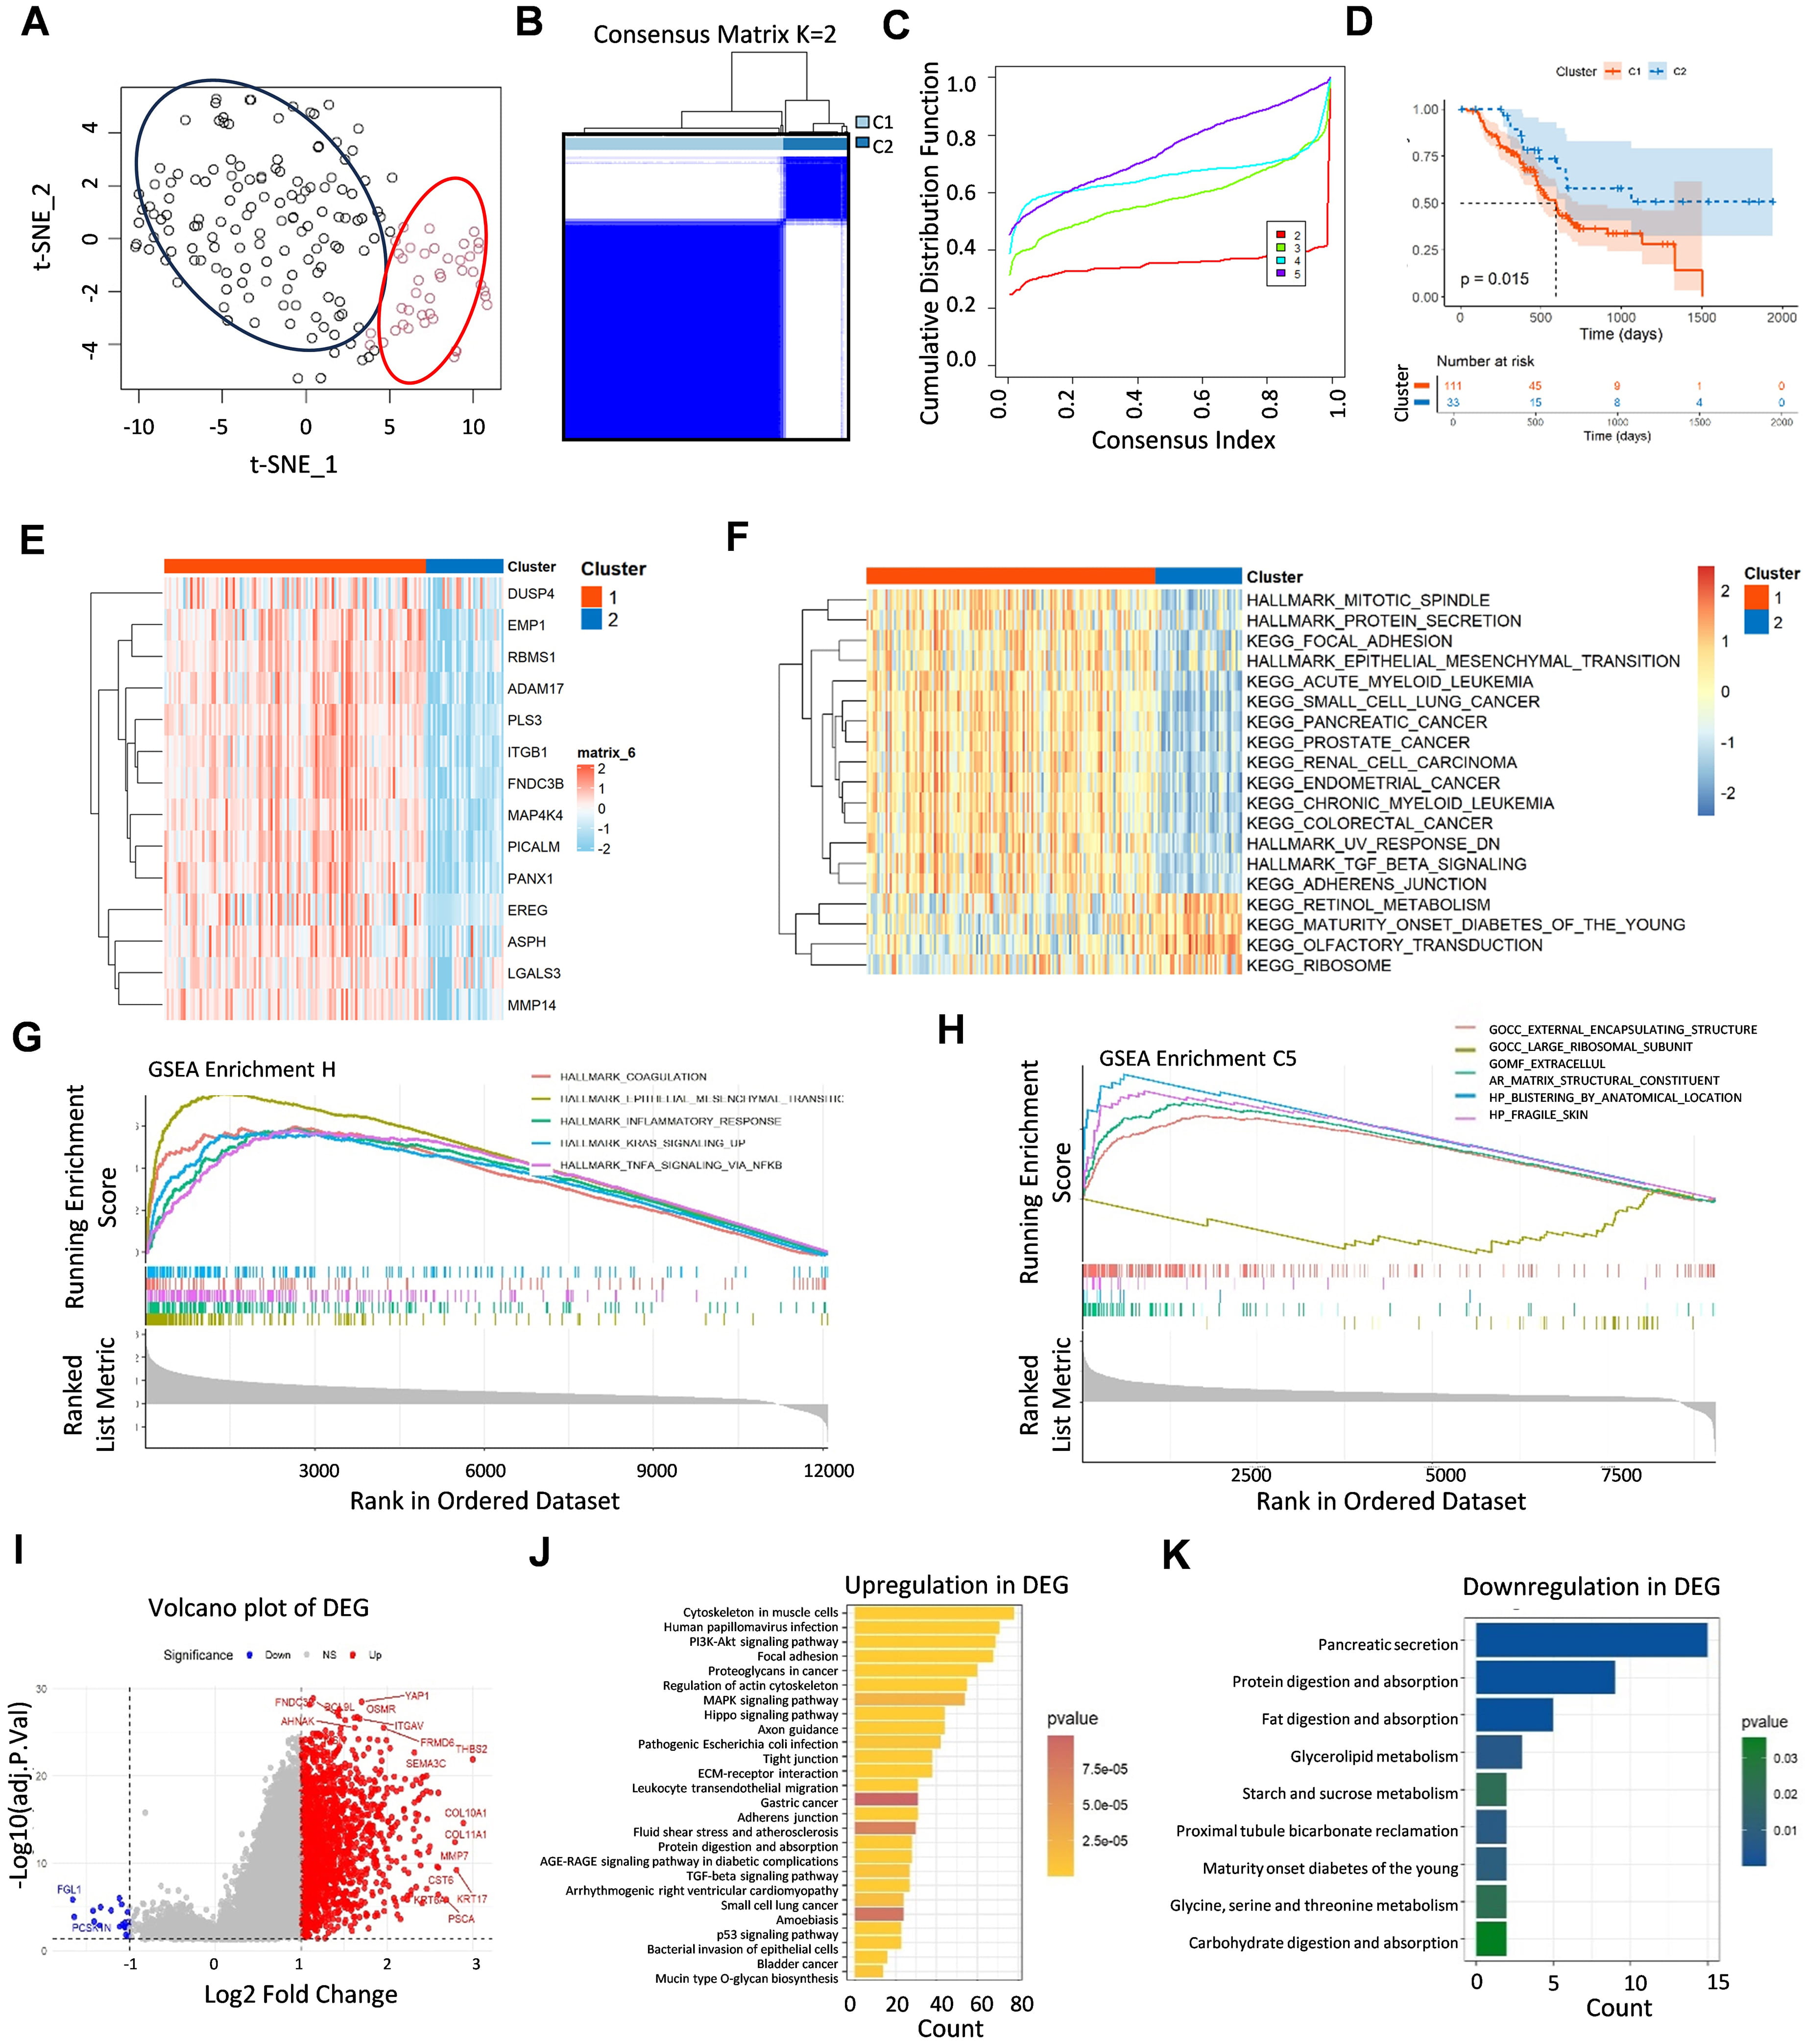 Fig. 2.
 Two types of PDAC patients were categorized by “14-gene panel” clustering. (A) The scatter plot displays the gene distribution and subgrouping of PDAC patients. (B) The TCGA-PDAC cohort was clustered into C1 and C2 molecular subgroups on the basis of 14 ERGs. (C) The clustering results were best when k = 2 from 2–5 cumulative distribution function values. (D) K‒M survival analysis of the prognosis of C1 and C2 patients. (E) ERG expression levels varied between the two clusters. (F) GSVA revealed the hallmark pathways distinguishing clusters, with red indicating promotion and blue signifying inhibition. (G,H) GSEA enrichment analysis, including hallmark gene sets (G) and ontology gene sets (H). (I) Volcano map of “14-gene panel”-associated genes in the TCGA-PDAC cohort. (J,K) KEGG analysis of upregulated (J) and downregulated (K) genes among the DEGs. K‒M, Kaplan-Meier; GSVA, gene set variation analysis; GSEA, gene set enrichment analysis; DEGs, differentially expressed genes.
It was necessary to explore the potential prognostic significance of the “14-gene panel” signature owing to its limited prognostic clustering in the TCGA cohort, as demonstrated by the receiver operating characteristic (ROC) analysis, with the area under the curve (AUC) values of 0.42, 0.34, and 0.08 at 1 year, 3 years, and 5 years, respectively (Supplementary Fig. 1A), and as further confirmed via the univariate and multivariate Cox regression analyses, which indicated that the “14-gene panel” was not a significant independent prognostic predictor for PDAC (Supplementary Fig. 1B,C). To this end, least absolute shrinkage and selection operator (LASSO) regression and multivariate Cox modelling were applied to develop ER-associated prognostic signatures. We performed tenfold cross-validation on these genes through 100 iterations, identifying the four key genes—LGALS3, EMP1, ASPH, and FNDC3B—termed the “LEAF” signature (Fig. 3A) with the best
 Fig. 3.
 Development and verification of prognostic indicators related to “LEAF” genes. (A) Coefficient selection under LASSO regression analyses with “LEAF” genes. The vertical line is drawn at the optimal
To elucidate the role of efferocytosis in the prognoses of patients with PDAC, we employed random survival forest (RSF) algorithms to strategically identify the key efferocytosis genes associated with patient outcomes. We identified four prognostic biomarkers with significant discriminatory power; namely, LGALS3, EREG, ASPH, and PLS3, also called “LEAP”. Integrating the LASSO analysis results, we identified LGALS3 and ASPH as the two pivotal genes involved in efferocytosis, which are significantly correlated with the prognoses of patients with PDAC (Fig. 4A). To validate the relationship between LGALS3 and ASPH, we established a genetically modified PDAC cell line overexpressing LGALS3, as shown in Fig. 4B, in which both the RNA and protein levels of LGALS3 are low in BxPC-3 cells. RNA sequencing revealed the gene distribution across distinct groups through a Venn diagram, intersecting four dimensions: (1) highly expressed genes in LGALS3-overexpressing BxPC-3 cells versus control cells; (2) the top 100 genes correlated with LGALS3 in tumor tissue; (3) the top 100 genes correlated with LGALS3 in normal tissue; and (4) a total of 167 efferocytosis-related genes (Fig. 4C). Interestingly, LGALS3 overexpression resulted in the identification of only one common gene expressed in both the tumor and normal samples: ITGB1, as shown in Fig. 1I. Additionally, only ASPH was found at the intersection of the tumor and RNA-seq groups. Importantly, EREG was not associated with the sequencing outcomes but emerged only at the intersection of the tumor group and the efferocytosis-associated genes, implying that the EREG expression is not dependent on tumor cells but is more likely to affect other tissue cells within the tumor microenvironment, and that ASPH is specific to tumor cells.
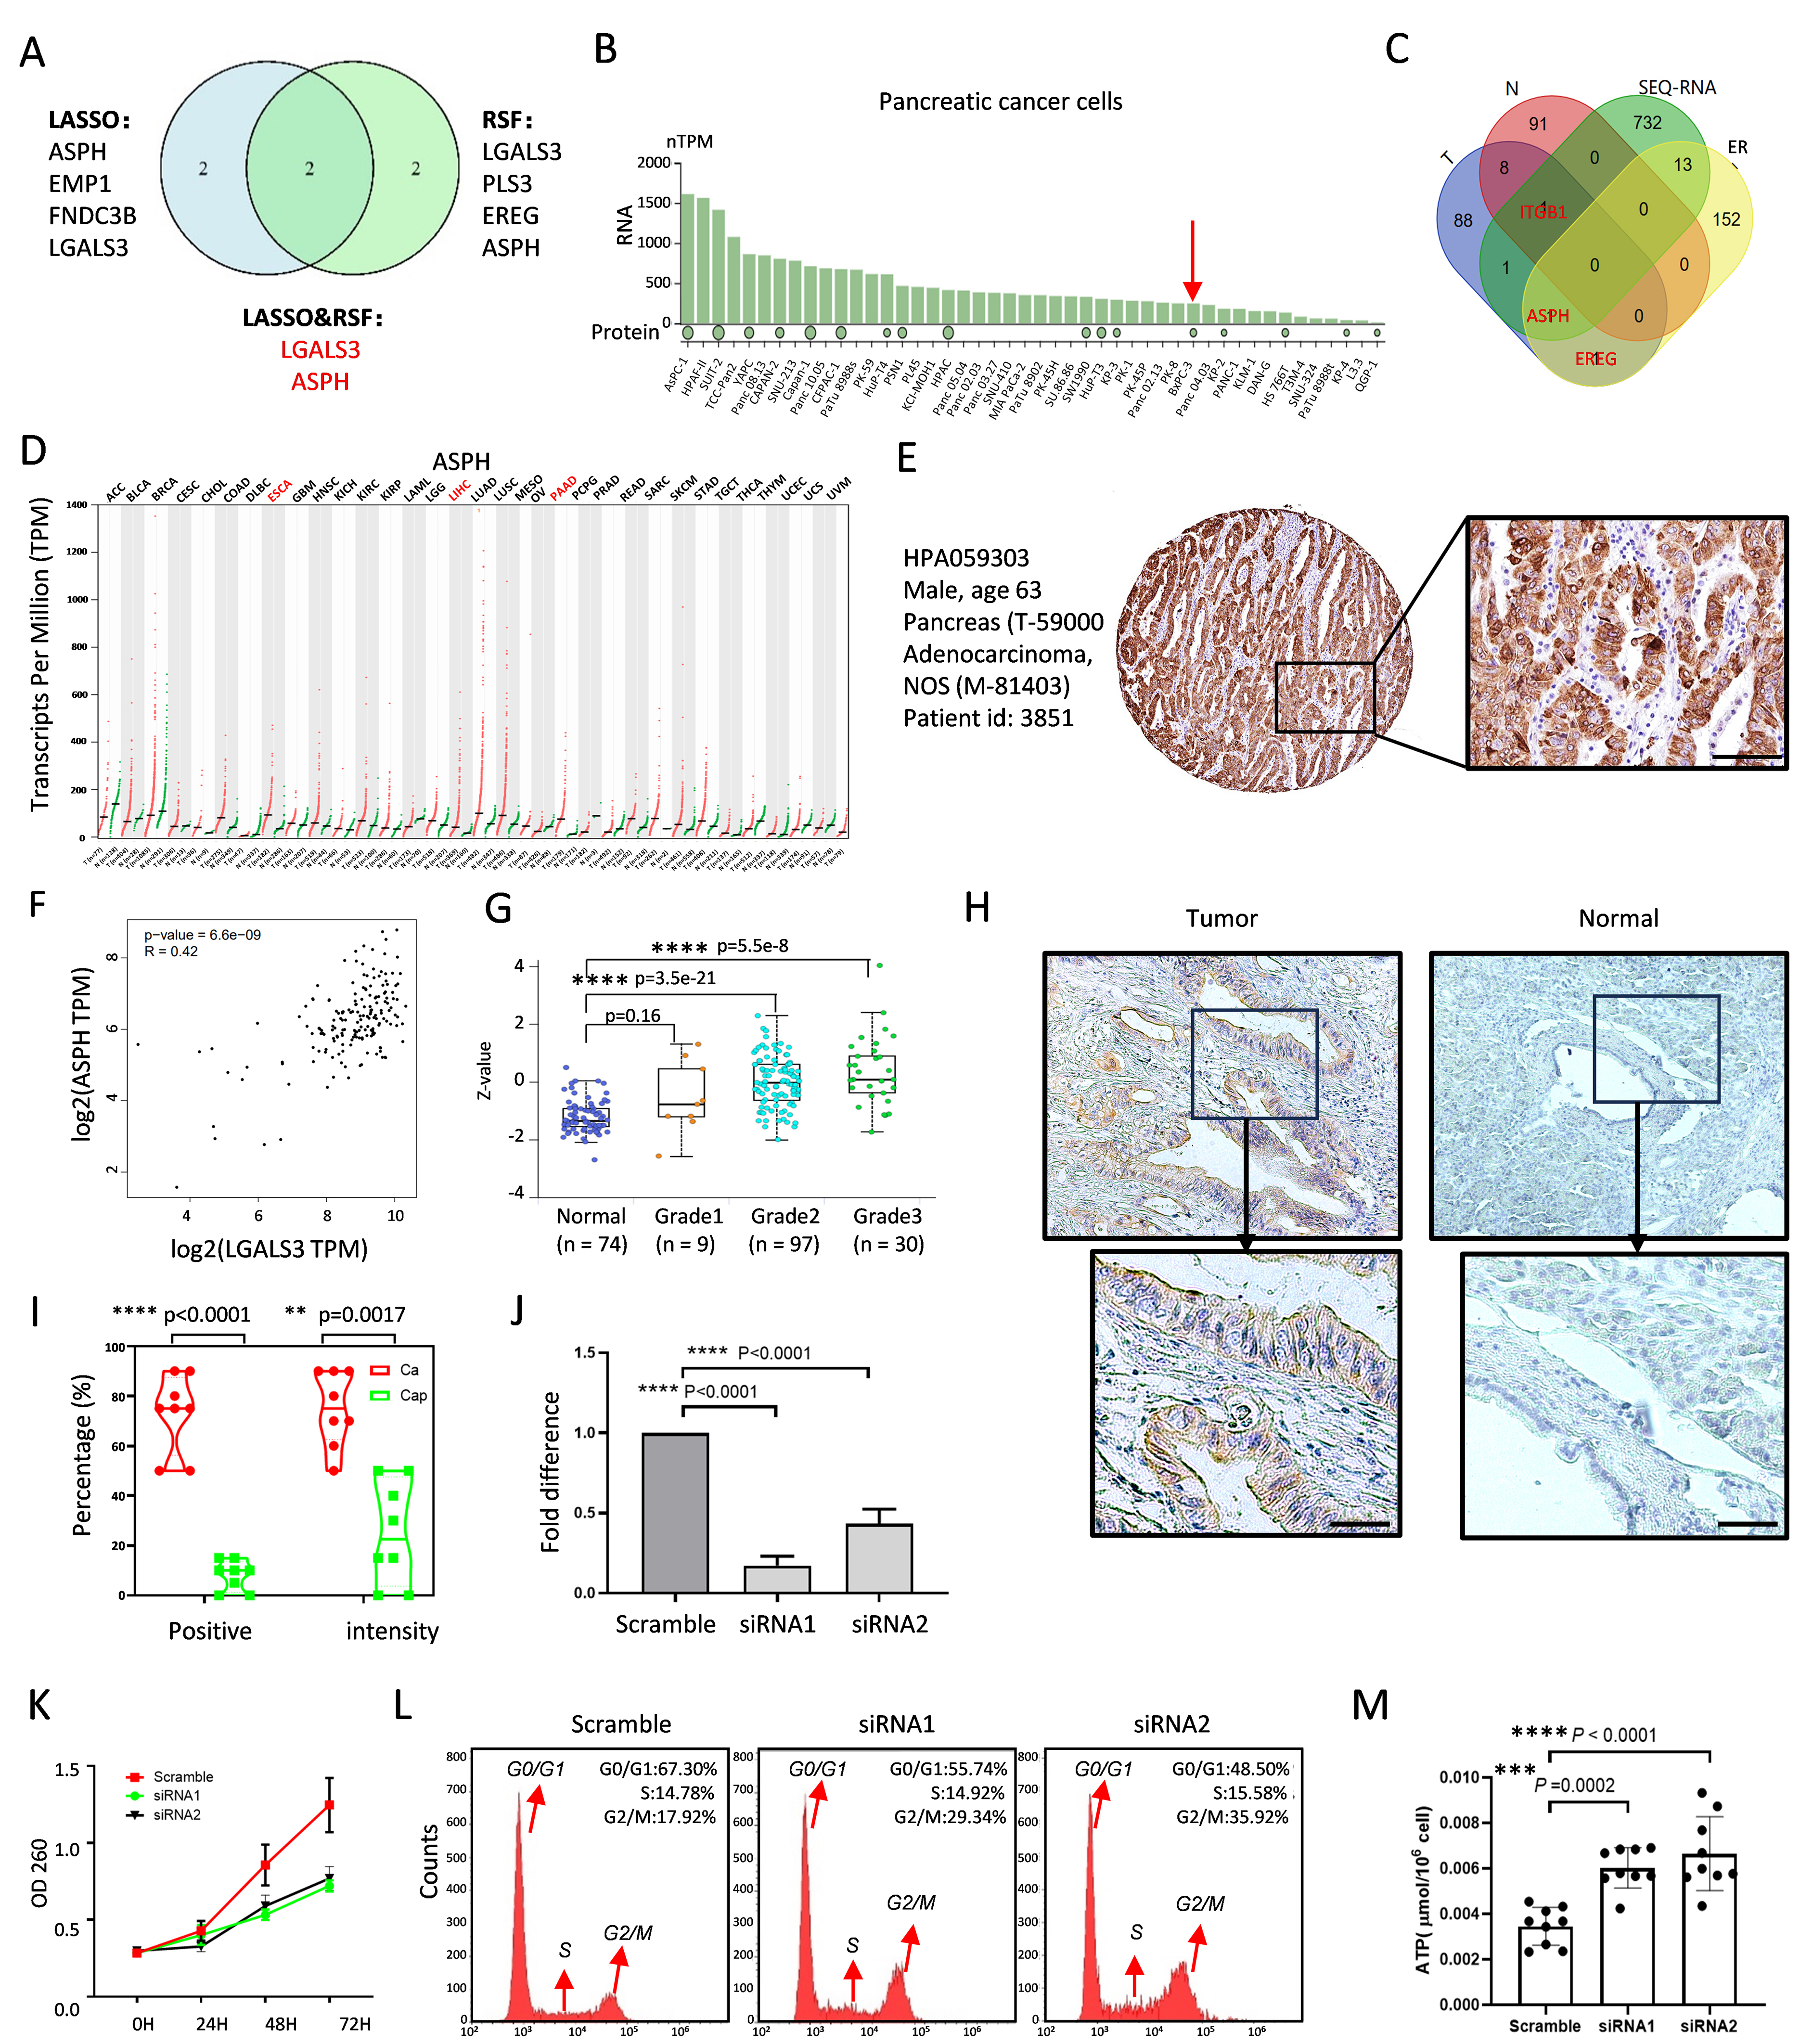 Fig. 4.
 ASPH expression promotes PDAC progression. (A) Venn diagram showing “14-gene panel” expression in tumor and normal tissues selected by the LASSO regression and random survival forest (RSF) algorithms. (B) RNA and protein levels of LGALS3 in PDAC cell lines. The red arrow pointed out the low expression of ASPH in BxPC-3. (C) Venn diagram of the top 100 genes related to LGALS3 in tumors and normal tissues; sequencing of LGALS3 genetic cells compared with vector control cells; and identification of ER genes from the Molecular Signatures Database. These genes cross four distinct groups. (D) Expression level of ASPH across cancers. (E) Pathological ASPH staining images of a male pancreatic cancer patient (HPA059303) from the Human Protein Atlas (HPA) database. Scale bar = 200 µm. (F) Positive correlation between ASPH and LGASL3. (G) Relationship between ASPH and pathological grade in the Clinical Proteomic Tumor Analysis Consortium (CPTAC) samples. (H) Specific ASPH immunoreactivity between tumor and adjacent normal tissues by IHC. Scale bar = 200 µm. (I) The positive rate and intensity of ASPH expression were calculated. (J) The proliferation rates of PDAC cells with or without ASPH knockdown. (K) The efficiency of the RNA level of ASPH. (L) Flow cytometry analysis of the proportion of G2/M phase-arresting PDAC cells treated with or without ASPH knockdown. The red arrows denote distinct phases of the cell cycle, specifically the G0/G1 phase, the S phase, and the G2/M phase. (M) The detection of ATP production using ELISA assay with three independent experiments. **, p
The RNA levels of ASPH are significantly greater in tumor tissues than in adjacent nontumor tissues across various solid tumor types, including liver, esophageal, and pancreatic cancer tumors (Fig. 4D). The Human Protein Atlas database (https://www.proteinatlas.org/) provides pathological images of ASPH from a male patient with pancreatic cancer (Fig. 4E). A correlation analysis revealed a direct relationship between the ASPH and LGALS3 expression levels in tumor tissues (Fig. 4F), as well as a significant association between the ASPH expression and pathological grade (Fig. 4G). An immunohistochemistry analysis was performed to analyze the ASPH localization and expression levels in eight paired PDAC tissues and adjacent non-neoplastic pancreatic tissues to better understand the ASPH protein expression in clinical cases (Fig. 4H). The results demonstrated specific ASPH immunoreactivity in all the adenocarcinoma samples, with both the positivity and staining intensity exceeding 50%. In contrast, the adjacent normal tissues exhibited minimal detectable staining, with positivity below 20% and an intensity less than 50% (Fig. 4I). Consequently, we established the pancreatic cancer cell line ASPC-1 with ASPH knockdown (Fig. 4J) to further validate the ASPH effect on the mitotic spindle function and G2/M checkpoint, as described in Fig. 3H. As shown in Fig. 4K, the ASPH silencing reduced the tumor cell proliferation. A flow cytometry analysis revealed an increased proportion of cells in the G2/M phase following the ASPH downregulation (Fig. 4L). Furthermore, an enzyme-linked immunosorbent assay (ELISA) was conducted to quantify the increase in the ATP production following the ASPH knockdown (Fig. 4M).
We further identified seven primary clusters with specific marker genes in each cell population via single-cell sequencing data from the GEO database (GSE: 154778) (Fig. 5A), based on the aforementioned exploration of EMT hallmarks via the bioinformatics analysis of the “14-gene panel” characteristics described in Fig. 2F. The uniform manifold approximation and projection (UMAP) and heatmap analyses demonstrated that the EMT population was distinctly separated from the other cell populations (Fig. 5A,B). The ER module scores highlight the EMT population, which is characterized by high scores for both “14-gene panel” genes and “LEAF” genes (Fig. 5C). The ASPH expression was significantly increased in the epithelial tumor cell (ETC) and EMT populations (Fig. 5D). To further validate the functional phenotype of ASPH, we conducted the Boyden chamber assays using ASPH-knockdown cell lines and found that the cell migration was markedly reduced following ASPH silencing (Fig. 5E). In addition, classical molecular EMT markers were detected on ASPH-silencing cells via RT-PCR. The ASPH knockdown reduced the Snail, Slug, and Twist RNA levels remarkably (Fig. 5F). These data indicate that the ASPH expression in tumor cells drives their migratory characteristics via the EMT phenotype.
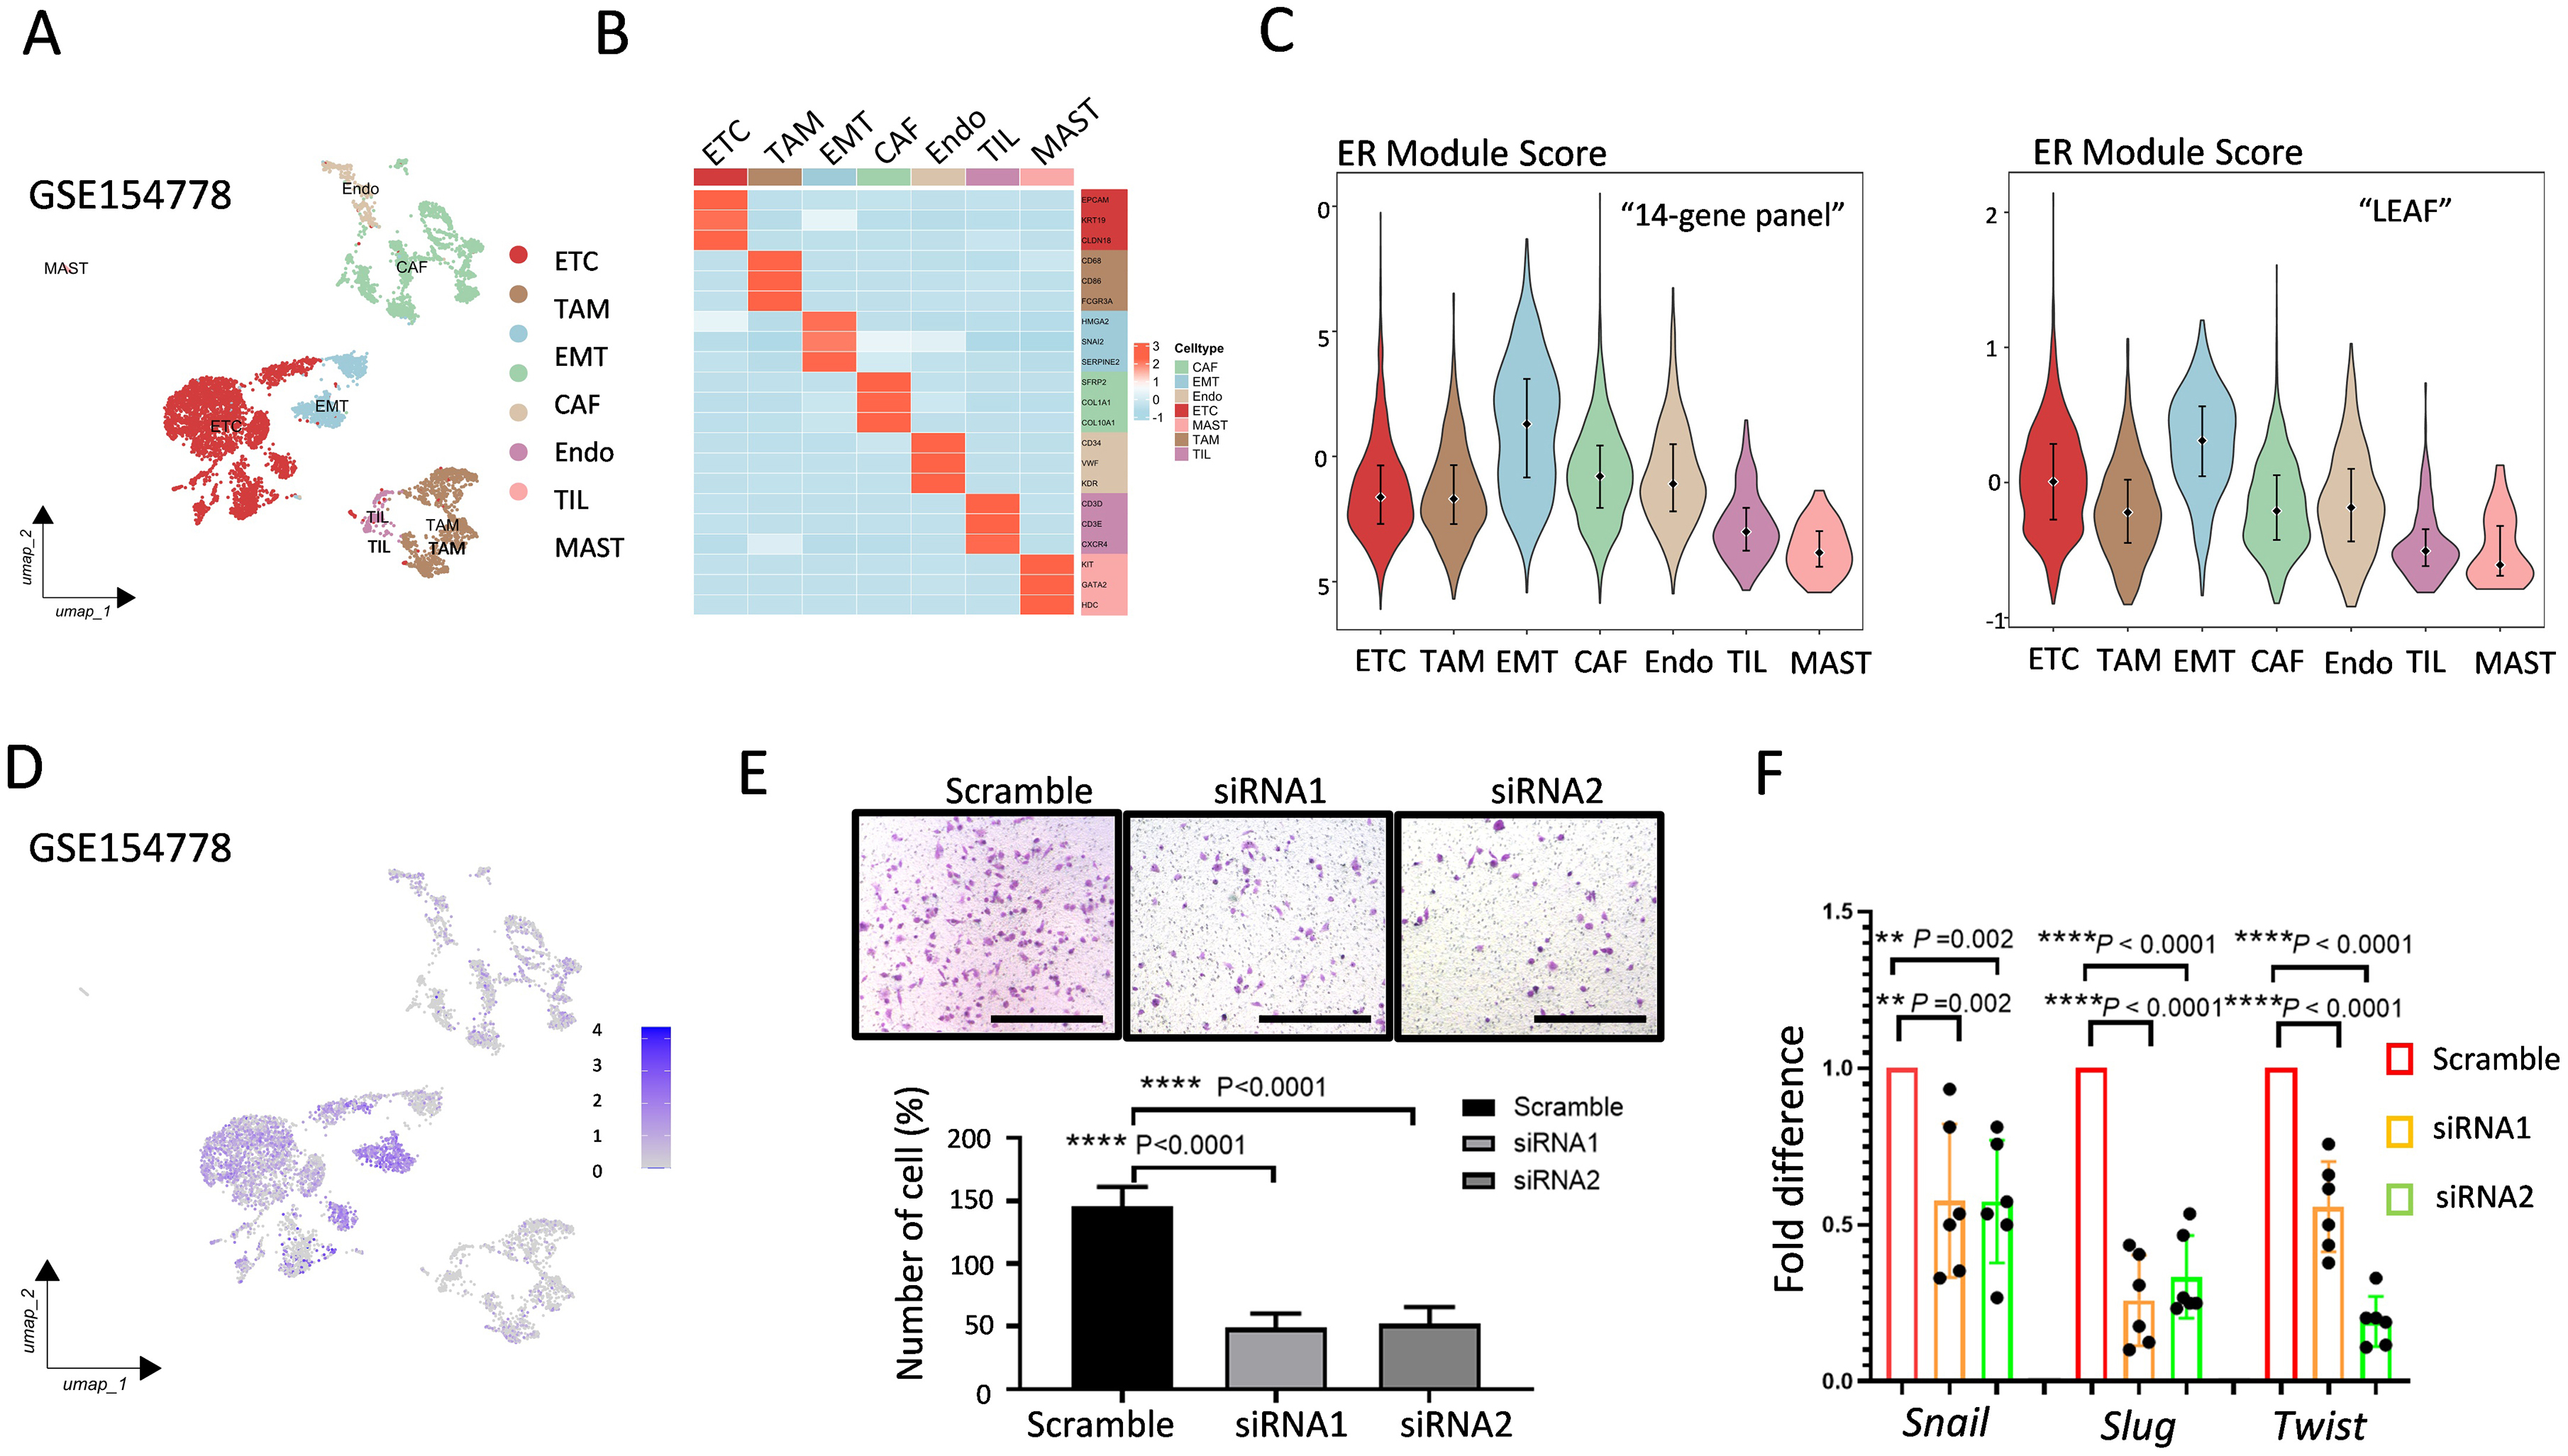 Fig. 5.
 ASPH is related to migration through EMT. (A) Seven cell clusters were identified in the PDAC samples via a UMAP plot. (B) The heatmap indicates 3 marker genes in each cell population specific to different cell types. (C) Violin plot showing the efferocytosis module score for the “14-gene panel” cell cluster and “LEAF” group. (D) Feature plots illustrating the expression of ASPH at the single-cell level. (E) Boyden chamber assay showing the effect of ASPH knockdown on cell migration. Scale bar = 200 µm. (F) The RNA levels of EMT markers with ASPH knockdown cells with three independent experiments. **, p
Since the EREG gene from “LEAP” was identified in the RSF analysis, as illustrated in the Venn diagram in Fig. 4C, we further compared the EREG expression levels between tumor tissues and their adjacent normal tissues across various solid tumors, including colorectal cancer, renal cell carcinoma, and pancreatic cancer tumors (Fig. 6A). Notably, we observed a significant increase in the EREG activity within tumor-associated macrophages (TAMs) compared with that in the other cell types in GSE154778 (Fig. 6B). We subsequently acquired single-cell RNA sequencing data from patients with PDAC from the CRA001160 database, adhering to the methodology outlined in the TISCH2 database. By leveraging marker genes characteristic of distinct cell types, we successfully classified the cells into twelve primary clusters: acinar cells; B cells; CD8+ T cells; dendritic cells (DCs); ductal cells; endocrine cells; endothelial cells; fibroblasts, malignant cells; monocytes/macrophages; plasma cells; and stellate cells. The EREG expression was significantly elevated in the monocyte/macrophage subpopulation (Fig. 6C). To elucidate the role of EREG in monocytes and macrophages, we analyzed its distribution across monocytes, M1 macrophages, and M2 macrophages. The box plot in Fig. 6D shows that the EREG expression levels were significantly higher in macrophages than those in monocytes. Additionally, as shown in Fig. 6E, the EREG expression was notably greater in M2 macrophages than that in M1 macrophages. Finally, we observed the colocalization of EREG and CD206 in pancreatic cancer tissues via multiplex immunofluorescence staining (Fig. 6F). This experimental evidence further confirms that EREG plays a role in the function of tumor-associated immune cells, particularly M2 macrophages, and facilitates a more comprehensive evaluation of the “14-gene panel” system. The workflow of this study is illustrated in Fig. 6G. This method involved the identification of 14 critical risk genes from the ER database via OS/DFS data and PCC screening, followed by deep learning analysis. The primary focus was on the role of three target genes in tumor, stromal, and immune cells within the TME: ASPH, LGALS3, and EREG.
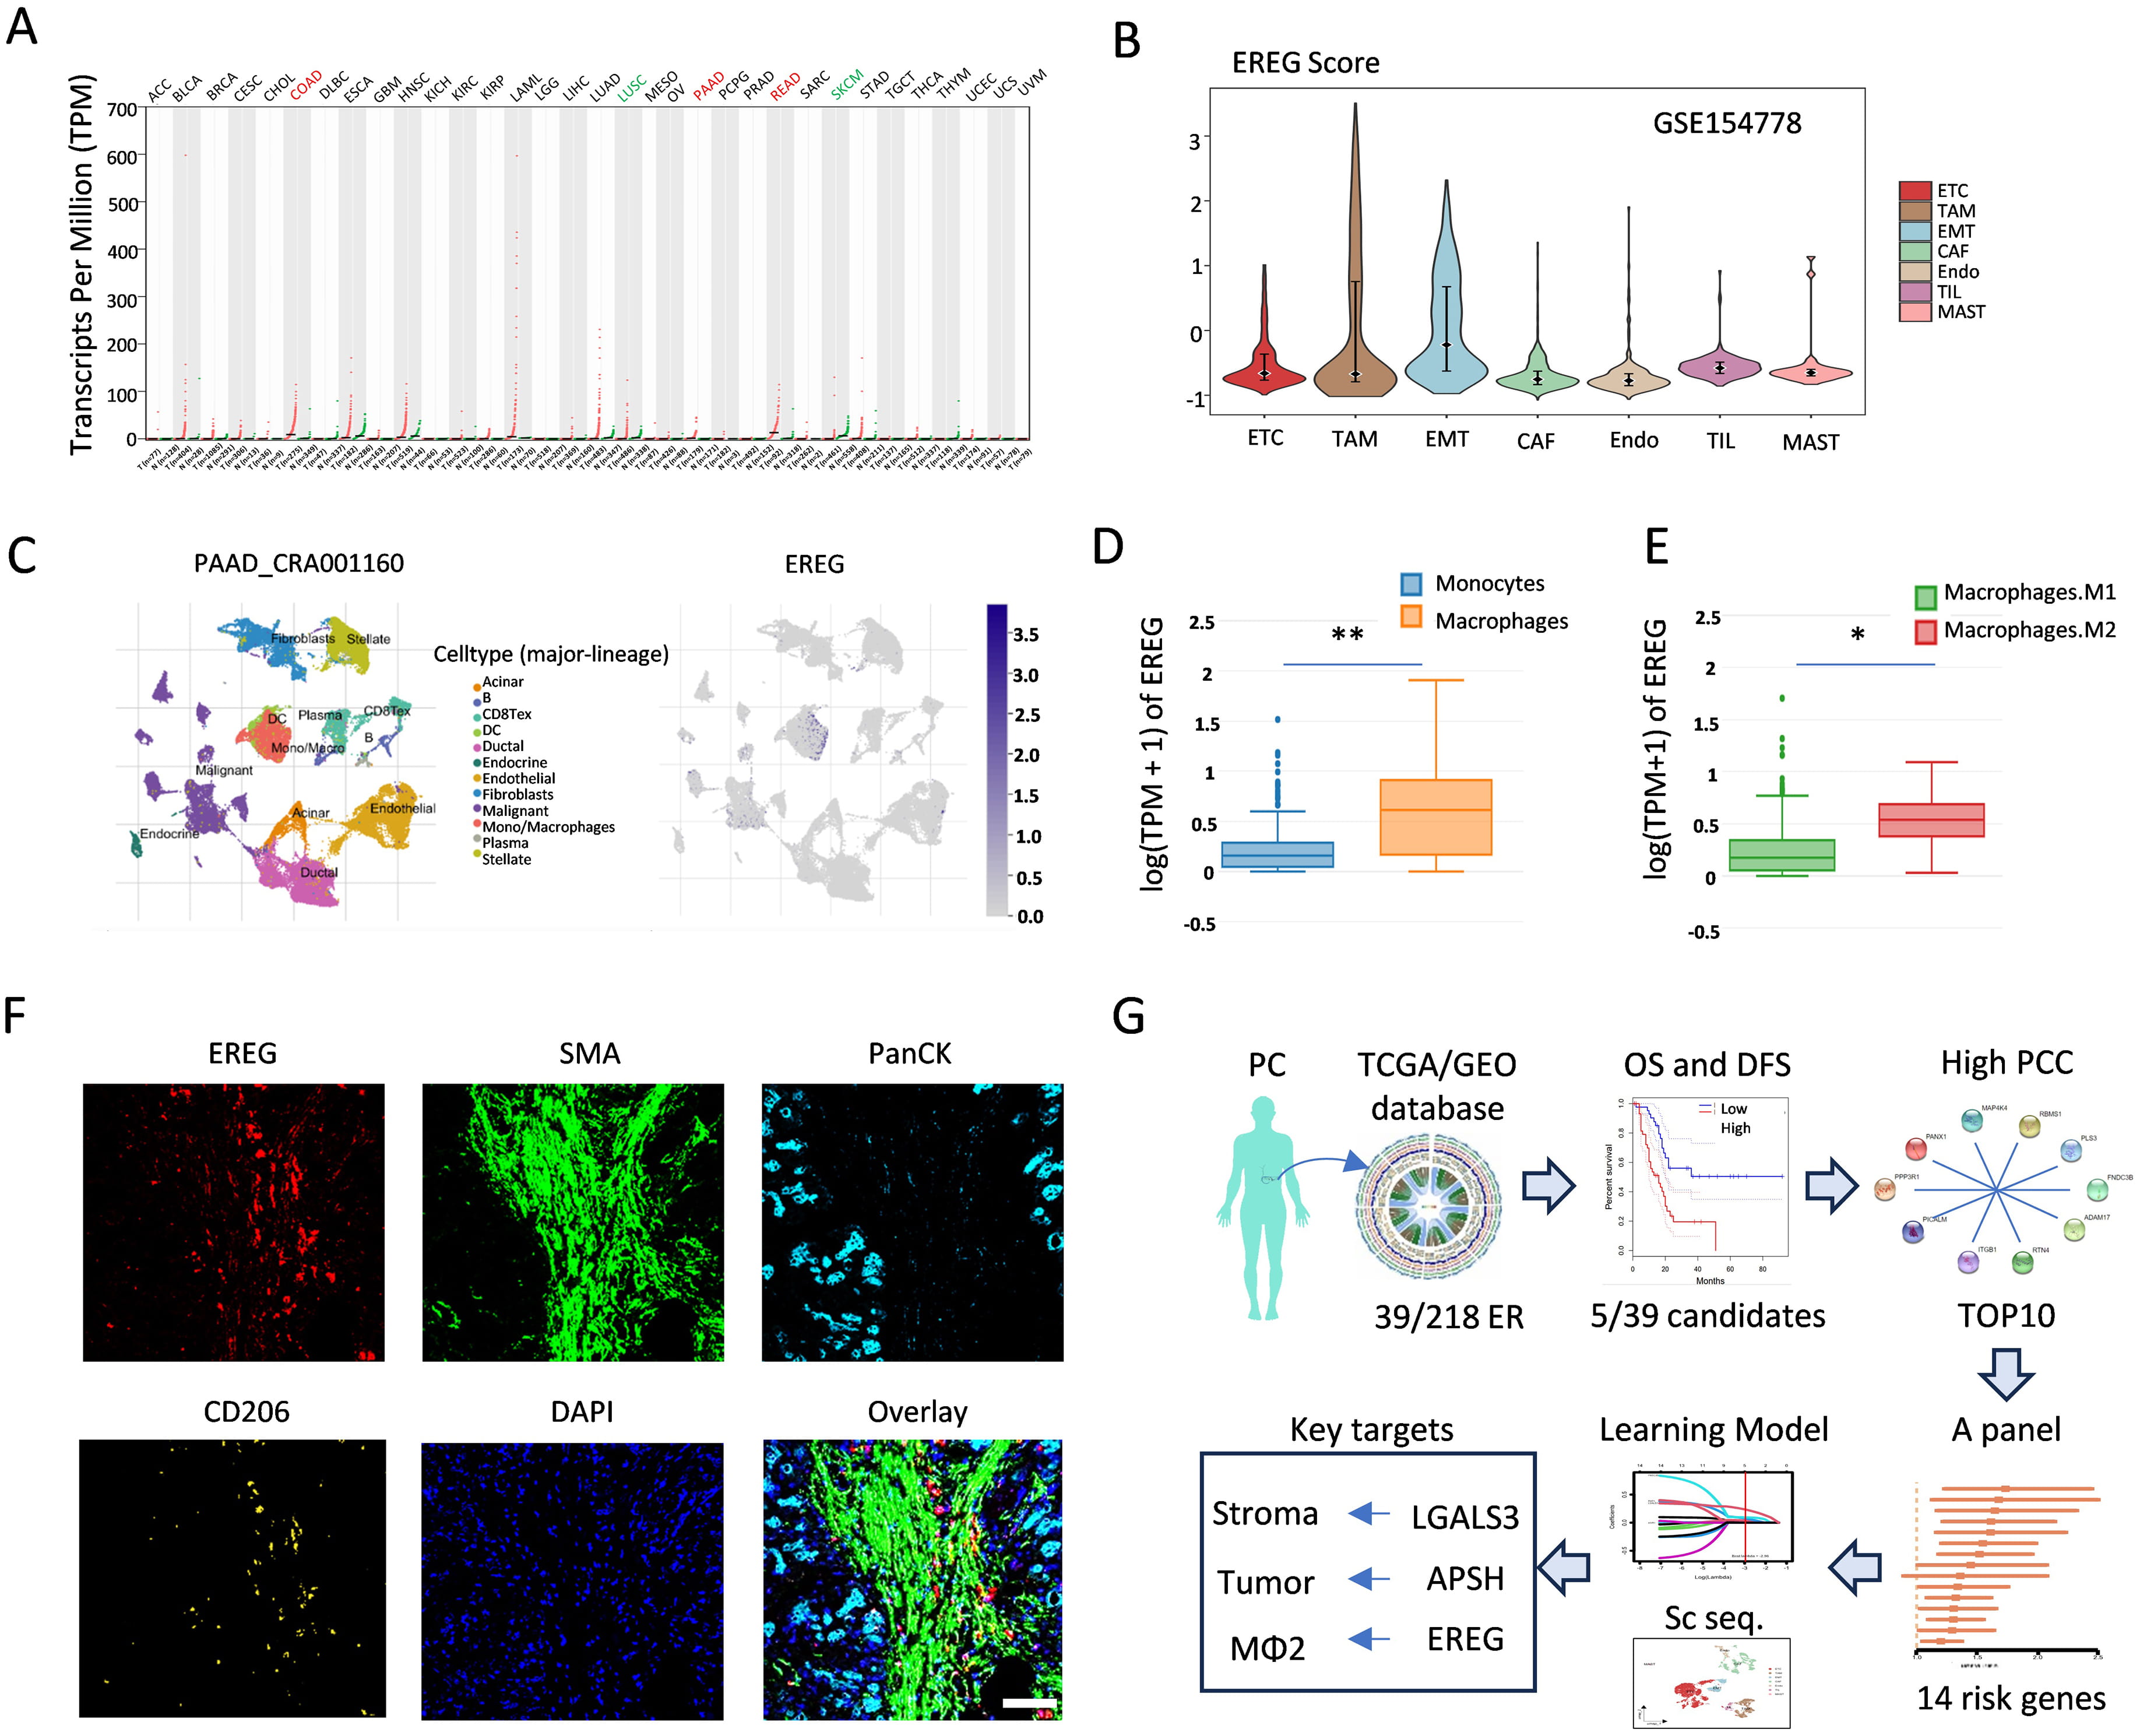 Fig. 6.
 EREG affects M2 macrophage polarization. (A) The RNA expression level of EREG across cancers. (B) Violin plot showing the EREG score for each cell type. (C) Twelve cell clusters were identified via a UMAP plot of the PDAC samples and feature plots indicating the expression of EREG at the single-cell level. (D) Box line plot of the difference in EREG expression levels between monocytes and macrophages. (E) Comparison of the EREG expression levels between M1 and M2 macrophages. (F) Multiplex immunofluorescence staining showing the colocalization of EREG and CD206 in PDAC tissues. Scale bar = 200 µm. (G) The workflow of our research. *, p
Globally, the general incidence rate of pancreatic cancer is approximately 15 per 100,000 people, with pancreatic ductal adenocarcinoma being the most common histologic subtype [6]. However, this rate has been gradually increasing over time. Because the symptoms of pancreatic cancer are often nonspecific and subtle, it frequently escapes detection, resulting in the majority of patients being diagnosed at advanced stages when nonsurgical treatments (e.g., FU, oxaliplatin, leucovorin, irinotecan (FOLFIRINOX), and gemcitabine with nab-paclitaxel) are the only available options [2]. Although novel chemotherapeutic agents targeting drugs and immunosuppressants have been developed, such as “MRTX1133” for harboring KRASG12D mutations, “HBI-2376” for advanced solid tumors with KRASG12D mutations, “olaparib” for BRCA1, BRCA2, or PALB2 mutations, and “maintenance SBRT + ipilimumab + nivolumab” [17, 18]. PDAC remains the leading cause of life-threatening health problems in patients with cancer. Therefore, the identification of biomarkers associated with novel insights into PDAC risk assessment is critically important.
Efferocytosis, a novel multistep cellular process, is a crucial mechanism through which phagocytes, including macrophages, DCs, monocytes, and epithelial cells, clear and recycle severely damaged or apoptotic cells [19]. A previous study demonstrated that the features of efferocytosis in lung cancer can accurately predict the clinical prognosis and treatment response [20]. Moreover, the efferocytosis-mediated clearance of parenchymal dead cells promotes macrophage reprogramming and liver metastasis in patients with PDAC [21]. A recent report revealed that the blockade of PI3K
Initially, in this study, 29 genes associated with a total of 218 efferocytosis-related genes were screened based on OS and DFS. Among these genes, only seven genes were significantly correlated with both survival metrics: DUSP4, ASPH, MMP-14, EMP1, EREG, JUND, and EPB41L3. Notably, while JUND and EPB41L3 were associated with favorable survival outcomes, the other five genes (DUSP4, ASPH, MMP-14, EMP1, and EREG) were associated with poorer survival outcomes, as indicated by their higher expression levels in tumor tissues. Next, the top 10 correlated genes associated with these five candidate genes were identified via Pearson’s correlation coefficient analysis. Notably, while PPP3R1 was correlated with normal tissues and RTN4 was not significantly associated with a poor prognosis risk, the remaining eight-gene panel was strongly associated with high Gal-3 expression in tumor tissues. Ultimately, a 14-gene panel comprising LGALS3, MAP4K4, PANX1, PLS3, FNDC3B, PBMS1, ITGB1, ADAM17, PICALM, DUSP4, ASPH, MMP14, EMP1, and EREG was identified as an efferocytosis-associated evaluation model.
We obtained a set of four genes (“LEAF”) by intersecting the genes identified through the LASSO algorithm. Additionally, we identified another distinct set of four genes (“LEAP”) via random survival forest (RSF) analysis, adopting the same naming convention as that used for the LEAF. Notably, by performing a Venn diagram analysis on these two gene sets, we identified two significant overlapping genes: LGALS3 and ASPH. LGALS3 has previously been reported to improve the ability of macrophages to ingest efferocytosis [23]. Elevating the LGALS3 levels might be a way to rescue efferocytosis in some diseases [24]. LGALS3 and efferocytosis are well established, yet they remain underreported in the literature. Our previous research demonstrated a significant association between LGALS3 expression and poor prognoses in patients with pancreatic cancer metastasis through IL-8 secretion and integrin
One of the key consequences of efferocytosis in the tumor microenvironment is the creation of an immunosuppressive milieu [10]. By clearing apoptotic cells, efferocytosis reduces the presentation of antigens to the immune system, thereby facilitating tumor immune escape [32]. The major reaction of immune cells involved in efferocytosis is mediated primarily by macrophages, a fact that has been consistently emphasized in numerous scientific reports. Macrophages exhibit remarkable plasticity and can adapt their functions based on the expression of key genes and inflammatory responses. In this study, single-cell sequencing analysis revealed that ASPH is expressed predominantly in epithelial cells. In addition, EREG enrichment was observed in monocytic and macrophage subpopulations. EREG was identified through the cross-screening of Gal-3-associated genes from tumors and efferocytosis-related genes. However, it was not detected in our RNA-sequencing data from BxPC-3/Gal-3 OE cells, suggesting that EREG may have a limited association with tumor cells themselves but is likely related to other cell types within the TME. For example, a recent study showed that EREG, released by TAMs, may increase the resistance of cancer cells to treatment in the TME [33]. Soluble EREG is produced by senescent stromal cells, which non-cell-autonomously develop the senescence-associated secretory phenotype (SASP) upon DNA damage, and its expression pattern resembles that of other SASP factors, such as CXCL8, Colony Stimulating Factor 2 (CSF2), Wnt Family Member 16B (WNT16B), IL6, and MMP3 [34]. We subsequently identified EREG as a marker prominently associated with macrophage subpopulations enriched in M2 polarization, as determined by single-cell sequencing and multiplex immunohistochemistry analyses.
Although we did not conduct experimental investigations on the multiple gene markers, EMP1, FNDC3B, and PLS3, identified through LASSO and RSF in this study, we do not believe that the expressions of these genes are insignificant in predicting pancreatic cancer. For example, it has been reported in the literature that EMP1 plays a crucial role in predicting tumor metastasis via the assessment of its expression ratios in different macrophage subpopulations [35]. Moreover, FNDC3B, a member of the fibronectin type III domain-containing protein family, is a prognostic biomarker and plays a pivotal role in driving the progression of pancreatic cancer [36], and PLS3, an actin-binding protein, is a diagnostic and prognostic marker for PDAC [37]. These studies and evidence have verified that the genes we selected play a significant role in determining the prognosis of patients with PDAC [35, 36, 37].
In summary, efferocytosis, is a sophisticated cellular clearance mechanism across multiple hallmarks of cancer. The mechanistic dissection of efferocytosis-related signaling cascades and their crosstalk with oncogenic pathways presents an urgent research frontier. In this study, we not only revisited previously identified efferocytosis-associated genes but also examined the genes networks linking stromal and immune cells to predict the PDAC progression. As primary targets, LGALS3 and ASPH are pivotal; secondary targets include EMP1, FNDC3B, PLS3, and EGER. By integrating these target genes into a comprehensive panel (“14-gene panel”) and precisely modulating their molecular networks, we aim to revolutionize therapeutic paradigms, potentially yielding dual benefits in tumor microenvironment reprogramming and metastasis suppression.
This study re-examined efferocytosis-related genes and explored network genes for the prediction of PDAC progression. The integration of key targets into a panel, comprising the “14-gene panel” genes, was performed with the aim of transforming therapies to benefit tumor microenvironment reprogramming and metastasis suppression.
ER, Efferocytosis; PDAC, pancreatic ductal adenocarcinoma; TME, tumor microenvironment; EMT, epithelial–mesenchymal transition; LASSO, least absolute shrinkage and selection operator; RSF, random survival forest; TCGA, cancer genome atlas; CNVs, copy number variations; GTEx, genotype-tissue expression; GEO, gene expression omnibus; TISCH2, tumor immune single-cell Hub 2; OS, overall survival; DFS, disease-free survival; ERGs, efferocytosis-related genes; KEGG, Kyoto Encyclopedia of Genes and Genomes; GSEA, gene set enrichment analysis; GSVA, gene set variation analysis; ERGRS, ER risk scoring system; STR, short tandem repeat; MSigDB, Molecular Signatures Database; DEGs, differentially expressed genes; PCC, Pearson correlation coefficient; DUSP4, Dual Specificity Phosphatase 4; ASPH, Aspartate Beta-Hydroxylase; MMP14, Matrix Metallopeptidase 14; EMP1, Epithelial Membrane Protein 1; EREG, Epiregulin; MAP4K4, Mitogen-Activated Protein Kinase 4; PANX1, Pannexin 1; PLS3, Plastin 3; FNDC3B, Fibronectin Type III Domain-Containing Protein 3B; RBMS1, RNA-Binding Motif Single-Stranded Interacting Protein 1; ITGB1, Integrin Subunit Beta 1; ADAM17, ADAM Metallopeptidase Domain 17; PICALM, Phosphatidylinositol Binding Clathrin Assembly Protein; LGALS3, Galectin-3; JUND, JunD Proto-Oncogene, AP-1 Transcription Factor Subunit; EPB41L3, Erythrocyte Membrane Protein Band 4.1 Like 3; RTN4, Reticulon 4; PPP3R1, Protein Phosphatase 3 Regulatory Subunit B, Alpha; PTN, Pleiotrophin; YAP1, Yes1 Associated Transcriptional Regulator; ITGAV, Integrin Subunit Alpha V; MMP7, Matrix Metallopeptidase 7; CST6, Cystatin E/M; COL11A1, Collagen Type XI Alpha 1 Chain; SNAI1, Snail Family Transcriptional Repressor 1; SNAI2; Snail Family Transcriptional Repressor 2 (Slug); TWIST1, Twist Family BHLH Transcription Factor 1; CXCL12, C-X-C Motif Chemokine Ligand 12,; XCR4, C-X-C Motif Chemokine Receptor 4; CXCL13, C-X-C Motif Chemokine Ligand 13; CXCR5, C-X-C Motif Chemokine Receptor 5; MERTK, MER Proto-Oncogene, Tyrosine Kinase; IL6, Interleukin 6; IL8, Interleukin 8; WNT16B, Wnt Family Member 16B; CSF2, Colony Stimulating Factor 2; MMP3, Matrix Metallopeptidase 3; EGFR, Epidermal Growth Factor Receptor.
The datasets used and analyzed during the current study are available from the corresponding authors on reasonable request.
Conceptualization, HM and WZ; Data curation, YW and HM; Analysis data, YW, CY, JL, LZ and WZ; Funding acquisition, CY, JL and WZ; Investigation, DY and ZT; Methodology, LZ, ZT and BD; Project administration, HM and WZ; Resources, CY; Software, LZ and DY; Supervision, HM and WZ; Writing–original draft, YW, LZ, and JL; Writing–review & editing, YW, HM and WZ. All authors contributed to editorial changes in the manuscript. All authors read and approved the final manuscript. All authors have participated sufficiently in the work and agreed to be accountable for all aspects of the work.
The acquisition and use of patient tissues were permitted on the basis of the acquisition of informed consent according to the protocol approved by the Ethics Committee of the Beijing Chaoyang Hospital of Capital Medical University (approval No. 2018-K-99), with informed consent obtained from all participants. This experiment followed the Declaration of Helsinki.
Not applicable.
This study was funded by the Noncommunicable Chronic Diseases-National Science and Technology Major Project (2024ZD0520200), the National Natural Science Foundation of China (81802353), the Foundation of China Association for Promotion of Health Science and Technology (No. JKHY2024003) and the Science Foundation of Peking University Cancer Hospital (No. A003004).
The authors declare no conflict of interest.
Supplementary material associated with this article can be found, in the online version, at https://doi.org/10.31083/FBL40818.
References
Publisher’s Note: IMR Press stays neutral with regard to jurisdictional claims in published maps and institutional affiliations.